PRESENTATION TO ANALYSTS - Tenaga Nasional · •The Sukuk transaction marks the return of TNB to...
25
Prepared by: Investor Relations & Management Reporting Department [email protected] GROUP FINANCE DIVISION PRESENTATION TO ANALYSTS Unaudited Consolidated Results for the 1 st Quarter FY2017 ended 30 th November 2016 24 th January 2017
Transcript of PRESENTATION TO ANALYSTS - Tenaga Nasional · •The Sukuk transaction marks the return of TNB to...

Prepared by:
Investor Relations & Management Reporting [email protected]
GROUP FINANCE DIVISION
PRESENTATION TO ANALYSTS
Unaudited Consolidated Results for the
1st Quarter FY2017 ended 30th November 2016
24th January 2017

AGENDA
QUESTION & ANSWER
RESULTS HIGHLIGHTS
RESULTS DETAILS
2
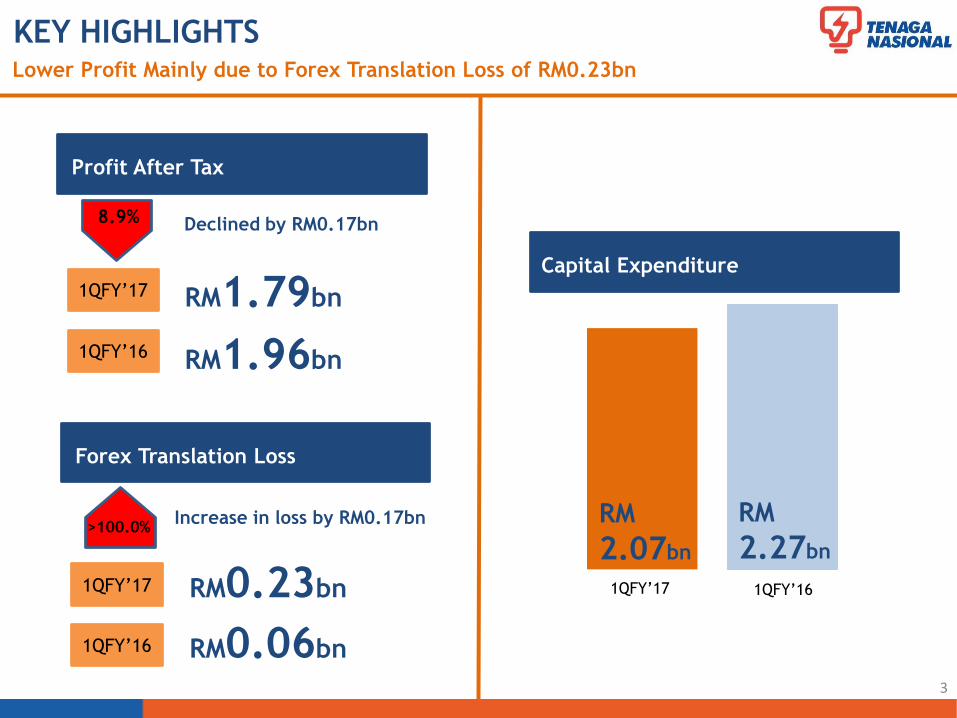
RM0.23bn
RM1.79bn
RM0.06bn
Declined by RM0.17bn
RM1.96bn
Profit After Tax
RM
2.27bn
Lower Profit Mainly due to Forex Translation Loss of RM0.23bn
KEY HIGHLIGHTS
1QFY’17
1QFY’16
8.9%
Forex Translation Loss
1QFY’17
1QFY’16
1QFY’17
Capital Expenditure
RM
2.07bn
1QFY’16
Increase in loss by RM0.17bn>100.0%
3

3.4% Increase in Adjusted PAT Contributed by 3.6% Demand Growth
(RM mn) 1QFY'17 1QFY'16
Profit After Tax 1,788.5 1,962.2
Forex Translation (Gain) / Loss 231.2 58.5
Reinvestment Allowance (331.5) (388.0)
Adjusted Profit After Tax 1,688.2 1,632.7
3.4%
GROUP PROFIT ANALYSIS
4
5.3%
RM10.68bn
RM11.24bn
Revenue
1QFY’17
1QFY’16
Revenue improved by RM0.56bn
1QFY'17 1QFY'16
Growth (%) 3.6 3.2
From
From
Table 1:
Table 2:
Table 3:

For FY2013 to FY2017
11,500
12,000
12,500
13,000
13,500
14,000
14,500
15,000
15,500
16,000
16,500
17,000
17,500
18,000
1 2 3 4 5 6 7 8 9 10 11 12 13 14 15 16 17 18 19 20 21 22 23 24 25 26 27 28 29 30 31 32 33 34 35 36 37 38 39 40 41 42 43 44 45 46 47 48
Oct Nov Dec Jan Feb Mar Apr May Jun Jul Aug
WEEK NO.
Sept
1st Qtr 2nd Qtr 3rd Qtr 4th QtrMW
YoY Growth (%)
FY 2013 16,562 MW 13/5/2013 4.7
FY 2014 16,901 MW 11/6/2014 2.0
FY 2015 - -
FY 2016 17,788 MW 20/4/2016 5.2
FY 2017
Peak Demand
-
5
Peak Demand:
17,788 MW
(20/04/16)
MIER
2017 (f)4.5%
SYSTEM WEEKLY MAXIMUM DEMAND (PENINSULA)

46.5 45.9 44.4 44.1 42.1
49.3 49.6 52.0 52.2 54.4
0.1 0.4 0.6 0.6 0.54.1 4.1 3.0 3.1 3.0
1QFY'16
2QFY'16
3QFY'16
4QFY'16
1QFY'17
Gas Coal Oil & Distillate Hydro
%
GENERATION MIX (PENINSULA)Quarterly Analysis
Increase in Coal Generation with Commissioning of Tg Bin Energy in March 2016
6

46.4 29.9 16.4 14.0 170.9
278.2 289.4 281.7 246.7
308.3
578.3 479.3 516.9
501.1
546.8
136.8
92.8 101.7 158.2
101.2
539.0
559.9
1,596.6
1,348.6 938.9
-
200.0
400.0
600.0
800.0
1,000.0
1,200.0
1,400.0
1,600.0
1,800.0
2,000.0
2,200.0
2,400.0
2,600.0
1QFY'13 1QFY'14 1QFY'15 1QFY'16 1QFY'17
CAPITAL EXPENDITUREMajor Projects Represent 45.4% of Total CAPEX
1,578.7 1,451.3 2,513.3 2,268.6 2,066.1
Recurring Generation, Transmission, Distribution, Others Generation Capacity
RM mn
7
RM1,127.2mn
54.6%
45.4%
G
T
D
O
G
T
D
O
G
T
D
O
G
T
D
O
G
T
D
O
8
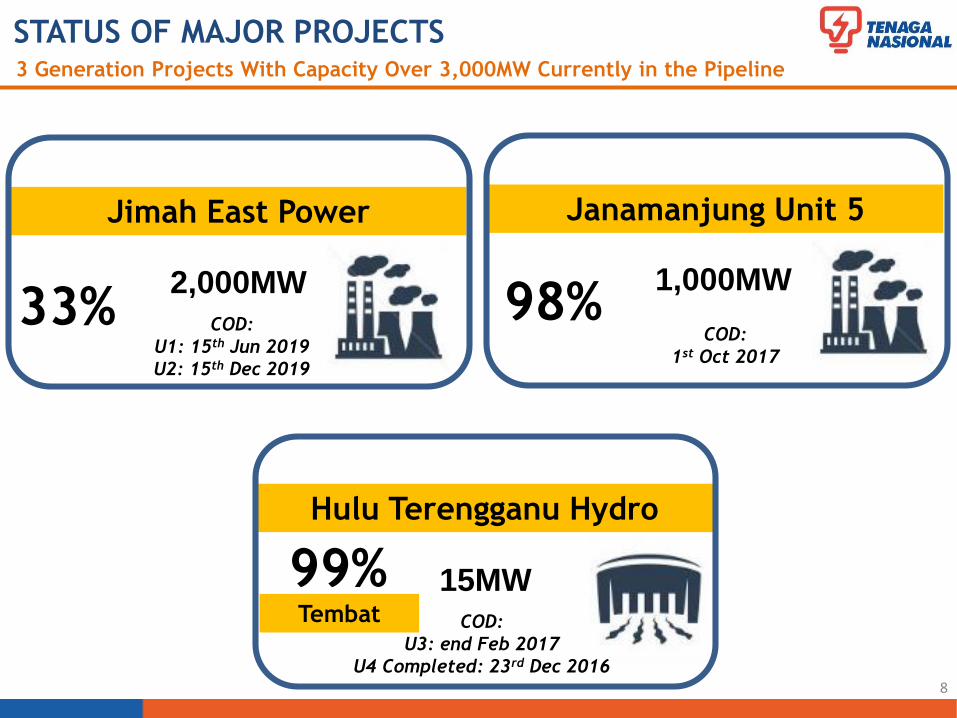
STATUS OF MAJOR PROJECTS3 Generation Projects With Capacity Over 3,000MW Currently in the Pipeline
15MW
Hulu Terengganu Hydro
Tembat
99%COD:
U3: end Feb 2017
U4 Completed: 23rd Dec 2016
1,000MW
COD:
1st Oct 2017
Janamanjung Unit 5
98%2,000MW
COD:
U1: 15th Jun 2019
U2: 15th Dec 2019
Jimah East Power
33%

• Return on Assets (ROA) (%)
KEY PERFORMANCE INDICATORS
INITIATIVES 1QFY’17 FY’16
7.0
34.1
0.5
10.4
88.7
9
0.00
6.4
34.2
2.7
49.7
89.3
1.47
• Company CPU (sen/kwh)
• Revenue from Non-Regulated
Business (RM bn)
• Equivalent Plant Availability
Factor (EAF) (%)
• Transmission System Minutes (mins)
• Distribution SAIDI (mins)

201
4
SIGNIFICANT EVENTS
5,000MW NEW
GENERATION
CAPACITY
INTERNATIONALLY
BY 2020 250MW INCREASE IN
TNB RENEWABLE
ENERGY (RE)
PORTFOLIO BY 2020
3
1
First Issuance of
International Sukuk
Amounting to USD0.75bn
2
30% Significant Minority
Stake in GMR Energy
Limited
10
GREATER ACCESS
TO INTERNATIONAL
DEBT CAPITAL
MARKET THROUGH
MULTICURRENCY
SUKUK ISSUANCE
50% Equity Interest in
Vortex Solar
Investments S.a.r.l

• The Sukuk transaction marks the return of TNB to the international debt
capital markets after more than 10 years.
• Highlights:
Largest corporate 10-year sukuk issuance from Asia
Largest corporate sukuk in 2016
Largest ever 10-year USD corporate sukuk from a Malaysian corporate
Lowest ever 10-year coupon achieved by a Malaysian corporate
First sukuk in Asia to use Rights of Service as the underlying asset for
the structure
USD2.50 bn in nominal value
First Issuance – 19 October 2016Multicurrency Sukuk Program
USD0.75 bn in nominal value
11
First Issuance of International Sukuk Amounting to USD0.75bn
ACCESS TO INTERNATIONAL DEBT CAPITAL MARKET

30% Significant Minority Stake in GMR Energy Limited
GMR Energy Limited
Large & growing
market
Strong
government with
favorable policy
framework
100% FDI
allowed in
generation,
transmission
&
distribution
Regulatory reforms
Strategic
partnership
that creates
synergies
• On 4 November 2016, TNB had completed
the acquisition of 30% equity interest of
GMR Energy Limited via a bilateral
transaction.
• Total cash consideration : USD300.0 mn.
• GMR Energy Limited assets includes
2,298MW coal, gas and solar plants.
12
INTERNATIONAL ACQUISITION

Vortex Solar
50% Equity Interest in Vortex Solar Investments S.a.r.l.
13
INTERNATIONAL ACQUISITION
Improve TNB RE
Portfolio
Diversify TNB
current
international
portfolio
Low risk,
stable return
assets in
advanced
energy
market
Stable economic
and regulatory
framework
Strategic
partnership
that creates
synergies
• On 6 January 2017, TNB via wholly owned
subsidiary had entered into a Subscription
and Funding Agreement with Beaufort
Investments S.a.r.l., a wholly owned
subsidiary of EFG Hermes Holding to
subscribe for 50.0% new equity shares in
Vortex Solar Investments S.a.r.l.
• The transaction is expected to be completed
by the third quarter of 2017.
• Total cash consideration : GBP86.0 mn.
• Vortex Solar assets includes 24 operational
solar PV Farm across England and Wales with
net installed capacity of about 365MW.
AGENDA
QUESTION & ANSWER
RESULTS HIGHLIGHTS
RESULTS DETAILS
14

33.7
35.0
33.033.6 33.2
33.4
31.4 31.7
31.8
YTD 1Q YTD 2Q YTD 3Q YTD 4Q
RM mn 1QFY'17 1QFY'16
Total Units Sold (GWh) 29,548.4 28,518.4
Revenue 11,241.6 10,676.8
Operating Expenses (before
depreciation) 7,632.3 7,078.0
Operating Income 184.1 139.3
EBITDA 3,793.4 3,738.1
EBITDA Margin (%) 33.7% 35.0%
Depreciation and Amortisation 1,453.8 1,340.4
EBIT 2,339.6 2,397.7
EBIT Margin (%) 20.8% 22.5%
Finance Cost 278.3 259.7
Profit Before Tax & Forex
Translation 2,226.4 2,221.8
Net Profit Before Forex Translation 1,971.7 2,034.5
Translation (Loss) (231.2) (58.5)
Net Profit attributable to :
Equity Holders 1,740.5 1,976.0
Non-controlling Interest 48.0 (13.8)
Reduction in EBITDA Margin Mainly from Provision for Electricity Debtors
RESULTS DETAILS
15
ANALYSIS OF EBITDA MARGIN (%)
EBITDA Margin FY2017
EBITDA Margin FY2016
EBITDA Margin FY2015 with ICPT adjustment

Growth
UNITS SOLD GWh GWh %
- TNB 27,811.3 26,846.2 3.6
- EGAT (Export) 22.6 1.1 >100.0
- SESB 1,302.5 1,254.5 3.8
- LPL 412.0 416.6 (1.1)
Total Units Sold (GWh) 29,548.4 28,518.4 3.6
REVENUE RM mn Sen/KWh RM mn Sen/KWh
Sales of Electricity
- TNB 10,952.7 39.4 10,583.0 39.4 3.5
- EGAT (Export) 13.5 59.7 1.0 90.9 >100.0
- SESB 448.4 34.4 433.6 34.6 3.4
- LPL 103.9 25.2 161.7 38.8 (35.7)
Sales of Electricity 11,518.5 39.0 11,179.3 39.2 3.0
LPL Operating Lease (MFRS117) 10.8 11.0 (1.8)
Accrued Revenue 73.3 (176.5) >(100.0)
Imbalance Cost Pass-Through (604.8) (681.8) (11.3)
Total Sales of Electricity 10,997.8 10,332.0 6.4
Goods & Services 152.6 261.0 (41.5)
Deferred Income 91.2 83.8 8.8
Total Revenue 11,241.6 10,676.8 5.3
1QFY'17 1QFY'16
16
DETAILS OF REVENUE 5.3% Increase in Total Revenue Mainly From 3.6% Demand Growth in Peninsula

OPERATING EXPENSES
17
Variance Variance
RM mn %
Capacity Payment 1,114.8 975.9 (138.9) (14.2)
Energy Payment 2,165.5 2,015.5 (150.0) (7.4)
Total IPPs Purchases/Costs 3,280.3 2,991.4 (288.9) (9.7)
Fuel Costs 2,219.6 2,211.9 (7.7) (0.3)
Repair & Maintenance 455.4 376.1 (79.3) (21.1)
Staff Costs 928.1 960.3 32.2 3.4
TNB General Expenses 612.2 313.9 (298.3) (95.0)
Subs. Cost of Sales & Opex 136.7 224.4 87.7 39.1
Depreciation & Amortisation 1,453.8 1,340.4 (113.4) (8.5)
Total Operating Expenses 9,086.1 8,418.4 (667.7) (7.9)
RM mn 1QFY'17 1QFY'16
296.65,499.9 5,203.3
7.9% Increase in Operating Expenses

Sept Oct Nov 1QFY'17 1QFY'16 Var (%)
Average Coal Price
Consumed (USD/MT)
FOB 51.9 56.7 61.5 56.8 52.8 7.6%
Freight 6.1 5.3 5.9 5.7 5.8 -1.7%
Others 0.6 0.5 0.5 0.5 0.4 25.0%
CIF 58.6 62.5 67.9 63.0 59.0 6.8%
Average Coal Price
Consumed (RM/MT) (CIF) 240.1 260.5 294.0 264.7 254.1 4.2%
Coal Consumption
(mn MT)2.2 2.5 2.3 7.0 6.1 14.3%
FY2017
5.0% Increase in Fuel Costs Resulted from Higher Demand and Increased Piped Gas Price
18
1QFY’17 1QFY’16
Daily Average Gas Volume (mmscfd)
1,079 1,175
Average LNG Price
(RM/mmbtu)24.84 33.07
Average Piped Gas Price
(RM/mmbtu)19.70 16.70
Fuel
Type Gwh %
Gas & LNG 12,595.1 13,541.7 (946.6) (7.0)
Coal 16,251.8 14,358.3 1,893.5 13.2
Dist. 19.7 8.8 10.9 >100.0
Oil 115.3 24.5 90.8 >100.0
Hydro 882.8 1,182.3 (299.5) (25.3)
Total 29,864.7 29,115.6 749.1 2.6
Units Generated (Gwh)
Variance 1QFY'17 1QFY'16
Fuel
Type RM mn %
Gas 1,977.2 1,881.1 96.1 5.1
LNG 90.1 296.0 (205.9) (69.6)
Coal 1,856.5 1,587.3 269.2 17.0
Dist. 12.4 4.6 7.8 >100.0
Oil 33.2 11.4 21.8 >100.0
Total 3,969.4 3,780.4 189.0 5.0
Fuel Costs (RM mn)
Variance 1QFY'17 1QFY'16
GENERATION MIX (PENINSULA) Year-on-Year Analysis
Table 1:
Table 2:Table 3:
19
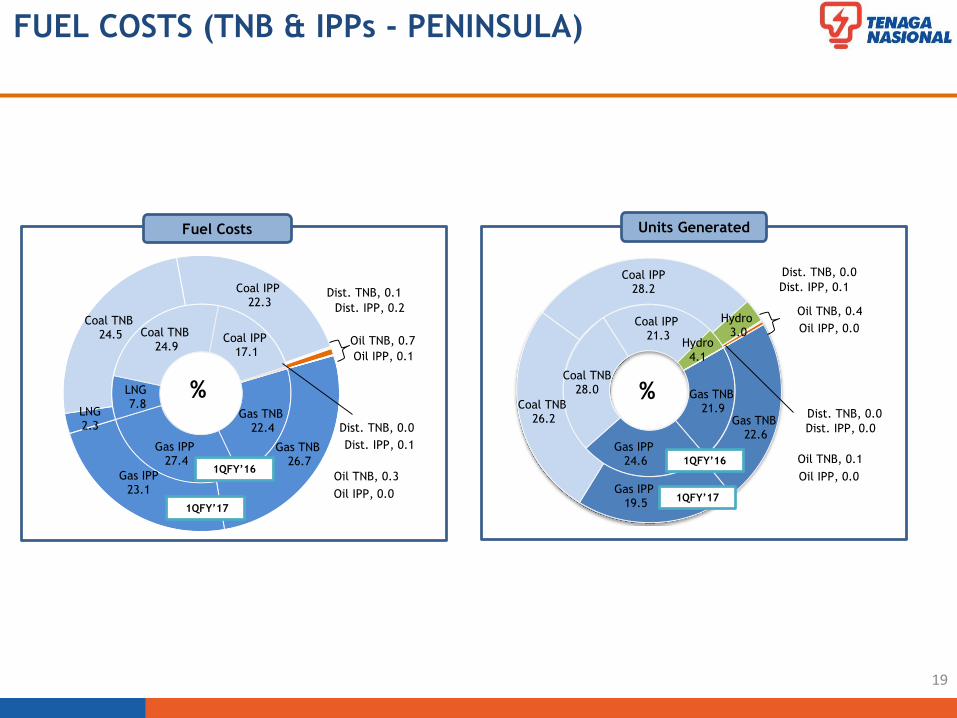
FUEL COSTS (TNB & IPPs - PENINSULA)
Fuel Costs Units Generated
Gas TNB22.4
Gas IPP27.4
LNG7.8
Coal TNB24.9
Coal IPP17.1
Dist. TNB, 0.0
Dist. IPP, 0.1
Oil TNB, 0.3
Oil IPP, 0.0
Gas TNB26.7
Gas IPP23.1
LNG2.3
Coal TNB24.5
Coal IPP22.3
Dist. TNB, 0.1
Dist. IPP, 0.2
Oil TNB, 0.7
Oil IPP, 0.1
%
1QFY’16
1QFY’17
Gas TNB21.9
Gas IPP24.6
Coal TNB28.0
Coal IPP21.3
Hydro4.1
Dist. TNB, 0.0
Dist. IPP, 0.0
Oil TNB, 0.1
Oil IPP, 0.0
Gas TNB22.6
Gas IPP19.5
Coal TNB26.2
Coal IPP28.2
Hydro3.0
Dist. TNB, 0.0
Dist. IPP, 0.1
Oil TNB, 0.4
Oil IPP, 0.0
%
1QFY’17
1QFY’16

20
COAL REQUIREMENT
Average Coal Price
(CIF) FY’10 FY’11 FY’12 FY’13 FY’14 FY’15 FY’16
(USD/metric tonne) 88.2 106.9 103.6 83.6 75.4 66.0 55.7
(RM/metric tonne) 293.8 325.9 321.9 259.5 244.6 236.0 231.1
17.818.9
20.8 20.8
19.3
22.2
25.4
28.1
0.0
5.0
10.0
15.0
20.0
25.0
30.0
FY'10 FY'11 FY'12 FY'13 FY'14 FY'15 FY'16 FY'17 (f)
Average Coal Price for 1QFY’17 was at USD63.0/MT @ RM264.7/MT
Tonne (mn)
Estimated Procurement
56%29%
4%11%
Country Mix
Indonesia Australia
South Africa Russia
Coal Consumption

30th Nov’16(RM bn)
DEBT EXPOSURE & GEARING
27.91
2.93
6.54
74.6% 28.34
3.00
2.92
Total Debt:
37.4Net Debt:
17.9
Total Debt:
34.3Net Debt:
17.2
7.8%
17.5%
82.6%
8.5%
8.7%
0.1%0.04
0.2%0.05
RM YEN USD Others
Closing 30th Nov’16 31st Aug’16
USD/RM 4.47 4.06
100YEN/RM 3.96 3.96
USD/YEN 112.88 102.53
31st Aug’16
(RM bn)
* Net Debt excludes deposits, bank and cash balances &
investment in UTF
Gearing (%) 40.7 39.5
Net Gearing (%) 19.5 19.7
Fixed : Floating (%) 96.4 : 3.6 96.4 : 3.6
Final Exposure (%) 96.4 : 3.6 96.4 : 3.6
Weighted Average Cost of Debt (%) 4.63 5.06
Final Exposure (%) 4.63 5.06
30th Nov'16 31st Aug'16Statistics
Improved Gearing due to Multicurrency Sukuk Issuance of USD0.75bn in October 2016
21

Sept'16 Oct'16 Nov'16
28.71 28.16 27.69
Trending FY2017 (%)
29.7
14.9
10.5 10.7 5.9
28.3
28.2
14.9
11.1
11.3 6.8
27.7
Khazanah NasionalBerhad
Employees ProvidentFund Board
Permodalan NasionalBhd
Other Corporations &Govt. Agencies
Malaysian Public
Foreign
Top 100* Shareholders as at Nov’16
(%)
Aug’16
Nov’16
Sep
t'1
4
Oct
'14
No
v'1
4
Dec
'14
Jan
'15
Feb
'15
Mar
'15
Ap
r'1
5
May
'15
Jun
'15
Jul'1
5
Au
g'1
5
Sep
t'1
5
Oct
'15
No
v'1
5
Dec
'15
Jan
'16
Feb
'16
Mar
'16
Ap
r'1
6
May
'16
Jun
'16
Jul'1
6
Au
g'1
6
Sep
t'1
6
Oct
'16
No
v'1
6
27.69%
Foreign Shareholding
26.90%
22.81%
* 82% of total shareholding
SHAREHOLDING
22
Foreign Shareholdings Remained Around 27%

DISCLAIMER
All information contained herein is meant strictly for the use of this presentation only
and should not be used or relied on by any party for any other purpose and without the
prior written approval of TNB. The information contained herein is the property of
TNB and it is privileged and confidential in nature. TNB has the sole copyright to such
information and you are prohibited from disseminating, distributing, copying,
re-producing, using and/or disclosing this information.

CONTACT DETAILS
INVESTOR RELATIONS & MANAGEMENT
REPORTING DEPARTMENT
Tenaga Nasional Berhad
4th Floor, TNB Headquarters
No.129, Jalan Bangsar,
59200 Kuala Lumpur, MALAYSIA
Tel : +603 2296 5566
Fax : +603 2284 0095
Email : [email protected]
Website : www.tnb.com.my
IR OFFICERS:
Sherleen +603 2296 6183 [email protected]
Nadia +603 2296 6787 [email protected]
For further enquiries, kindly contact us at:

THANK YOU
Unaudited Consolidated Results for the 1st Quarter FY2017 ended 30th November 2016