Presentation title second line
64
23 - 24 September 2015 2015 Global Steel and Mining Conference
Transcript of Presentation title second line
23 - 24 September 2015 2015 Global Steel and Mining Conference
Disclaimer
Forward-Looking Statements
This document may contain forward-looking information and statements about ArcelorMittal and its
subsidiaries. These statements include financial projections and estimates and their underlying
assumptions, statements regarding plans, objectives and expectations with respect to future operations,
products and services, and statements regarding future performance. Forward-looking statements may be
identified by the words “believe,” “expect,” “anticipate,” “target” or similar expressions. Although
ArcelorMittal’s management believes that the expectations reflected in such forward-looking statements
are reasonable, investors and holders of ArcelorMittal’s securities are cautioned that forward-looking
information and statements are subject to numerous risks and uncertainties, many of which are difficult to
predict and generally beyond the control of ArcelorMittal, that could cause actual results and
developments to differ materially and adversely from those expressed in, or implied or projected by, the
forward-looking information and statements. These risks and uncertainties include those discussed or
identified in the filings with the Luxembourg Stock Market Authority for the Financial Markets (Commission
de Surveillance du Secteur Financier) and the United States Securities and Exchange Commission (the
“SEC”) made or to be made by ArcelorMittal, including ArcelorMittal’s Annual Report on Form 20-F for the
year ended December 31, 2014 filed with the SEC. ArcelorMittal undertakes no obligation to publicly
update its forward-looking statements, whether as a result of new information, future events, or otherwise.
1
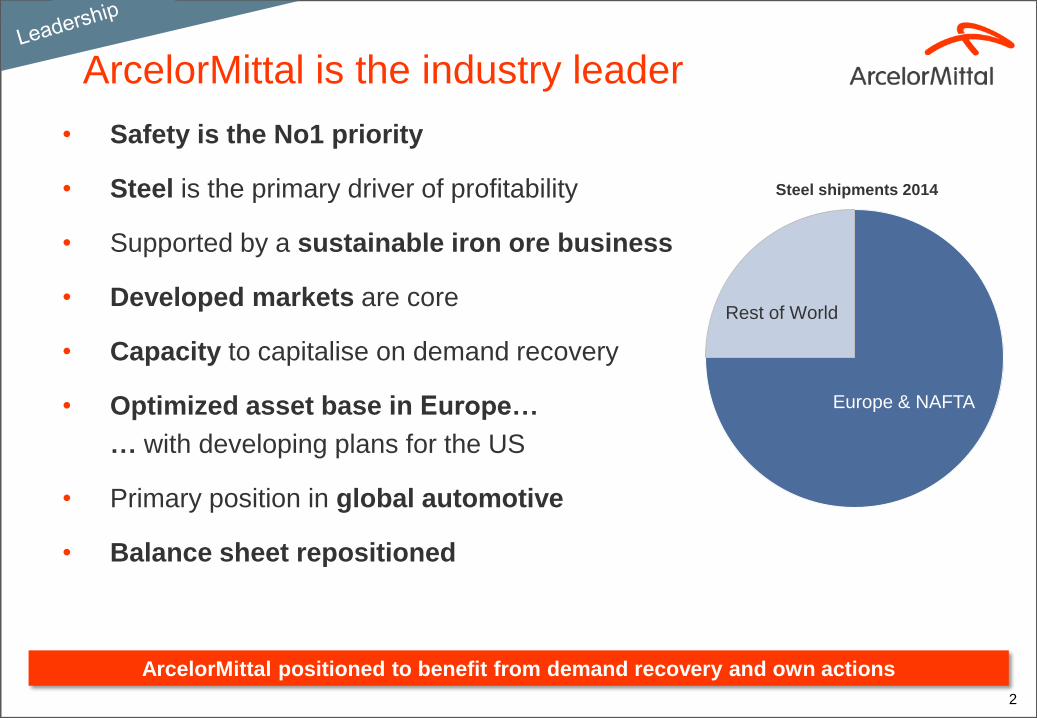
ArcelorMittal is the industry leader
• Safety is the No1 priority
• Steel is the primary driver of profitability
• Supported by a sustainable iron ore business
• Developed markets are core
• Capacity to capitalise on demand recovery
• Optimized asset base in Europe…
… with developing plans for the US
• Primary position in global automotive
• Balance sheet repositioned
ArcelorMittal positioned to benefit from demand recovery and own actions
2
Europe & NAFTA
Rest of World
Steel shipments 2014
3
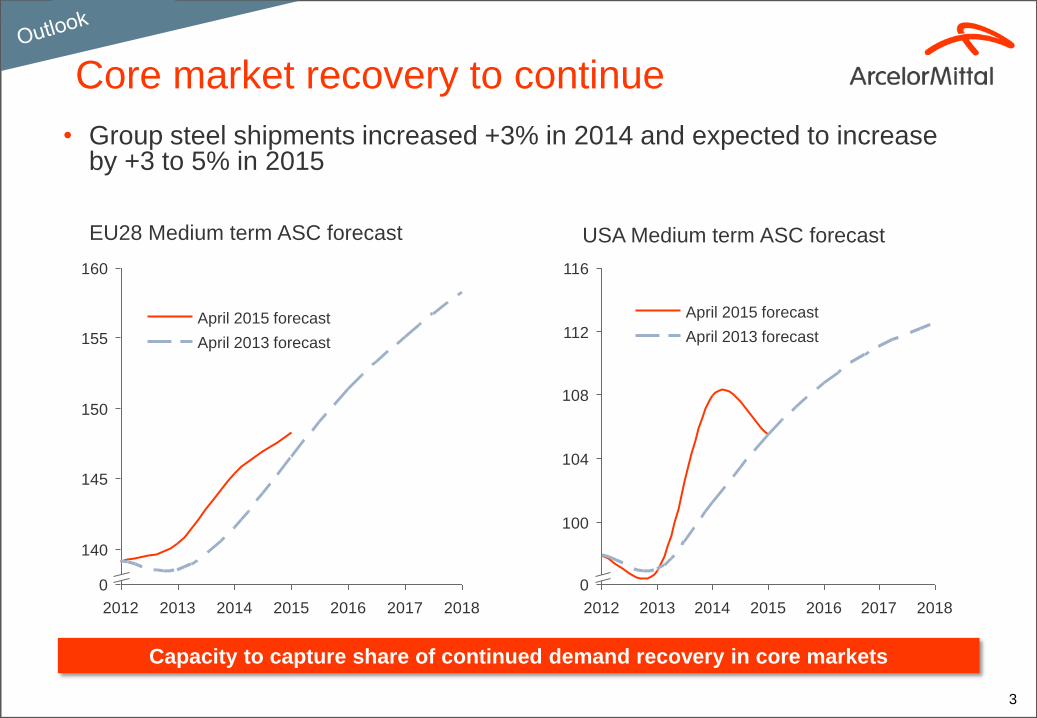
Capacity to capture share of continued demand recovery in core markets
Core market recovery to continue
2012 2013 2014 2015 2016 2017 2018
160
155
150
145
140
0
April 2013 forecast
April 2015 forecast
EU28 Medium term ASC forecast
2012 2013 2014 2015 2016 2017 2018
112
116
108
104
100
0
April 2015 forecast
April 2013 forecast
USA Medium term ASC forecast
• Group steel shipments increased +3% in 2014 and expected to increase by +3 to 5% in 2015
Footprint optimization delivering results
• European footprint optimization launched in 2011
• Principal was to maintain market share whilst orientating capacity to most competitive sites
• Focus on “core assets” to ensure lowest cost footprint achieved
• Savings through fixed cost removal with well loaded assets with stable working points
Lower variable cost
Lower and more stable working capital requirements
Better service and quality
Reduce capex requirements
• >$1bn savings achieved through European footprint optimization
• Similar plans under development for US asset base - focused on downstream operations to ensure improved competitiveness
• South Africa restructuring underway
European asset optimization yielded $1 billion cost savings
4
5
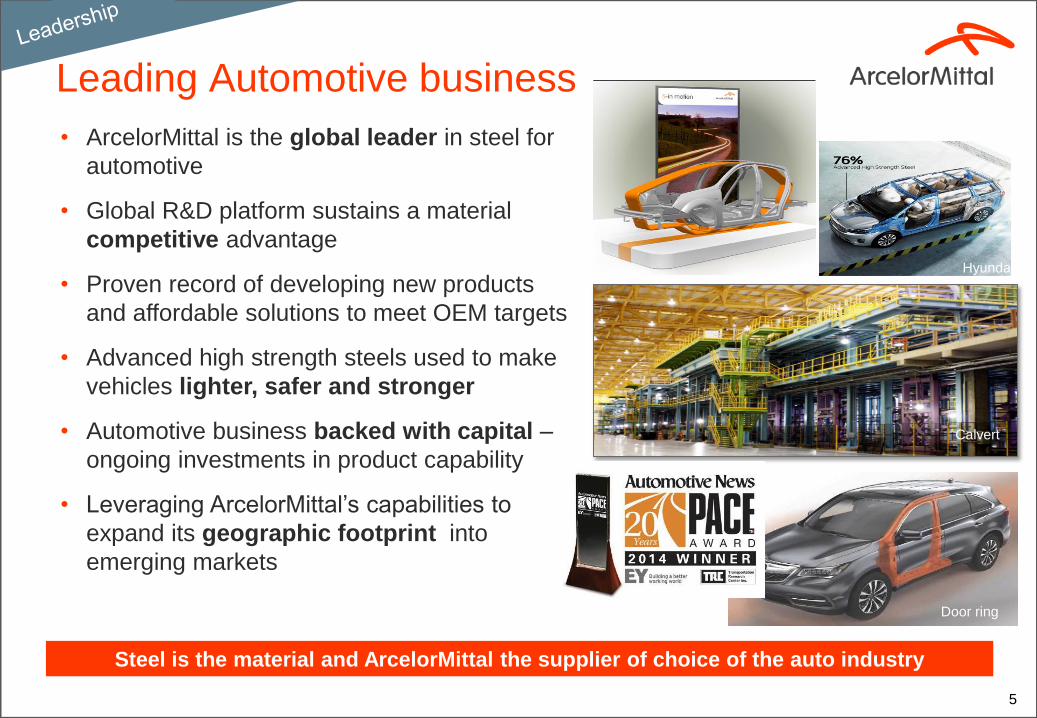
Leading Automotive business
• ArcelorMittal is the global leader in steel for
automotive
• Global R&D platform sustains a material
competitive advantage
• Proven record of developing new products
and affordable solutions to meet OEM targets
• Advanced high strength steels used to make
vehicles lighter, safer and stronger
• Automotive business backed with capital –
ongoing investments in product capability
• Leveraging ArcelorMittal’s capabilities to
expand its geographic footprint into
emerging markets
Steel is the material and ArcelorMittal the supplier of choice of the auto industry
Calvert
Door ring
Hyundai
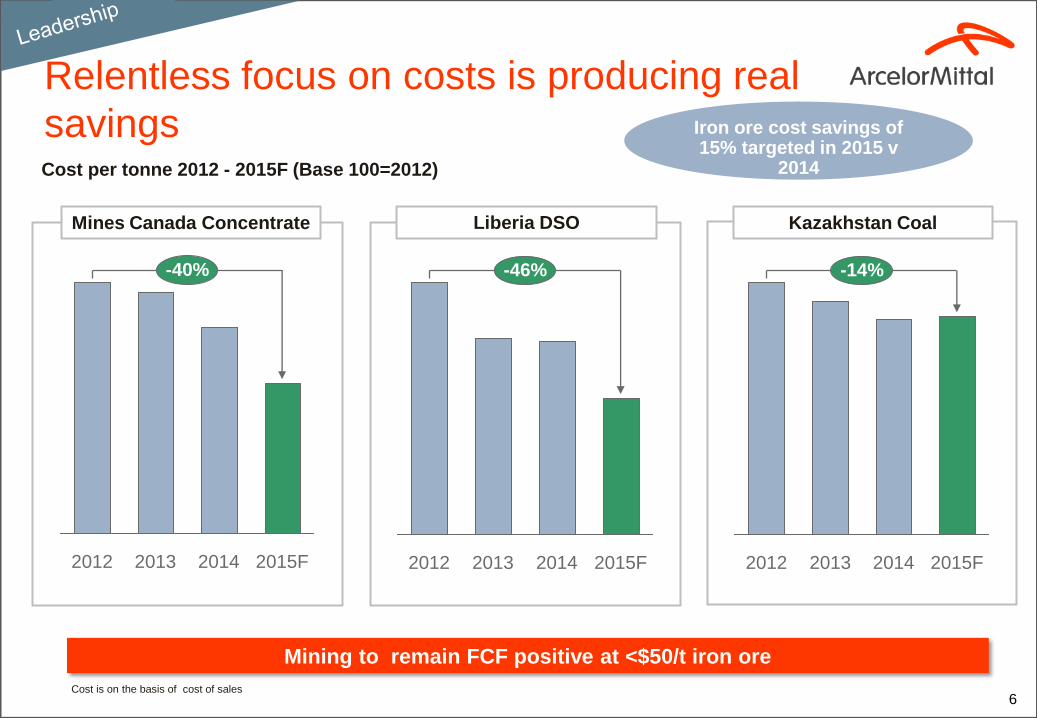
Cost per tonne 2012 - 2015F (Base 100=2012)
6
-40%
2015F 2014 2013 2012 2015F 2014 2013 2012
-46%
2015F 2014
-14%
2012 2013
Relentless focus on costs is producing real
savings
Cost is on the basis of cost of sales
Mining to remain FCF positive at <$50/t iron ore
Iron ore cost savings of 15% targeted in 2015 v
2014
Mines Canada Concentrate Liberia DSO Kazakhstan Coal
7
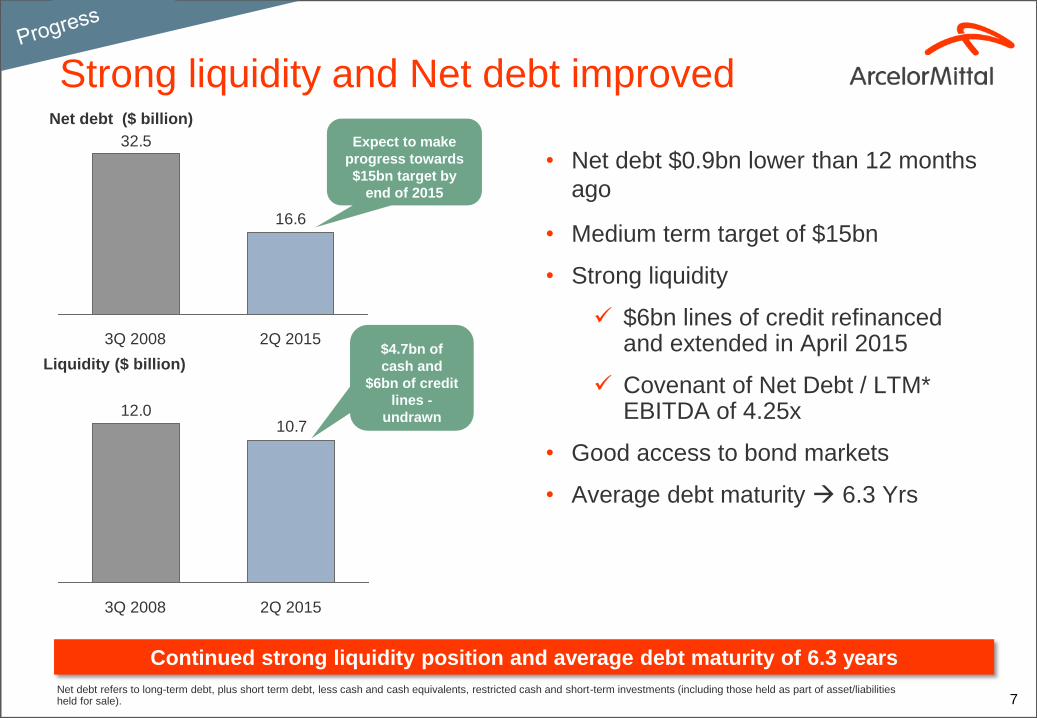
Net debt ($ billion)
Liquidity ($ billion)
16.6
32.5
3Q 2008 2Q 2015
10.712.0
2Q 2015 3Q 2008
Continued strong liquidity position and average debt maturity of 6.3 years
Net debt refers to long-term debt, plus short term debt, less cash and cash equivalents, restricted cash and short-term investments (including those held as part of asset/liabilities held for sale).
Strong liquidity and Net debt improved
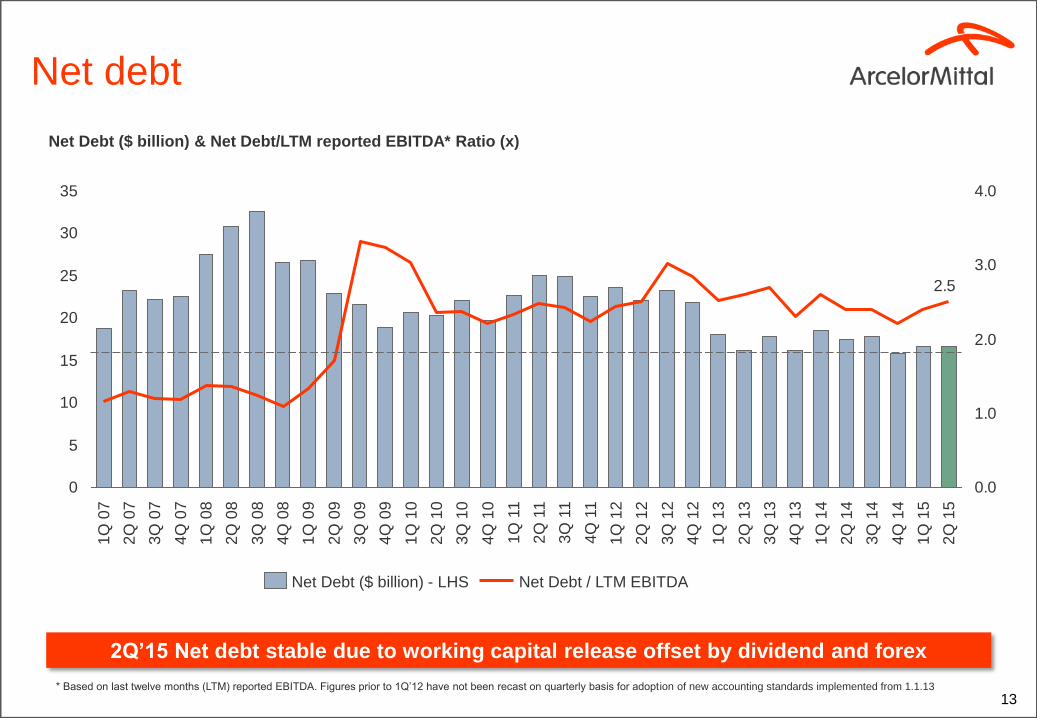
• Net debt $0.9bn lower than 12 months
ago
• Medium term target of $15bn
• Strong liquidity
$6bn lines of credit refinanced and extended in April 2015
Covenant of Net Debt / LTM* EBITDA of 4.25x
• Good access to bond markets
• Average debt maturity 6.3 Yrs
Expect to make
progress towards
$15bn target by
end of 2015
$4.7bn of
cash and
$6bn of credit
lines -
undrawn
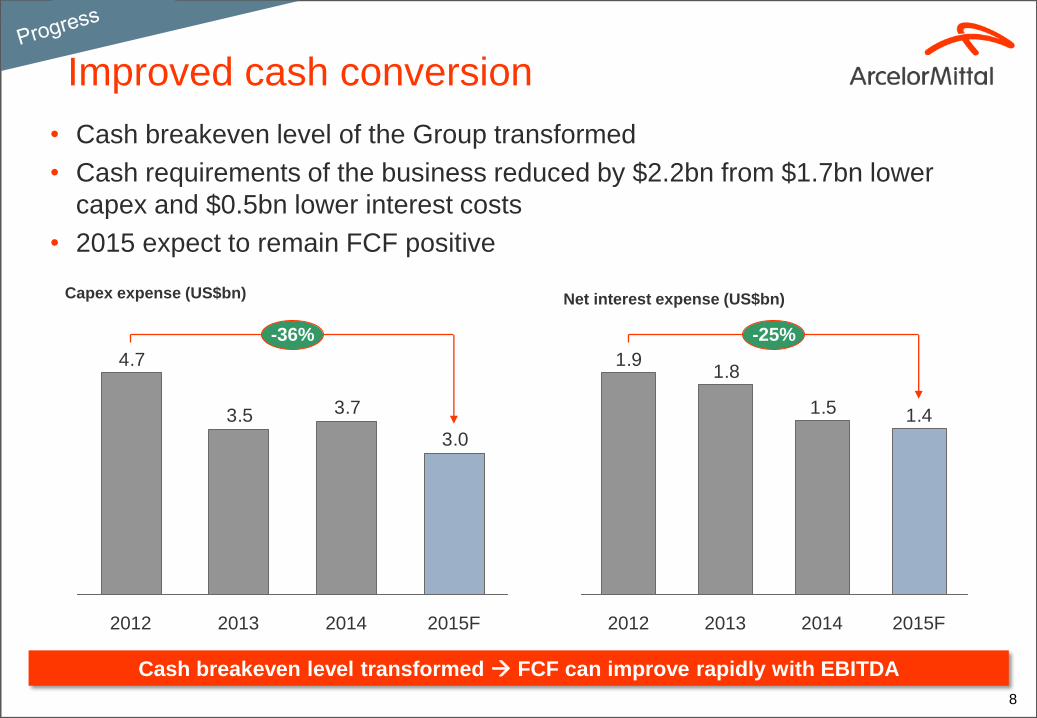
Improved cash conversion
• Cash breakeven level of the Group transformed
• Cash requirements of the business reduced by $2.2bn from $1.7bn lower
capex and $0.5bn lower interest costs
• 2015 expect to remain FCF positive
Cash breakeven level transformed FCF can improve rapidly with EBITDA
8
3.0
3.73.5
4.7
2013
-36%
2014 2015F 2012
1.41.5
1.81.9
2015F
-25%
2014 2012 2013
Capex expense (US$bn) Net interest expense (US$bn)
Recap
• Positive outlook for core developed markets
• The demand recovery in Europe is driving improved steel
spreads and profitability
• The learning's of footprint optimisation in Europe will be
applied to the US asset base
• ArcelorMittal is the leader in steel for automotive and will
continue to invest to capture the opportunities
• Clear progress has been achieved on mining costs, cash
conversion and repositioning the balance sheet
9

Daniel Fairclough – Global Head Investor Relations
+44 207 543 1105
Hetal Patel – UK/European Investor Relations
+44 207 543 1128
Valérie Mella – European/Retail Investor Relations
+44 207 543 1156
Maureen Baker – Fixed Income/Debt Investor Relations
+33 1 71 92 10 26
Lisa Fortuna – US Investor Relations
+312 899 3985
We have released a new ArcelorMittal investor relations app available for download on IOS or android devices
New ArcelorMittal IR app and contacts
Appendix
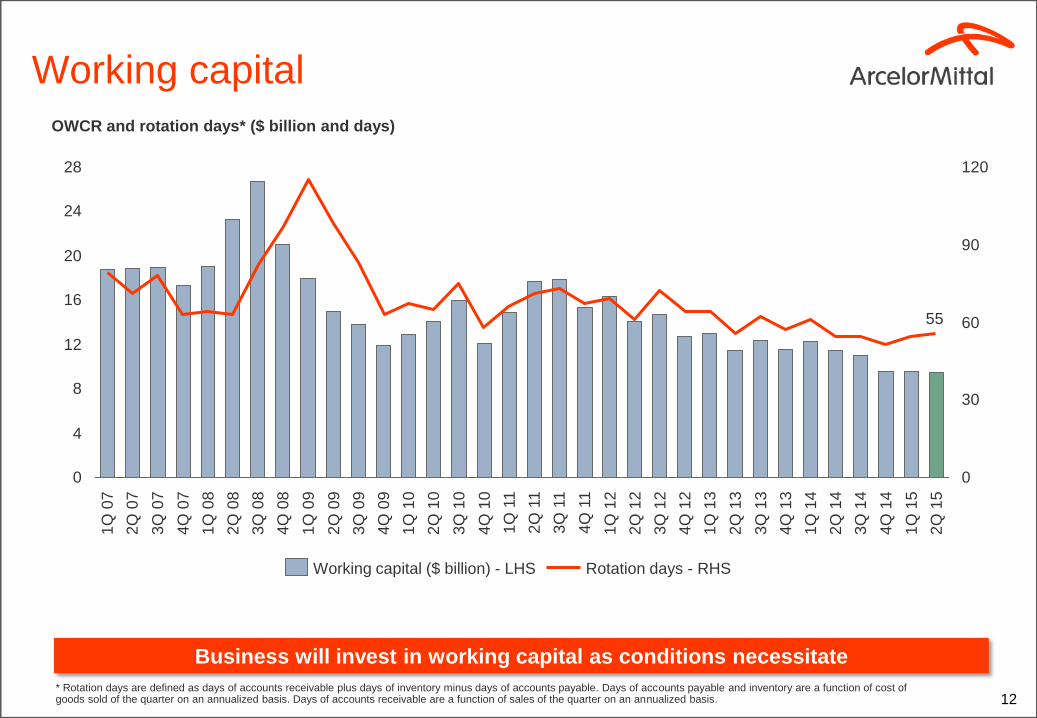
Working capital
12
OWCR and rotation days* ($ billion and days)
Business will invest in working capital as conditions necessitate
* Rotation days are defined as days of accounts receivable plus days of inventory minus days of accounts payable. Days of accounts payable and inventory are a function of cost of goods sold of the quarter on an annualized basis. Days of accounts receivable are a function of sales of the quarter on an annualized basis.
55
0
4
8
12
16
20
24
28
0
30
60
90
120
3Q
14
2Q
14
4Q
13
1Q
14
3Q
13
2Q
13
1Q
12
4Q
12
3Q
12
2Q
12
1Q
11
3Q
11
2Q
11
4Q
11
4Q
10
3Q
10
2Q
10
1Q
10
4Q
09
3Q
09
2Q
09
1Q
09
4Q
08
3Q
08
2Q
08
1Q
08
4Q
07
3Q
07
2Q
07
1Q
07
2Q
15
1Q
13
1Q
15
4Q
14
Rotation days - RHS Working capital ($ billion) - LHS
13
Net debt
Net Debt ($ billion) & Net Debt/LTM reported EBITDA* Ratio (x)
* Based on last twelve months (LTM) reported EBITDA. Figures prior to 1Q’12 have not been recast on quarterly basis for adoption of new accounting standards implemented from 1.1.13
2.5
0
5
10
15
20
25
30
35
0.0
1.0
2.0
3.0
4.0
3Q
12
2Q
12
1Q
12
4Q
11
3Q
11
2Q
11
1Q
11
4Q
10
3Q
10
2Q
10
1Q
10
4Q
09
3Q
09
2Q
09
1Q
09
4Q
08
2Q
15
2Q
08
1Q
08
4Q
07
3Q
07
2Q
07
1Q
07
1Q
15
4Q
14
3Q
14
2Q
14
1Q
14
4Q
13
3Q
13
2Q
13
1Q
13
4Q
12
3Q
08
Net Debt ($ billion) - LHS Net Debt / LTM EBITDA
2Q’15 Net debt stable due to working capital release offset by dividend and forex
14
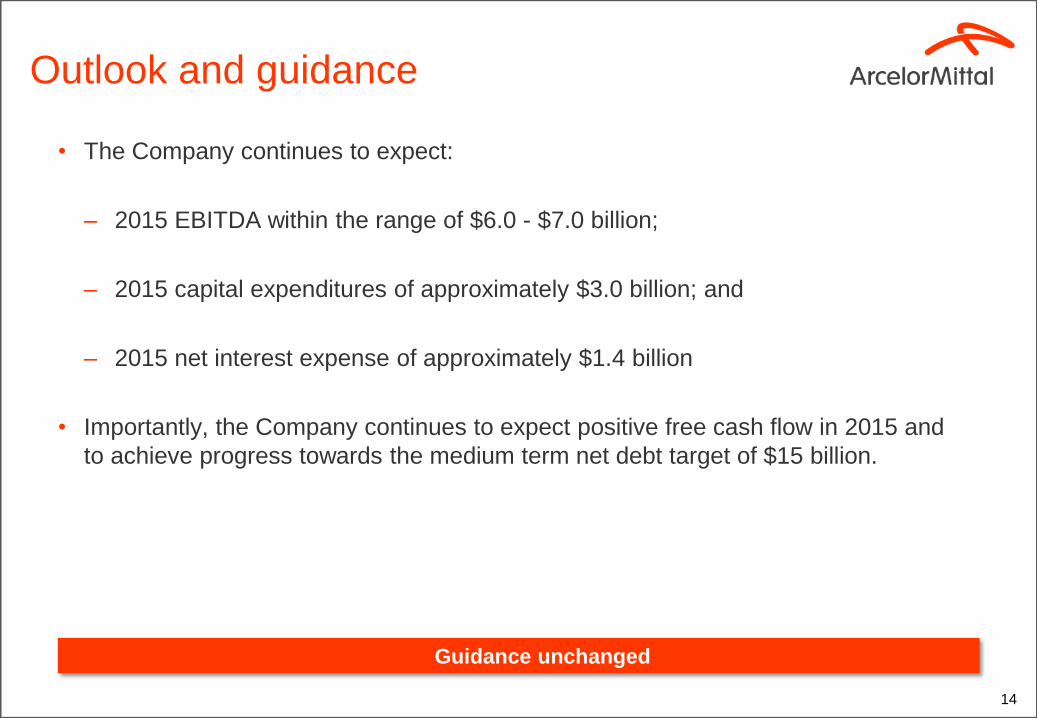
Outlook and guidance
• The Company continues to expect:
– 2015 EBITDA within the range of $6.0 - $7.0 billion;
– 2015 capital expenditures of approximately $3.0 billion; and
– 2015 net interest expense of approximately $1.4 billion
• Importantly, the Company continues to expect positive free cash flow in 2015 and
to achieve progress towards the medium term net debt target of $15 billion.
Guidance unchanged
MACRO (highlights)
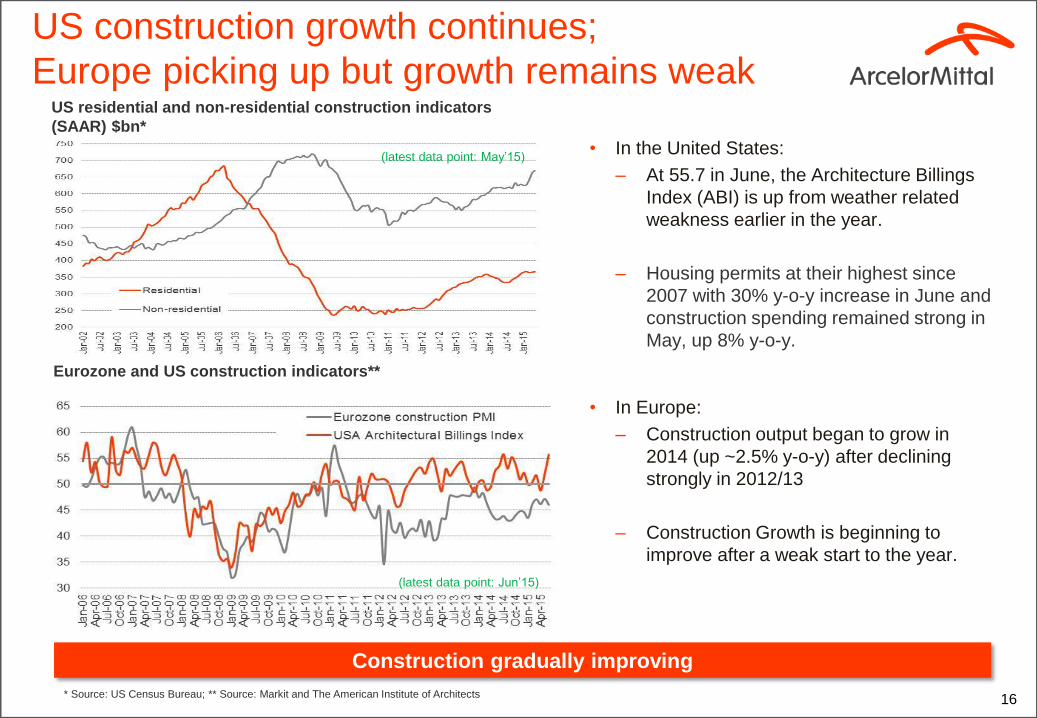
US construction growth continues;
Europe picking up but growth remains weak
• In the United States:
– At 55.7 in June, the Architecture Billings
Index (ABI) is up from weather related
weakness earlier in the year.
– Housing permits at their highest since
2007 with 30% y-o-y increase in June and
construction spending remained strong in
May, up 8% y-o-y.
• In Europe:
– Construction output began to grow in
2014 (up ~2.5% y-o-y) after declining
strongly in 2012/13
– Construction Growth is beginning to
improve after a weak start to the year.
US residential and non-residential construction indicators
(SAAR) $bn*
16 * Source: US Census Bureau; ** Source: Markit and The American Institute of Architects
Eurozone and US construction indicators**
(latest data point: Jun’15)
Construction gradually improving
(latest data point: May’15)
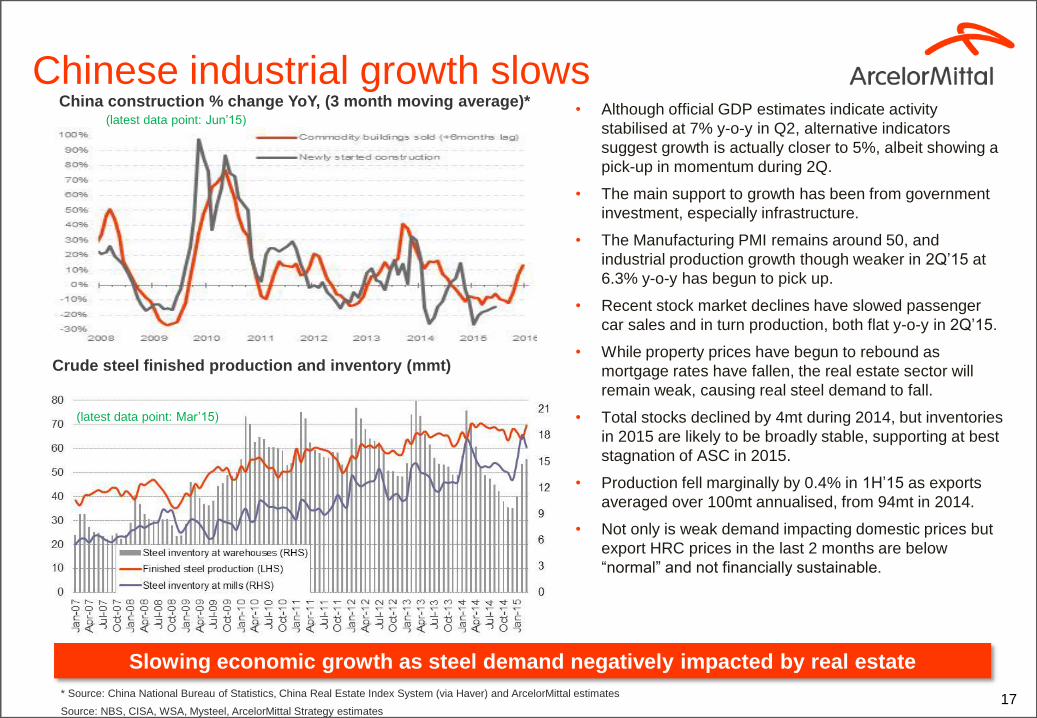
Chinese industrial growth slows • Although official GDP estimates indicate activity
stabilised at 7% y-o-y in Q2, alternative indicators
suggest growth is actually closer to 5%, albeit showing a
pick-up in momentum during 2Q.
• The main support to growth has been from government
investment, especially infrastructure.
• The Manufacturing PMI remains around 50, and
industrial production growth though weaker in 2Q’15 at
6.3% y-o-y has begun to pick up.
• Recent stock market declines have slowed passenger
car sales and in turn production, both flat y-o-y in 2Q’15.
• While property prices have begun to rebound as
mortgage rates have fallen, the real estate sector will
remain weak, causing real steel demand to fall.
• Total stocks declined by 4mt during 2014, but inventories
in 2015 are likely to be broadly stable, supporting at best
stagnation of ASC in 2015.
• Production fell marginally by 0.4% in 1H’15 as exports
averaged over 100mt annualised, from 94mt in 2014.
• Not only is weak demand impacting domestic prices but
export HRC prices in the last 2 months are below
“normal” and not financially sustainable.
17
Crude steel finished production and inventory (mmt)
* Source: China National Bureau of Statistics, China Real Estate Index System (via Haver) and ArcelorMittal estimates
Source: NBS, CISA, WSA, Mysteel, ArcelorMittal Strategy estimates
China construction % change YoY, (3 month moving average)*
Slowing economic growth as steel demand negatively impacted by real estate
(latest data point: Feb/Mar’15)
(latest data point: Jun’15)
(latest data point: Mar’15)
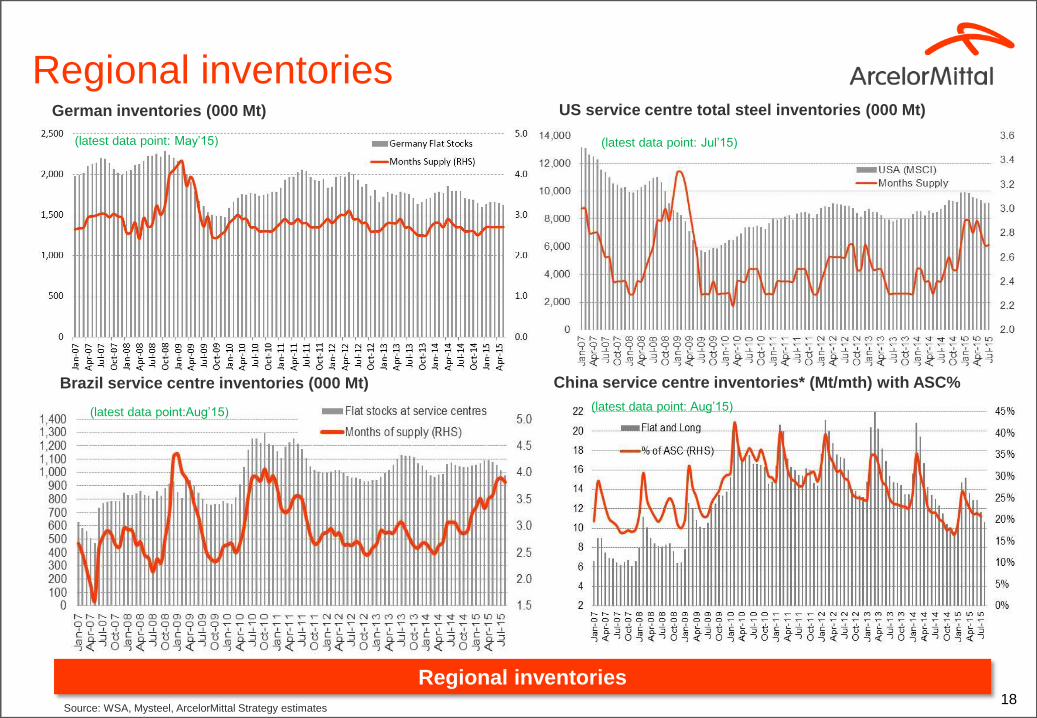
Regional inventories German inventories (000 Mt)
18
China service centre inventories* (Mt/mth) with ASC% Brazil service centre inventories (000 Mt)
US service centre total steel inventories (000 Mt)
Source: WSA, Mysteel, ArcelorMittal Strategy estimates
Regional inventories
(latest data point:Aug’15)
(latest data point: Jul’15) (latest data point: May’15)
(latest data point: Aug’15)
19
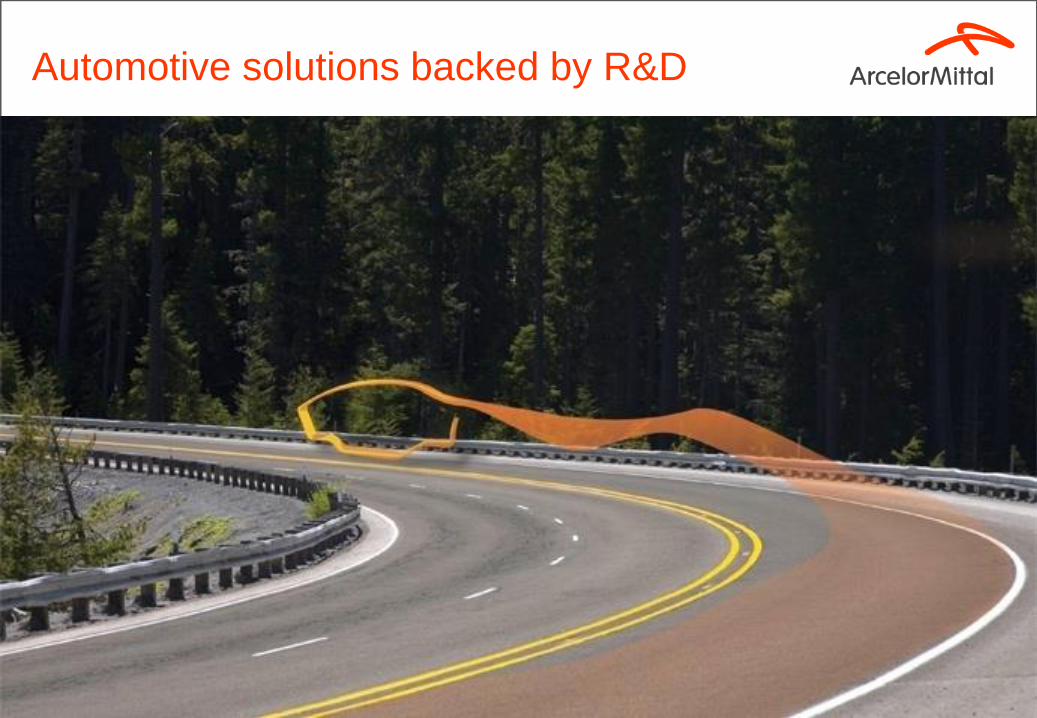
Automotive solutions backed by R&D
20
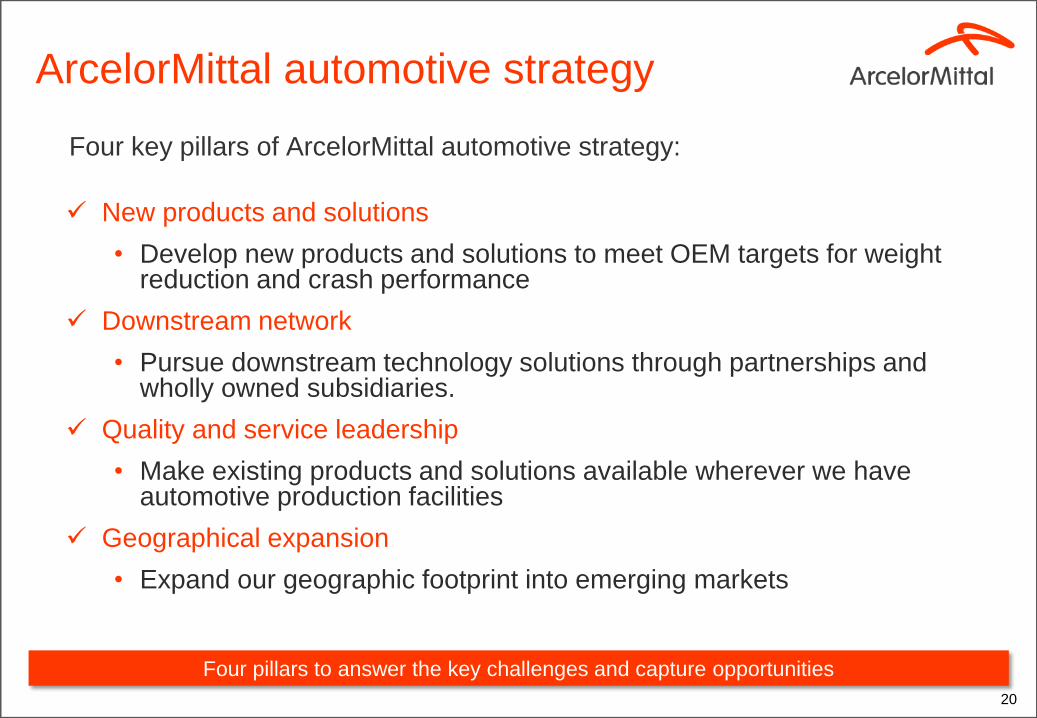
ArcelorMittal automotive strategy
Four pillars to answer the key challenges and capture opportunities
Four key pillars of ArcelorMittal automotive strategy:
New products and solutions
• Develop new products and solutions to meet OEM targets for weight reduction and crash performance
Downstream network
• Pursue downstream technology solutions through partnerships and wholly owned subsidiaries.
Quality and service leadership
• Make existing products and solutions available wherever we have automotive production facilities
Geographical expansion
• Expand our geographic footprint into emerging markets
21
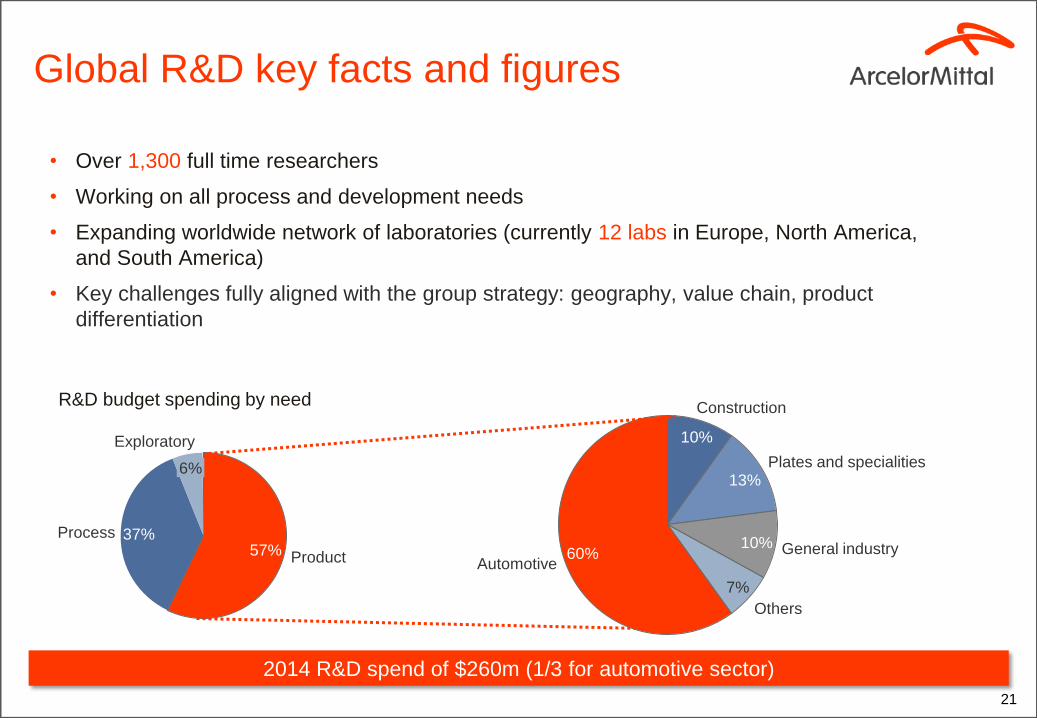
2014 R&D spend of $260m (1/3 for automotive sector)
• Over 1,300 full time researchers
• Working on all process and development needs
• Expanding worldwide network of laboratories (currently 12 labs in Europe, North America,
and South America)
• Key challenges fully aligned with the group strategy: geography, value chain, product
differentiation
57% Product
37% Process
6%
Exploratory
General industry 10%
Construction
Plates and specialities 13%
10%
Others
7%
60% Automotive
R&D budget spending by need
Global R&D key facts and figures
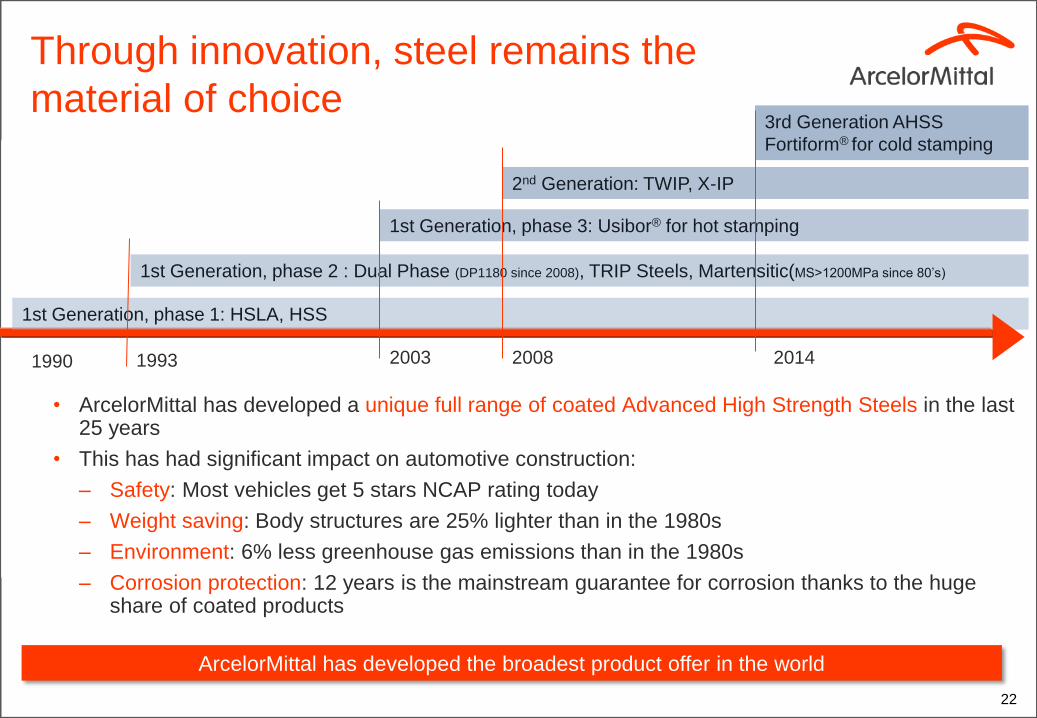
Through innovation, steel remains the
material of choice
• ArcelorMittal has developed a unique full range of coated Advanced High Strength Steels in the last 25 years
• This has had significant impact on automotive construction:
– Safety: Most vehicles get 5 stars NCAP rating today
– Weight saving: Body structures are 25% lighter than in the 1980s
– Environment: 6% less greenhouse gas emissions than in the 1980s
– Corrosion protection: 12 years is the mainstream guarantee for corrosion thanks to the huge share of coated products
1990 2008 2014
1st Generation, phase 1: HSLA, HSS
1st Generation, phase 2 : Dual Phase (DP1180 since 2008), TRIP Steels, Martensitic(MS>1200MPa since 80’s)
1st Generation, phase 3: Usibor® for hot stamping
3rd Generation AHSS
Fortiform® for cold stamping
2nd Generation: TWIP, X-IP
2003 1993
22
ArcelorMittal has developed the broadest product offer in the world
23
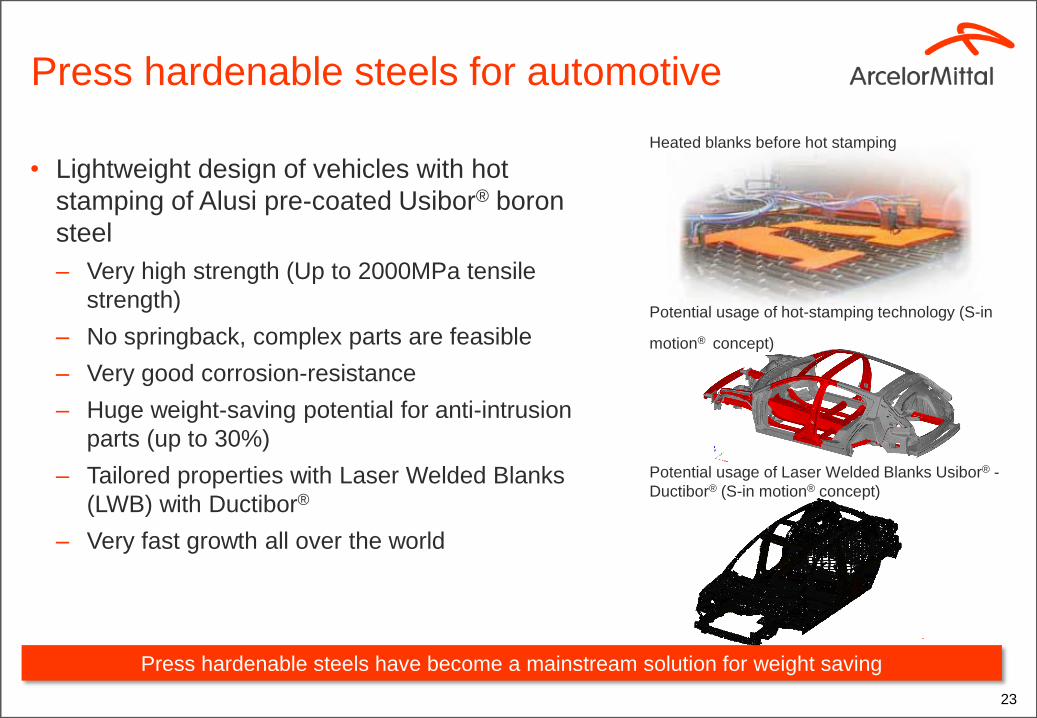
• Lightweight design of vehicles with hot
stamping of Alusi pre-coated Usibor® boron
steel
– Very high strength (Up to 2000MPa tensile
strength)
– No springback, complex parts are feasible
– Very good corrosion-resistance
– Huge weight-saving potential for anti-intrusion
parts (up to 30%)
– Tailored properties with Laser Welded Blanks
(LWB) with Ductibor®
– Very fast growth all over the world
-
Potential usage of hot-stamping technology (S-in
motion®
concept)
Potential usage of Laser Welded Blanks Usibor® -
Ductibor® (S-in motion® concept)
Heated blanks before hot stamping
Press hardenable steels for automotive
Press hardenable steels have become a mainstream solution for weight saving
24
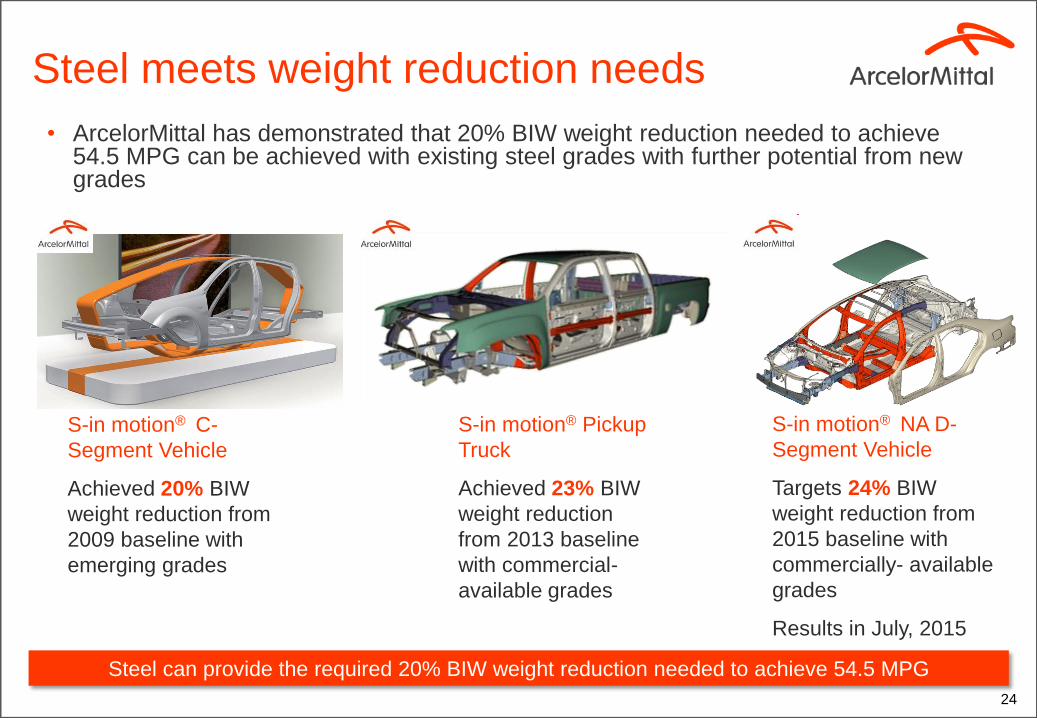
Steel meets weight reduction needs
Steel can provide the required 20% BIW weight reduction needed to achieve 54.5 MPG
S-in motion® C-
Segment Vehicle
Achieved 20% BIW
weight reduction from
2009 baseline with
emerging grades
S-in motion® Pickup
Truck
Achieved 23% BIW
weight reduction
from 2013 baseline
with commercial-
available grades
S-in motion® NA D-
Segment Vehicle
Targets 24% BIW
weight reduction from
2015 baseline with
commercially- available
grades
Results in July, 2015
• ArcelorMittal has demonstrated that 20% BIW weight reduction needed to achieve 54.5 MPG can be achieved with existing steel grades with further potential from new grades
25
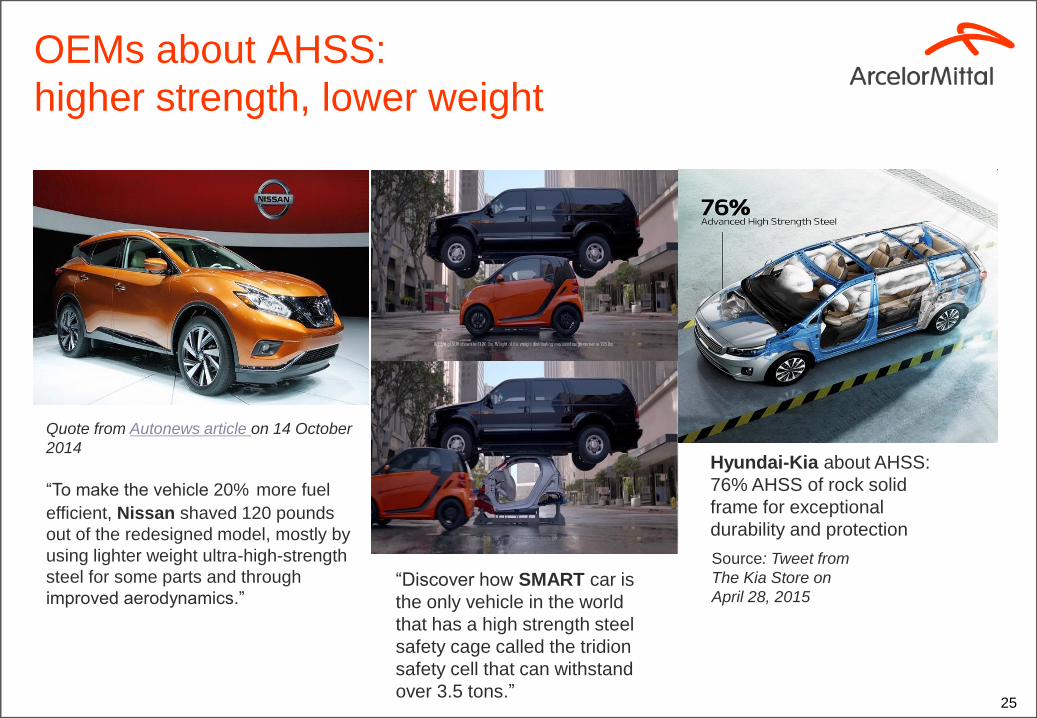
Quote from Autonews article on 14 October
2014
“To make the vehicle 20% more fuel
efficient, Nissan shaved 120 pounds
out of the redesigned model, mostly by
using lighter weight ultra-high-strength
steel for some parts and through
improved aerodynamics.”
OEMs about AHSS:
higher strength, lower weight
“Discover how SMART car is
the only vehicle in the world
that has a high strength steel
safety cage called the tridion
safety cell that can withstand
over 3.5 tons.”
Hyundai-Kia about AHSS:
76% AHSS of rock solid
frame for exceptional
durability and protection
Source: Tweet from
The Kia Store on
April 28, 2015
Penetration of press hardened steels
26
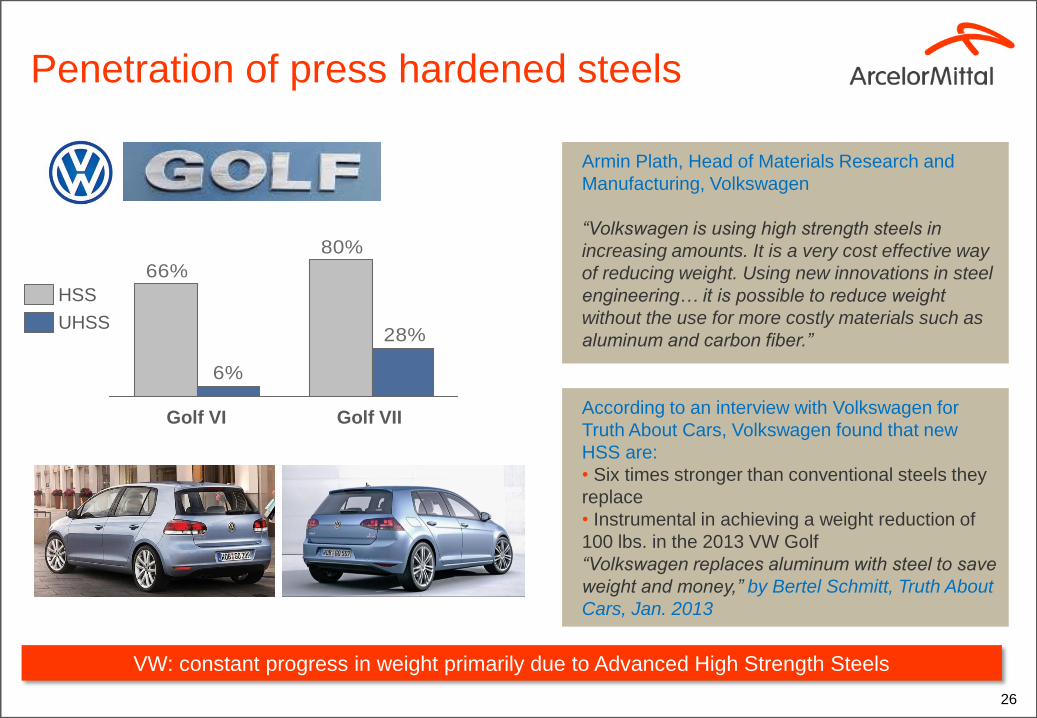
80%
66%
28%
6%
Golf VII Golf VI
UHSS
HSS
Armin Plath, Head of Materials Research and
Manufacturing, Volkswagen
“Volkswagen is using high strength steels in
increasing amounts. It is a very cost effective way
of reducing weight. Using new innovations in steel
engineering… it is possible to reduce weight
without the use for more costly materials such as
aluminum and carbon fiber.”
According to an interview with Volkswagen for
Truth About Cars, Volkswagen found that new
HSS are:
• Six times stronger than conventional steels they
replace
• Instrumental in achieving a weight reduction of
100 lbs. in the 2013 VW Golf
“Volkswagen replaces aluminum with steel to save
weight and money,” by Bertel Schmitt, Truth About
Cars, Jan. 2013
VW: constant progress in weight primarily due to Advanced High Strength Steels
Golf VII Golf VI
UHSS
HSS
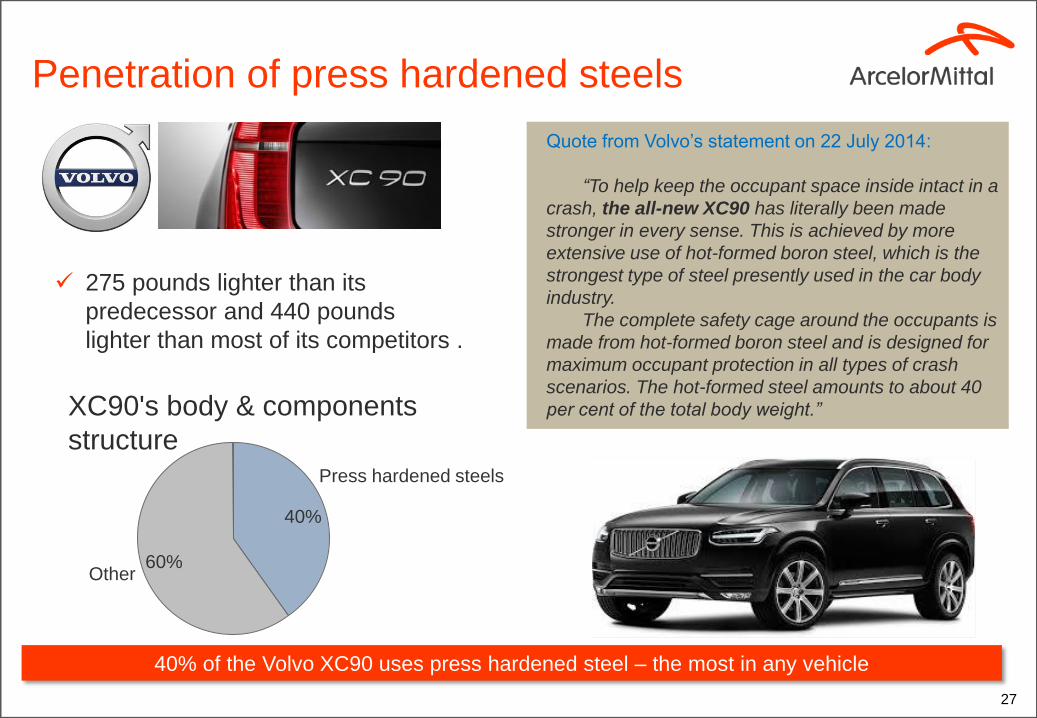
275 pounds lighter than its
predecessor and 440 pounds
lighter than most of its competitors .
60%
40%
Other
Press hardened steels
XC90's body & components
structure
Quote from Volvo’s statement on 22 July 2014:
“To help keep the occupant space inside intact in a
crash, the all-new XC90 has literally been made
stronger in every sense. This is achieved by more
extensive use of hot-formed boron steel, which is the
strongest type of steel presently used in the car body
industry.
The complete safety cage around the occupants is
made from hot-formed boron steel and is designed for
maximum occupant protection in all types of crash
scenarios. The hot-formed steel amounts to about 40
per cent of the total body weight.”
27
Penetration of press hardened steels
40% of the Volvo XC90 uses press hardened steel – the most in any vehicle
28
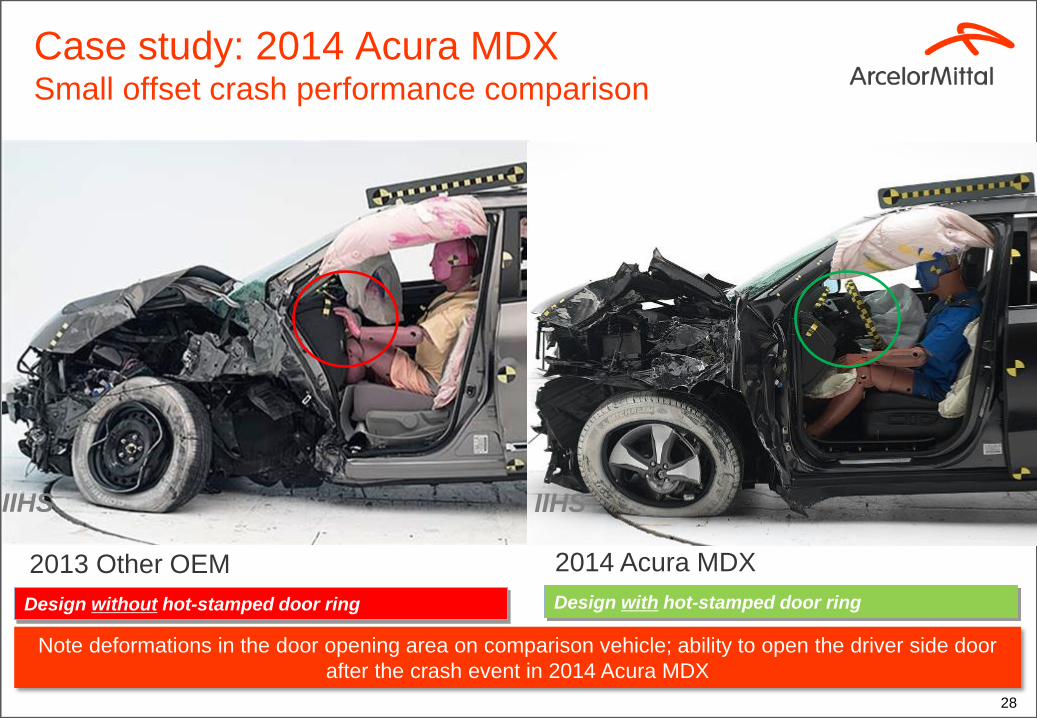
Design without hot-stamped door ring Design with hot-stamped door ring
2014 Acura MDX 2013 Other OEM
Note deformations in the door opening area on comparison vehicle; ability to open the driver side door
after the crash event in 2014 Acura MDX
IIHS IIHS
Case study: 2014 Acura MDX Small offset crash performance comparison
Source: NHTSA Volpe Transportation Research Center CAFE Compliance and Effects Model
0
10
20
60
50
30
40
Fuel E
conom
y (
MP
G)
54.5 MPG
25 MPG
58%
12%
15%
8% 7%
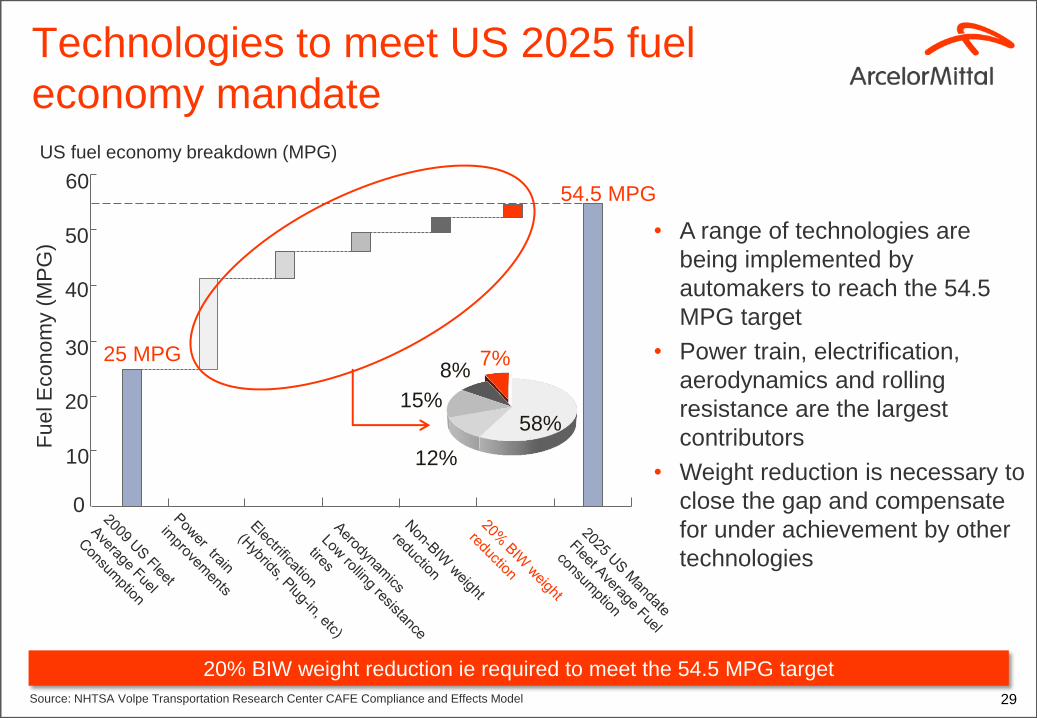
• A range of technologies are
being implemented by
automakers to reach the 54.5
MPG target
• Power train, electrification,
aerodynamics and rolling
resistance are the largest
contributors
• Weight reduction is necessary to
close the gap and compensate
for under achievement by other
technologies
US fuel economy breakdown (MPG)
Technologies to meet US 2025 fuel
economy mandate
20% BIW weight reduction ie required to meet the 54.5 MPG target
29
30
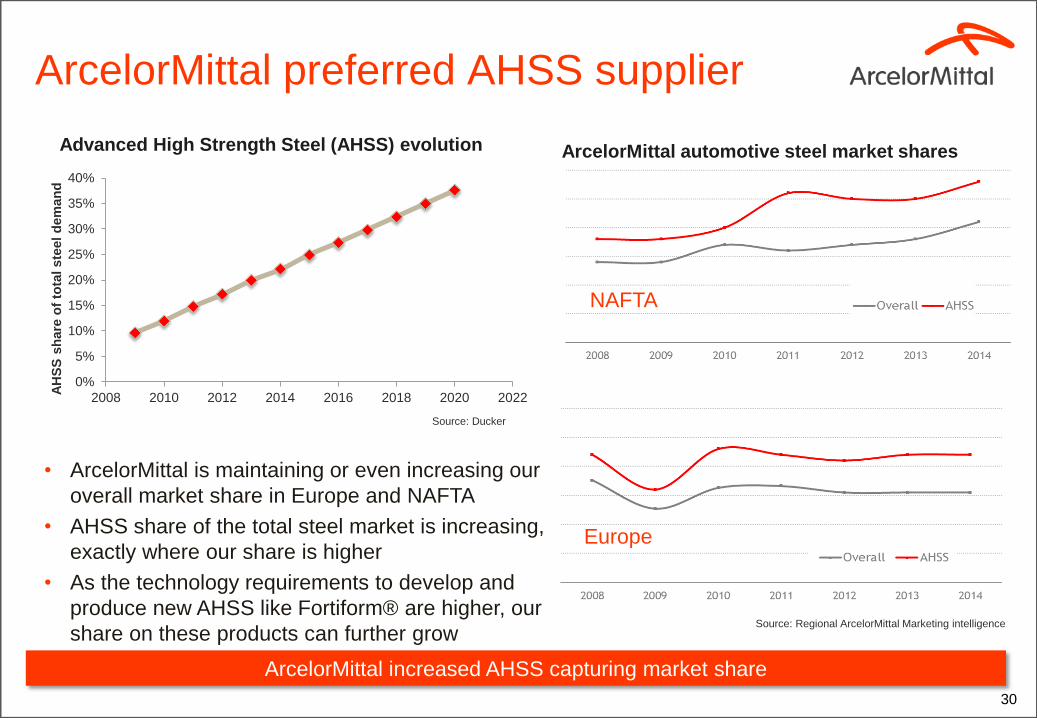
ArcelorMittal preferred AHSS supplier
ArcelorMittal increased AHSS capturing market share
0%
5%
10%
15%
20%
25%
30%
35%
40%
2008 2010 2012 2014 2016 2018 2020 2022
AH
SS
sh
are
of
tota
l ste
el
dem
an
d
Advanced High Strength Steel (AHSS) evolution
NAFTA
ArcelorMittal automotive steel market shares
Europe
• ArcelorMittal is maintaining or even increasing our
overall market share in Europe and NAFTA
• AHSS share of the total steel market is increasing,
exactly where our share is higher
• As the technology requirements to develop and
produce new AHSS like Fortiform® are higher, our
share on these products can further grow
Source: Ducker
Source: Regional ArcelorMittal Marketing intelligence
31
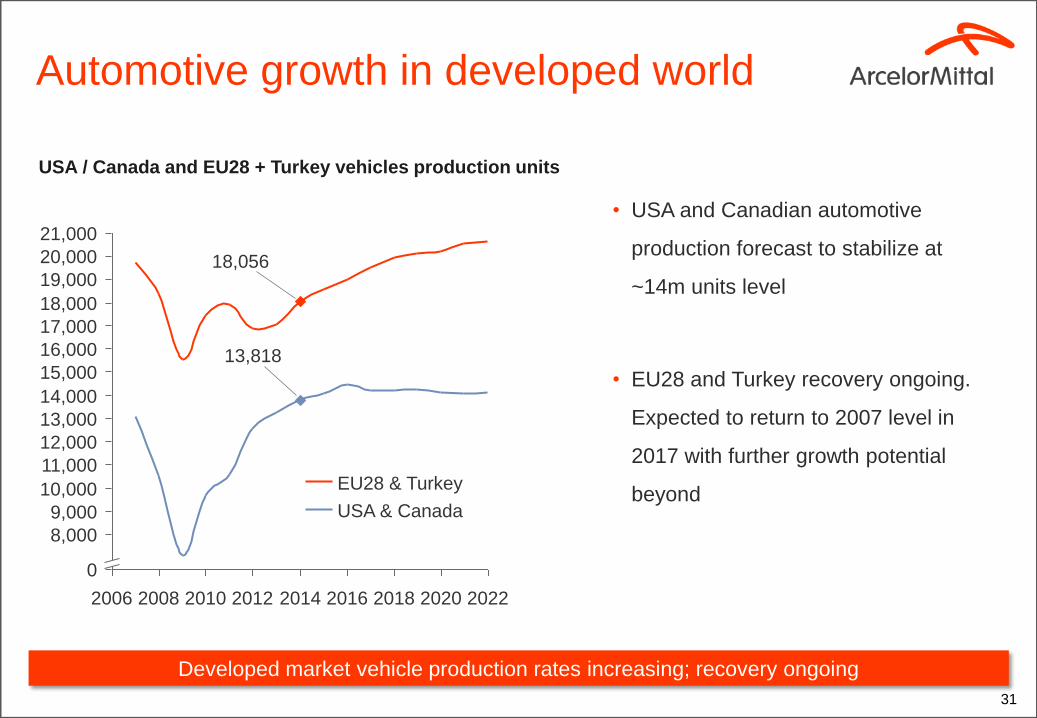
Automotive growth in developed world
Developed market vehicle production rates increasing; recovery ongoing
USA / Canada and EU28 + Turkey vehicles production units
• USA and Canadian automotive
production forecast to stabilize at
~14m units level
• EU28 and Turkey recovery ongoing.
Expected to return to 2007 level in
2017 with further growth potential
beyond
2020 2018 2014 2012 2010 2008 2006 2016
8,000
11,000
10,000
9,000
0
2022
21,000
20,000
19,000
18,000
17,000
16,000
15,000
14,000
13,000
12,000
13,818
18,056
USA & Canada
EU28 & Turkey
32
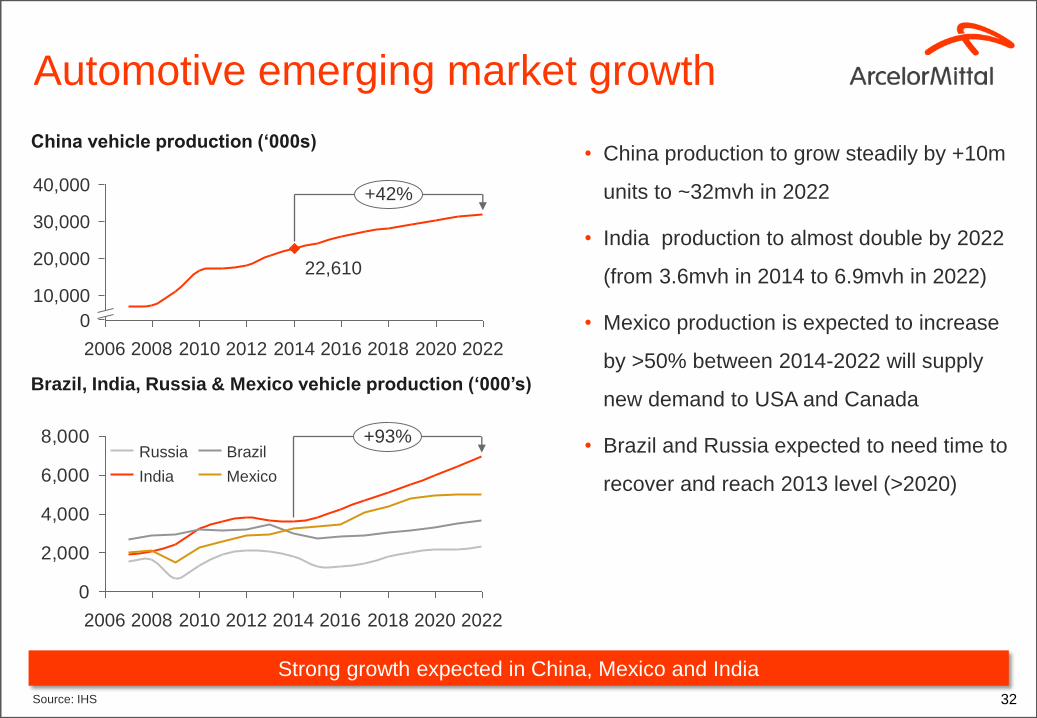
Automotive emerging market growth
Strong growth expected in China, Mexico and India
China vehicle production (‘000s) • China production to grow steadily by +10m
units to ~32mvh in 2022
• India production to almost double by 2022
(from 3.6mvh in 2014 to 6.9mvh in 2022)
• Mexico production is expected to increase
by >50% between 2014-2022 will supply
new demand to USA and Canada
• Brazil and Russia expected to need time to
recover and reach 2013 level (>2020)
40,000
30,000
20,000
10,000
0
2022 2020 2018 2016 2014 2012 2010 2008 2006
+42%
22,610
0
2,000
4,000
6,000
8,000
2020 2018 2016 2014 2012 2010 2008 2006 2022
+93%
Mexico India
Brazil Russia
Brazil, India, Russia & Mexico vehicle production (‘000’s)
Source: IHS
33
Technology leadership ranking by
customers
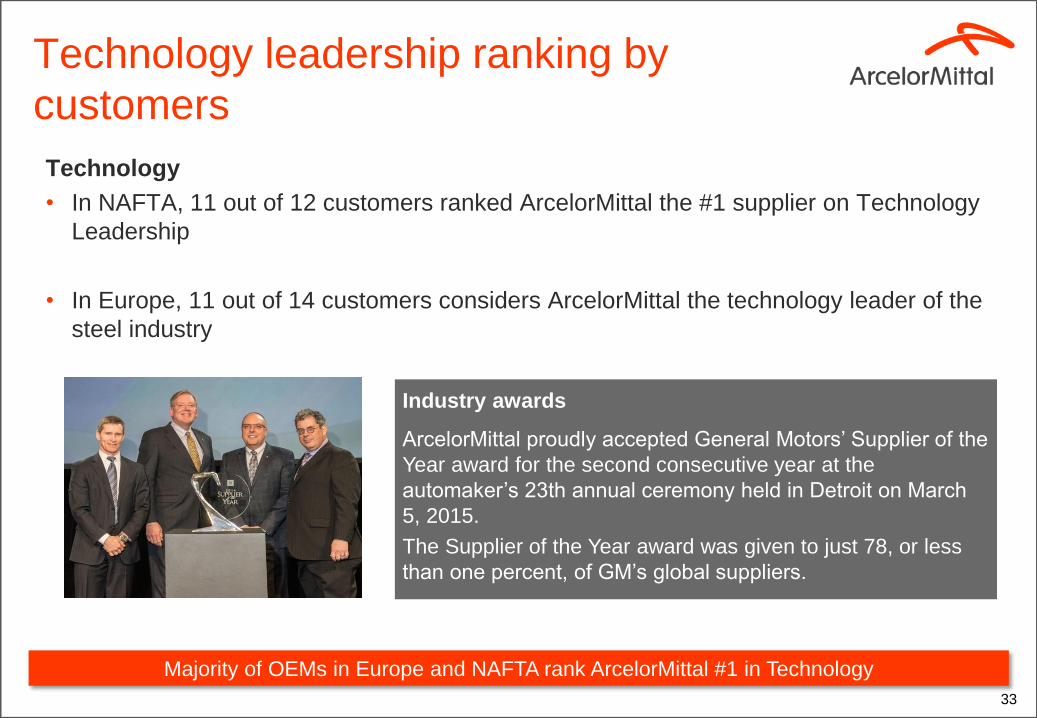
Technology
• In NAFTA, 11 out of 12 customers ranked ArcelorMittal the #1 supplier on Technology
Leadership
• In Europe, 11 out of 14 customers considers ArcelorMittal the technology leader of the
steel industry
Industry awards
ArcelorMittal proudly accepted General Motors’ Supplier of the
Year award for the second consecutive year at the
automaker’s 23th annual ceremony held in Detroit on March
5, 2015.
The Supplier of the Year award was given to just 78, or less
than one percent, of GM’s global suppliers.
Majority of OEMs in Europe and NAFTA rank ArcelorMittal #1 in Technology
34
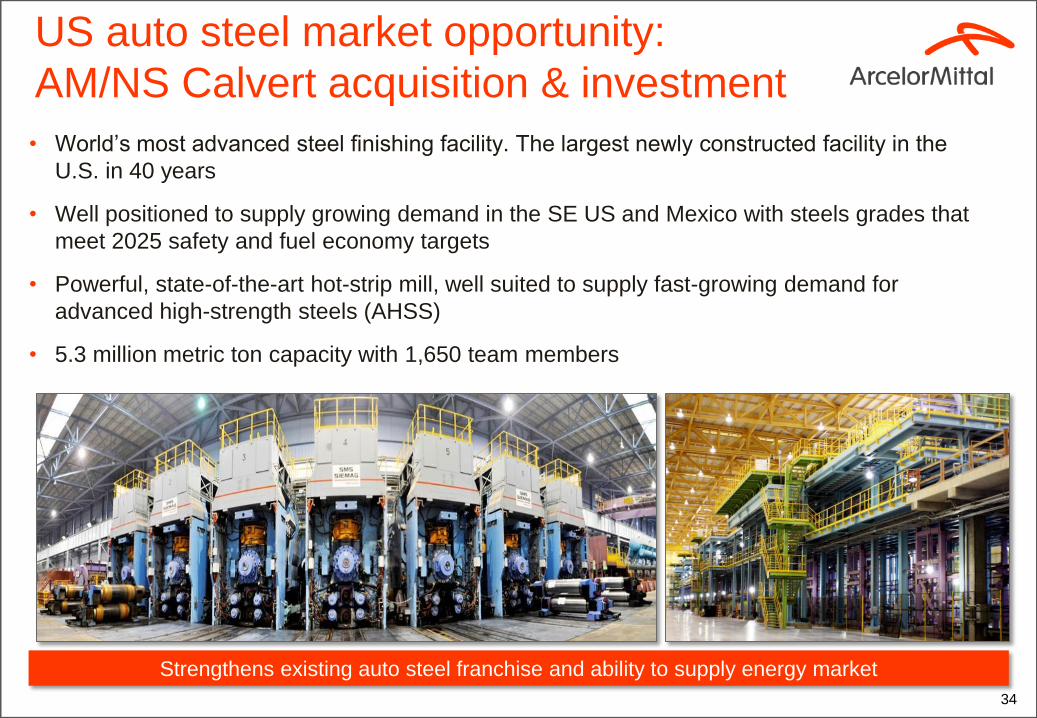
Strengthens existing auto steel franchise and ability to supply energy market
• World’s most advanced steel finishing facility. The largest newly constructed facility in the
U.S. in 40 years
• Well positioned to supply growing demand in the SE US and Mexico with steels grades that
meet 2025 safety and fuel economy targets
• Powerful, state-of-the-art hot-strip mill, well suited to supply fast-growing demand for
advanced high-strength steels (AHSS)
• 5.3 million metric ton capacity with 1,650 team members
US auto steel market opportunity:
AM/NS Calvert acquisition & investment
Shanghai
VAMA
FAW-VW & BMW
Daimler & Nissan
BYD, Changan, Suzuki, CFMA & FAW-VW
Changfeng, Fiat, DPCA, Dongfeng, Honda, JMC & Suzuki
Geely, VW, GM, KIA, SAIC & Chery
SAIC, Toyota, GM, Honda, Nissan & BYD
Beijing
Guangzhou
Loudi
35
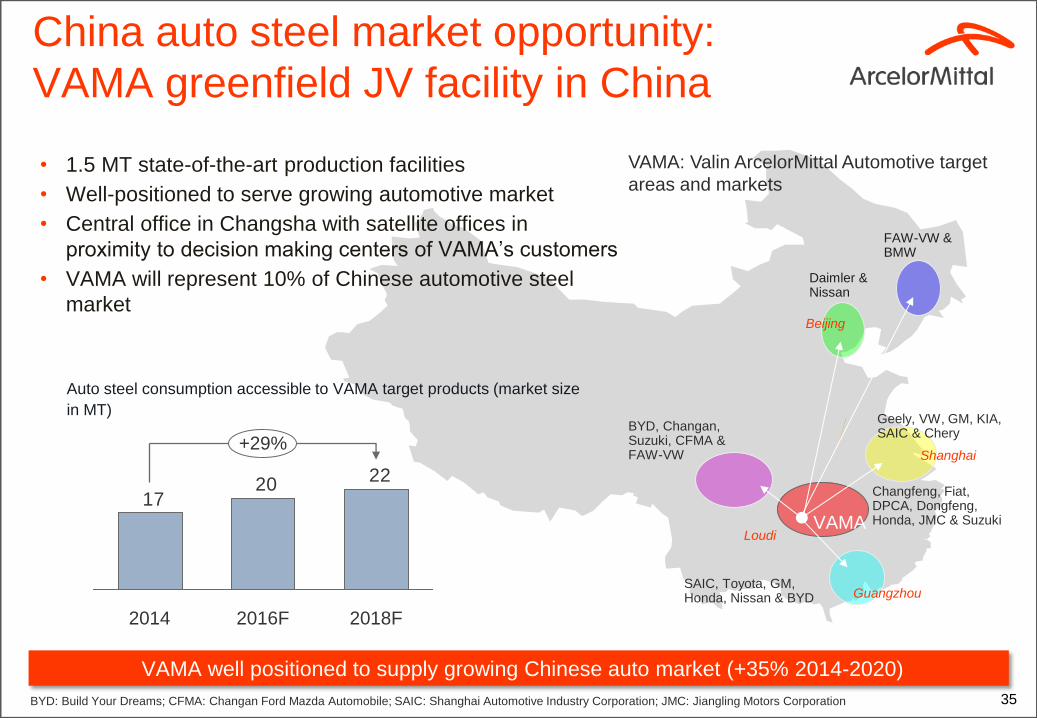
•VAMA well positioned to supply growing Chinese auto market (+35% 2014-2020)
China auto steel market opportunity:
VAMA greenfield JV facility in China
2220
17
2018F 2016F 2014
+29%
Auto steel consumption accessible to VAMA target products (market size
in MT)
VAMA: Valin ArcelorMittal Automotive target
areas and markets
• 1.5 MT state-of-the-art production facilities
• Well-positioned to serve growing automotive market
• Central office in Changsha with satellite offices in
proximity to decision making centers of VAMA’s customers
• VAMA will represent 10% of Chinese automotive steel
market
BYD: Build Your Dreams; CFMA: Changan Ford Mazda Automobile; SAIC: Shanghai Automotive Industry Corporation; JMC: Jiangling Motors Corporation
36
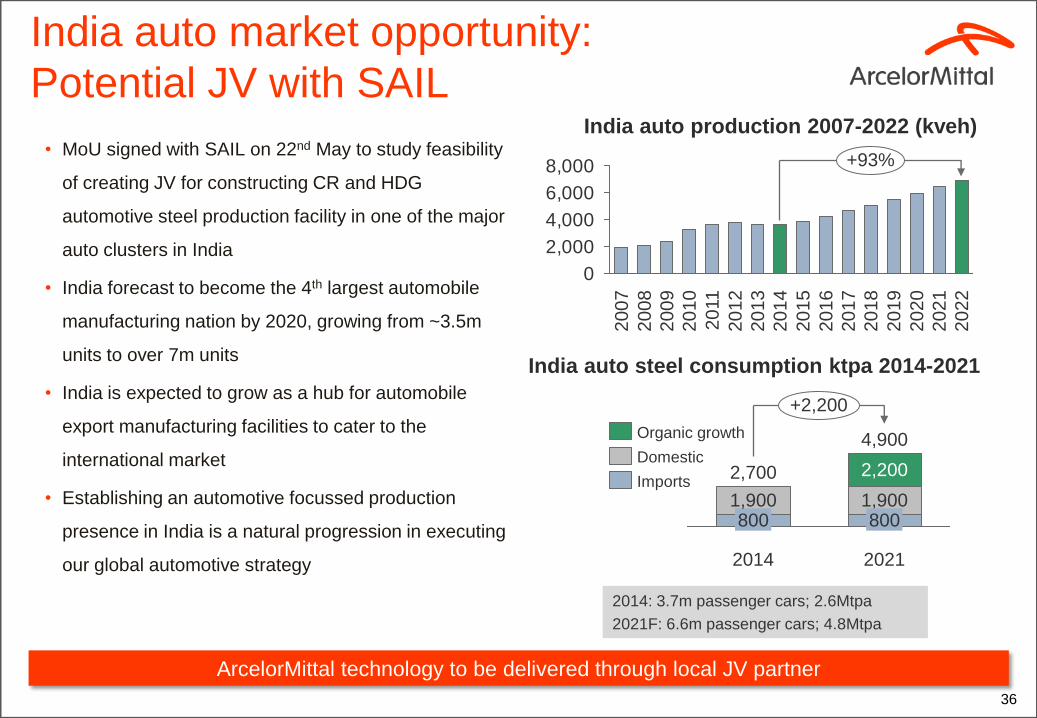
ArcelorMittal technology to be delivered through local JV partner
• MoU signed with SAIL on 22nd May to study feasibility
of creating JV for constructing CR and HDG
automotive steel production facility in one of the major
auto clusters in India
• India forecast to become the 4th largest automobile
manufacturing nation by 2020, growing from ~3.5m
units to over 7m units
• India is expected to grow as a hub for automobile
export manufacturing facilities to cater to the
international market
• Establishing an automotive focussed production
presence in India is a natural progression in executing
our global automotive strategy
0
2,000
4,000
6,000
8,000 +93%
2022
2021
2020
2019
2018
2017
2016
2015
2014
2013
2012
20
11
2010
2009
2008
2007
India auto production 2007-2022 (kveh)
2,200
1,900 800 800
2021
+2,200
2,700
2014
1,900
4,900
Imports
Domestic
Organic growth
India auto steel consumption ktpa 2014-2021
2014: 3.7m passenger cars; 2.6Mtpa
2021F: 6.6m passenger cars; 4.8Mtpa
India auto market opportunity:
Potential JV with SAIL
37
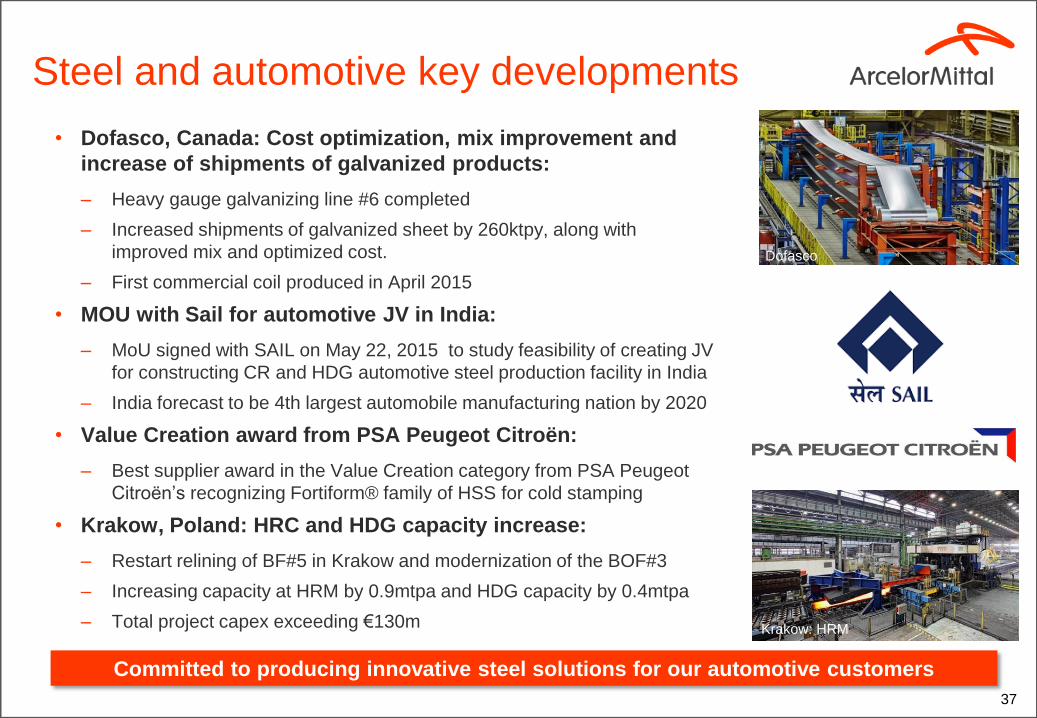
• Dofasco, Canada: Cost optimization, mix improvement and
increase of shipments of galvanized products:
– Heavy gauge galvanizing line #6 completed
– Increased shipments of galvanized sheet by 260ktpy, along with
improved mix and optimized cost.
– First commercial coil produced in April 2015
• MOU with Sail for automotive JV in India:
– MoU signed with SAIL on May 22, 2015 to study feasibility of creating JV
for constructing CR and HDG automotive steel production facility in India
– India forecast to be 4th largest automobile manufacturing nation by 2020
• Value Creation award from PSA Peugeot Citroën:
– Best supplier award in the Value Creation category from PSA Peugeot
Citroën’s recognizing Fortiform® family of HSS for cold stamping
• Krakow, Poland: HRC and HDG capacity increase:
– Restart relining of BF#5 in Krakow and modernization of the BOF#3
– Increasing capacity at HRM by 0.9mtpa and HDG capacity by 0.4mtpa
– Total project capex exceeding €130m
Committed to producing innovative steel solutions for our automotive customers
Steel and automotive key developments
Krakow: HRM
Dofasco
38
Mont Wright, Canada
Mining
South Africa
Iron Ore**
* Includes share of production
** Includes purchases made under July 2010 interim agreement with Kumba (South Africa)
1) Following an agreement signed off in December 2012, on February 20th, 2013, Nunavut Iron Ore subscribed for new shares in Baffinland Iron Mines Corporation which diluted AM’s stake to 50%
2) January 2nd, 2013 AM entered into an agreement to sell 15% of its stake in AM Mines Canada to a consortium lead POSCO and China Steel Corporation (CSC).
3) New exploration projects, Indian Iron Ore & Coal exploration , Coal of Africa (9.71%) and South Africa Manganese (50% ) are excluded in the above .
4) On January 19, 2015, ArcelorMittal announced the sale of its interest in the Kuzbass Coal mines in the Kemerovo region of Siberia, Russia, to Russia’s National Fuel Company (NTK). This transaction closed on December 31, 2014.
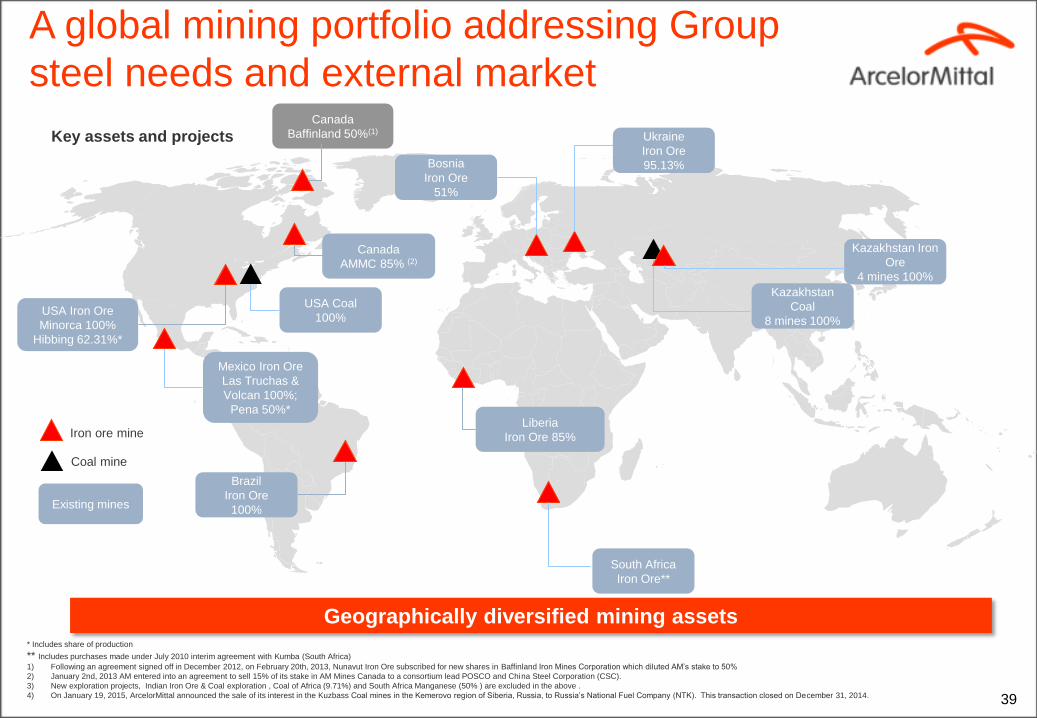
A global mining portfolio addressing Group
steel needs and external market
Key assets and projects
USA Iron Ore
Minorca 100%
Hibbing 62.31%*
Mexico Iron Ore
Las Truchas &
Volcan 100%;
Pena 50%* Liberia
Iron Ore 85%
Brazil
Iron Ore
100% Existing mines
Canada
AMMC 85% (2)
Bosnia
Iron Ore
51%
USA Coal
100%
Ukraine
Iron Ore
95.13%
Kazakhstan
Coal
8 mines 100%
Kazakhstan Iron
Ore
4 mines 100%
Iron ore mine
Coal mine
Canada
Baffinland 50%(1)
Geographically diversified mining assets
39
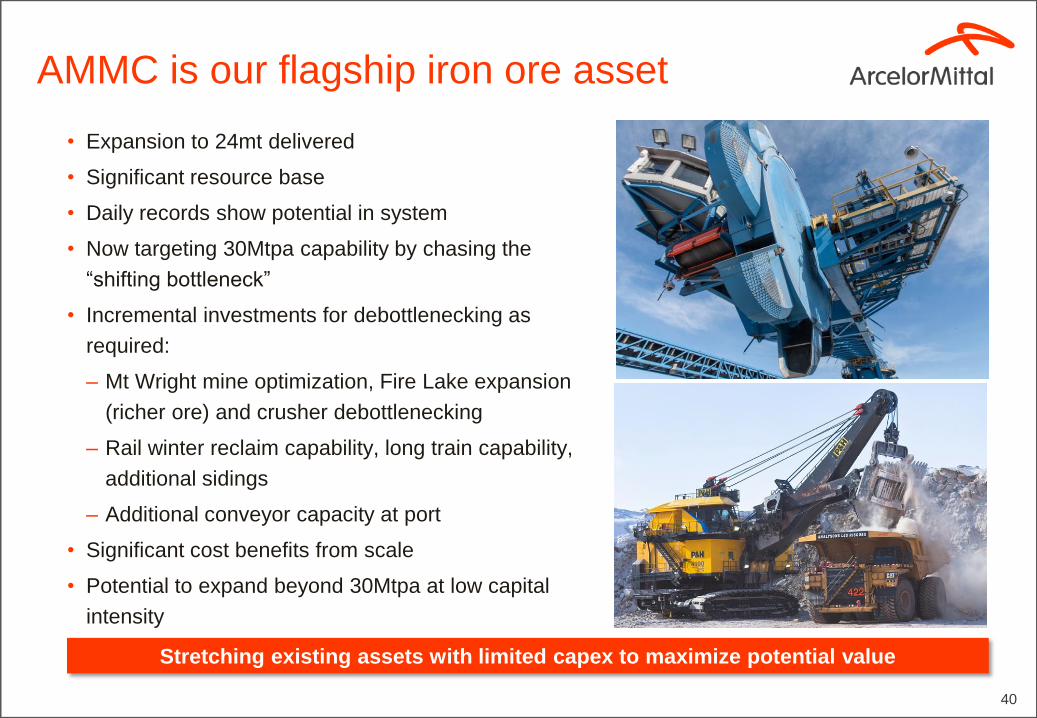
Stretching existing assets with limited capex to maximize potential value
AMMC is our flagship iron ore asset
• Expansion to 24mt delivered
• Significant resource base
• Daily records show potential in system
• Now targeting 30Mtpa capability by chasing the
“shifting bottleneck”
• Incremental investments for debottlenecking as
required:
– Mt Wright mine optimization, Fire Lake expansion
(richer ore) and crusher debottlenecking
– Rail winter reclaim capability, long train capability,
additional sidings
– Additional conveyor capacity at port
• Significant cost benefits from scale
• Potential to expand beyond 30Mtpa at low capital
intensity
40
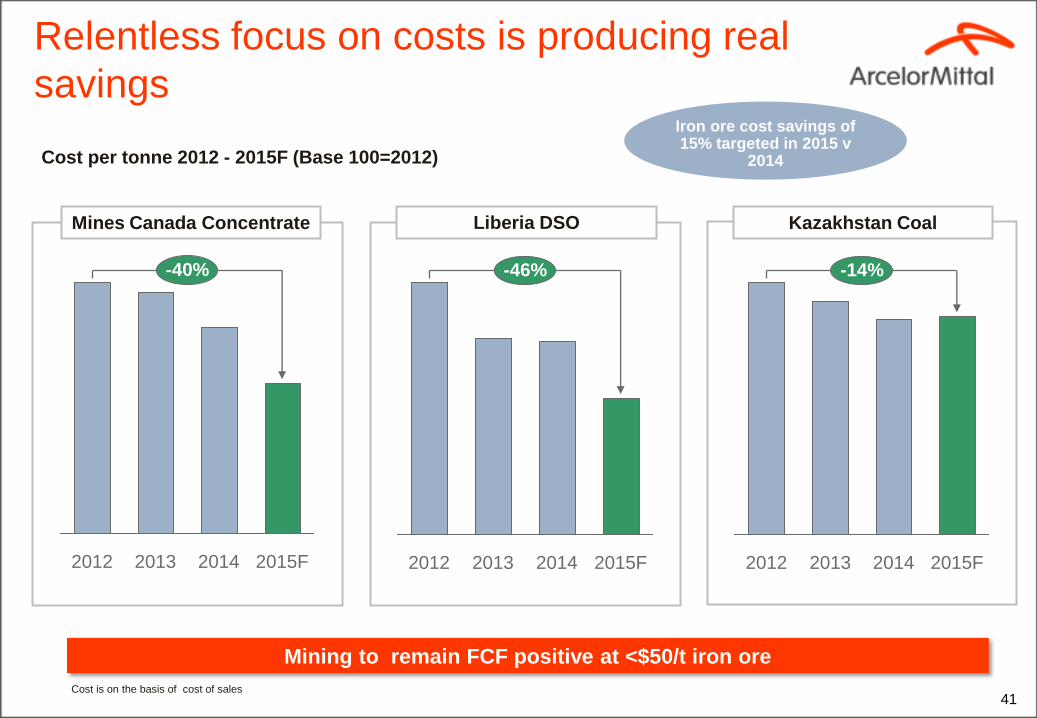
Cost per tonne 2012 - 2015F (Base 100=2012)
41
-40%
2015F 2014 2013 2012 2015F 2014 2013 2012
-46%
2015F 2014
-14%
2012 2013
Relentless focus on costs is producing real
savings
Cost is on the basis of cost of sales
Mining to remain FCF positive at <$50/t iron ore
Iron ore cost savings of 15% targeted in 2015 v
2014
Mines Canada Concentrate Liberia DSO Kazakhstan Coal
42
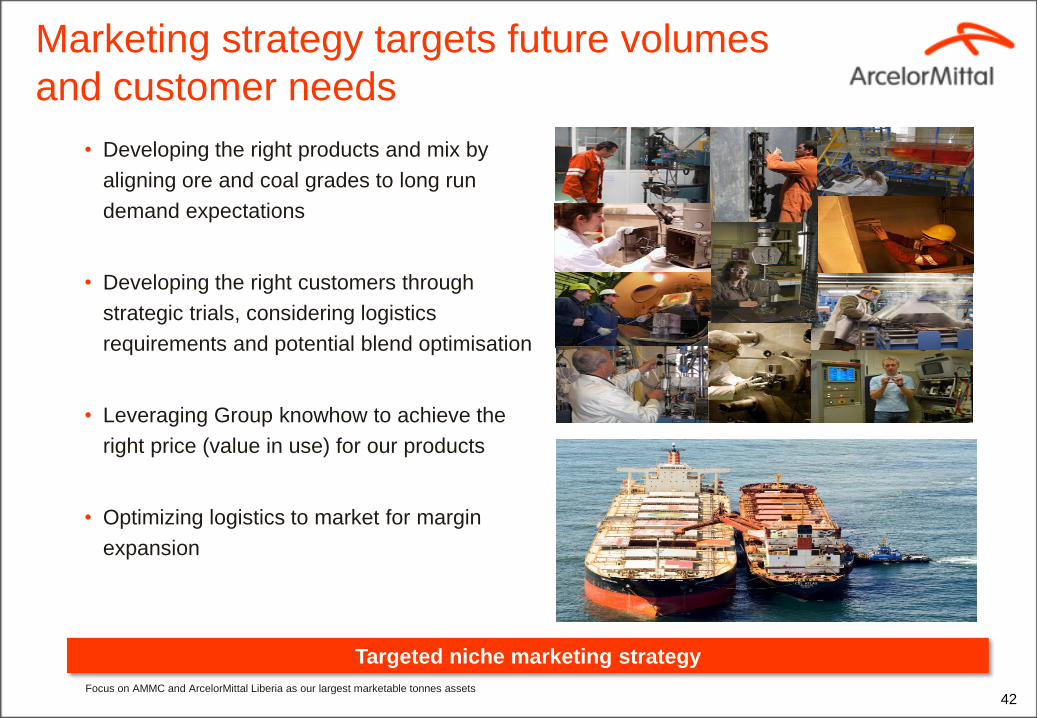
• Developing the right products and mix by
aligning ore and coal grades to long run
demand expectations
• Developing the right customers through
strategic trials, considering logistics
requirements and potential blend optimisation
• Leveraging Group knowhow to achieve the
right price (value in use) for our products
• Optimizing logistics to market for margin
expansion
Focus on AMMC and ArcelorMittal Liberia as our largest marketable tonnes assets
Marketing strategy targets future volumes
and customer needs
Targeted niche marketing strategy
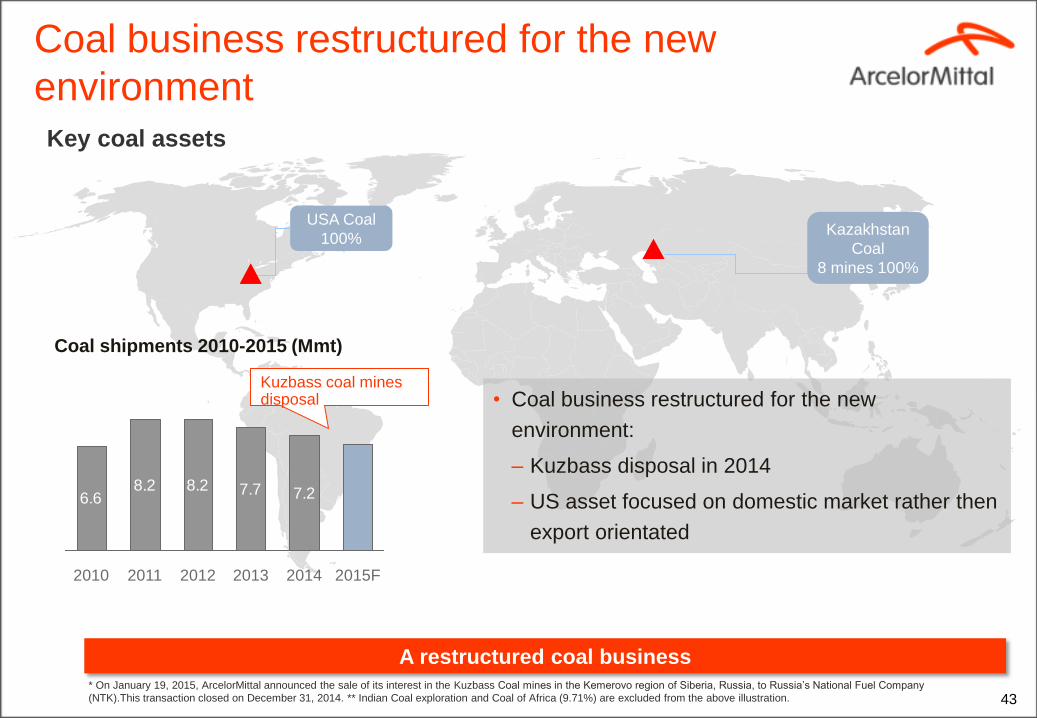
Key coal assets
USA Coal
100% Kazakhstan
Coal
8 mines 100%
Coal shipments 2010-2015 (Mmt)
A restructured coal business
Coal business restructured for the new
environment
6.68.2 8.2 7.7 7.2
2010 2014 2015F 2013 2012 2011
* On January 19, 2015, ArcelorMittal announced the sale of its interest in the Kuzbass Coal mines in the Kemerovo region of Siberia, Russia, to Russia’s National Fuel Company
(NTK).This transaction closed on December 31, 2014. ** Indian Coal exploration and Coal of Africa (9.71%) are excluded from the above illustration.
• Coal business restructured for the new
environment:
‒ Kuzbass disposal in 2014
‒ US asset focused on domestic market rather then
export orientated
Kuzbass coal mines disposal
43

Steel investments
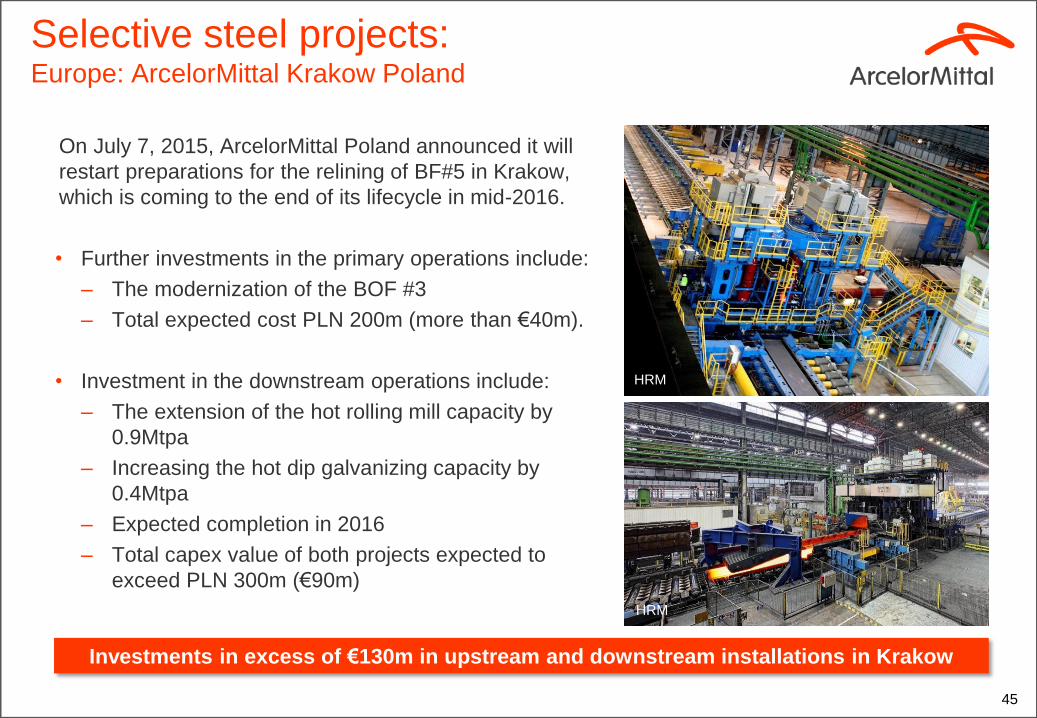
Selective steel projects: Europe: ArcelorMittal Krakow Poland
On July 7, 2015, ArcelorMittal Poland announced it will
restart preparations for the relining of BF#5 in Krakow,
which is coming to the end of its lifecycle in mid-2016.
• Further investments in the primary operations include:
– The modernization of the BOF #3
– Total expected cost PLN 200m (more than €40m).
• Investment in the downstream operations include:
– The extension of the hot rolling mill capacity by
0.9Mtpa
– Increasing the hot dip galvanizing capacity by
0.4Mtpa
– Expected completion in 2016
– Total capex value of both projects expected to
exceed PLN 300m (€90m)
45 45
Investments in excess of €130m in upstream and downstream installations in Krakow
HRM Krakow
HRM
HRM
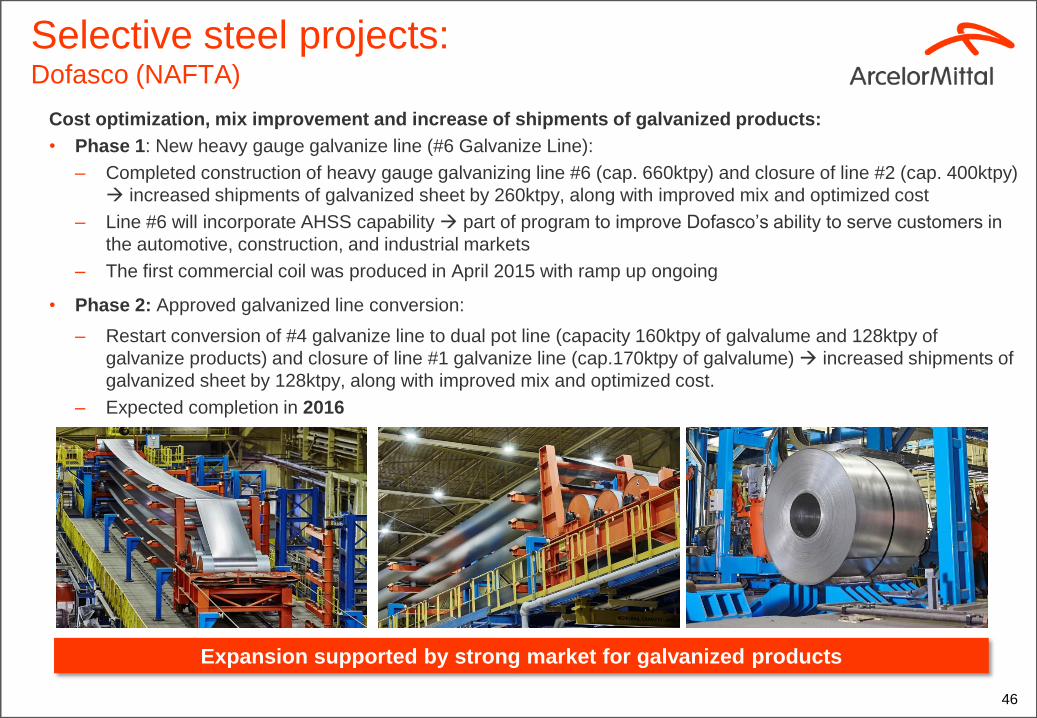
Selective steel projects: Dofasco (NAFTA)
Cost optimization, mix improvement and increase of shipments of galvanized products:
• Phase 1: New heavy gauge galvanize line (#6 Galvanize Line):
– Completed construction of heavy gauge galvanizing line #6 (cap. 660ktpy) and closure of line #2 (cap. 400ktpy)
increased shipments of galvanized sheet by 260ktpy, along with improved mix and optimized cost
– Line #6 will incorporate AHSS capability part of program to improve Dofasco’s ability to serve customers in
the automotive, construction, and industrial markets
– The first commercial coil was produced in April 2015 with ramp up ongoing
• Phase 2: Approved galvanized line conversion:
– Restart conversion of #4 galvanize line to dual pot line (capacity 160ktpy of galvalume and 128ktpy of
galvanize products) and closure of line #1 galvanize line (cap.170ktpy of galvalume) increased shipments of
galvanized sheet by 128ktpy, along with improved mix and optimized cost.
– Expected completion in 2016
46
Expansion supported by strong market for galvanized products
Temper mill
46
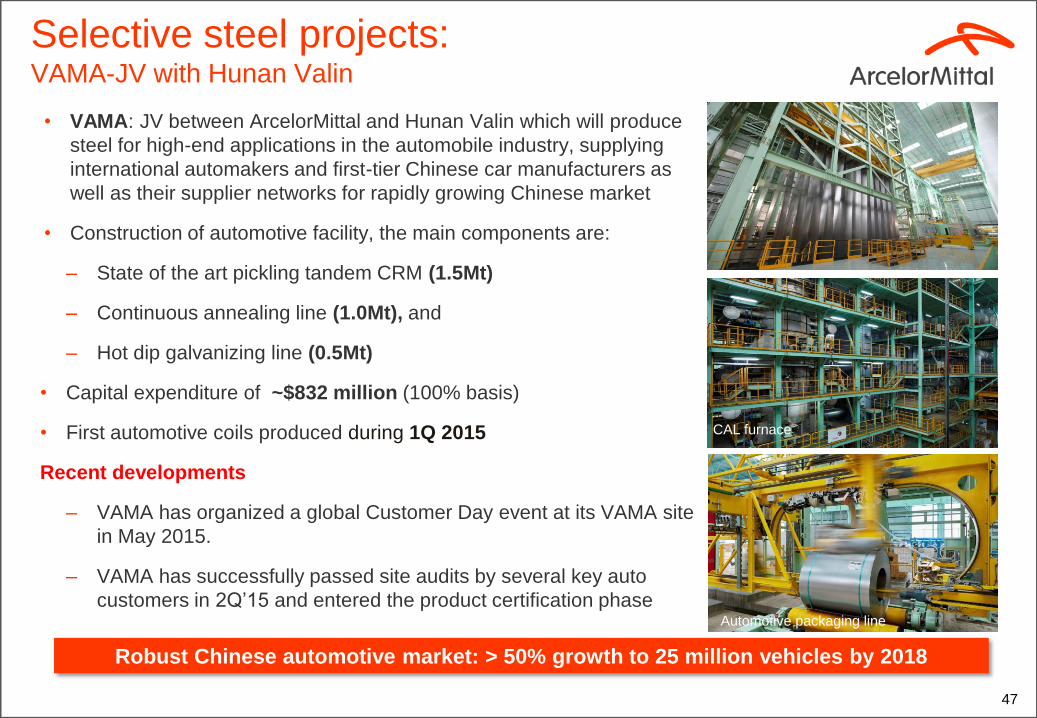
Selective steel projects: VAMA-JV with Hunan Valin
• VAMA: JV between ArcelorMittal and Hunan Valin which will produce
steel for high-end applications in the automobile industry, supplying
international automakers and first-tier Chinese car manufacturers as
well as their supplier networks for rapidly growing Chinese market
• Construction of automotive facility, the main components are:
– State of the art pickling tandem CRM (1.5Mt)
– Continuous annealing line (1.0Mt), and
– Hot dip galvanizing line (0.5Mt)
• Capital expenditure of ~$832 million (100% basis)
• First automotive coils produced during 1Q 2015
Recent developments
– VAMA has organized a global Customer Day event at its VAMA site
in May 2015.
– VAMA has successfully passed site audits by several key auto
customers in 2Q’15 and entered the product certification phase
47 47
Robust Chinese automotive market: > 50% growth to 25 million vehicles by 2018
CAL furnace
Automotive packaging line
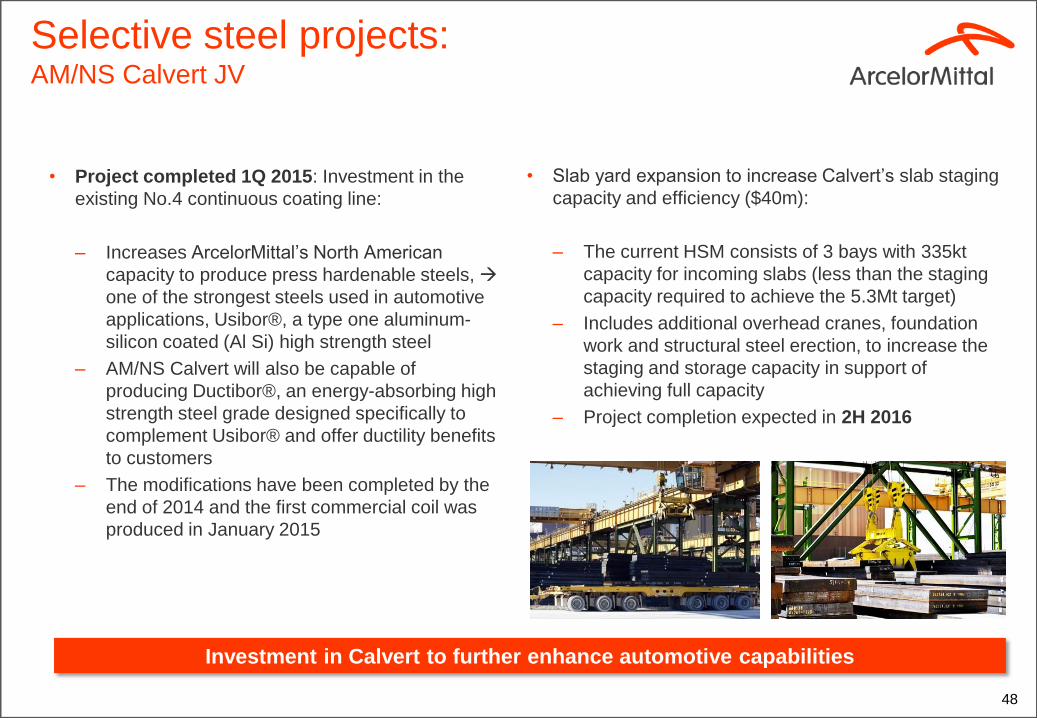
• Slab yard expansion to increase Calvert’s slab staging
capacity and efficiency ($40m):
– The current HSM consists of 3 bays with 335kt
capacity for incoming slabs (less than the staging
capacity required to achieve the 5.3Mt target)
– Includes additional overhead cranes, foundation
work and structural steel erection, to increase the
staging and storage capacity in support of
achieving full capacity
– Project completion expected in 2H 2016
• Project completed 1Q 2015: Investment in the
existing No.4 continuous coating line:
– Increases ArcelorMittal’s North American
capacity to produce press hardenable steels,
one of the strongest steels used in automotive
applications, Usibor®, a type one aluminum-
silicon coated (Al Si) high strength steel
– AM/NS Calvert will also be capable of
producing Ductibor®, an energy-absorbing high
strength steel grade designed specifically to
complement Usibor® and offer ductility benefits
to customers
– The modifications have been completed by the
end of 2014 and the first commercial coil was
produced in January 2015
48 48
Investment in Calvert to further enhance automotive capabilities
Selective steel projects: AM/NS Calvert JV
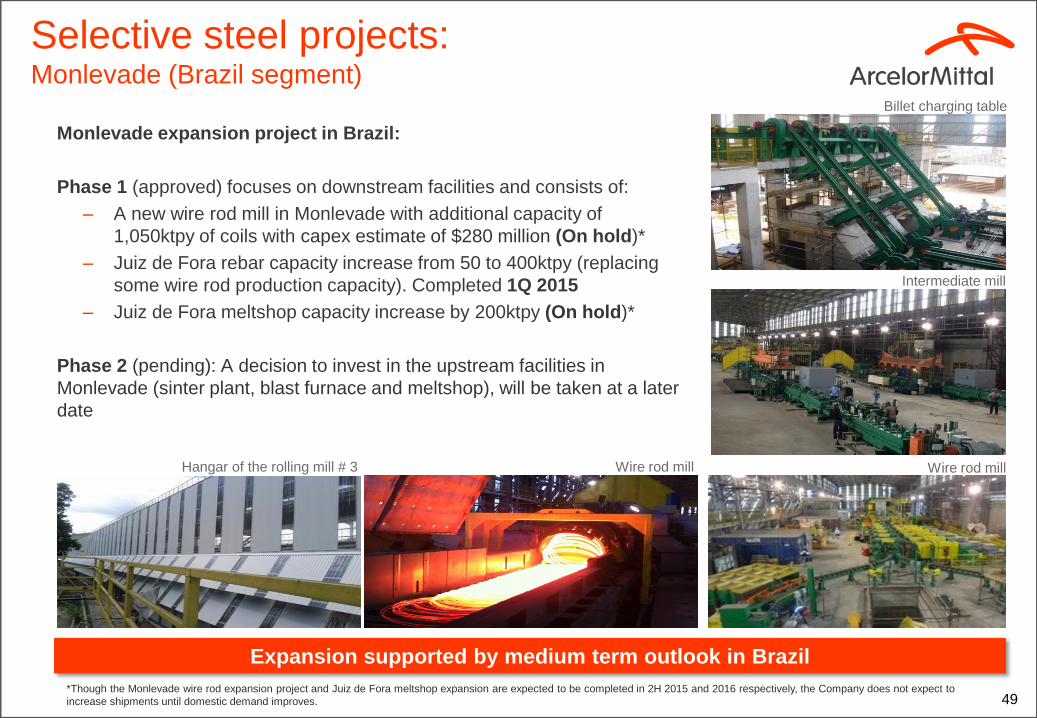
Monlevade expansion project in Brazil:
Phase 1 (approved) focuses on downstream facilities and consists of:
– A new wire rod mill in Monlevade with additional capacity of
1,050ktpy of coils with capex estimate of $280 million (On hold)*
– Juiz de Fora rebar capacity increase from 50 to 400ktpy (replacing
some wire rod production capacity). Completed 1Q 2015
– Juiz de Fora meltshop capacity increase by 200ktpy (On hold)*
Phase 2 (pending): A decision to invest in the upstream facilities in
Monlevade (sinter plant, blast furnace and meltshop), will be taken at a later
date
49
Selective steel projects: Monlevade (Brazil segment)
Expansion supported by medium term outlook in Brazil
Hangar of the rolling mill # 3
Intermediate mill
Wire rod mill
Billet charging table
Wire rod mill
*Though the Monlevade wire rod expansion project and Juiz de Fora meltshop expansion are expected to be completed in 2H 2015 and 2016 respectively, the Company does not expect to
increase shipments until domestic demand improves.
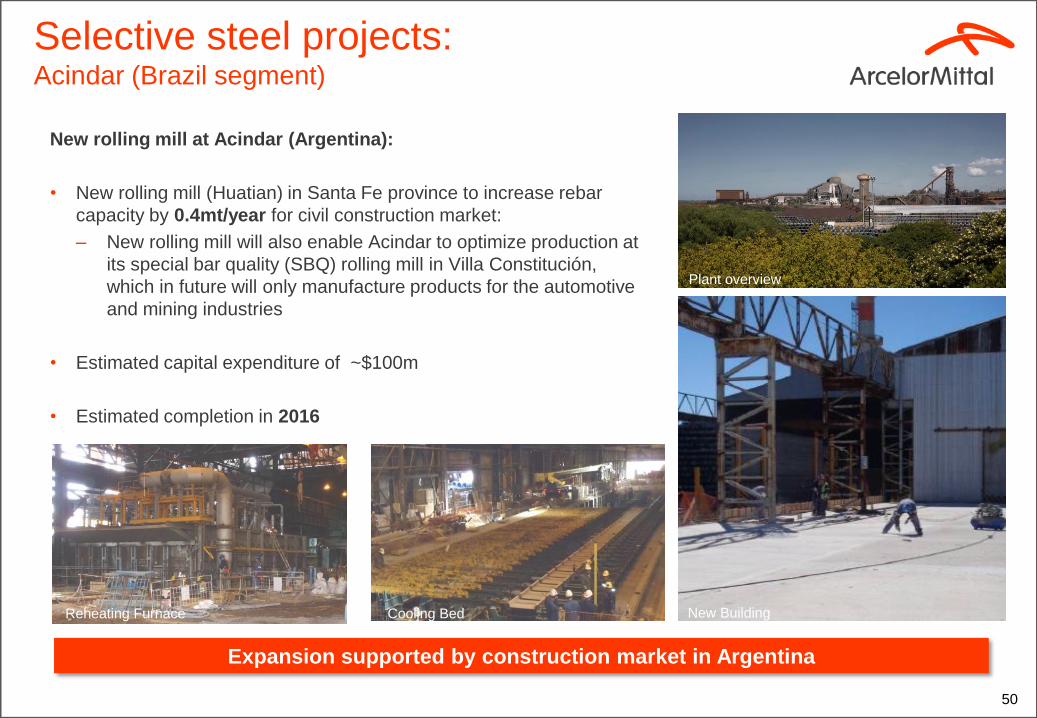
New rolling mill at Acindar (Argentina):
• New rolling mill (Huatian) in Santa Fe province to increase rebar
capacity by 0.4mt/year for civil construction market:
– New rolling mill will also enable Acindar to optimize production at
its special bar quality (SBQ) rolling mill in Villa Constitución,
which in future will only manufacture products for the automotive
and mining industries
• Estimated capital expenditure of ~$100m
• Estimated completion in 2016
50 50
Selective steel projects: Acindar (Brazil segment)
Expansion supported by construction market in Argentina
Plant overview
Plant overview
Reheating Furnace Cooling Bed New Building
Group overview
52
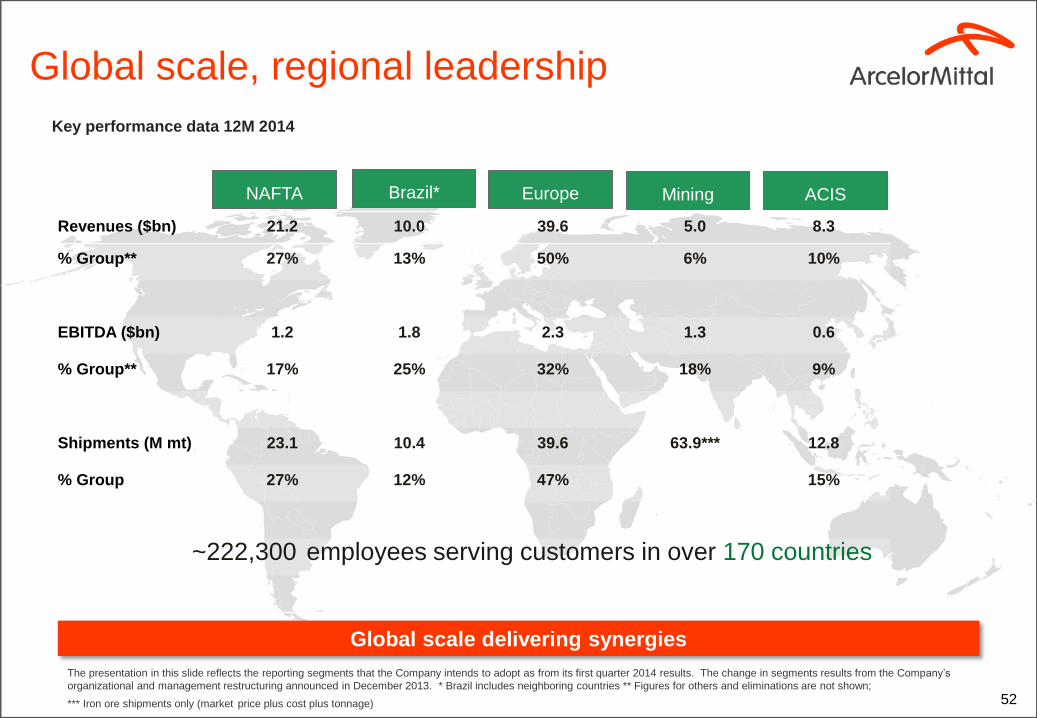
Global scale delivering synergies
Brazil*
Revenues ($bn) 21.2 10.0 39.6 5.0 8.3
% Group** 27% 13% 50% 6% 10%
EBITDA ($bn) 1.2 1.8 2.3 1.3 0.6
% Group** 17% 25% 32% 18% 9%
Shipments (M mt) 23.1 10.4 39.6 63.9*** 12.8
% Group 27% 12% 47% 15%
~222,300 employees serving customers in over 170 countries
Europe Mining ACIS
The presentation in this slide reflects the reporting segments that the Company intends to adopt as from its first quarter 2014 results. The change in segments results from the Company’s
organizational and management restructuring announced in December 2013. * Brazil includes neighboring countries ** Figures for others and eliminations are not shown;
*** Iron ore shipments only (market price plus cost plus tonnage)
NAFTA
Global scale, regional leadership
Key performance data 12M 2014
53
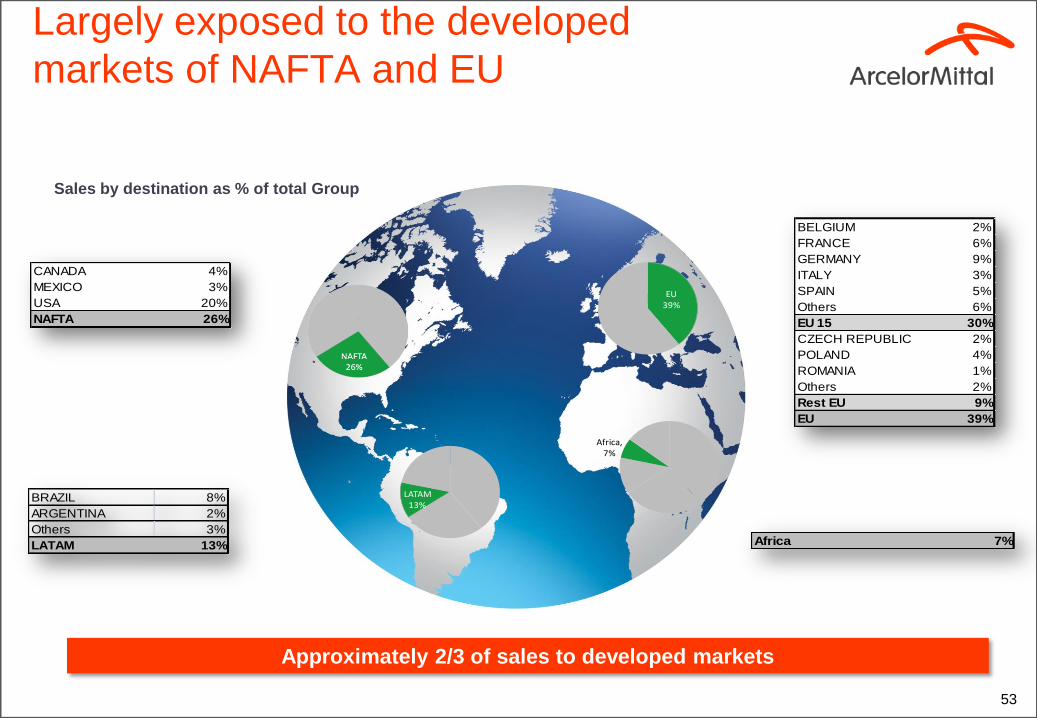
Africa 7%
BELGIUM 2%
FRANCE 6%
GERMANY 9%
ITALY 3%
SPAIN 5%
Others 6%
EU 15 30%
CZECH REPUBLIC 2%
POLAND 4%
ROMANIA 1%
Others 2%
Rest EU 9%
EU 39%
BRAZIL 8%
ARGENTINA 2%
Others 3%
LATAM 13%
EU39%
LATAM13%
Africa, 7%
Approximately 2/3 of sales to developed markets
CANADA 4%
MEXICO 3%
USA 20%
NAFTA 26%
Sales by destination as % of total Group
Largely exposed to the developed
markets of NAFTA and EU
54
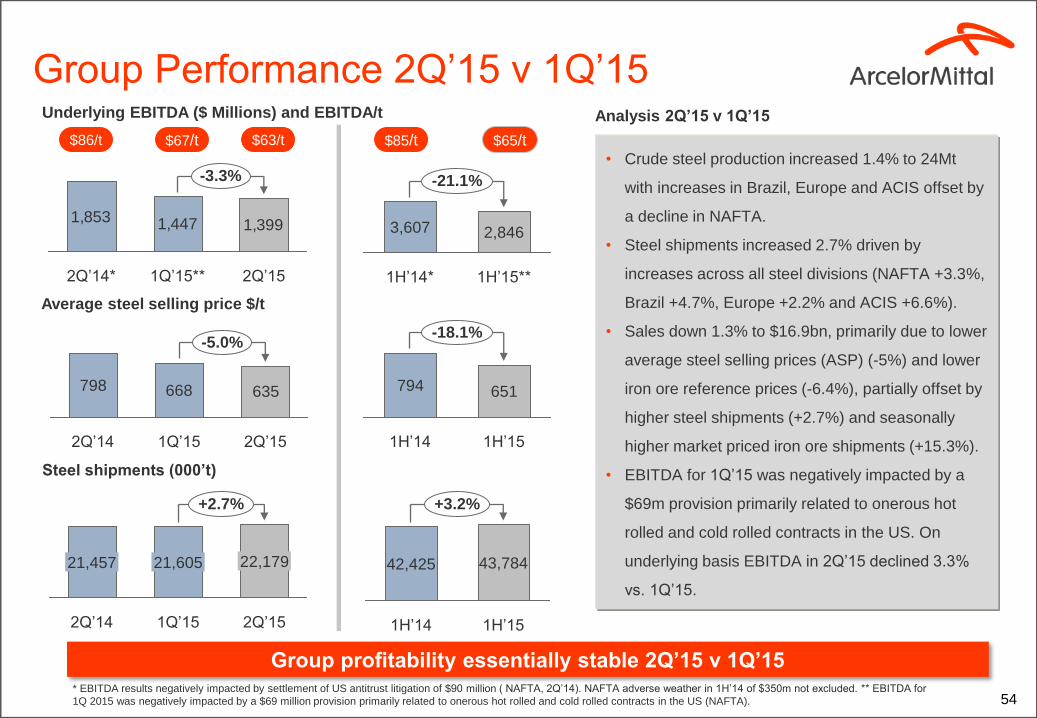
Group Performance 2Q’15 v 1Q’15
Average steel selling price $/t
* EBITDA results negatively impacted by settlement of US antitrust litigation of $90 million ( NAFTA, 2Q’14). NAFTA adverse weather in 1H’14 of $350m not excluded. ** EBITDA for
1Q 2015 was negatively impacted by a $69 million provision primarily related to onerous hot rolled and cold rolled contracts in the US (NAFTA).
• Crude steel production increased 1.4% to 24Mt
with increases in Brazil, Europe and ACIS offset by
a decline in NAFTA.
• Steel shipments increased 2.7% driven by
increases across all steel divisions (NAFTA +3.3%,
Brazil +4.7%, Europe +2.2% and ACIS +6.6%).
• Sales down 1.3% to $16.9bn, primarily due to lower
average steel selling prices (ASP) (-5%) and lower
iron ore reference prices (-6.4%), partially offset by
higher steel shipments (+2.7%) and seasonally
higher market priced iron ore shipments (+15.3%).
• EBITDA for 1Q’15 was negatively impacted by a
$69m provision primarily related to onerous hot
rolled and cold rolled contracts in the US. On
underlying basis EBITDA in 2Q’15 declined 3.3%
vs. 1Q’15.
Analysis 2Q’15 v 1Q’15
Steel shipments (000’t)
Underlying EBITDA ($ Millions) and EBITDA/t
798 668 635
-5.0%
2Q’15 1Q’15 2Q’14
+2.7%
2Q’15
22,179
1Q’15
21,605
2Q’14
21,457
1,853 1,447 1,399
-3.3%
2Q’15 1Q’15** 2Q’14*
Group profitability essentially stable 2Q’15 v 1Q’15
$86/t
+3.2%
1H’15
43,784
1H’14
42,425
-21.1%
1H’15**
2,846
1H’14*
3,607
794 651
-18.1%
1H’15 1H’14
$67/t $85/t $65/t $63/t
Improvement
55
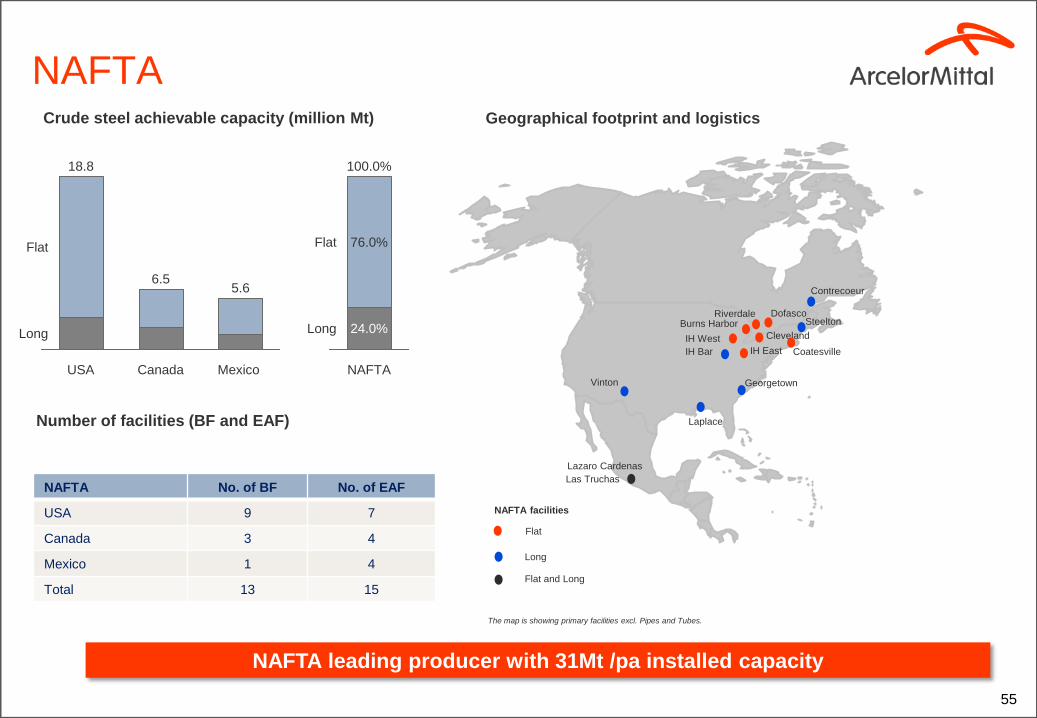
Crude steel achievable capacity (million Mt)
NAFTA
USA
Long
Flat
Canada
6.5
Mexico
5.6
18.8
Long
Flat
NAFTA
100.0%
24.0%
76.0%
Number of facilities (BF and EAF)
NAFTA No. of BF No. of EAF
USA 9 7
Canada 3 4
Mexico 1 4
Total 13 15
NAFTA leading producer with 31Mt /pa installed capacity
Geographical footprint and logistics
Burns Harbor Dofasco
Cleveland
IH East
IH West
Lazaro Cardenas
Coatesville
Georgetown
Laplace
Vinton
Steelton
Contrecoeur
Long
Flat
NAFTA facilities
The map is showing primary facilities excl. Pipes and Tubes.
Flat and Long
IH Bar
Las Truchas
Riverdale
56
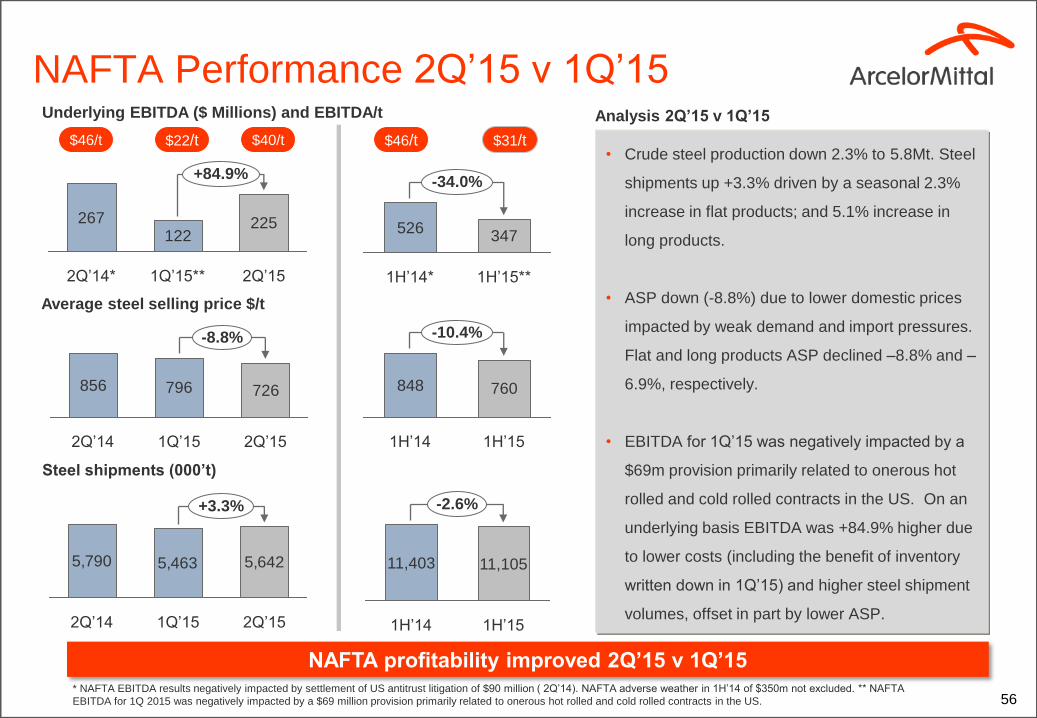
NAFTA Performance 2Q’15 v 1Q’15
Average steel selling price $/t
* NAFTA EBITDA results negatively impacted by settlement of US antitrust litigation of $90 million ( 2Q’14). NAFTA adverse weather in 1H’14 of $350m not excluded. ** NAFTA
EBITDA for 1Q 2015 was negatively impacted by a $69 million provision primarily related to onerous hot rolled and cold rolled contracts in the US.
Analysis 2Q’15 v 1Q’15
Steel shipments (000’t)
Underlying EBITDA ($ Millions) and EBITDA/t
856 796 726
-8.8%
2Q’15 1Q’15 2Q’14
5,790 5,463 5,642
+3.3%
2Q’15 1Q’15 2Q’14
267122
225
2Q’15
+84.9%
1Q’15** 2Q’14*
NAFTA profitability improved 2Q’15 v 1Q’15
$46/t
11,403
1H’14
11,105
1H’15
-2.6%
526347
1H’14* 1H’15**
-34.0%
848 760
1H’14
-10.4%
1H’15
$22/t $46/t $31/t $40/t
New
• Crude steel production down 2.3% to 5.8Mt. Steel
shipments up +3.3% driven by a seasonal 2.3%
increase in flat products; and 5.1% increase in
long products.
• ASP down (-8.8%) due to lower domestic prices
impacted by weak demand and import pressures.
Flat and long products ASP declined –8.8% and –
6.9%, respectively.
• EBITDA for 1Q’15 was negatively impacted by a
$69m provision primarily related to onerous hot
rolled and cold rolled contracts in the US. On an
underlying basis EBITDA was +84.9% higher due
to lower costs (including the benefit of inventory
written down in 1Q’15) and higher steel shipment
volumes, offset in part by lower ASP.
Improvement
57
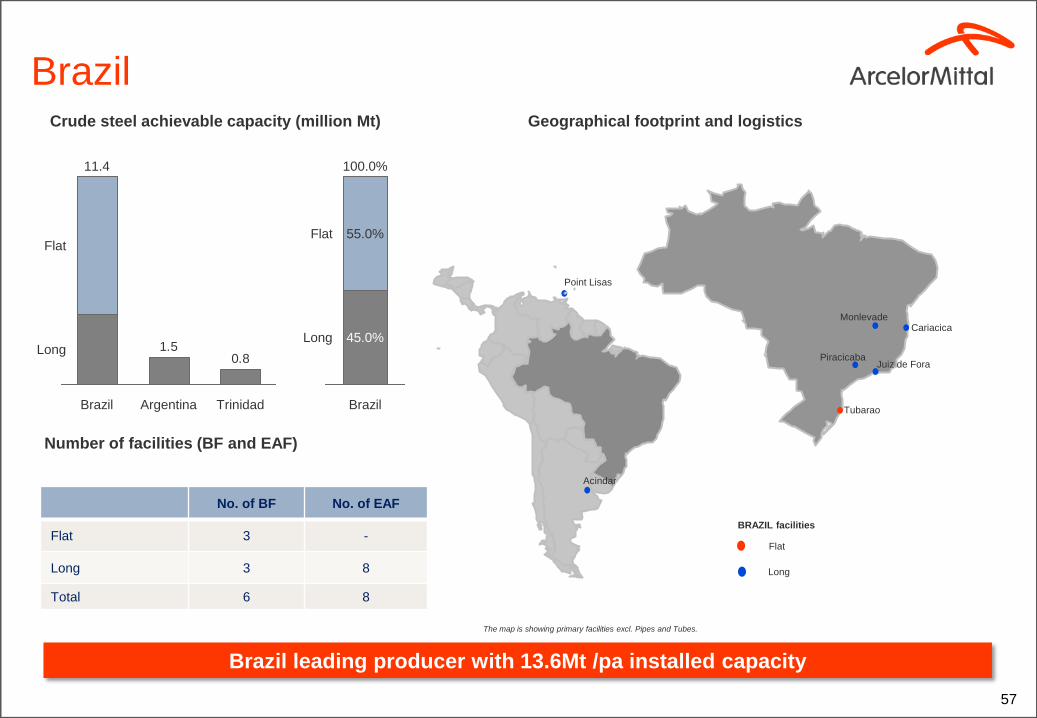
Crude steel achievable capacity (million Mt)
Brazil
0.81.5Long
Flat
Trinidad Argentina Brazil
11.4
Long
Flat
100.0%
Brazil
45.0%
55.0%
Number of facilities (BF and EAF)
No. of BF No. of EAF
Flat 3 -
Long 3 8
Total 6 8
Geographical footprint and logistics
Brazil leading producer with 13.6Mt /pa installed capacity
Cariacica
Long
Flat
BRAZIL facilities
Tubarao
Monlevade
Piracicaba
Point Lisas
The map is showing primary facilities excl. Pipes and Tubes.
Acindar
Juiz de Fora
58
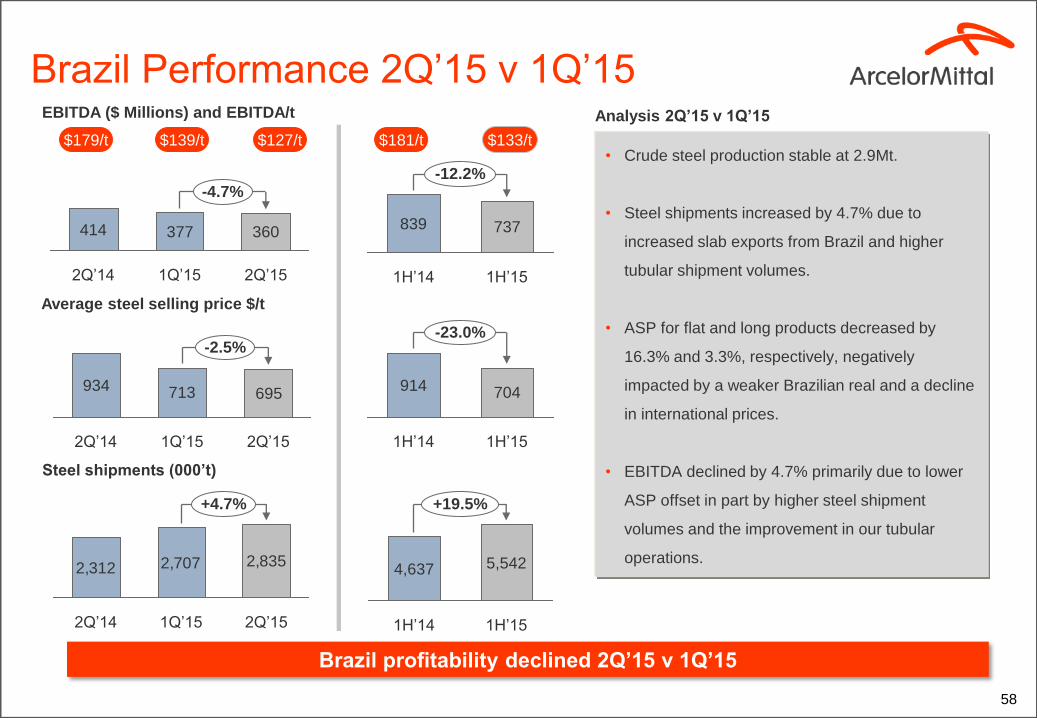
Brazil Performance 2Q’15 v 1Q’15
Average steel selling price $/t
Steel shipments (000’t)
EBITDA ($ Millions) and EBITDA/t
934 713 695
-2.5%
2Q’15 1Q’15 2Q’14
2,312 2,707 2,835
2Q’14 1Q’15 2Q’15
+4.7%
414 377 360
-4.7%
2Q’15 1Q’15 2Q’14
Brazil profitability declined 2Q’15 v 1Q’15
$179/t
5,542
1H’14 1H’15
+19.5%
4,637
839 737
-12.2%
1H’15 1H’14
914 704
1H’14
-23.0%
1H’15
$139/t $181/t $133/t $127/t
Analysis 2Q’15 v 1Q’15
• Crude steel production stable at 2.9Mt.
• Steel shipments increased by 4.7% due to
increased slab exports from Brazil and higher
tubular shipment volumes.
• ASP for flat and long products decreased by
16.3% and 3.3%, respectively, negatively
impacted by a weaker Brazilian real and a decline
in international prices.
• EBITDA declined by 4.7% primarily due to lower
ASP offset in part by higher steel shipment
volumes and the improvement in our tubular
operations.
Improvement
59
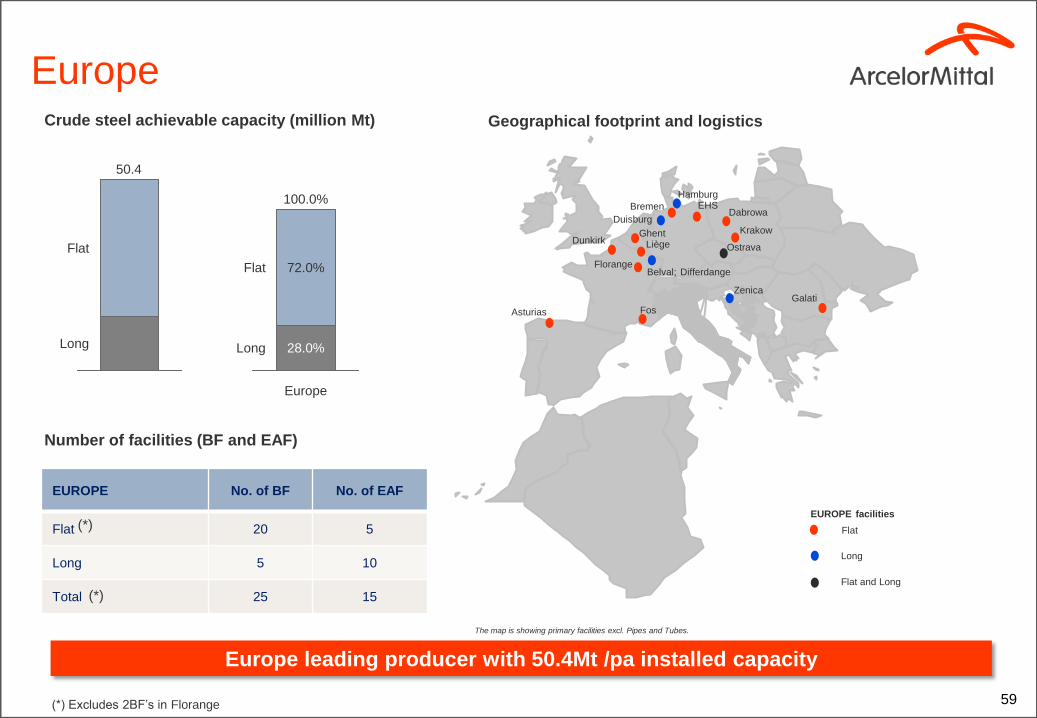
Crude steel achievable capacity (million Mt)
Europe leading producer with 50.4Mt /pa installed capacity
Europe
Long
Flat
50.4
Long
Flat
Europe
100.0%
28.0%
72.0%
Number of facilities (BF and EAF)
EUROPE No. of BF No. of EAF
Flat 20 5
Long 5 10
Total 25 15
Geographical footprint and logistics
The map is showing primary facilities excl. Pipes and Tubes.
Long
Flat
EUROPE facilities
Asturias
Dunkirk
Bremen
Florange
Liège Ghent
EHS Dabrowa
Krakow
Fos
Galati Zenica
Ostrava
Flat and Long
Duisburg
Hamburg
Belval; Differdange
(*) Excludes 2BF’s in Florange
(*)
(*)
60
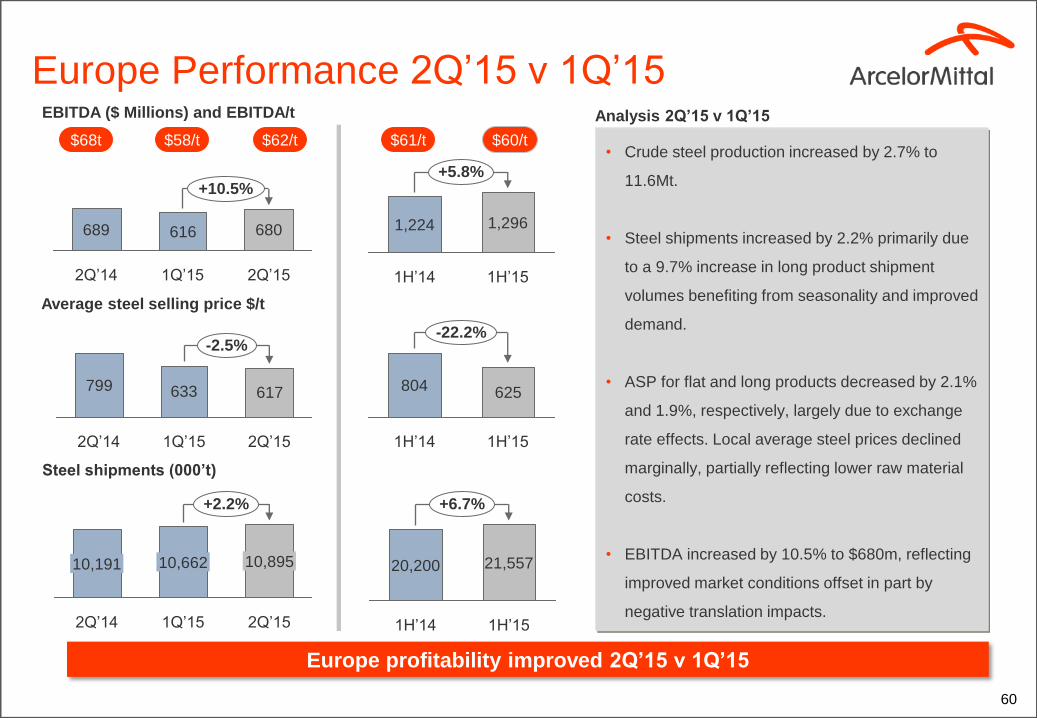
Europe Performance 2Q’15 v 1Q’15
Average steel selling price $/t
Steel shipments (000’t)
EBITDA ($ Millions) and EBITDA/t
799 633 617
2Q’14
-2.5%
2Q’15 1Q’15
+2.2%
10,895
2Q’15 1Q’15 2Q’14
10,662 10,191
689 616 680
+10.5%
2Q’15 1Q’15 2Q’14
Europe profitability improved 2Q’15 v 1Q’15
$68t
20,200
+6.7%
1H’15
21,557
1H’14
1,224
+5.8%
1H’15
1,296
1H’14
804 625
-22.2%
1H’15 1H’14
$58/t $61/t $60/t $62/t
Analysis 2Q’15 v 1Q’15
• Crude steel production increased by 2.7% to
11.6Mt.
• Steel shipments increased by 2.2% primarily due
to a 9.7% increase in long product shipment
volumes benefiting from seasonality and improved
demand.
• ASP for flat and long products decreased by 2.1%
and 1.9%, respectively, largely due to exchange
rate effects. Local average steel prices declined
marginally, partially reflecting lower raw material
costs.
• EBITDA increased by 10.5% to $680m, reflecting
improved market conditions offset in part by
negative translation impacts.
61
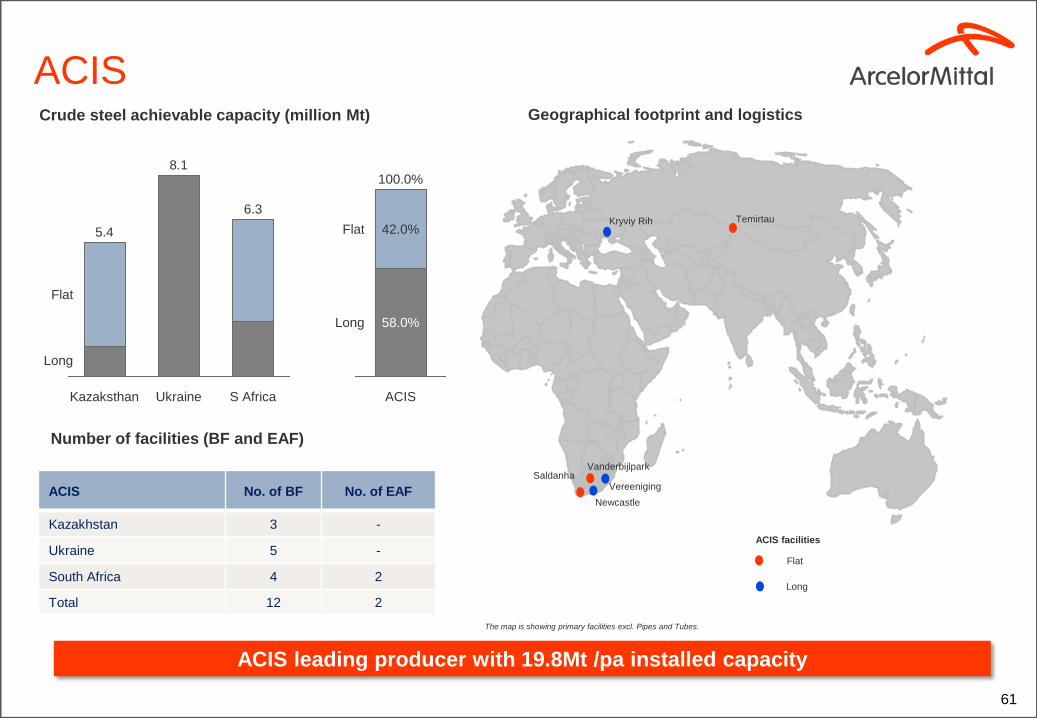
Crude steel achievable capacity (million Mt)
ACIS leading producer with 19.8Mt /pa installed capacity
ACIS
8.1
Long
6.3
Ukraine Kazaksthan
5.4
Flat
S Africa
Long
Flat
58.0%
42.0%
100.0%
ACIS
Number of facilities (BF and EAF)
ACIS No. of BF No. of EAF
Kazakhstan 3 -
Ukraine 5 -
South Africa 4 2
Total 12 2
Geographical footprint and logistics
The map is showing primary facilities excl. Pipes and Tubes.
Long
Flat
ACIS facilities
Kryviy Rih Temirtau
Vanderbijlpark
Vereeniging Saldanha
Newcastle
4
62
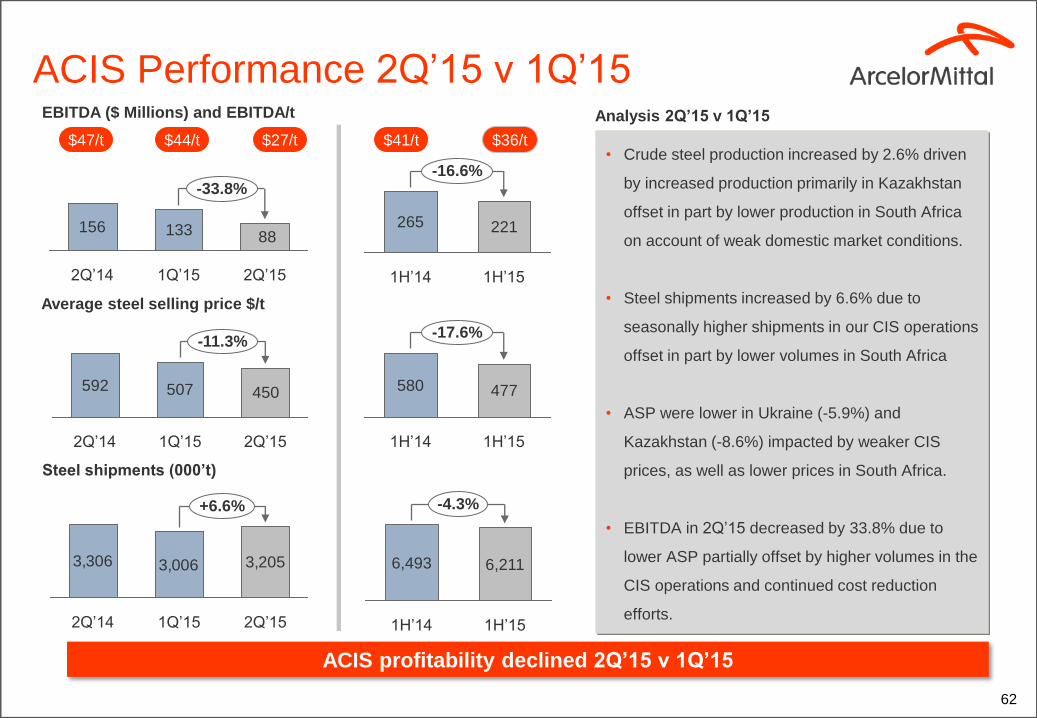
ACIS Performance 2Q’15 v 1Q’15
Average steel selling price $/t
• Crude steel production increased by 2.6% driven
by increased production primarily in Kazakhstan
offset in part by lower production in South Africa
on account of weak domestic market conditions.
• Steel shipments increased by 6.6% due to
seasonally higher shipments in our CIS operations
offset in part by lower volumes in South Africa
• ASP were lower in Ukraine (-5.9%) and
Kazakhstan (-8.6%) impacted by weaker CIS
prices, as well as lower prices in South Africa.
• EBITDA in 2Q’15 decreased by 33.8% due to
lower ASP partially offset by higher volumes in the
CIS operations and continued cost reduction
efforts.
Steel shipments (000’t)
EBITDA ($ Millions) and EBITDA/t
592 507 450
2Q’15
-11.3%
1Q’15 2Q’14
3,306 3,2053,006
1Q’15 2Q’15 2Q’14
+6.6%
156 133 88
-33.8%
1Q’15 2Q’15 2Q’14
ACIS profitability declined 2Q’15 v 1Q’15
$47/t
1H’14
6,493 6,211
-4.3%
1H’15
265 221
1H’14
-16.6%
1H’15
580 477
1H’14
-17.6%
1H’15
$44/t $41/t $36/t $27/t
Analysis 2Q’15 v 1Q’15
63
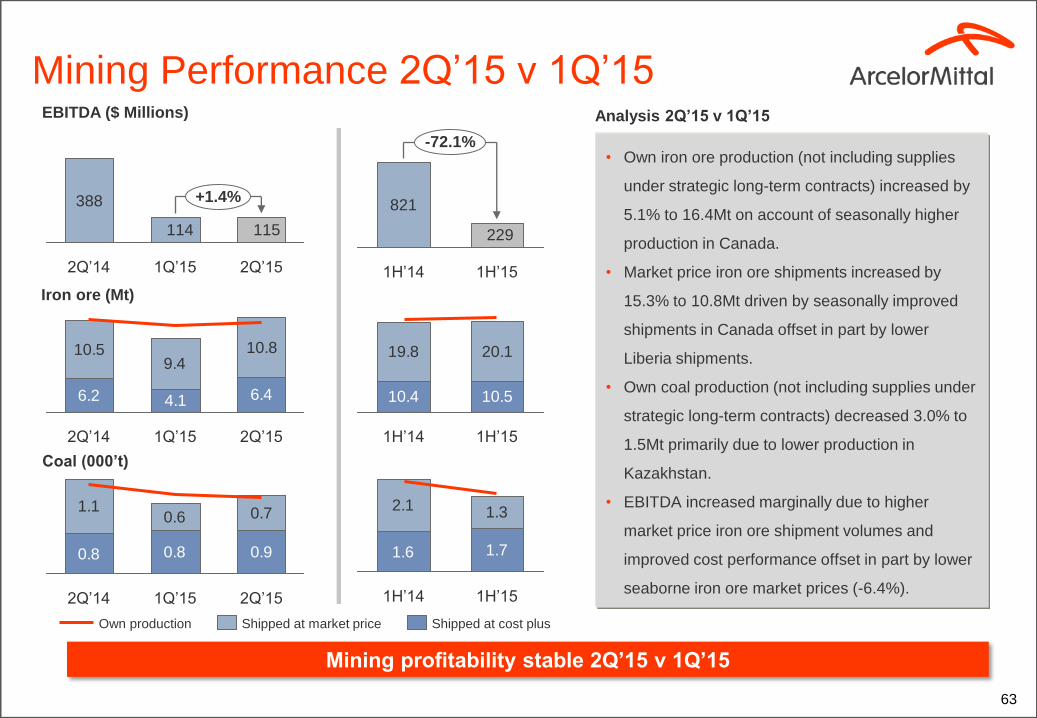
Mining Performance 2Q’15 v 1Q’15
Iron ore (Mt)
• Own iron ore production (not including supplies
under strategic long-term contracts) increased by
5.1% to 16.4Mt on account of seasonally higher
production in Canada.
• Market price iron ore shipments increased by
15.3% to 10.8Mt driven by seasonally improved
shipments in Canada offset in part by lower
Liberia shipments.
• Own coal production (not including supplies under
strategic long-term contracts) decreased 3.0% to
1.5Mt primarily due to lower production in
Kazakhstan.
• EBITDA increased marginally due to higher
market price iron ore shipment volumes and
improved cost performance offset in part by lower
seaborne iron ore market prices (-6.4%).
Coal (000’t)
EBITDA ($ Millions)
388
115114
+1.4%
2Q’15 1Q’15 2Q’14
Mining profitability stable 2Q’15 v 1Q’15
821
229
-72.1%
1H’15 1H’14
6.2 6.4
10.59.4
10.8
4.1
2Q’15 1Q’15 2Q’14
10.4 10.5
19.8 20.1
1H’15 1H’14
0.8 0.8 0.9
1.10.6 0.7
2Q’15 2Q’14 1Q’15
1.6 1.7
2.1 1.3
1H’15 1H’14
Shipped at cost plus Shipped at market price Own production
Analysis 2Q’15 v 1Q’15