Presentation: Some Preliminary Macroeconomics of the Tax ...Some Preliminary Macroeconomics of the...
22
Some Preliminary Macroeconomics of the Tax Cuts and Jobs Act Jason Furman Harvard Kennedy School and Peterson Institute for International Economics Harvard Kennedy School | 79 John F. Kennedy Street | Cambridge, MA 02138 AFA Panel: Business and Capital Taxation Philadelphia, PA January 6, 2018
Transcript of Presentation: Some Preliminary Macroeconomics of the Tax ...Some Preliminary Macroeconomics of the...

Some Preliminary Macroeconomics of the Tax Cuts and Jobs Act
Jason FurmanHarvard Kennedy School and Peterson
Institute for International Economics
Harvard Kennedy School | 79 John F. Kennedy Street | Cambridge, MA 02138
AFA Panel: Business and Capital TaxationPhiladelphia, PAJanuary 6, 2018

-1.5
1.91.2
3.13.7 4.2
-3
-2
-1
0
1
2
3
4
5
Canada France Germany Japan UnitedKingdom
UnitedStates
Business Fixed Investment Growth in G-7 Countries, 2011-2016
Percent Change, Annual Rate
-1.5
1.91.2
3.13.7 4.2
-3
-2
-1
0
1
2
3
4
5
26%-1.0
37%-1.7
30%0.0
35%-9.6
22%-6.0
39%-0.3
Business Fixed Investment Growth in G-7 Countries, 2011-2016
Percent Change, Annual Rate
A reminder: investment determined by a lot more than statutory tax rates
Average Corporate Tax Rate:Corporate Tax RateChange:Note: Corporate tax rate is the average combined (central and sub-central) corporate tax rate for 2012-2016. Source: OECD Global Economic Outlook, November 2017; Organisation for Economic Co-operation and Development; author's calculations.

Estimates of the effect of the Tax Cuts and Jobs Act on GDP—generally 0.0 to 0.2pp increase in
the annual growth rate over the next decade
Note: Long-run estimate for Penn Wharton Budget Model is for 2040. Long-run estimate for Tax Policy Center is for 2037. Based on sources listed and author’s calculations.
Plan ModeledChange in Ten-Year Annual Growth Rate
Change in Long-run Output Level
Tax Policy Center TCJA 0.00 p.p. 0.00%Joint Committee on Taxation TCJA 0.01 to 0.02 p.p. ~ 0%Moody's Economy.com TCJA 0.05 p.p. N/APenn Wharton Budget Model TCJA 0.06 to 0.12 p.p. 0.7 to 1.6%Tax Foundation TCJA N/A 1.7%
AEI (Mathur and Kallen 2017) 20% Corporate Rate 0.09 p.p. 1.8%Barro et al. 2017 20% Corporate Rate N/A 3%Feldstein (2017) 20% Corporate Rate 0.17 p.p. N/ACouncil of Economic Advisers 20% Corporate Rate N/A 3 to 5%
Estimated Growth Effects of the Tax Cuts and Jobs Act

A long-run level increase of 3 percent plausibly translates into ~0.1 p.p. in higher annual growth
rates over ten years
Note: Treasury (2006) is the average of results from the Ramsey infinite horizon growth model and the overlapping generations (OLG) life-cycle model. Based on sources listed and author’s calculations.
Percent of Steady-State Increase
Achieved by 10th Year
Increase in Annual Growth Rate Over First Decade if
Increase in Long-Run Level is 3 Percent (p.p.)
2% Convergence Rate 18% 0.05OECD (2017) 30% 0.095% Convergence Rate (Barro 2017) 40% 0.12Treasury (2006) 65% 0.19
Potential Transition Paths for GDP Increases

Why the output effects of the Tax Cut and Jobs Act are not large
• Corporate capital is only 68% of GDP
• Analysis needs to factor in the full plan: offsets are not lump sum
• Crowd out§ Non-corporate/residential capital shifting to corporate
sector§ Foreign-financed investment which must be repaid
(increases GDP but not GNP / National Income)§ Higher rates of depreciation (increases GDP/GNP but not
National Income)§ Increased domestic borrowing reducing investment

Side note: These are not national income, and certainly not welfare
• Subtract payments to foreigners and increased depreciation to get National Income
• Subtract cost of reduced labor and reduced consumption
• (Tax reform can also raise welfare more than GDP if it reduces consumption distortions, but little of that in the Tax Cuts and Jobs Act)
Plausibly welfare effects are ¼ or less of the GDP growth effects
These issues are very important when combining static distributional impacts with growth/wage effects.

You need a large increase in corporate capital to generate meaningful GDP increases
FixedAssetsin2016 $57 trillion(304%GDP)
- GovernmentAssets $14trillion
- PrivateResidential $20trillion
- Passthrough Assets ~$10trillion
=CorporateFixed Assets ~$12trillion(65%GDP)
Using the BEA input-output tables you need an 18% increase in corporate capital to get a 3% increase in the level of GDP.
Source: Bureau of Economic Analysis; author’s calculations.

Macroeconomic modelling should reflect both the rate cut & other raisers
Source: JCT; author’s calculations.
Provision 2027RevenueImpact
($billions)Reducecorporate rateto21% -156Eliminatemanufacturingdeduction,endexpensingofR&D,limitinterestdeductions,limitNOLS
67
Otherbusiness andinternational 39
Totalcorporate -50
Many20%corporaterateestimatesmodelthis
Butignorethese
provisions(defactotreatingthemaslump
sum)
02468101214161820
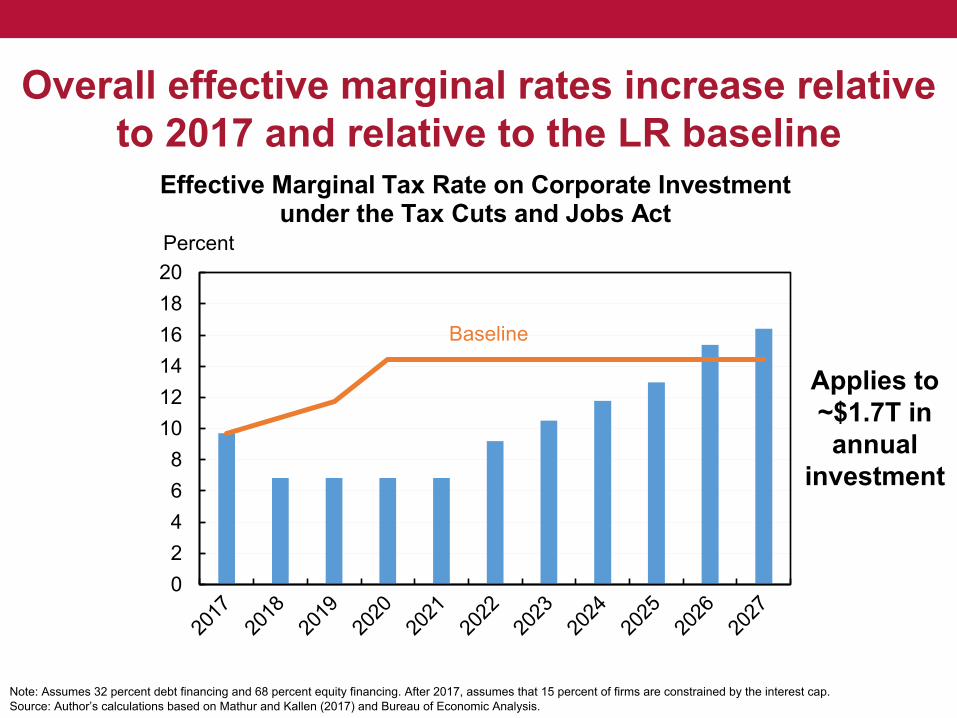
Effective Marginal Tax Rate on Corporate Investment under the Tax Cuts and Jobs Act
Percent
Baseline
Overall effective marginal rates increase relative to 2017 and relative to the LR baseline
Note: Assumes 32 percent debt financing and 68 percent equity financing. After 2017, assumes that 15 percent of firms are constrained by the interest cap.Source: Author’s calculations based on Mathur and Kallen (2017) and Bureau of Economic Analysis.
Applies to ~$1.7T in annual
investment

02468
101214161820
Effective Marginal Tax Rate on Investment in 7-Year Equipment under the Tax Cuts and Jobs Act
Percent
35% rate + 50% bonus depreciation
21% rate + expensing
21% rate + normal depreication
Baseline
The effective marginal tax rate on equipment investment falls somewhat, then rises sharply
Note: Assumes 32 percent debt financing and 68 percent equity financing. After 2017, assumes that 15 percent of firms are constrained by the interest cap.Source: Author’s calculations based on Mathur and Kallen (2017).
Applies to ~$800b in
annual investment

0
5
10
15
20
25
30
35
Effective Marginal Tax Rate on Investment in 39-Year Structures under the Tax Cuts and Jobs Act
Percent
35% rate + normal depreciation
21% rate + normal depreication
Baseline
The effective marginal tax rate on structures investment falls
Note: Assumes 32 percent debt financing and 68 percent equity financing. After 2017, assumes that 15 percent of firms are constrained by the interest cap.Source: Author’s calculations based on Mathur and Kallen (2017).
Applies to ~$400b in
annual investment

-45-40-35-30-25-20-15-10
-50
Effective Marginal Tax Rate on Investment in R&D under the Tax Cuts and Jobs Act
Percent
35% rate + expensing
21% rate + expensing
21% rate + 5 year amortization
Baseline
The effective marginal tax rate on R&D investment rises substantially
Note: Assumes 32 percent debt financing and 68 percent equity financing. After 2017, assumes that 15 percent of firms are constrained by the interest cap.Source: Author’s calculations based on Mathur and Kallen (2017) and Bureau of Economic Analysis.
Applies to ~$200b in
annual investment

Effective average tax rates fall by an average of 2 percentage points
(Note: does not adjust for timing shifts)
Note: Average rates are corporate taxes divided by domestic corporate profits based on CBO projections. The analysis assumes that all of the provisions of the Tax Cuts and Jobs Act classified as "Business" and "International" by CBO are reflected in corporate taxes, an approximation since a small fraction of those provisions are not corporate.Source: Author’s calculations based on Congressional Budget Office’s June 2017 Economic Projections and the JCT score of the TCJA.
Average tax rate 2027
Average tax rate post reform
0
5
10
15
20
25
2018 2020 2022 2024 2026 2028
Effective Average Tax RatesPercent

Shifts tax system from debt favoritism to equity favoritism; narrows differentials between
investment types
Note: After 2017, assumes that 15 percent of firms are constrained by the interest cap.Source: Author’s calculations based on Mathur and Kallen (2017) and Bureau of Economic Analysis.
Type of Investment
Financing of Investment 2017 2022 2027
Debt -1 8 22Equity 11 0 13
Debt 25 26 29Equity 32 21 21
Debt -60 3 8Equity -32 -5 -5
Effective Marginal Tax Rates (Percent)
Equipment
Structures
R&E

Most of the effect of lower corporate rates is undone by the corporate offsets and crowd out
Note: Detail need not add to total due to rounding. Additional information on methodology in appendix.Source: Author’s calculations based on Mathur and Kallen (2017).
Change in Ten-Year Annual Growth Rate
Change in Long-run Output Level
Marginal rate reduction (user cost elasticity = -1) 0.02 p.p. 0.60%Average rate reduction (user cost elasticity = -3) 0.06 p.p. 1.05%Effect of rate reductions alone 0.08 p.p. 1.64%
Adjustment for repeal of domestic production deductionAdjustment for R&E amortizationAdjustment for limitation of interest deductionAdjustment for other raisersDeficit crowd out (interest rates +15 bp)
Effect of all corporate provisions 0.00 p.p. 0.30%
Memo: Effect from marginal rates only, excluding average rate effects -0.03 p.p. -0.31%
19%
AEI Model (Mathur and Jensen)
Percent reduction to growth based on raisers and crowd out9%22%21%11%

Some of what these growth estimates miss• Improvements in the composition of investment could result in larger
output effects:o The TCJA reduces the dispersion of average tax rates across sectors,
including much larger rate reductions for current high tax sectors (e.g., retail and wholesale trade, utilities and transportation) and smaller reductions for current low tax sectors (e.g., manufacturing).
o Shift from residential to corporate capital.o Shift from debt financed to equity financed.
• Higher tax rates on R&D could result in lower output/growth effects.
• Future tax legislation will matter a lot.o What will happen to all the extenders left out of this bill?o Will delayed offsets actually happen (e.g., ending R&D expensing)?o What will happen to expensing after 2022?o What will happen to the individual, estate and passthrough provisions after
2025?o How will future political & deficit developments affect the outlook for taxes?

Deficits expected to rise to 5%+ of GDP—and much more if major provisions are extended
Source: Committee for a Responsible Federal Budget; Congressional Budget Office; author’s calculations.
3.64.7 4.9 5.1 5.4 5.2 5.0 5.4 5.4 5.3
4.3
5.5 5.8 6.06.4 6.3 6.2 6.6
7.07.5
0
1
2
3
4
5
6
7
8
9
2018 2019 2020 2021 2022 2023 2024 2025 2026 2027
Tax Extenders to Continue Current Tax PolicySequester Adjustment/Disaster ReliefCurrent Law
Federal Deficit as a Percent of GDPPercent of GDP

Some Preliminary Macroeconomics of the Tax Cuts and Jobs Act
Jason FurmanHarvard Kennedy School and Peterson
Institute for International Economics
Harvard Kennedy School | 79 John F. Kennedy Street | Cambridge, MA 02138
AFA Panel: Business and Capital TaxationPhiladelphia, PAJanuary 6, 2018

Appendix Data: Wages have grown much faster than profits since 2012
Source: Bureau of Economic Analysis; author’s calculations.
2016
90
95
100
105
110
115
120
2012 2013 2014 2015 2016 2017
Corporate Profits and Labor CompensationIndex (2012 = 100)
LaborCompensation
Corporate Profits

Methodological Appendix: Calculating Effective Marginal Tax Rates
• Effective marginal tax rates (EMTRs) are calculated based on the Devereux-Griffith calculator created by Mathurand Kallen (2017) available at http://www.aei.org/publication/business-tax-reform-investment-and-gdp-potential-impacts-of-the-tax-cuts-and-jobs-act/. The one exception is explicitly incorporating estimates for the R&E subcategory of Intellectual Property that reflect an R&E credit that, following Treasury (2016), is assumed to have a 5 percent effective rate.
• The top personal tax rate on interest income, the statutory business tax rate, the capital cost recovery method, and the fraction of interest paid that is deductible are adjusted on an annual basis to correspond with the provisions of the Tax Cuts and Jobs Act.
• The overall EMTR for all investment is calculated as the weighted average of the EMTRs for equipment (48%), structures (24%), research and development (12%) and other intellectual property products (15%).
• For each category of investment it is assumed that 32 percent is financed by debt and 78 percent is financed by old equity. Within debt-financed investment, it is assumed that 85 percent was eligible for the interest deduction and 15 percent was constrained by the cap on interest deductibility.
• For 2017 and the baseline, the domestic production activities deduction was modelled as a 1.3 percentage point reduction in the statutory business tax rate—approximating the share of income that currently receives the deduction.
• To the extent possible the offsets in the new law were explicitly modelled, including the elimination of the domestic production deduction, limitations on interest deductibility, and the end of expensing for R&E. Restrictions on Net Operating Losses and other offsets were modelled assuming that half of the revenue is associated with higher marginal rates and half of the revenue is associated with lump-sum type taxes. In practice that means adding 1.6 percent to the statutory rate under the reforms.

Methodological Appendix: Growth Analysis• The growth analysis is based on a model by Mathur and Kallen (2017) available at
http://www.aei.org/publication/business-tax-reform-investment-and-gdp-potential-impacts-of-the-tax-cuts-and-jobs-act/. The model calculates the user cost of capital and average rates under various scenarios, uses an elasticity of -1 for the user cost and -3 for the average rate, and uses BEA data to turn these into long-run output effects.
• Baseline estimate of rate reductions only. The baseline estimate is for a statutory corporate rate reduction to 21%, as enacted in the Tax Cuts and Jobs Act. It is very similar to Mathur and Kallen (2017)’s published estimate for reducing the corporate rate to 20% which was based on earlier bills. (Long-run GDP is up 1.64% in this model vs. their 1.75% estimate for a 20% corporate rate). The effects are additive from two parts of the model which are shown separately: the change in the user cost of capital (derived from the effective marginal tax rate), which increases capital with an assumed elasticity of -1, and a reduction in average tax rates, which affects large lumpy location decisions with an assumed elasticity of -3.
• Adjustment for the repeal of the domestic activities production deduction. This is modelled using a 33.7 percent marginal tax rate under current law—reflecting the share of profits that get the 9 percent deduction. Under these parameters long-run output is 1.49% higher, or 9% less than in the baseline case.
• Adjustment for R&E amortization. Expands the Mathur & Kallen model to incorporate two types of IP, R&E (42%) assumed to be expensed now and amortized after 2021 and other IP (58% assumed to be unchanged at 7-year depreciation). Under these parameters long-run output is 1.28% higher, or 22% less than the baseline case.
• Adjustment for limitation of interest deduction. This is assumed to constrain interest deductions for 15 percent of firms in steady state. Under these parameters long-run output is 1.30% higher, or 21% less than the baseline case.

Methodological Appendix: Growth Analysis• Adjustment for other offsets. Other offsets including limitations on Net Operating Losses (NOLs) and other
provisions are not explicitly modelled. Instead they are approximated by assuming that 50 percent of their total cost is effectively a marginal rate increase and 50 percent is effectively lump sum. Specifically, in 2027 these other offsets total $40 billion while the 14 percentage point corporate rate reduction totals $156 billion. They are assumed to offset 20/156 of the corporate rate reduction, or 13 percent of the 14 percentage point reduction—which means modelling a reduction of the statutory rate to 22.6 percent. Under this assumption long-run output is 1.47% higher, or 11% less than in the baseline case.
• Crowd out. Follows Mathur and Kallen (2017) in assuming that a 1 percentage point increase in the debt-to-GDP ratio results in a 3 basis point increase in interest rates. Using JCT’s estimates for the cost of the bill, that results in a 15 basis point increase in interest rates, under this assumption the long-run level of output is 1.33 percent higher, or 19 percent less than in the baseline case.
• Effect of all corporate provisions. This includes all of the adjustments above made simultaneously and including interaction effects. The memo on the effects of marginal rates is derived by zeroing out the average rate effect.