Presentation: Productivity and Pay: Is the link broken ... · These charts show the coefficient...
18
Productivity and Pay: Is the link broken? Anna Stansbury and Lawrence Summers November 2017 Preliminary 1
Transcript of Presentation: Productivity and Pay: Is the link broken ... · These charts show the coefficient...

Productivity and Pay: Is the link broken?
Anna Stansbury and Lawrence Summers
November 2017
Preliminary
1

Productivity and median compensation have diverged since 1973; the typical worker’s compensation has stagnated
Introduction Productivity and compensation Technological explanations? Implications
2
Productivity and typical compensation5
01
00
150
200
Ind
ex 1
97
3=
10
0
1940 1960 1980 2000 2020
Labor productivity Median compensation
Production/nonsupervisory average compensation
Data from BLS, BEA and Bivens and Mishel (2015)

Does this mean that raising productivity growth no longer raises average Americans’ incomes?
“although boosting productivity growth is an important long-run goal, this will not lead to broad-based wage gains unless we pursue policies that reconnect productivity growth and the pay of the vast majority” Bivens and Mishel (2015)
“productivity gains haven't translated into broadly shared gains for the entire workforce” Bunker (2015)
“there’s no law that everybody’s going to benefit from technology... Ever since the Industrial Revolution, we’ve experienced a rising tide that has helped most people but... those trends have diverged” Brynjolfsson (2015)
Introduction Productivity and compensation Technological explanations? Implications
3

Two views of the productivity-compensation divergence: “linkage” and “delinkage”
Introduction Productivity and compensation Technological explanations? Implications
4
“Delinkage”Increases in productivity growth do not currently translate into additional growth in workers' compensation
“Linkage”Productivity growth does translate into pay, holding all other factors constant
- but a variety of other orthogonal factors have been putting downward pressure on median workers' compensation even as productivity growth has been acting to lift it.
Visually, productivity and compensation seem to move together – though compensation growth has been slower
Change in log productivity and compensation: 3 year moving avg.
Introduction Productivity and compensation Technological explanations? Implications
5
-.0
20
.02
.04
Ch
an
ge
in
lo
g, 3
-ye
ar
mo
vin
g a
ve
rag
e
1940 1960 1980 2000 2020
Labor productivity Median compensation
Production/nonsupervisory average compensation
Data from BLS, BEA and Mishel and Bivens (2015)

An empirical test of the “linkage” and “delinkage” views
∆ log 𝑐𝑜𝑚𝑝𝑒𝑛𝑠𝑎𝑡𝑖𝑜𝑛 = 𝛼 + 𝛽 ∆ log 𝑝𝑟𝑜𝑑𝑢𝑐𝑡𝑖𝑣𝑖𝑡𝑦 + 𝛾 ∆𝑢𝑛𝑒𝑚𝑝𝑙𝑜𝑦𝑚𝑒𝑛𝑡 + 𝜀
Strong delinkage : 𝛽 = 0 Strong linkage : 𝛽 = 1
Test with:
• Moving average specification (bandwidth of 1-5 years)
• Distributed lag specification (up to 4 lags)
Introduction Productivity and compensation Technological explanations? Implications
6

0.7
0.7
1.0
0.9
1.0
1.0
1.2
1.1
1.2
1.1
0.8
0.8
0.6
0.3
1.0
0.9
0.9
0.8
p
0.0 0.5 1.0 1.5 2.0Estimated relationship
0.7
0.7
0.9
1.0
1.0
1.0
1.1
1.1
1.2
1.1
0.7
0.9
0.6
0.7
1.0
0.9
0.7
0.8
p
0.0 0.5 1.0 1.5Estimated relationship
7
Average compensation: 1948-2015Single year only
Two-year moving average
Three-year moving average
Four-year moving average
Five-year moving average
Time trend (3yma)
Decade dummies (3yma)
No unemployment control (3yma)
Nonfarm business sector (3yma)
Introduction Productivity and compensation Technological explanations? Implications
Results of various specifications: avg. and P/NS compensation
These charts show the coefficient estimates from various specifications
Lines represent 95% confidence intervals.
Solid line: moving average specificationDashed line: distributed lag specification
Production/nonsupervisory compensation: 1948-2015
Single year only
Two-year moving average
Three-year moving average
Four-year moving average
Five-year moving average
Time trend (3yma)
Decade dummies (3yma)
No unemployment control (3yma)
Nonfarm business sector (3yma)
0.3
0.5
0.8
1.0
0.9
0.9
1.0
0.7
1.0
0.3
0.9
0.9
0.8
1.1
0.9
0.5
0.8
0.7
p
0.0 0.5 1.0 1.5 2.0
8
Single year only
Two-year moving average
Three-year moving average
Four-year moving average
Five-year moving average
Time trend (3yma)
Decade dummies (3yma)
No unemployment control (3yma)
Nonfarm business sector (3yma)
Introduction Productivity and compensation Technological explanations? Implications
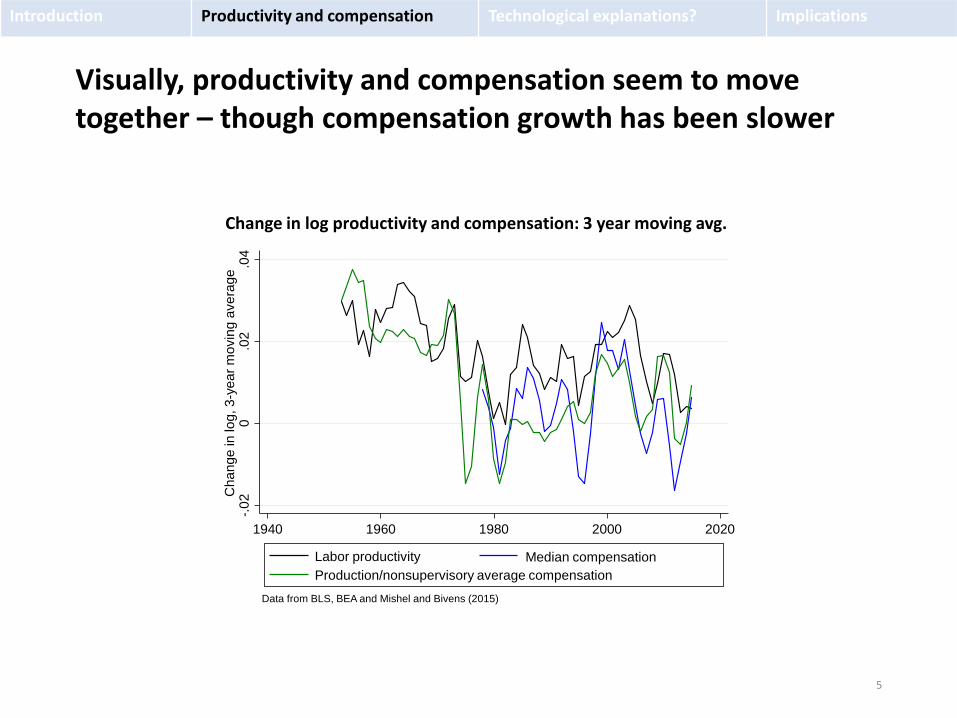
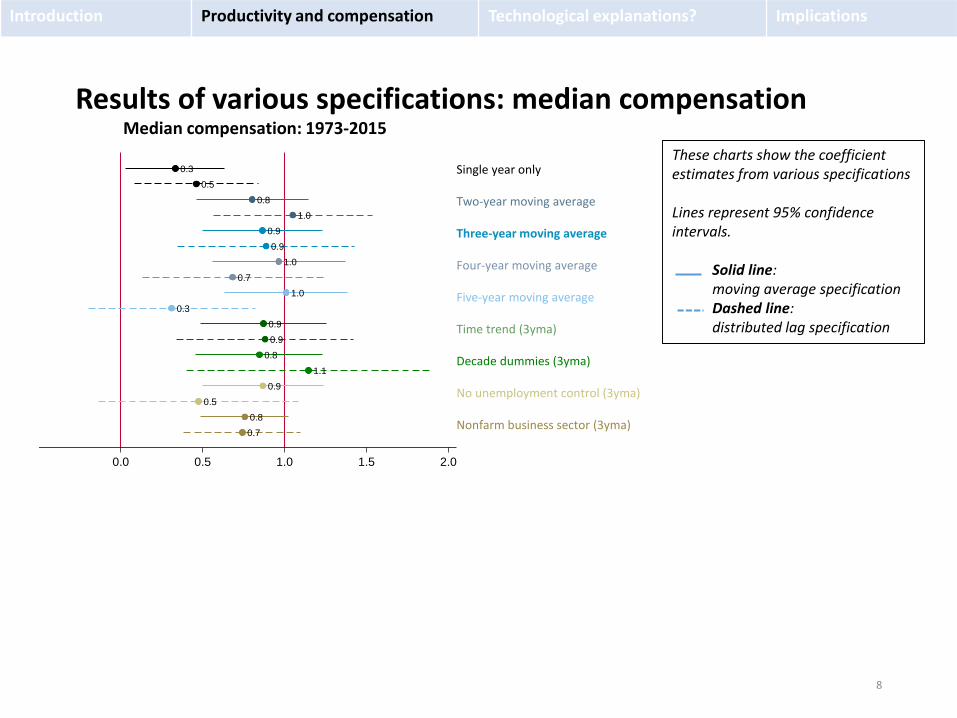
Results of various specifications: median compensation
These charts show the coefficient estimates from various specifications
Lines represent 95% confidence intervals.
Solid line: moving average specificationDashed line: distributed lag specification
Median compensation: 1973-2015

0.2
0.4
0.6
0.7
0.6
0.3
0.4
0.4
0.4
p
-0.5 0.0 0.5 1.0 1.5Estimated relationship
0.4
0.6
0.6
0.7
0.7
0.6
0.5
0.6
0.6
p
-0.5 0.0 0.5 1.0 1.5Estimated relationship
9
Production/nonsupervisory compensation: 1948-1973
Production/nonsupervisory compensation: 1973-2015
Introduction Productivity and compensation Technological explanations? Implications
Results of various specifications: sample split, P/NS comp.
These charts show the coefficient estimates from various specifications for regressions of average production and nonsupervisory compensation on productivity.
Lines represent 95% confidence intervals.
Single year only
Two-year moving average
Three-year moving average
Four-year moving average
Five-year moving average
Time trend (3yma)
Decade dummies (3yma)
No unemployment control (3yma)
Nonfarm business sector (3yma)
Single year only
Two-year moving average
Three-year moving average
Four-year moving average
Five-year moving average
Time trend (3yma)
Decade dummies (3yma)
No unemployment control (3yma)
Nonfarm business sector (3yma)

0.6
0.9
0.4
0.5
0.7
0.6
0.4
0.4
0.5
0.4
p
-0.5 0.0 0.5 1.0 1.5Estimated relationship
10
Introduction Productivity and compensation Technological explanations? Implications
Results: percentiles of the wage distribution
10th percentile
20th percentile
30th percentile
40th percentile
50th percentile
60th percentile
70th percentile
80th percentile
90th percentile
95th percentile
These charts show the coefficient estimates from the baseline 3-year moving average regressions of percentiles of the wage distribution on productivity.
Lines represent 95% confidence intervals.
Note: this is wage data not total compensation data.Comparison with the median compensation regressions suggest that these may be underestimates.

1.1
0.9
1.1
0.0
0.3
0.4
1.0
p
-1.0 0.0 1.0 2.0Estimated relationship
11
Introduction Productivity and compensation Technological explanations? Implications
Results: average compensation for advanced economies
Canada 1972-2015
France 1972-2015
West Germany 1972-1990
Germany 1993-2015
Italy 1985-2014
Japan 1995-2015
United States 1950-2015
These charts show the coefficient estimates from the baseline 3-year moving average regressions of average compensation on productivity in advanced economies.
Lines represent 95% confidence intervals.

100
120
140
160
180
Ind
ex 1
97
3=
10
0
1970 1980 1990 2000 2010 2020Year
Net labor productivity Mean comp., NDP deflation
Mean comp., CPI deflation Median comp., CPI deflation
Data from BLS, BEA and Mishel and Bivens (2015)
The overall productivity-compensation gap is the result of three separate divergences
Introduction Productivity and compensation Technological explanations? Implications
Divergence decomposition (Bivens and Mishel 2015)
12
Labor share
Deflator wedge
Mean-median inequality

Technology-based theories have a natural implication: divergence is greater when productivity growth is faster
Introduction Productivity and compensation Technological explanations? Implications
Assuming that greater technological progress implies faster productivity growth:
Labor share:
H1:𝛽 <0
Mean/median inequality:
H1:𝛽 >0
∆ log𝑚𝑒𝑎𝑛
𝑚𝑒𝑑𝑖𝑎𝑛𝑐𝑜𝑚𝑝𝑒𝑛𝑠𝑎𝑡𝑖𝑜𝑛 = 𝛼 + 𝛽 ∆ log 𝑝𝑟𝑜𝑑𝑢𝑐𝑡𝑖𝑣𝑖𝑡𝑦 + 𝛾 ∆𝑢𝑛𝑒𝑚𝑝𝑙𝑜𝑦𝑚𝑒𝑛𝑡 + 𝜀
∆ log 𝑙𝑎𝑏𝑜𝑟 𝑠ℎ𝑎𝑟𝑒 = 𝛼 + 𝛽 ∆ log 𝑝𝑟𝑜𝑑𝑢𝑐𝑡𝑖𝑣𝑖𝑡𝑦 + 𝛾 ∆𝑢𝑛𝑒𝑚𝑝𝑙𝑜𝑦𝑚𝑒𝑛𝑡 + 𝜀
13

Divergences increased less during productivity booms than productivity slowdowns
Introduction Productivity and compensation Technological explanations? Implications
14

-0.3
-0.2
-0.1
-0.0
0.0
-0.1
-0.1
-0.1
-0.2
p
-1.0 -0.5 0.0 0.5 1.0
15
1973-2015
Results: labor share and productivity
These charts show the coefficient estimates from various specifications
Lines represent 95% confidence intervals.
Solid line: moving average specificationDashed line: distributed lag specification
Introduction Productivity and compensation Technological explanations? Implications
Single year only
Two-year moving average
Three-year moving average
Four-year moving average
Five-year moving average
Time trend (3yma)
Decade dummies (3yma)
No unemployment control (3yma)
Nonfarm business sector (3yma)

0.2
-0.1
-0.1
-0.1
-0.1
-0.1
-0.1
-0.1
-0.1
p
-1.0 -0.5 0.0 0.5 1.0
16
Results: mean/median compensation and productivity
These charts show the coefficient estimates from various specifications
Lines represent 95% confidence intervals.
Solid line: moving average specificationDashed line: distributed lag specification
Introduction Productivity and compensation Technological explanations? Implications
Single year only
Two-year moving average
Three-year moving average
Four-year moving average
Five-year moving average
Time trend (3yma)
Decade dummies (3yma)
No unemployment control (3yma)
Nonfarm business sector (3yma)
1973-2015

A quick counterfactual: productivity growth and widening inequality
• If the mean/median compensation ratio had been the same in 2015 as it was in 1973, median compensation would have been around 32% higher
• If the productivity/mean compensation ratio (labor share) had been the same in 2015 as it was in 1973, mean and median compensation would have been around 5% higher
• If the rate of productivity growth had been the same over 1973-2015 as it was over 1948-1973, our estimates of the relationship between productivity and compensation suggest that mean compensation would have been around 59-76% and median compensation 65-68% higher in 2015.
Introduction Productivity and compensation Technological explanations? Implications
17

Conclusions:
The substantial variations in productivity growth that have taken place during recent decades have translated into significant positive changes in the compensation of middle income workers.
This suggests that if productivity accelerates holding other factors constant, the likely impact will be increased pay growth for middle income workers.
At the same time, there is little co-movement between productivity growth and widening inequality – either for the labor share, or the mean/median ratio.
This tends to imply that technology is not the key driver of changes in the labor share, or in the mean/median compensation gap. It instead suggests the importance of factors not associated with the rate of productivity growth in explaining the pay-productivity divergence.
Introduction Productivity and compensation Technological explanations? Implications
18