PRESENTATION ON PHARMACEUTICALS SBI CAPITAL MARKETS LTD. ANALYST : FALGUN JOSHIPURA 19 March, 2003...
39
PRESENTATION ON PHARMACEUTICALS SBI CAPITAL MARKETS LTD. ANALYST : FALGUN JOSHIPURA 19 March, 2003 falgun.joshipura@sbicap s.com Tel.: 022-22189166
-
Upload
irma-jacobs -
Category
Documents
-
view
215 -
download
1
Transcript of PRESENTATION ON PHARMACEUTICALS SBI CAPITAL MARKETS LTD. ANALYST : FALGUN JOSHIPURA 19 March, 2003...

PRESENTATION
ON
PHARMACEUTICALSSBI CAPITAL MARKETS LTD.
ANALYST : FALGUN JOSHIPURA
19 March, 2003
Tel.: 022-22189166 Extn: 464
IS PHARMA UNDERVALUED ?
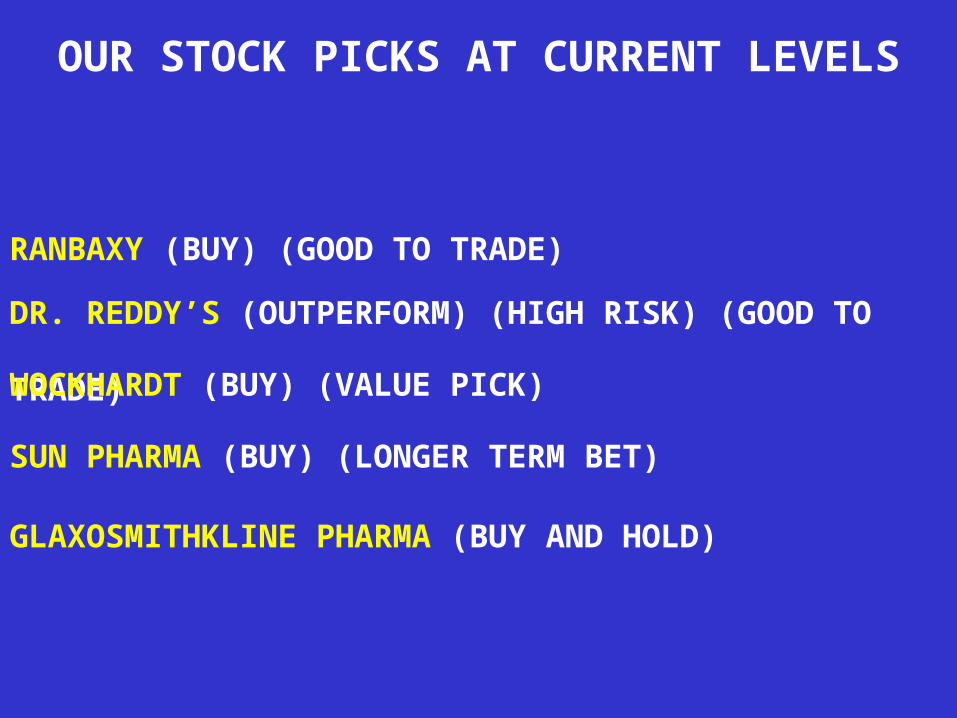
OUR STOCK PICKS AT CURRENT LEVELS
RANBAXY (BUY) (GOOD TO TRADE)
GLAXOSMITHKLINE PHARMA (BUY AND HOLD)
DR. REDDY’S (OUTPERFORM) (HIGH RISK) (GOOD TO TRADE)
WOCKHARDT (BUY) (VALUE PICK)
SUN PHARMA (BUY) (LONGER TERM BET)
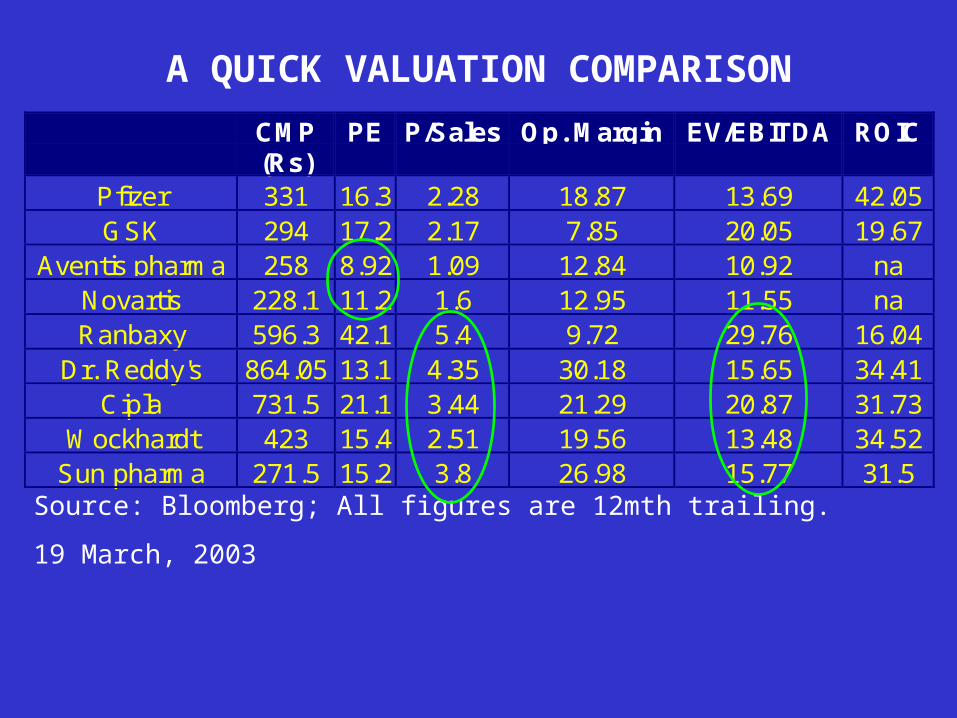
A QUICK VALUATION COMPARISON
Source: Bloomberg; All figures are 12mth trailing.
19 March, 2003
CMP(Rs)
PE P/Sales Op. Margin EV/EBITDA ROIC
Pfizer 331 16.3 2.28 18.87 13.69 42.05GSK 294 17.2 2.17 7.85 20.05 19.67
Aventis pharma 258 8.92 1.09 12.84 10.92 naNovartis 228.1 11.2 1.6 12.95 11.55 naRanbaxy 596.3 42.1 5.4 9.72 29.76 16.04
Dr. Reddy's 864.05 13.1 4.35 30.18 15.65 34.41Cipla 731.5 21.1 3.44 21.29 20.87 31.73
Wockhardt 423 15.4 2.51 19.56 13.48 34.52Sun pharma 271.5 15.2 3.8 26.98 15.77 31.5

PFIZER LTD.
FACTS LEGAL MERGER STALLED ON APPEAL MADE BY MINORITY SHAREHOLDERS
INTEGRATION BENEFITS -- RS 100 MN
DISCONTINUATION OF VACCINE. COREX CROSSES RS 1000 MN IN FY02.
PARENT’S BLOCKBUSTER-- ZOLOFT LAUNCHED IN FY02 UNDER NAME OF DAXID.
BENADRYL GROWING @ 25% YOY. SALES NEAR TO RS 500 MN.
TOP 10 BRANDS CONTRIBUTED 66% OF SALES AND GREW @ 9-10% IN FYO2.

PFIZER LTD.FY02a FY03e FY04e
Gross Sales (1+2) 6346.91 7481.20 8028.93yoy 17.87% 7.32%Pharmaceuticals (1) 5770.61 6858.80 7356.73Animal Health (2) 576.30 622.40 672.20Other Operating Income :Services 436.60 0.00 0.00 Services-Clinical Trials 165.50 182.05 200.26
FY02a FY03e FY04e EBDITA margin 18.28% 17.06% 18.49% EBIT margin 16.46% 15.07% 16.50% PBT margin 19.05% 18.00% 19.51% PAT margin 10.43% 11.34% 12.29% ROIC 25.36% 18.23% 18.54%
FY02a FY03e FY04e Net Sales 5860.61 6380.97 6853.03 yoy 8.88% 7.40% PAT before xo (Rs mn) 611.20 723.54 842.42 yoy 18.38% 16.43% Basic EPS before xo 21.22 25.13 29.25

PFIZER LTD.
0
100
200
300
400
500
600
700
11/2
8/1
999
2/1
3/2
000
4/3
0/2
000
7/1
6/2
000
10/1
/2000
12/1
7/2
000
3/4
/2001
5/2
0/2
001
8/5
/2001
10/2
1/2
001
1/6
/2002
3/2
4/2
002
6/9
/2002
8/2
5/2
002
11/1
0/2
002
Rolling PE -- Price bands
Sh
are
Pri
ce
PE=25
PE=20
PE=15
VALUATION COMMENTS :GOOD PICK FOR FY04 ONWARDS
RISK :

GLAXOSMITHKLINE PHARMA LTD.
FACTS
RATIONALIZATION PROCESS TO CONTINUE WITH SALE OF WORLI PROPERTY.
BOTTOM-LINE DRIVEN. FOCUS ON CHOSEN 30 BRANDS. OLD BRANDS WILL SUBSIDIZE COST OF PROMOTION OF NEW BRANDS.
POST 2005, LOOKING FOR 2-3 MOLECULES TO GIVE RS 1000 MN EACH IN 2-3 YEARS, BASED ON EXPERIENCE IN CHINA.
2-3 NEW MOLECULES PER YEAR TO BE LAUNCHED. SUCCESSFUL LAUNCH ONLY IF RS 100-200 MN SALES IN 2-3 YEARS OF LAUNCH.
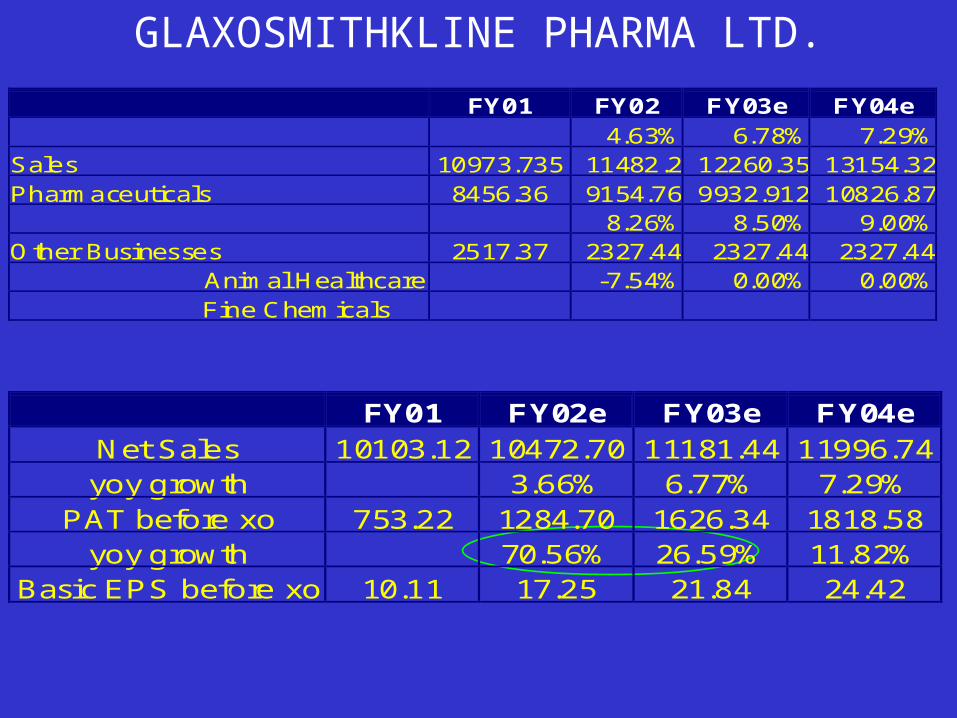
GLAXOSMITHKLINE PHARMA LTD.
FY01 FY02e FY03e FY04e Net Sales 10103.12 10472.70 11181.44 11996.74 yoy growth 3.66% 6.77% 7.29%
PAT before xo 753.22 1284.70 1626.34 1818.58 yoy growth 70.56% 26.59% 11.82%
Basic EPS before xo 10.11 17.25 21.84 24.42
FY01 FY02 FY03e FY04e 4.63% 6.78% 7.29% Sales 10973.735 11482.2 12260.35 13154.32 Pharmaceuticals 8456.36 9154.76 9932.912 10826.87 8.26% 8.50% 9.00% Other Businesses 2517.37 2327.44 2327.44 2327.44 Animal Healthcare -7.54% 0.00% 0.00% Fine Chemicals

GLAXOSMITHKLINE PHARMA LTD.
Rolling PE-Price Bands
0100200300400500600700800900
Pri
ce
PE=15
PE=20
PE=30
FY01 FY02 FY03e FY04e EBDITA margin 10.35% 16.48% 18.59% 19.46% EBIT Margin 7.81% 14.62% 16.72% 17.60% PBT before xo Margin 11.44% 18.74% 20.78% 21.66% PAT before xo margin 7.46% 12.27% 14.54% 15.16% PAT after xo margin 4.35% 9.36% 12.85% 15.16% ROIC 20.06% 22.07% 22.44%

GLAXOSMITHKLINE PHARMA LTD.
SALES CAGR THROUGH FY13 IS 8.93%. PAT CAGR IS 11.36%
FY03 Risk free return rate 6.22% Risk Premium 10.00% Beta 0.6 Cost of Equity 12.22% Cost of Debt 11% After tax cost of debt 7.70% WACC 12.16% Terminal growth rate 7% Cummulative PV of FCF (Rs mn) 9270.77 Terminal value 60937.11 PV of terminal value (Rs mn) 19238.85 Enterprise value (Rs mn) 28509.62 Net Debt (Rs mn) 98.08 Equity value (Rs mn) 28411.54 No. of Equity shares (mn) 74.475 Per share value (Rs) 381.49
VALUATION COMMENTS :BUY AND HOLD
RISK :
DCF

NOVARTIS INDIA LTD
Q3, FY03 PAT DOWN 30.4% YOY. 9 MONTH PAT UP 31.6%.
GENERIC COMPETITION IN Q3, FY03 -- MARGINS UNDER PRESSURE
HIGHER PROMOTIONAL EXPENSES AND ONE-TIME ERP COST IN Q3, FY03.
RS 559 MN WORTH FG IMPORTED IN FY02.
RS 198 MN FROM GOREGAON PROPERTY IN FY03. RS 384 MN OVER THE NEXT TWO YEARS.
FACTS

NOVARTIS INDIA LTDFY01 FY02 FY03e FY04e FY05e
Gross Sales 4383.78 4677.00 5195.58 5703.53 6265.58yoy 6.69% 11.09% 9.78% 9.85%Pharma 2483.945 2678 2999.36 3329.29 3695.511yoy 7.40% 12.00% 11.00% 11.00%Biochemie 1219.518 1220 1366.4 1503.04 1653.344yoy 0.04% 12.00% 10.00% 10.00%Consumer Health 375.7904 416 416 416 416yoy 10.70% 0.00% 0.00% 0.00%Animal Health 304.5302 363 413.82 455.202 500.7222
FY01 FY02 FY03e FY04e FY05e Net Sales in Rs mn 4319.88 4553.82 5039.71 5532.43 6077.61 yoy 5.42% 10.67% 9.78% 9.85% PAT before xo in Rs mn 417.60 482.71 512.50 576.17 640.65 yoy 15.59% 6.17% 12.42% 11.19% Basic EPS before xo 13.07 15.10 16.04 18.03 20.04

NOVARTIS INDIA LTD
FY01 FY02 FY03e FY04e FY05e EBITDA Margin 12.38% 14.26% 14.59% 14.89% 15.05% EBIT Margin 10.07% 12.38% 11.70% 12.00% 12.16% PBT Margin 14.16% 16.48% 16.14% 16.53% 16.73% PAT Margin before xo 9.67% 10.60% 10.17% 10.41% 10.54% ROIC avg. 14.61% 14.91% 14.16% 13.41%
NOVARTIS INDIA LTD
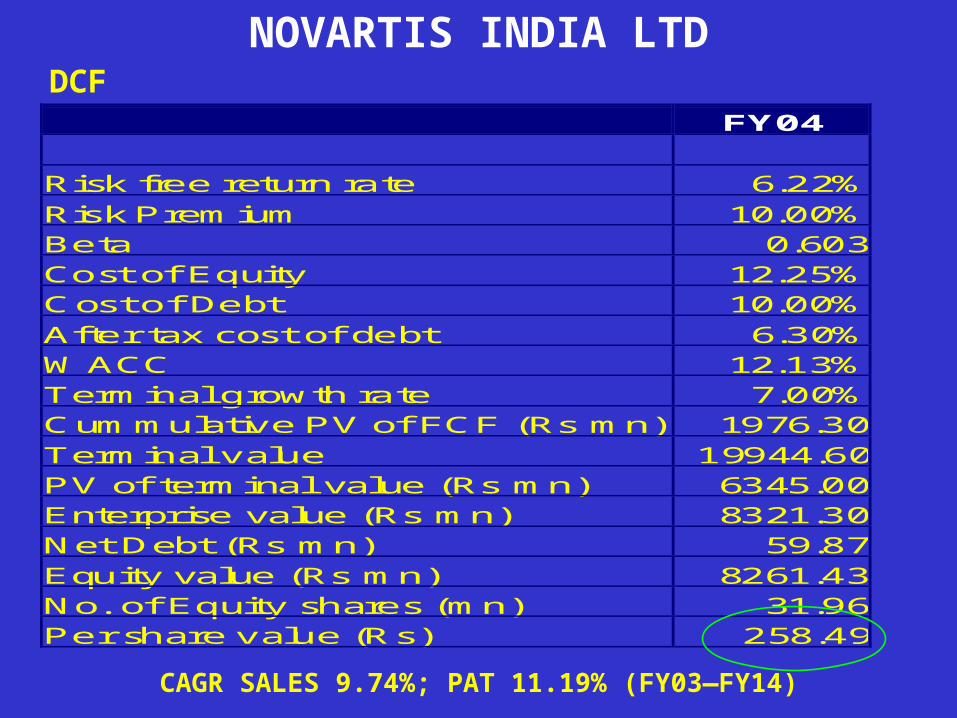
FY04 Risk free return rate 6.22% Risk Premium 10.00% Beta 0.603 Cost of Equity 12.25% Cost of Debt 10.00% After tax cost of debt 6.30% WACC 12.13% Terminal growth rate 7.00% Cummulative PV of FCF (Rs mn) 1976.30 Terminal value 19944.60 PV of terminal value (Rs mn) 6345.00 Enterprise value (Rs mn) 8321.30 Net Debt (Rs mn) 59.87 Equity value (Rs mn) 8261.43 No. of Equity shares (mn) 31.96 Per share value (Rs) 258.49
CAGR SALES 9.74%; PAT 11.19% (FY03—FY14)
DCF

NOVARTIS INDIA LTD
Rolling PE-Price Bands
100
150
200
250
300
350S
ha
re P
rice
PE=12
PE=15
PE=18
VALUATION COMMENTS :MARKET PERFORMER
RISK :

AVENTIS PHARMA INDIA LTD
FACTS
MARGINS IN FY02 A DISSAPOINTMENT. HIGHER RAW MATERIAL COST LOWERED MARGINS.
59% OF RAW MATERIAL IS IMPORTED. THIS SHALL BENEFIT THE COMPANY AS CD LOWERED TO 25% FROM 30%.
STRATEGIC PRODUCTS CONTINUE TO DO WELL. THEY NOW ACCOUNT FOR 27% OF DOMESTIC SALES AND ARE GROWING AT 32% YOY.
A SUSTAINED TURNAROUND IN MARGINS AIDED BY STARATEGIC PRODUCTS WILL BE THE TRIGGER FOR THE STOCK IN FY03-FY04.

AVENTIS PHARMA INDIA LTDFY01 FY02 FY03e FY04e
Gross Sales 5891.518 6663.42208 7482.5295 8289.99628813.10% 12.29% 10.79%
Domestic 4677.52 5073.71 5574.88 6000.818.47% 9.88% 7.64%
Exports 1215.00 1589.71 1907.65 2289.19
FY01 FY02e FY03e FY04eNet Sales (Rs mn) 5446.64 6157.00 6913.86 7659.96yoy 13.04% 12.29% 10.79%PAT (Rs mn) 674.02 620.01 679.77 788.70yoy -8.01% 9.64% 16.02%Basic EPS 29.27 26.92 29.52 32.82
FY01 FY02e FY03e FY04eEBDITA margin 18.11% 15.79% 16.23% 17.48%EBIT margin 15.32% 13.35% 13.80% 15.04%PBT margin 17.38% 14.88% 15.36% 16.61%PAT margin 12.38% 10.07% 9.83% 10.30%ROIC (avg) 22.16% 19.04% 18.39% 18.18%

AVENTIS PHARMA INDIA LTD
FY03
Risk free return rate 6.22%Risk Premium 10.00%Beta 0.50Cost of Equity 11.22%Cost of Debt 11.00%After tax cost of debt 7.04%WACC 11.17%Terminal growth rate 5.00%Cummulative PV of FCF (Rs mn) 7,753.39Terminal value 26,076.83PV of terminal value (Rs mn) 8,133.90Enterprise value (Rs mn) 15,887.29Net Debt (Rs mn) 37.41Equity value (Rs mn) 15,849.88No. of Equity shares (mn) 23.03Per share value (Rs) 688.21
CAGR SALES THROUGH FY14 IS 8.25% AND THAT FOR PAT IS 12.8%
Market Uninterested by the price obtained by using DCF
DCF

Price-Rolling PE Bands
0
200
400
600
800
1000
1200
1400S
ha
re P
rice
PE=10
PE=25
PE=15
AVENTIS PHARMA INDIA LTD
VALUATION COMMENTS :ACCUMULATE ON INDICATION OF MARGIN IMPROVEMENT
RISK :
RANBAXY LABORATORIES LTD
FACTS
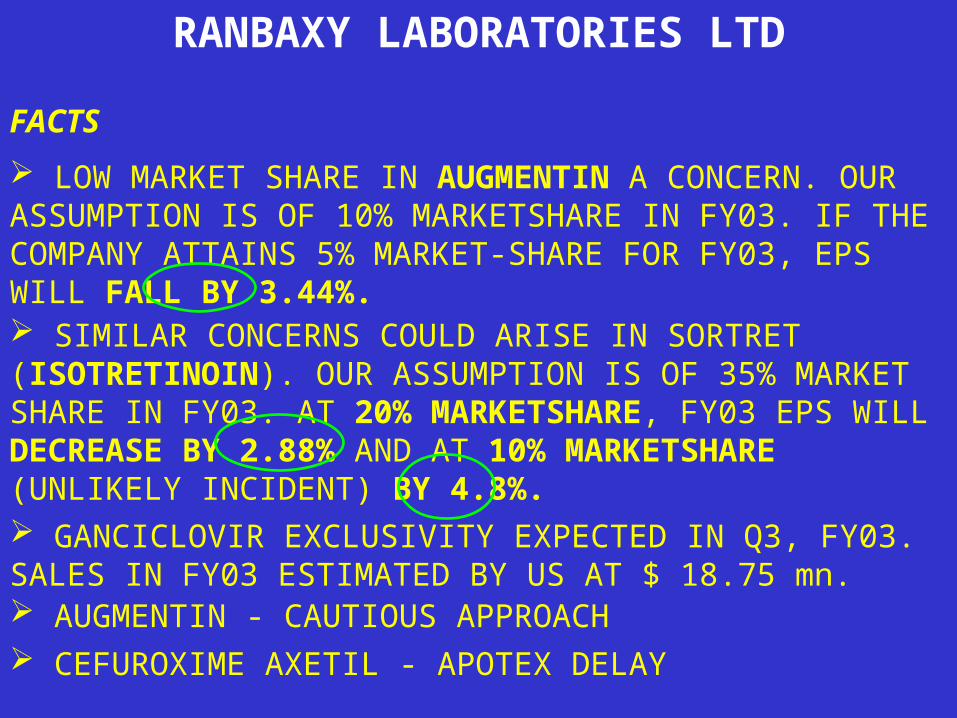
LOW MARKET SHARE IN AUGMENTIN A CONCERN. OUR ASSUMPTION IS OF 10% MARKETSHARE IN FY03. IF THE COMPANY ATTAINS 5% MARKET-SHARE FOR FY03, EPS WILL FALL BY 3.44%. SIMILAR CONCERNS COULD ARISE IN SORTRET (ISOTRETINOIN). OUR ASSUMPTION IS OF 35% MARKET SHARE IN FY03. AT 20% MARKETSHARE, FY03 EPS WILL DECREASE BY 2.88% AND AT 10% MARKETSHARE (UNLIKELY INCIDENT) BY 4.8%. GANCICLOVIR EXCLUSIVITY EXPECTED IN Q3, FY03. SALES IN FY03 ESTIMATED BY US AT $ 18.75 mn. AUGMENTIN - CAUTIOUS APPROACH CEFUROXIME AXETIL - APOTEX DELAY
RANBAXY LABORATORIES LTDFY01 FY02 FY03e FY04e
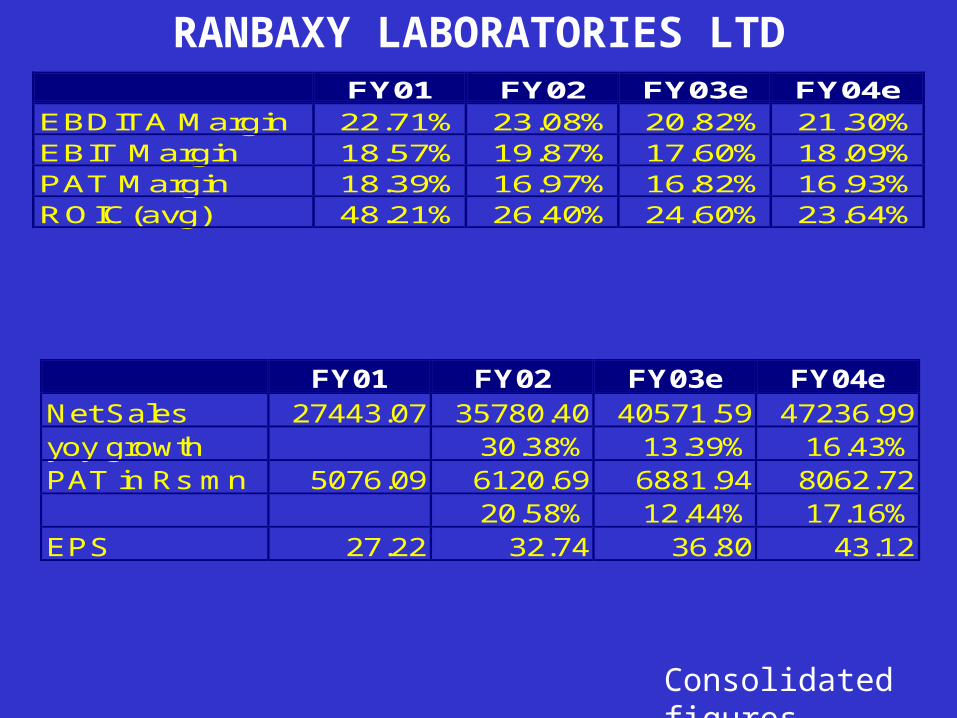
EBDITA Margin 22.71% 23.08% 20.82% 21.30%EBIT Margin 18.57% 19.87% 17.60% 18.09%PAT Margin 18.39% 16.97% 16.82% 16.93%ROIC(avg) 48.21% 26.40% 24.60% 23.64%
FY01 FY02 FY03e FY04eNet Sales 27443.07 35780.40 40571.59 47236.99yoy growth 30.38% 13.39% 16.43%PAT in Rs mn 5076.09 6120.69 6881.94 8062.72
20.58% 12.44% 17.16%EPS 27.22 32.74 36.80 43.12
Consolidated figures

Price-Rolling PE bands
150
250
350
450
550
650
750
850
950
Sh
are
Pri
ce
PE=20
PE=25
PE=30
RANBAXY LABORATORIES LTD
VALUATION COMMENTS :BUY (GOOD FOR TRADING)
RISK :

DR. REDDY’S LABORATORIES LTD
FACTS
FILE PARA IV ANDA FOR ALL DOSAGE STRENTGHS OF OLANZAPINE. ELI LILLY HAS SUED IN A DISTRICT COURT. OLANZAPINE SALES WERE $ 2.5 bn IN 2001. PATENT EXPIRY IS 2011. ONLY ONE PATENT IS CHALLENGED.
15-YEAR PRODUCT DEVELOPMENT AND MARKETING TIE-UP WITH LEINER HEALTH PRODUCTS INC.
PARA IV FOR SERTRALINE (PFIZER’S ZOLOFT; $2.4 bn IN 2002) FOR 25, 50, AND 100 mg DOSAGE FORMS. FILED AGAINST 4 OF THE FIVE PATENT. PFIZER HAS NOT SUED IN THE 45 DAYS.
AMLODIPINE MALEATE

DR. REDDY’S LABORATORIES LTDGeneric Innovator Sales (2001)
$ bnFiling Type FTF
Olanzapine tabs (Zyprexa) Lilly 2.5 Para IV 20 mgOndansetron tab (Zofran) GSK 0.8 Para IV All Oral StrengthsClopidogrel tabs (Plavix) Sanofi 1.1 Para IVTerbinafine Hcl tabs (Lamisil) Novartis 0.5 Para IVSertraline Hcl tabs (Zoloft) Pfizer 2.4 Para IVOmeprazole Caps (Prilosec) Astra 4.6 Para IV TBD
THREE MORE 505(b)(2) FILINGS ANTICIPATED.
DR. REDDY’S LABORATORIES LTDFY02 FY03e FY04e
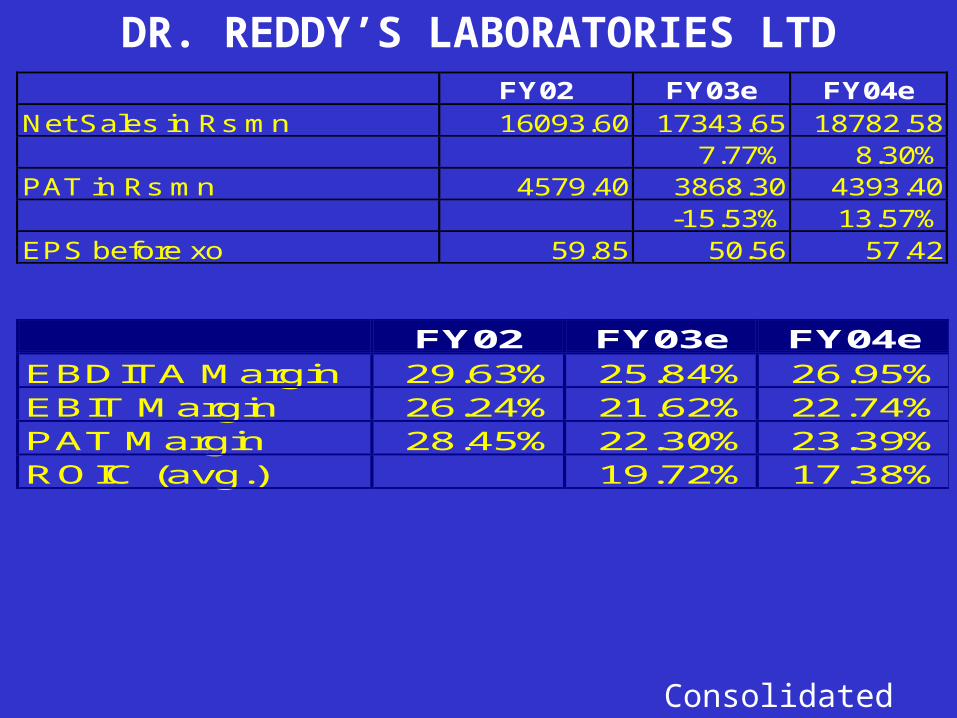
Net Sales in Rs mn 16093.60 17343.65 18782.587.77% 8.30%
PAT in Rs mn 4579.40 3868.30 4393.40-15.53% 13.57%
EPS before xo 59.85 50.56 57.42
FY02 FY03e FY04eEBDITA Margin 29.63% 25.84% 26.95%EBIT Margin 26.24% 21.62% 22.74%PAT Margin 28.45% 22.30% 23.39%ROIC (avg.) 19.72% 17.38%
Consolidated figures

Price-Rolling PE bands
0
200
400
600
800
1000
1200
1400
1600S
ha
re P
rice
PE=18
PE=25
DR. REDDY’S LABORATORIES LTD
RISK :
VALUATION COMMENTS :OUTPERFORM (GOOD FOR TRADING)

SUN PHARMACEUTICAL IND. LTD.
FACTS IMPROVED MARGINS ON EXITING THE LOW MARGIN CEPHALOSPORIN BUSINESS. Q3, FY03 PAT IMPROVED BY 20% TO RS 558.5 mn. IN ALL 9 DMFs FILED. APPROVALS OBTAINED FOR PENTOXYFILENE AND METROPOLAL TARTARATE. 6 DMFs TO BE FILED FOR THE NEXT TWO YEARS. BULK WILL BE SUPPLIED EVEN TO OTHER PLAYERS IN USA (NOT ONLY CARACO)
3-4 NEW PRODUCTS PER DIVISION FOR THE NEXT 2 YEARS.
OUR SALES EXTIMATE FOR CARACO FO FY03 IS $ 44.59 mn. ESTIMATED CASH EPS IS $ 0.21/SHARE. THE COMPANY SHOULD MAKE A CASH PROFIT OF $ 3.63 MN IN FY03.

SUN PHARMACEUTICAL IND. LTD.
FY01 FY02 FY03e FY04e FY05eNet Sales (Rs mn) 5410.60 6684.20 7695.29 8850.12 10255.90
23.54% 15.13% 15.01% 15.88%PAT (Rs mn) 1351.80 1712.80 2083.18 2477.86 2797.80
26.71% 21.62% 18.95% 12.91%EPS (basic) Rs/share 28.78 35.78 22.15 26.37 29.79
DOMESTIC MARKET CONTRIBUTED TO 82.7% OF TURNOVER IN Q3, FY03.
FY01 FY02 FY03e FY04e FY05eEBDITA Margin 27.94% 28.93% 30.25% 31.70% 33.05%EBIT Margin 24.94% 26.33% 27.69% 29.14% 30.49%PAT Margin 24.98% 25.62% 27.07% 28.00% 27.28%ROIC 25.05% 29.21% 25.08% 22.27% 19.27%
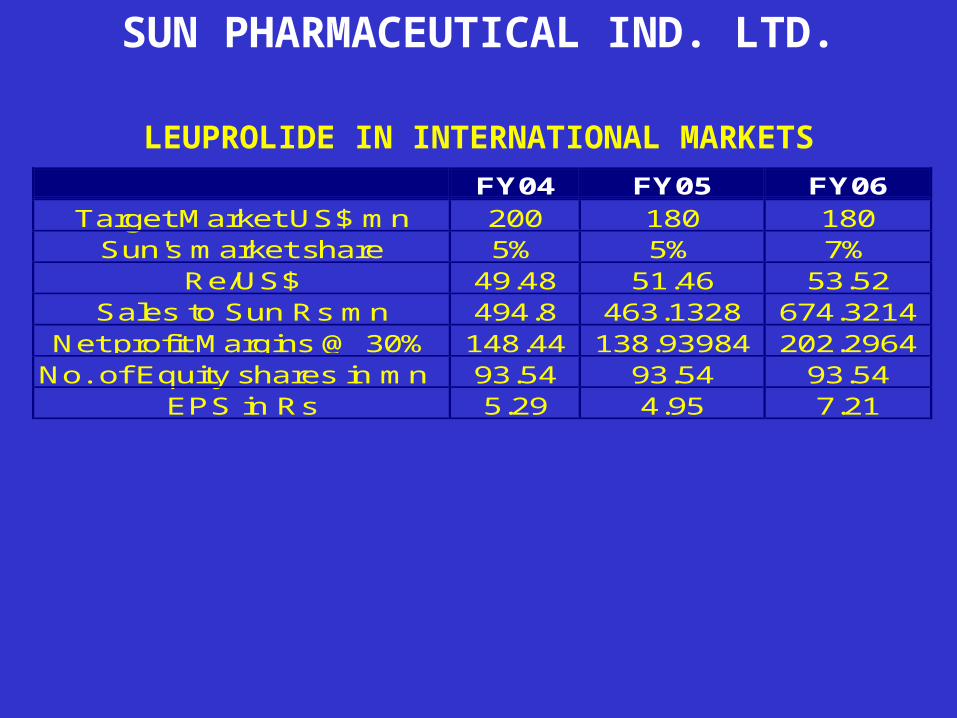
SUN PHARMACEUTICAL IND. LTD.
LEUPROLIDE IN INTERNATIONAL MARKETSFY04 FY05 FY06
Target Market US$ mn 200 180 180Sun's market share 5% 5% 7%
Re/US$ 49.48 51.46 53.52Sales to Sun Rs mn 494.8 463.1328 674.3214
Net profit Margins @ 30% 148.44 138.93984 202.2964No. of Equity shares in mn 93.54 93.54 93.54
EPS in Rs 5.29 4.95 7.21

SUN PHARMACEUTICAL IND. LTD.
Price-Rolling PE Bands
050100150200250300350400450500
Sh
are
Pri
ce
PE=15
PE=20
VALUATION COMMENTS :BUY (LONGER TERM BET)
RISK :

CIPLA LTD.
FACTS
LOSS OF MARGINS AND DELAY IN ASTHMA INHALER EXPORTS HAVE LEAD TO STOCK TRADING NEAR 52 WEEK LOW.
STRATEGY OF LAUNCHING MANY NEW BRANDS NOT SUSTAINABLE IN THE LONG RUN.
STRATEGY FOR BULK EXPORTS TO PARA IV AND EXPORT OF INHALERS ARE THE CATALYSTS AND PILLARS OF CIPLA’S STRATEGY; IMPACTING THE RATING OF THE STOCK.

CIPLA LTD. FY01 FY02 FY03e FY04e FY05e Net Sales in Rs mn 9666.81 12745.14 15330.1 18273.57 21876.08 yoy 31.84% 20.28% 19.20% 19.71% PAT before xo in Rs mn 1788.84 2349.47 2828.138 3611.848 4309.101 yoy 31.34% 20.37% 27.71% 19.30% Basic EPS befroe xo 29.83 39.18 47.16 60.23 71.85 FY01 FY02 FY03e FY04e FY05e EBDITA Margin 22.34% 22.73% 24.75% 25.54% 25.54% EBIT Margin 20.70% 21.05% 22.76% 23.70% 23.70% PBT margin 24.56% 24.26% 24.05% 26.01% 26.26% PAT margin 18.50% 18.43% 18.45% 19.77% 19.70% ROIC(avg) 24.38% 25.56% 24.66% 22.91%
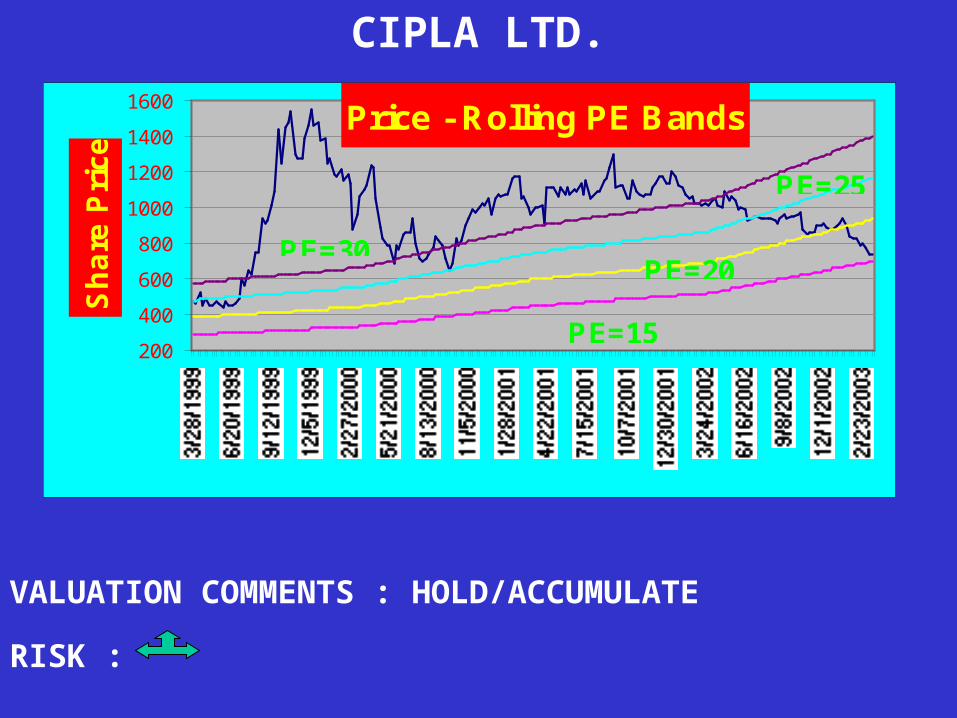
CIPLA LTD.
Price - Rolling PE Bands
200
400
600
800
1000
1200
1400
1600S
ha
re P
rice
PE=15
PE=30
PE=25
PE=20
VALUATION COMMENTS : HOLD/ACCUMULATE
RISK :
WOCKHARDT LTD.
FACTS
OWN FACILITIES IN BIOTECH TO AID MARGINS
HUMAN INSULIN LAUNCH IN 2Q,FY03.
TWO OF THE SUPERGENRICS TO BE LAUNCHED IN REGULATED MARKETS IN 3Q OR 4Q, FY03 ON OBTAINING NECESSARY APPROVAL.
BIOTECH PRODUCTS LAUNCHED IN LESS REGULATED MARKETS. LAUNCH IN REGULATED MARKETS IN EARLY 2005.
EXITING OF PLAYERS FROM HEP-B IN DOMESTIC MARKET TO WORK WELL FOR WOCKHARDT.

WOCKHARDT LTD.
Consolidated figures
FY01 FY02 FY03e FY04eNet Sales in Rs mn 6947.44 7660.56 8426.61 9269.28
yoy 10.26% 10.00% 10.00%PAT in Rs mn 1063.15 1050.00 1192.83 1350.59
yoy -1.24% 13.60% 13.23%Basic EPS 29.32 28.95 32.89 37.24
FY01 FY02 FY03e FY04eBasic EPS 29.32 28.95 32.89 37.24EBDITA Margin 20.40% 18.30% 19.20% 20.26%EBIT Margin 18.01% 15.93% 16.83% 17.88%PBT Margin 16.80% 15.13% 16.09% 17.14%PAT Margin 15.30% 13.71% 14.16% 14.57%ROIC (avg) 27.29% 25.44% 23.57%

WOCKHARDT LTD.
Price-Rolling PE bands
300
350
400
450
500
550
600
650
700S
ha
re P
ric
e
PE=15
PE=20
VALUATION COMMENTS : BUY / UNDERVALUED
RISK : IN MEDIUM TERM
DisclaimerT his document has been prepared by SBI Capital Markets Ltd. (SBICAP), and is based upon information available to the public and sources, we believe, to be reliable. Though utmost care has been taken to ensure its accuracy, no representation is made that it is accurate or complete. SBICAP may solicit investment banking business from entities referred to in this document. SBICAP and others associated with it may have positions in, and effect transactions in securities prior to publication of this document.This document does not have regard to the specific investment objectives, financial situation and the particular needs of any specific person who may receive this document. Any such person shall be responsible for conducting his/her own investigation and analysis of the information contained or referred to in this document and of evaluating the merits and risks involved in the securities forming the subject matter of this document. This document does not constitute an offer or invitation to purchase or subscribe to any securities, and neither this document nor anything contained herein shall form the basis of or be relied upon in connection with any contract or commitment whatsoever. The opinions expressed in this document are solely those of SBICAP and are as of this date. These opinions are subject to change without notice. Neither this document nor any copy hereof may be taken or transmitted outside India.The Analyst & his dependants do not hold any shares of the pharmaceutical companies covered in this presentation. SBI Capital Markets does not hold any shares of the pharmaceutical companies covered in this presentation.
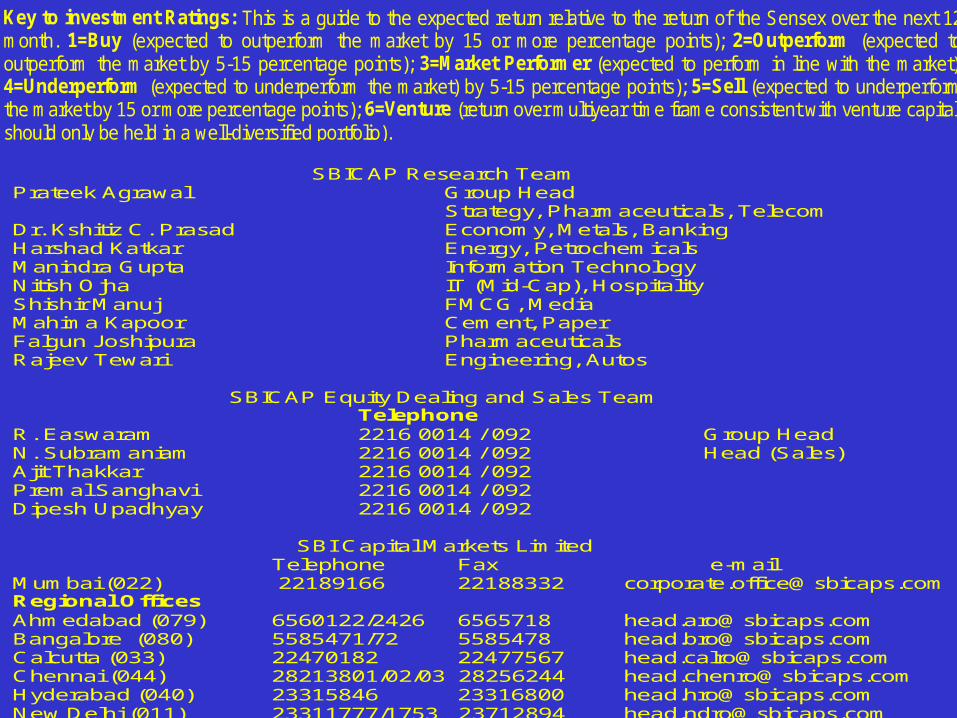
Key to investment Ratings: This is a guide to the expected return relative to the return of the Sensex over the next 12month. 1=Buy (expected to outperform the market by 15 or more percentage points); 2=Outperform (expected tooutperform the market by 5-15 percentage points); 3=Market Performer (expected to perform in line with the market);4=Underperform (expected to underperform the market) by 5-15 percentage points); 5=Sell (expected to underperformthe market by 15 or more percentage points); 6=Venture (return over multiyear time frame consistent with venture capital,should only be held in a well-diversified portfolio).
SBICAP Research TeamPrateek Agrawal Group Head
Strategy, Pharmaceuticals, TelecomDr. Kshitiz C. Prasad Economy, Metals, BankingHarshad Katkar Energy, PetrochemicalsManindra Gupta Information TechnologyNitish Ojha IT (Mid-Cap), HospitalityShishir Manuj FMCG, MediaMahima Kapoor Cement, PaperFalgun Joshipura PharmaceuticalsRajeev Tewari Engineering, Autos
SBICAP Equity Dealing and Sales TeamTelephone
R. Easwaram 2216 0014 / 092 Group HeadN. Subramaniam 2216 0014 / 092 Head (Sales)Ajit Thakkar 2216 0014 / 092Premal Sanghavi 2216 0014 / 092Dipesh Upadhyay 2216 0014 / 092
SBI Capital Markets LimitedTelephone Fax e-mail
Mumbai (022) 22189166 22188332 [email protected] OfficesAhmedabad (079) 6560122/2426 6565718 [email protected] (080) 5585471/72 5585478 [email protected] (033) 22470182 22477567 [email protected] (044) 28213801/02/03 28256244 [email protected] (040) 23315846 23316800 [email protected] Delhi (011) 23311777/1753 23712894 [email protected]


![[XLS] · Web viewCHETAN JINDAL ANIL VIJAYVARGIA MOH. WAZID KHAN NARENDRA KUMAR GANPAT GANPATI CONNECT VIKRAM GIL GHANSHYAM RANKAWAT FALGUN MITTAL GOPAL LAL CHOUDHARY RAMESH](https://static.fdocuments.in/doc/165x107/5aaea7dd7f8b9a59478c5817/xls-viewchetan-jindal-anil-vijayvargia-moh-wazid-khan-narendra-kumar-ganpat-ganpati.jpg)