
PRESENTATION ON CEZ GROUP FINANCIAL RESULTS IN Q1–Q3 … · PRESENTATION ON CEZ GROUP FINANCIAL...
38
PRESENTATION ON CEZ GROUP FINANCIAL RESULTS IN Q1–Q3 2017 NON-AUDITED CONSOLIDATED RESULTS PREPARED IN ACCORDANCE WITH INTERNATIONAL FINANCIAL REPORTING STANDARDS (IFRS) November 7, 2017
Transcript of PRESENTATION ON CEZ GROUP FINANCIAL RESULTS IN Q1–Q3 … · PRESENTATION ON CEZ GROUP FINANCIAL...

PRESENTATION ON CEZ GROUPFINANCIAL RESULTSIN Q1–Q3 2017
NON-AUDITED CONSOLIDATED RESULTSPREPARED IN ACCORDANCE WITH INTERNATIONAL FINANCIAL REPORTINGSTANDARDS (IFRS)
November 7, 2017

1
Financial Highlights and Annual Outlook
Results and Selected Events—Development Team
Results and Selected Events—Operations Team
CONTENTS

2
FINANCIAL HIGHLIGHTS: Q1–Q3 2017
* The values of adjusted net income exclude extraordinary effects that are generally unrelated to ordinary financial performance in a givenyear (such as fixed asset impairments and goodwill write-offs); see the Annex for a detailed indicator definition and calculation method.
Operating revenues increased by 1% year-on-year to CZK 146.7bn.
EBITDA decreased by 6% year-on-year to CZK 41.1bn.
Net income increased by 13% year-on-year to CZK 16.6bn.
Adjusted net income* increased by 4% year-on-year to CZK 17.3bn.
CEZ share price development since Jul 1, 2017
EZ
%
BloombergUtilitiesIndex
CZK 476(at Nov 3)
Oct 1
EEX CAL 18electricity price
95
100
105
110
115
120
125
CZK 398(at Jul 1)

3
CEZ GROUP FINANCIAL AND OPERATING RESULTS
* Adjusted net income = Net income adjusted for extraordinary effects that are generally unrelated to ordinary financial performance in agiven year (such as fixed asset impairments and goodwill write-offs).
** At the last date of the period*** The increase is primarily related to new acquisitions, in particular of German company Elevion (almost 2,000 employees), and insourcing
of purchased services in Czechia
Due to precise mathematical rounding, the sum of partial values listed can sometimes differ from the total value.
(CZK bn) Q1 - Q3 2016 Q1 - Q3 2017 Change %Revenues 145.1 146.7 +1.6 +1%EBITDA 43.8 41.1 -2.7 -6%EBIT 21.6 19.4 -2.2 -10%Net income 14.7 16.6 +1.9 +13%Net income - adjusted * 16.7 17.3 +0.6 +4%Operating CF 40.5 36.2 -4.3 -11%CAPEX 21.5 19.2 -2.3 -11%Net debt ** 140.0 137.0 -3.1 -2%
Q1 - Q3 2016 Q1 - Q3 2017 Change %Installed capacity ** GW 16.1 15.5 -0.6 -4%Generation of electricity - traditional energy TWh 44.0 44.6 +0.6 +1%Generation of electricity - new energy TWh 1.1 1.4 +0.3 +25%Electricity distribution to end customers TWh 36.8 38.3 +1.5 +4%Electricity sales to end customers TWh 26.8 27.2 +0.3 +1%Sales of natural gas to end customers TWh 5.1 6.7 +1.6 +30%Sales of heat 000´TJ 15.3 15.8 +0.5 +3%Number of employees **) ***) 000´s 26.6 29.3 +2.7 +10%

4
YEAR-ON-YEAR CHANGE IN EBITDA BY SEGMENT
Due to precise mathematical rounding, the sum of partial values listed can sometimes differ from the total value.
Main causes of year-on-year change in Q1–Q3 EBITDA:Traditional Energy
Lower realization prices of generated electricity in Czechia, including the effect of hedges (CZK -3.1bn)Higher expenses on emission allowances in Czechia (CZK -1.3bn)Higher generation at nuclear power plants (CZK +1.2bn)
New Energy—Higher amount of generation due to discontinued generation restrictions by the Romaniantransmission system operator and due to the operation of new wind parks in Germany (CZK +0.7bn)
Sales—Lower gross margin on electricity sales in Romania primarily due to higher purchasing costs of electricity(CZK -0.5bn)

5
(CZK bn) Q1 - Q3 2016 Q1 - Q3 2017 Change %EBITDA 43.8 41.1 -2.7 -6%Depreciation, amortization and impairments* -22.2 -21.6 +0.5 +2%Other income (expenses) -3.3 0.0 +3.4 - Interest income (expenses) -1.6 -2.5 -0.9 -53% Interest on nuclear and other provisions -1.1 -1.2 -0.1 -9% Income (expenses) from investments and securities -0.2 3.8 +4.0 - Other -0.4 0.0 +0.4 +95%Income taxes -3.6 -2.9 +0.7 +19%Net income 14.7 16.6 +1.9 +13%Net income - adjusted 16.7 17.3 +0.6 +4%
OTHER INCOME (EXPENSES)
Depreciation, Amortization, and Impairments* (CZK +0.5bn)Nonrecurrent income from sale of properties in Prague (CZK +1.1bn)Higher fixed asset impairments in 2016 (CZK +0.7bn)Higher depreciation and amortization (CZK -1.3bn), primarily due to putting renovated Pruné ov power plant into operation in 2016
Other Income (Expenses) (CZK +3.4bn)Effect of termination of MOL stockholding (CZK +4.3bn), where overall effect of sale of MOL stock, including related operations, onprofits in Q1–Q3 2017 was CZK +4.6bn and total profits in Q1–Q3 2016 were CZK +0.3bnHigher interest expenses primarily due to lower interest capitalization after renovation of Pruné ov power plant in 2016 (CZK -0.9bn)Share of the profit or loss of associates and joint ventures (CZK -0.4bn)Other effects (CZK +0.4bn)
Net Income AdjustmentNet income in Q1–Q3 2017 is adjusted for partial goodwill write-off in Turkey (CZK +0.5bn) and for the negative effect of impairmentof fixed assets in Poland (CZK +0.2bn)Net income in Q1–Q3 2016 is adjusted for the negative effect of impairment of fixed asset in Romania (CZK +1.0bn), for partialgoodwill write-off in Turkey (CZK +0.7bn), and for the negative effect of impairment of projects under development in Poland (CZK+0.3bn)
* Including profit/loss from sales of tangible and intangible fixed assets

6
EXPECTED ANNUAL EBITDA OF CZK 52 BN,ADJUSTED NET INCOME OF CZK 19 BN
Selected negative effects ascompared to expectation fromAug 8, 2017:
Expected postponement of courtdecision concerning the payment ofSŽDC debt from 2011 beyond 2017(total impact, including ancillary, onEBITDA of approx. CZK -1.3bn) inrelation to the Supreme Court’sdecision concerning a dispute overthe payment of SŽDC debt from 2010
Selected positive effects ascompared to expectation fromAug 8, 2017:
Lower depreciation and amortizationand higher capitalization of interestexpenses, primarily due to change inthe expected completion date of thenew Ledvice unit (approx. CZK+0.8bn in total)
Adjusted net income values exclude extraordinary effects that are generally unrelated to ordinary financial performance in a givenyear (such as fixed asset impairments and goodwill write-offs).
19 19
0
10
20
2017 E (Aug 8) 2017 E (Nov 7)
53 52
0
20
40
60
2017 E (Aug 8) 2017 E (Nov 7)
EBITDA
ADJUSTED NETINCOME
CZK bn
CZK bn

7
EXPECTED YEAR-ON-YEAR CHANGE IN NET INCOMEMAIN CAUSES (2017 VS. 2016)
Main causes of year-on-year change:EBITDA
Effect of unbilled electricity settlement in Czechia in 2016and effect of correction factors (CZK -2.7bn)Higher expenses on emission allowancesHigher fixed expenses on safety at NPPsDecrease in electricity realization prices including hedgingoffset by increased generation
MOL and sale of residential property (CZK +6.4bn intotal)
Total effect of the MOL transaction (CZK +5.3bn), of whichpositive effect on 2017 income (CZK +4.6bn) and negativeeffect on 2016 income (CZK -0.8bn)Sale of residential property in Prague (CZK +1.1bn)
Other effectsIncrease in depreciation and amortization and lower interestcapitalization primarily due to completion of Pruné ov powerplant‘s renovation in 2016Other effects, primarily of exchange rates and revaluation ofderivatives
NPPs—Nuclear power plants
19
19.6
-1
+6
-6
Adjustednet income
2017 E
Depreciation andamortization,
capitalized interest,and other effects
MOL and sale ofresidential property
EBITDA
Adjusted netincome 2016
CZK bn

8
Financial Highlights and Annual Outlook
Results and Selected Events—Development Team
Results and Selected Events—Operations Team
CONTENTS
9
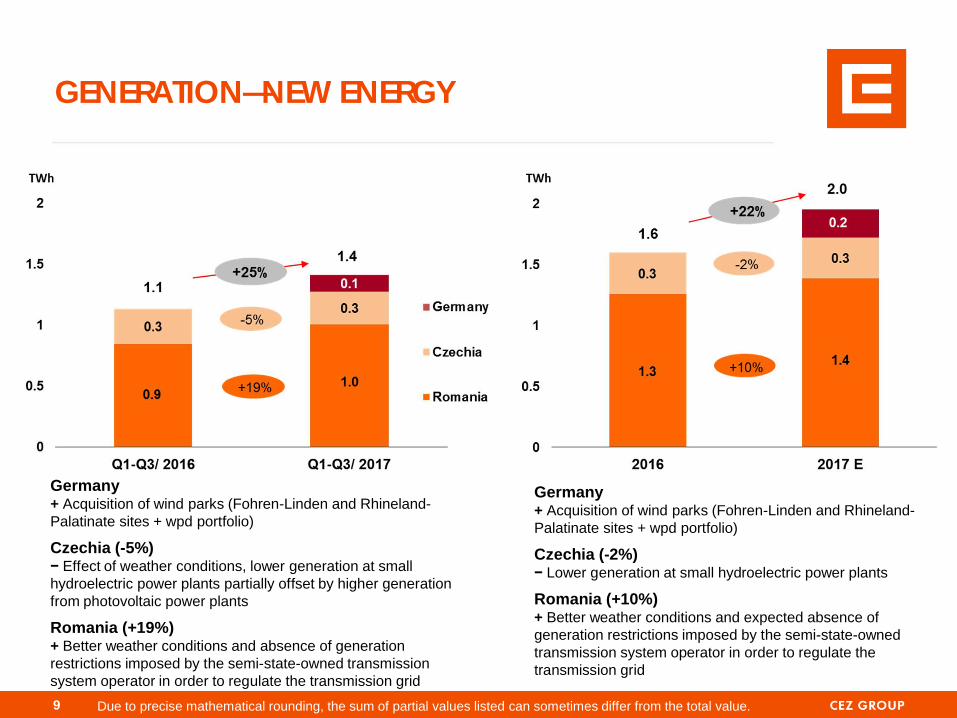
GENERATION—NEW ENERGY
Due to precise mathematical rounding, the sum of partial values listed can sometimes differ from the total value.
Germany+ Acquisition of wind parks (Fohren-Linden and Rhineland-Palatinate sites + wpd portfolio)
Czechia (-5%)Effect of weather conditions, lower generation at small
hydroelectric power plants partially offset by higher generationfrom photovoltaic power plants
Romania (+19%)+ Better weather conditions and absence of generationrestrictions imposed by the semi-state-owned transmissionsystem operator in order to regulate the transmission grid
Germany+ Acquisition of wind parks (Fohren-Linden and Rhineland-Palatinate sites + wpd portfolio)
Czechia (-2%)Lower generation at small hydroelectric power plants
Romania (+10%)+ Better weather conditions and expected absence ofgeneration restrictions imposed by the semi-state-ownedtransmission system operator in order to regulate thetransmission grid

10
EBITDA (CZK bn) Q1 - Q3 2016 Q1 - Q3 2017 Change %Czechia 1.6 1.6 0.0 -1%Poland -0.4 0.0 +0.4 +94%Romania 1.2 1.6 +0.4 +30%Germany 0.0 0.3 +0.3 -Other states 0.0 0.0 0.0 -4%Generation - new energy 2.4 3.4 +1.0 +42%
SEGMENT: GENERATION—NEW ENERGY
Poland (CZK +0.4bn)Effect of additions to impairments of Ecowind projects in 2016
Romania (CZK +0.4bn)Primarily higher amount of generation at Fântânele and Cogealac wind farms (due to generation restrictionsimposed by the transmission system operator in 2016)
Germany (CZK +0.3bn)Effect of operation of new wind turbines acquired by CEZ Group in late 2016
Due to precise mathematical rounding, the sum of partial values listed can sometimes differ from the total value.

11
EBITDA (CZK bn) Q1 - Q3 2016 Q1 - Q3 2017 Change %Czechia 12.3 12.1 -0.2 -2%Romania 1.5 1.4 -0.1 -3%Bulgaria 0.9 1.1 +0.2 +18%Distribution 14.6 14.6 -0.1 -1%
SEGMENT: DISTRIBUTION
Czechia (CZK -0.2bn)Higher operating expenses to cover distribution grid needs including natural disasters and other emergenciesHigher fixed expenses associated with separation of service for EZ Distribuce and EZ Prodej customers
Romania (CZK -0.1bn)Lower margin on distributed electricity, primarily due to higher purchase prices of electricity to cover grid losses(CZK -0.2bn)Lower overhead and lower additions to impairments (CZK +0.2bn)
Bulgaria (CZK +0.2bn)Higher margin on distributed electricity, primarily due to higher amount of electricity distributed to end-usecustomers
Due to precise mathematical rounding, the sum of partial values listed can sometimes differ from the total value.

12
EBITDA (CZK bn) Q1 - Q3 2016 Q1 - Q3 2017 Change %Czechia 3.2 3.1 -0.2 -5%Romania 0.3 0.0 -0.3 -88%Bulgaria 0.3 0.7 +0.3 +88%Other states 0.2 -0.3 -0.4 -Sales 4.1 3.5 -0.6 -14%
SEGMENT: SALES
Czechia (CZK -0.2bn)Higher fixed expenses, primarily in relation to separation of service for EZ Distribuce and EZ Prodej customers(CZK -0.4bn)Higher additions to provisions for debts from EZ Prodej’s electricity and gas sales (CZK -0.1bn)Higher gross margin on gas sales due to lower purchasing costs and greater volume of sales (CZK +0.3bn)
Romania (CZK -0.3bn)Lower gross margin, primarily due to higher expenses on electricity purchases (CZK -0.5bn)Other effects (CZK +0.2bn), primarily reversal of provisions and debt allowances
Bulgaria (CZK +0.3bn)Effect of out-of-court settlement agreement made between CEZ Elektro Bulgaria and state-owned energy companyNEK concerning RES receivables (CZK +0.4bn)Lower gross margin on electricity sales, primarily due to increased imbalance costs (CZK -0.1bn)
Other Countries* (CZK -0.4bn)Primarily lower gross margin of CEZ Slovensko and CEZ Hungary due to higher expenses on electricity and gaspurchases in comparison to record low purchase prices in 2016
Due to precise mathematical rounding, the sum of partial values listed can sometimes differ from the total value.
* German company Elevion included in the consolidation of CEZ Group’s results only since September 2017.

13
EZ PRODEJ – NEW, MORE COMPREHENSIBLE OFFEROF COMMODITY PRODUCTS FOR RETAIL CUSTOMERS
Clearly expressing what we supply and for what period the contract is made forConsistent for electricity and gas in order to make the offer as comprehensible as possible forthe customerNew product “GAS for Indefinite Time” launched with a favourable price
NEW PRODUCT NAME
EZ WITH REWARD
ORIGINAL PRODUCT NAME
COMFORT
EZ ELE WITH SAVINGS
EZ GARANT PLUS
EZ ELE WITH REWARD
Newly created product
EZ GAS WITH SAVINGS
EZ WITH GUARANTEE
for Indefinite Period
for 1 Year
for 2 Years
for 3 Years
for Indefinite Period
for 1 Year
for 2 Years
for 3 Years
ELECTRICITY
GAS
800 810 820 EZ PRODEJ 800 850 860 EZ DISTRIBUCEIN ADDITION, NOVELTY IN SERVICE: Free customer care line available MON–SUN / 7 AM–8 PM

Simple operation using a mobile appOnline shopping: a dedicated e-shop created for tado° sales
Economically controls temperature based on users’ behavior andweather forecastAutomatically turns down the heating when the user leaves homeand begins to warm up again when it detects the user is returning
SMART ENERGY TURNKEY SOLUTIONS FROM EZCOMPREHENSIVELY ANSWER THE NEEDS OF RETAILCUSTOMERS
EZ TURNKEY HEATING
tado° smartthermostat
Commodity
Financing
Unit sale andinstallation
Heatingmaintenance
Subsidymanagement
Energyconsulting

15
THE DEVELOPMENT TEAM CONTINUES TO FULFILL THEGROWTH STRATEGY THROUGH ACQUISITIONS
Elevion—one of the largest providers of comprehensive energy services in Germany—hasbeen fully consolidated in CEZ Group’s accounts since September
Following approval of the communicated transaction by competition authorities, the consolidation of Elevion’saccounts into CEZ Group started in September 2017.The company has annual revenues of approx. CZK 8bn and more than 1,900 employees.
KART, a new acquisitionKART has been providing comprehensive services in the delivery, operation, and maintenance of engineeringfacilities in the Czech market for 25 years. Its customers include scientific centers, art galleries, hotel chains, andadministrative complexes.The company has annual revenues of approx. CZK 130m and about 150 employees.
Acquisition of VULOG signed through Inven CapitalThe company offers a comprehensive Software-as-a-Service platform enabling car sharing operators to provideservices to their customers. The application is currently used by about 4,000 cars.VULOG clients are major operators on four continents:
Europe (emov in Madrid and Panek in Warsaw)North America (EVO in Vancouver)South America (Urbano in São Paulo)Australia—New Zealand (Mevo in Wellington)
With this investment CEZ Group is further enhancing its know-how regarding smart cities.The company has annual revenues of approx. EUR 3m and 75 employees.

16
Distribution regulation in CzechiaIn August, the Energy Regulatory Office published its proposal for price regulation policy in 2019–2020,proposing to maintain the principles of regulation from 2016–2018 also in the period of 2019–2020.At the same time, it started the process of public consultation on the price regulation framework for the 5thregulatory period.
Developments in the suit for damages claimed by EZ Prodej from SŽDC for lossincurred in 2010
In its judgment dated August 10, 2017, the Supreme Court admitted the devolutive appeal filed by SŽDC,overturning the previous judgments of lower courts and returning the suit for damages claimed for lossincurred in 2010 (CZK 0.8bn + ancillary CZK 0.3bn) to the court of first instance for a new hearing.Following the decision of the Supreme Court, which primarily considered the procedural aspects, EZProdej paid SŽDC back only legal expenses of approx. CZK 15 million and, in view of legal opinions on thedecision, did not pay it back the already paid damages (on the grounds of claim expiry due to performanceof SŽDC’s initial obligation).According to the Supreme Court’s judgment, the court of first instance should examine, among otherthings, whether EZ Prodej fulfilled its duty of prevention as well as whether there might have been anycircumstances precluding SŽDC’s liability.
Sale of the Varna power plantEZ made an agreement on the terms of sale of its hard coal-fired power plant in Varna, Bulgaria
(1,260 MW), whose operation was suspended on Jan 1, 2015.EZ decided to accept the offer of Bulgarian company SIGDA OOD.
The transaction is subject to approval of the Bulgarian antimonopoly authority.
SELECTED EVENTS—DEVELOPMENT TEAM

17
Financial Highlights and Annual Outlook
Results and Selected Events—Development Team
Results and Selected Events—Operations Team
CONTENTS

18
GENERATION—TRADITIONAL ENERGY
Due to precise mathematical rounding, the sum of partial values listed can sometimes differ from the total value.
Nuclear Power Plants (+9%)+ Shorter outages at Temelín NPP
Coal-Fired Power Plants (-6%)Czechia (-6%)
Sale of Tisová power plant, longer outages at Pruné ov 2 andTušimice 2 power plants
+ Operation of Ledvice 4 power plant (new facility) during constructionPoland (-5%)
Stricter NOx emission ceilings resulting from Interim National Plan andprolongation of planned repairs
Other (+11%)+ Primarily increased generation at Po erady CCGT plant
Nuclear Power Plants (+18%)+ Shorter outages at Temelín NPP
Coal-Fired Power Plants (-6%)Czechia (-6%)
Sale of Tisová power plant, lower operation of D tmarovice powerplant, longer outage of Tušimice 2 power plant, lower operation atPruné ov (NOx emission ceilings)
+ Operation of Ledvice 4 power plant (new facility)Poland (-4%)
Stricter NOx emission ceilings resulting from Interim National Plan
Other (+4%)+ Primarily increased generation at Po erady CCGT plant

19
SEGMENT: GENERATION—TRADITIONAL ENERGY
Czechia (CZK -3.0bn)Lower realization prices of generated electricity, including the effect of hedges (CZK -3.1bn)Higher expenses on emission allowances (CZK -1.3bn)Higher generation at nuclear power plants (CZK +1.2bn)Effect of settlement agreement with Sokolovská uhelná (CZK +0.7bn)Other effects (CZK -0.5bn), primarily higher expenses on maintenance and less profit from commodity trading
Poland (CZK -0.1bn)Primarily lower generation due to lower utilization of certificates (lower volume of biomass co-firing) and dueto stricter emission ceilings for NOx
Due to precise mathematical rounding, the sum of partial values listed can sometimes differ from the total value.
EBITDA (CZK bn) Q1 - Q3 2016 Q1 - Q3 2017 Change %Czechia 16.6 13.6 -3.0 -18%Poland 0.9 0.8 -0.1 -14%Other states 0.0 0.0 0.0 +57%Generation - traditional energy 17.4 14.3 -3.1 -18%

20
MINING SEGMENT AND OTHER SEGMENT
Due to precise mathematical rounding, the sum of partial values listed can sometimes differ from the total value.
Mining (CZK +0.1bn)Higher revenue from coal sales, primarily due to higher demand for sorted coal by external customers
EBITDA (CZK bn) Q1 - Q3 2016 Q1 - Q3 2017 Change %Czechia 1.9 2.0 0.0 +2%Romania 0.1 0.1 0.0 +2%Other states 0.0 -0.1 -0.1 -Other 2.0 2.0 0.0 -2%
EBITDA (CZK bn) Q1 - Q3 2016 Q1 - Q3 2017 Change %Czechia 3.2 3.3 +0.1 +2%Mining 3.2 3.3 +0.1 +2%

21
SELECTED EVENTS IN NUCLEAR POWER
Temelín Nuclear Power PlantOn Jul 31, 2017, an outage of Unit 2 ended 12 days ahead of schedule. It lasted 73 days in total.The most important activities included the modernization of a cluster of safety valves on thepressurizer and overhaul of circulating cooling water pumps.
Dukovany Nuclear Power PlantOn Jun 28, 2017, EZ received a renewed operating license for Unit 2 from SÚJB.Like for Unit 1, the license is for an indefinite period of time and conditional on meeting the conditionsset by the decision.On Jun 30, 2017, applications for long-term operating licenses for Units 3 and 4 were submittedto SÚJB.A six-month administrative procedure is underway to review the applications and, if appropriate, toamend the Consolidated Readiness Report.On Sep 9, 2017, an outage of Unit 4 ended one day ahead of schedule, lasting 119 days in total.In addition to standard activities, it involved major capital investment projects such as the replacementof super-accident feed piping, reconstruction of ventilation, or reconstruction of the instrumentationand control system at the central pumping station.On Nov 3, 2017, an outage of Unit 3 ended, lasting 112 days in total (5 days behind schedule).The outage involved an inspection of the reactor pressure vessel, weld repairs, replacement of theinstrumentation and control system, replacement of secondary seals, replacement of super-accidentfeed piping, and inspections of high-pressure parts.

100% amount of deliveries in 2018–2020corresponds to 55–56 TWh.
EZ CONTINUES HEDGING ITS GENERATIONREVENUES IN THE MEDIUM TERM IN LINE WITHSTANDARD POLICY
Source: EZ * EZ, a. s. including Energotrans, Po erady, D tmarovice, and Vítkovice power plants
For price EUR/MWh(BL equivalent)
0%
25%
50%
75%
100%
2018 2019 2020 2021 2022 2023
Share of Hedged Deliveries from EZ* FacilitiesAs at Oct 31, 2017
~50%~80%
~1%
~7%
~22%
~2%~3%~5%
~4%
~0% ~0%~0%
Total hedged of production~ 81 % ~ 57 % ~ 26 % ~ 5 % ~ 3 % ~ 2 %
30,0 29,5 33,0 31,0 33,0 35,5
22
Hedged volume as at Aug 1, 2017
Hedged volume from Aug 2, 2017 to Oct 31, 2017
Transaction currency hedging
Natural currency hedging—debts in EUR, capitaland other expenditures and costs in EUR

23
ANNEXES
EBITDA—Q3 Year-on-Year ComparisonNet Income—Q3 Year-on-Year ComparisonCash FlowsCredit Facilities and BondsInvestments in Fixed AssetsBalance Sheet OverviewMiningElectricity ConsumptionMarket DevelopmentsElectricity Procured and SoldDefinitions of Alternative Indicators According to ESMA

24
CEZ Group EBITDA (CZK -0.9bn):Generation—Traditional Energy (CZK -1.0bn): Lower realization prices of generated electricity, including the effect of hedges(CZK -1.4bn); higher expenses on emission allowances (CZK -0.2bn); higher fixed costs (CZK -0.2bn) primarily due to equipmentmaintenance; change in amount and structure of generation (CZK +1.2bn), primarily higher generation at NPPs; other effects (CZK-0.4bn), primarily revaluation of derivativesGeneration—New Energy (CZK +0.5bn): Primarily the effect of additions to impairments of Eco-Wind projects in 2016 (CZK+0.4bn) and higher amount of generation at wind farms in Romania and Germany (CZK +0.2bn)Distribution (CZK -0.1bn): Primarily Czechia—higher additions to impairments and higher operating expenses of EZ DistribuceSales (CZK -0.1bn): Lower margins on electricity sales in Romania, Bulgaria, and Slovakia, primarily due to changes in electricitypurchase prices (CZK -0.4bn); higher gross margin of EZ Prodej from sales of electricity and gas due to lower expenses onpurchases and higher amount of gas sold (CZK +0.4bn); higher fixed expenses of EZ Prodej and ESCO group (CZK -0.2bn);higher reversal of provisions and adjustments to receivables in Romania (CZK +0.2bn)
NPPs = nuclear power plants
EBITDAQ3 YEAR-ON-YEAR COMPARISON
25
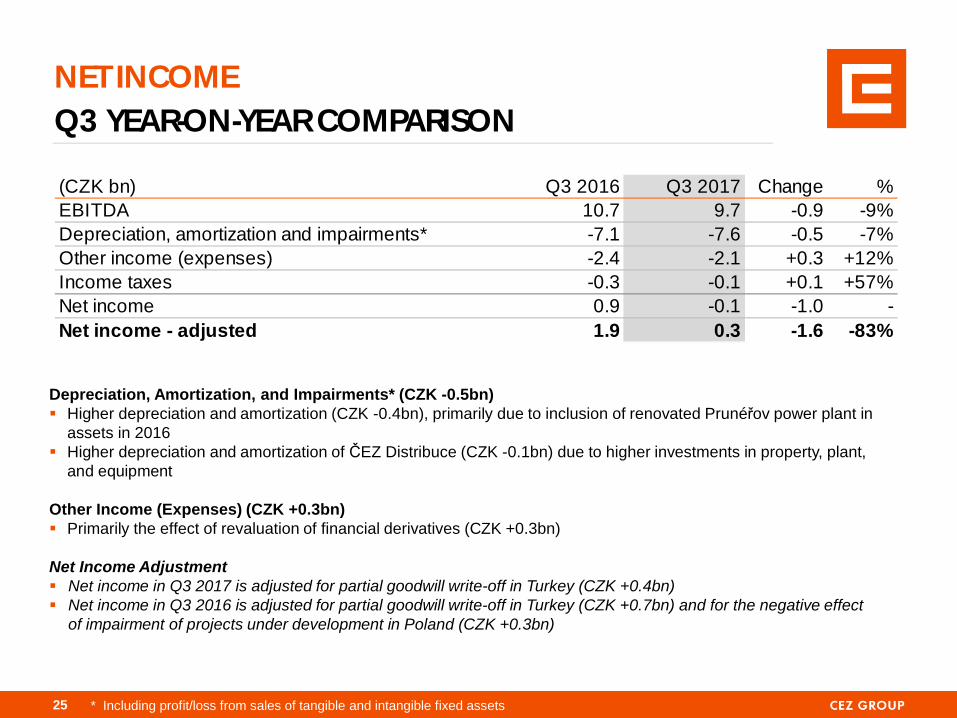
NET INCOMEQ3 YEAR-ON-YEAR COMPARISON
* Including profit/loss from sales of tangible and intangible fixed assets
Depreciation, Amortization, and Impairments* (CZK -0.5bn)Higher depreciation and amortization (CZK -0.4bn), primarily due to inclusion of renovated Pruné ov power plant inassets in 2016Higher depreciation and amortization of EZ Distribuce (CZK -0.1bn) due to higher investments in property, plant,and equipment
Other Income (Expenses) (CZK +0.3bn)Primarily the effect of revaluation of financial derivatives (CZK +0.3bn)
Net Income AdjustmentNet income in Q3 2017 is adjusted for partial goodwill write-off in Turkey (CZK +0.4bn)Net income in Q3 2016 is adjusted for partial goodwill write-off in Turkey (CZK +0.7bn) and for the negative effectof impairment of projects under development in Poland (CZK +0.3bn)
(CZK bn) Q3 2016 Q3 2017 Change %EBITDA 10.7 9.7 -0.9 -9%Depreciation, amortization and impairments* -7.1 -7.6 -0.5 -7%Other income (expenses) -2.4 -2.1 +0.3 +12%Income taxes -0.3 -0.1 +0.1 +57%Net income 0.9 -0.1 -1.0 -Net income - adjusted 1.9 0.3 -1.6 -83%

26
Cash Flows From Operating Activities (CZK +36.2bn)Income after adjustments (CZK +37.2bn): earnings before taxes (CZK +19.5bn), depreciation and amortization of nuclear fuel (CZK +25.2bn), lossfrom associates and joint ventures (CZK +1.4bn), income from sale of fixed assets (CZK -5.8bn), income tax paid (CZK -3.0bn)Changes in assets and liabilities (CZK -1.1bn): change in inventory of emission allowances (CZK -3.8bn), change in the balance of payables andreceivables from derivatives incl. options (CZK -2.4bn), change in trade receivables and payables including advances and accruals/deferrals (CZK -1.0bn), change in inventories of materials and fossil fuels (CZK -1.0bn), change in other receivables and payables (CZK +4.2bn), change insecurities and term deposits (CZK +2.9bn)
Cash Flows Used in Investing Activities (CZK -11.7bn)Investments in property, plant, and equipment*—CAPEX (CZK -19.2bn), liabilities attributable to capital expenditure (CZK -2.2bn)Acquisition of subsidiaries and affiliates (CZK -4.9bn), in particular Elevion and KARTIncome from sale of non-current assets (CZK +14.0bn), impact of MOL shares‘ sale in particular; other (CZK +0.6bn)
Cash Flows Used In Financing Activities (CZK -21.4bn)***Dividends paid to shareholders (CZK -17.8bn)Balance of loans and repayments (CZK -3.1bn)
CASH FLOWS
*CAPEX; **Including changes in payables from the acquisition of fixed assets, balance of loans granted, divestments, and changes ofrestricted funds; ***Including net effect of currency translation in cash

27
Undrawn,committed
Drawn,committed
Drawn,uncommitted
CEZ GROUP MAINTAINS A STRONG LIQUIDITYPOSITION
Utilization of Short-Term Lines (as at Sep 30, 2017)
Available creditfacilities
CZK 18.6bn
CZK 10.1bn
CEZ Group has access to CZK 28.7bn incommitted credit facilities, using CZK 10.1bnas at Sep 30, 2017.
Committed facilities are kept as a reserve forcovering unexpected needs and for fundingshort-term financial needs.
The payment of dividends for 2016 (CZK17.6bn) began on August 1, 2017. 99% of theamount was paid as at Sep 30.
EUR 225m tap of 2028 bond issue was issuedon September 20, 2017. The effective yield ofthe tap issue is 1.766%.
0
5
10
15
20
25
2017
2018
2019
2020
2021
2022
2023
2024
2025
2028
2030
2032
2038
2039
2042
2047
EURCZK JPY USD
mld. K
Bond Maturity Profile (as at Sep 30, 2017)
CZK 1.8bn
CZK bn

28
4.7
0.9
1.7
3.3
8.7
INVESTMENTS IN FIXED ASSETS
Distribution segment:Czechia: CZK 7.1bnAbroad: CZK 1.5bn
CZK 19.2bn in total(Q1–Q3 2017)
Due to precise mathematical rounding, the sum of partial values can sometimes differ from the total value.
Conventional and other generating facilities:Construction of a new supercritical unit in LedviceOther investments in facility renovation
Nuclear facilities (including nuclear fuel procurement):Investments in existing facilities at Temelín NPP and Dukovany NPP for the purpose ofnuclear safety enhancement and process equipment renovationProcurement of nuclear fuelNew nuclear power plants at Temelín and Dukovany—Preparation of projects at bothsites, Temelín and Dukovany, continues in accordance with the approved National ActionPlan for Nuclear Energy
Mining segment:Modernization and renovation of existingfacilities
OtherPrimarily investments in ICT assets

BALANCE SHEET OVERVIEWFixed tangible assets, nuclear fuel, and investments decreased byCZK 6.6bn
Primarily due to depreciation and amortization (see slide Other Income(Expenses)), partially offset by capital expenditure (see CAPEX)
Other noncurrent assets decreased by CZK 3.3bnDecrease in noncurrent financial assets of CZK 4.6bn, primarily due toreclassification of available-for-sale securities as current assetsDecrease in the value of investment in associates and joint ventures of CZK1.9bn, primarily due to the liquidation of CMEPI B.V.Increase in noncurrent intangible assets of CZK 3.6bn in connection withgoodwill at new acquisitions
Due to precise mathematical rounding, the sum of partial values can sometimes differ from the total value.
Current assets decreased by CZK 8.2bnDecrease in securities and term deposits of CZK 14.1bnDecrease in trade receivables of CZK 5.8bnDecrease in receivables from derivatives incl. options of CZK 3.5bnIncrease in income tax receivables of CZK 2.4bnIncrease in cash and cash equivalents of CZK 2.6bnIncrease in emission allowances of CZK 2.7bnIncrease in inventory of CZK 7.1bn
Equity decreased by CZK 7.4bnPaid dividends of CZK 17.8bnOther comprehensive income decreases equity by CZK 6.2bnIncrease in net income of CZK 16.6bn
Long-term liabilities decreased by CZK 3.1bnDecrease in bonds issued of CZK 5.1bnDecrease in long-term bank loans of CZK 0.8bnIncrease in deferred tax liability of CZK 2.3bn
Current liabilities decreased by CZK 7.5bnDecrease in current portion of long-term debt of CZK 7.7bnDecrease in short-term payables from derivative trading incl. options of CZK3.4bnDecrease in unbilled goods and services of CZK 3.7bnIncrease in short-term loans of CZK 3.6bnIncrease in trade payables incl. advances of CZK 3.6bn

30
4.0 4.2
11.1 11.3
0
5
10
15
20
25
15.6 16.4
5.8 5.7
0
5
10
15
20
25
MINING
Severo eské doly—Coal Extraction (Millions of Tons)
15.1 15.5
Q1–Q32017
Q1–Q32016
2017 E2016
+4%
+2%
21.422.1+3%
-1%
+5%
Increase in saleable output of 0.4 million tons of coal,primarily due to increased consumption by both CEZ Groupcompanies and external customers
EZ*
Other customers
Year-on-year increase in saleable production of 0.7million tons of coal due to expected increase in thermalcoal consumption by CEZ Group
+3%
EZ* = EZ, a. s. including Po erady power plant and Energotrans

31
25.62
26.53
1-9/2016 1-9/2017
25.42
26.36
Temperature- and Calendar-Adjusted**Consumption
(in the Distribution Area of EZ Distribuce)
Consumption in the DistributionArea of EZ Distribuce
* According to data of EZ Distribuce, a. s. (5/8 of Czechia); ** Data and adjustment as per the EZ Distribuce, a. s. model
Changes in consumption(+3.7%)
by segment:*
+4.1% large end-usecustomers+3.8% residentialcustomers+1.7% commercial retail
Analysis based on CEZ Group’s internal data.CEZ Group’s distribution area covers around 5/8 of Czechia’s territory, so the data are a goodindicator of nationwide consumption trends.
TWh
+3.6%
TWh
+3.7%*
ELECTRICITY CONSUMPTION IN THE DISTRIBUTIONAREA OF EZ DISTRIBUCE GREW YEAR-ON-YEAR
*
Q1-Q3 2016 Q1-Q3 2017

32
MARKET DEVELOPMENTS

Electricity balance (GWh)
Electricity procured 40,362 41,510 +3%Generated in-house (gross) 45,148 46,065 +2%
In-house and other consumption, including pumping inpumped-storage plants -4,786 -4,555 -5%
Sold to end customers -26,821 -27,158 +1%Sold in the wholesale market (net) -10,412 -11,242 +8%
Sold in the wholesale market -143,414 -193,704 +35%Purchased in the wholesale market 133,002 182,462 +37%
Grid losses -3,128 -3,110 -1%
Electricity generation by source (GWh)
Nuclear 18,678 20,384 +9%Coal and lignite 22,228 20,968 -6%Water 1,766 1,594 -10%Biomass 674 590 -12%Photovoltaic 120 124 +3%Wind 780 1,091 +40%Natural gas 901 1,311 +46%Bio gas 1 3 +97%
Total 45,148 46,065 +2%
Sales of electricity to end customers (GWh)
Households -9,398 -9,646 +3%Commercial (low voltage) -3,637 -3,529 -3%Commercial and industrial (medium and high voltage) -13,786 -13,983 +1%
Sold to end customers -26,821 -27,158 +1%
Distribution of electricity (GWh)
Distribution of electricity to end customers -36,751 -38,258 +4%
Q1 - Q3 2016 Q1 - Q3 2017Index
2017/2016
Q1 - Q3 2016 Q1 - Q3 2017Index
2017/2016
Q1 - Q3 2016 Q1 - Q3 2017Index
2017/2016
Q1 - Q3 2016 Q1 - Q3 2017 Index2017/2016

Electricity balance (GWh) by segment
Q1 - Q3 2017
GWh +/- GWh +/- GWh +/- GWh +/- GWh +/- GWh +/-
Electricity procured 40,114 +2% 1,396 +25% 0 - 0 - 0 - 41,510 +3%Generated in-house (gross) 44,649 +1% 1,416 +25% 0 - 0 - 0 - 46,065 +2%In-house and other consumption, includingpumping in pumped-storage plants -4,535 -5% -20 -6% 0 - 0 - 0 - -4,555 -5%
Sold to end customers -147 -19% 0 - 0 - -28,498 +2% 1,487 +20% -27,158 +1%Sold in the wholesale market (net) -39,967 +2% -1,396 +25% 3,110 -1% 28,498 +2% -1,487 +20% -11,242 +8%
Sold in the wholesale market -211,730 +31% -2,008 +15% 0 - -1,776 -20% 21,810 -2% -193,704 +35%Purchased in the wholesale market 171,763 +40% 612 -4% 3,110 -1% 30,274 +1% -23,297 -1% 182,462 +37%
Grid losses 0 - 0 - -3,110 -1% 0 - 0 - -3,110 -1%
Electricity generation by source (GWh) by segment
Q1 - Q3 2017GWh +/- GWh +/- GWh +/- GWh +/- GWh +/- GWh +/-
Nuclear 20,384 +9% 0 - 0 - 0 - 0 - 20,384 +9%Coal and lignite 20,968 -6% 0 - 0 - 0 - 0 - 20,968 -6%Water 1,396 -9% 199 -15% 0 - 0 - 0 - 1,594 -10%Biomass 590 -12% 0 - 0 - 0 - 0 - 590 -12%Photovoltaic 0 -20% 124 +3% 0 - 0 - 0 - 124 +3%Wind 0 - 1,091 +40% 0 - 0 - 0 - 1,091 +40%Natural gas 1,311 +46% 0 - 0 - 0 - 0 - 1,311 +46%Bio gas 0 - 3 +97% 0 - 0 - 0 - 3 +97%
Total 44,649 +1% 1,416 +25% 0 - 0 - 0 - 46,065 +2%
Sales of electricity to end customers (GWh) by segment
Q1 - Q3 2017GWh +/- GWh +/- GWh +/- GWh +/- GWh +/- GWh +/-
Households 0 - 0 - 0 - -9,646 +3% 0 - -9,646 +3%Commercial (low voltage) -1 -26% 0 - 0 - -3,528 -3% 0 - -3,529 -3%Commercial and industrial (medium and high -147 -19% 0 - 0 - -15,323 +3% 1,487 +20% -13,983 +1%
Sold to end customers -147 -19% 0 - 0 - -28,498 +2% 1,487 +20% -27,158 +1%
CEZ Group
Generation -traditional energy
Generation - newenergy Distribution Sale Eliminations CEZ Group
EliminationsGeneration -
traditional energyGeneration - new
energy Distribution Sale
CEZ GroupEliminationsGeneration -
traditional energyGeneration - new
energy Distribution Sale

Electricity balance (GWh) by country
Q1 - Q3 2017GWh +/- GWh +/- GWh +/- GWh +/- GWh +/- GWh +/- GWh +/-
Electricity procured 38,562 +3% 1,816 -5% 989 +19% 5 -0% 139 - 0 - 41,510 +3%Generated in-house (gross) 42,867 +2% 2,050 -5% 1,003 +19% 5 -0% 139 - 0 - 46,065 +2%In-house and other consumption, includingpumping in pumped-storage plants -4,306 -5% -235 -3% -14 -10% 0 - 0 - 0 - -4,555 -5%
Sold to end customers -13,008 -6% -2,180 +54% -2,460 +0% -7,227 +4% -2,284 +4% 0 - -27,158 +1%Sold in the wholesale market (net) -23,894 +8% 364 - 2,122 -8% 8,021 +3% 2,145 -2% 0 - -11,242 +8%
Sold in the wholesale market -196,417 +35% -1,998 -8% -1,258 -9% -145 -59% -426 >200% 6,540 +10% -193,704 +35%Purchased in the wholesale market 172,523 +40% 2,362 +41% 3,381 -9% 8,165 +0% 2,571 +12% -6,540 +10% 182,462 +37%
Grid losses -1,659 +3% 0 - -651 -5% -799 -3% 0 - 0 - -3,110 -1%
Electricity generation by source (GWh) by country
Q1 - Q3 2017GWh +/- GWh +/- GWh +/- GWh +/- GWh +/- GWh +/- GWh +/-
Nuclear 20,384 +9% 0 - 0 - 0 - 0 - 0 - 20,384 +9%Coal and lignite 19,088 -6% 1,881 +2% 0 - 0 - 0 - 0 - 20,968 -6%Water 1,531 -9% 8 -12% 56 -21% 0 - 0 - 0 - 1,594 -10%Biomass 428 +16% 162 -47% 0 - 0 - 0 - 0 - 590 -12%Photovoltaic 118 +4% 0 - 0 - 5 -0% 0 - 0 - 124 +3%Wind 5 -1% 0 - 948 +22% 0 - 139 - 0 - 1,091 +40%Natural gas 1,311 +46% 0 - 0 - 0 - 0 - 0 - 1,311 +46%Bio gas 3 +97% 0 - 0 - 0 - 0 - 0 - 3 +97%
Total 42,867 +2% 2,050 -5% 1,003 +19% 5 -0% 139 - 0 - 46,065 +2%
Sales of electricity to end customers (GWh) by country
Q1 - Q3 2017GWh +/- GWh +/- GWh +/- GWh +/- GWh +/- GWh +/- GWh +/-
Households -5,115 +1% 0 - -1,276 +3% -3,163 +6% -92 -6% 0 - -9,646 +3%Commercial (low voltage) -1,516 -7% -207 - -610 -3% -1,109 -15% -87 +4% 0 - -3,529 -3%Commercial and industrial (medium and high -6,377 -10% -1,973 +39% -573 -3% -2,955 +11% -2,105 +5% 0 - -13,983 +1%
Sold to end customers -13,008 -6% -2,180 +54% -2,460 +0% -7,227 +4% -2,284 +4% 0 - -27,158 +1%
Distribution of electricity (GWh) by country
GWh +/- GWh +/- GWh +/- GWh +/- GWh +/- GWh +/- GWh +/-Distribution of electricity to end customers -26,363 +4% 0 - -4,924 +5% -6,971 +5% 0 - 0 - -38,258 +4%
Others Eliminations CEZ GroupCzechia Poland Romania Bulgaria
Czechia Poland
Czechia Poland
Romania Bulgaria CEZ GroupOthers Eliminations
Romania Bulgaria Others
Eliminations CEZ Group
Eliminations CEZ Group
Czechia Poland Romania Bulgaria Others

Methods Used to Calculate Indicators Unspecified in IFRS
Methods Used to Calculate Indicators Unspecified in IFRSIn accordance with ESMA guidelines, EZ provides detailed information on indicators that are notreported as standard in IFRS statements or the components of which are not directly available fromstandardized statements (financial statements). Such indicators represent supplementary informationin respect of financial data, providing report users with additional information for their assessment ofthe financial position and performance of CEZ Group or EZ. In general, these indicators are alsocommonly used in other commercial companies, not only in the energy sector.
Indicator
Net debt Purpose: The indicator shows the real level of a company’sfinancial debt, i.e. the nominal amount of debt net of cash,cash equivalents, and highly liquid financial assets held bythe company. The indicator is primarily used to assess theoverall appropriateness of the company’s debt, for example,in comparison with selected corporate profit or balance sheetindicators.
Definition: Long-Term Debt, Net of Current Portion + CurrentPortion of Long-Term Debt + Short-Term Loans (Cash andCash Equivalents + Highly Liquid Financial Assets).
Adjusted Net Income(After-Tax Income, Adjusted)
Purpose: This is a supporting indicator, intended primarily forinvestors, creditors, and shareholders, that allows interpretingachieved financial results with the exclusion of extraordinary,usually nonrecurring effects that are generally unrelated toordinary financial performance and value creation in a givenperiod.
Definition: Net Income (After-Tax Income) +/ additions toand reversals of impairments of property, plant, andequipment and intangible assets including goodwill +/additions to and reversals of impairments of developedprojects +/ other extraordinary effects that are generallyunrelated to ordinary financial performance in a given yearand value creation in a given period +/ effects of the aboveon income tax.
Dividend per Share (Gross) Purpose: The indicator expresses a shareholder’s right to thepayment of a share in a joint-stock company’s profits (usuallyfor the past year) corresponding to the holding of one share.The subsequent payment of the share in profits is usuallysubject to taxes, which may be different for differentshareholders; therefore, the value before taxes is reported.
Definition: Dividend awarded in the current year, before taxes,per outstanding share (paid in the reported year from theprofits of prior periods).
EBITDA (EBIT Before Depreciationand Amortization, Impairments, andAsset Sales)
Purpose: This is an important economic indicator showing abusiness’s operating efficiency comparable to othercompanies, as it is unrelated to the company’s depreciationand amortization policy and capital structure or tax treatment.It is one of the fundamental indicators used by companies toset their key financial and strategic objectives.
Definition: Earnings Before Taxes and Other Expenses andRevenues + Depreciation and Amortization +/ Impairmentsof Property, Plant, and Equipment and Intangible AssetsIncluding Goodwill (including Write-Off of CanceledInvestments) + Sales of Property, Plant, and Equipment and

Methods Used to Calculate Indicators Unspecified in IFRS
IndicatorIntangible Assets.
Net debt / EBITDA Purpose: This indicates a company’s capability to decreaseand pay back its debt as well as its ability to take onadditional debt to grow its business. CEZ Group uses thisindicator primarily to assess the adequacy of its capitalstructure to the structure and stability of its expected cashflows.Definition: Net Debt / EBITDA. 12 month rolling EBITDA isused, i.e. EBITDA for the period from Oct 1 of previous yearuntil Sep 30. Net debt figure at the end of periods is used, i.e.as of Sep 30.
Most of the components used in the calculation of individual indicators are directly shown in financialstatements. The components of calculations that are not included in the financial statements areusually shown directly in a company’s books and are defined as follows:
Net Debt indicator—Highly Liquid Financial Assets item (CZK millions):
As at Sep 30,2016
As at Sep 30,2017
Short-term debt securities available for sale 540 3,455Short-term debt securities held to maturity 3,143 300Short-term deposits 5,510 1,000Long-term deposits 500 500Long-term debt securities available for sale 5,328 1,798Highly liquid financial assets, total 15,021 7,053
Adjusted Net Income indicator—individual components:
Adjusted Net Income (After-Tax Income, Adjusted) Unit Q1 – Q3 2016 Q1 – Q3 2017
Net income CZK millions 14,707 16,592
Impairments of property, plant, and equipmentand intangible assets including goodwill CZK millions 959 267
Impairments of developed projects*) CZK millions 375 0
Impairments of property, plant, and equipmentand intangible assets including goodwill at jointventures**)
CZK millions 735 473
Effects of the additions to or reversals ofimpairments on income tax***) CZK millions (74) (17)
Other extraordinary effects CZK millions 0 0
Adjusted net income CZK millions 16,701 17,315*) Included in the row Other operating expenses (impairments of inventories) in the Consolidated Statement ofIncome
**) Included in the row Share of profit (loss) from joint ventures in the Consolidated Statement of Income
***) Included in the row Income taxes (deferred tax) in the Consolidated Statement of Income


![Announces Q3 results [Result]](https://static.fdocuments.in/doc/165x107/577ca58e1a28abea748b9591/announces-q3-results-result.jpg)