Presentation of DTU container ship model - IALA AISM Assessment of Container Ship 01/12/2010...
27
Model for Environmental Assessment of Container Ship Transport By Hans Otto Holmegaard Kristensen Senior researcher Technical University of Denmark
-
Upload
nguyentruc -
Category
Documents
-
view
219 -
download
3
Transcript of Presentation of DTU container ship model - IALA AISM Assessment of Container Ship 01/12/2010...

Model for Environmental Assessment of Container Ship Transport
By Hans Otto Holmegaard Kristensen
Senior researcherTechnical University of Denmark

01/12/2010Environmental Assessment of Container Ship Transport
2 DTU Mechanical Engineering, Technical University of Denmark
1956 – Ideal X (Malcom McLean)

01/12/2010Environmental Assessment of Container Ship Transport
3 DTU Mechanical Engineering, Technical University of Denmark
2006 – EMMA MAERSK (14770 TEU)

01/12/2010Environmental Assessment of Container Ship Transport
4 DTU Mechanical Engineering, Technical University of Denmark
Overview of presentation
1. Basic principles of model
2. Identification of critical parameters which influence EEDI
3. Basic principles of calculation model
4. The most important parameter: SPEED OF THE SHIP
5. Result of parameter analysis
6. Possible EEDI improvements
7. Summary/conclusion

01/12/2010Environmental Assessment of Container Ship Transport
5 DTU Mechanical Engineering, Technical University of Denmark
EEDI definition
The Energy Efficiency Design Index (EEDI) is a measure of the CO2efficiency of a ship. It is calculated according to the following formula inits most simple formulation:
PME x SFCME x CFME + PAE x SFCAE x CFAE EEDI = _____________________________________________________
Deadweight x Speed
PME and PAE is main engine and auxiliary engine power The basic principle of EEDI is that it expresses the CO2 emissions per unit of the transport work of the ship. SFC is the certified specific fuel consumption [g/kW/hour] of the engines. CF is a non-dimensional conversion factor between fuel consumption and CO2 emission

01/12/2010Environmental Assessment of Container Ship Transport
6 DTU Mechanical Engineering, Technical University of Denmark
Main objective: Minimise EEDI
PME x SFCME x CFME + PAE x SFCAE x CFAE
EEDI = _________________________________
Capacity x Speed
Constant x PME
EEDI = _______________
Capacity x Speed

01/12/2010Environmental Assessment of Container Ship Transport
7 DTU Mechanical Engineering, Technical University of Denmark
EEDI base line (MEPC 60/4/14)

01/12/2010Environmental Assessment of Container Ship Transport
8 DTU Mechanical Engineering, Technical University of Denmark
Specific oil consumption and emissions
Oil consumption Engine power x specific oil cons.____________________ = _______________________________________
Transport unit Transport capacity x speed
Calculation methods:
1. ‘Bottom up’ (pure statistical method)
2. ‘Top down method’ (model calculation – naval architechtual method)

01/12/2010Environmental Assessment of Container Ship Transport
9 DTU Mechanical Engineering, Technical University of Denmark
Principles of
calculation model
First calculate ship length, L, as function of cargo capacity, C
L = f0(C)
On basis of statistical data calculate the ship's dimensions as functions of ship length, L
Beam = B = f1(L) Draft = T = f2(L)
Depth = D = f3(L) Light ship weight = M = f4(L)
Service speed = V = f5(L) Auxiliary machinery power = Pa = f6(L)
Propulsion power, Pf, is calculated on the basis of main dimensions, cargo capacity, C, and utilization fraction, U (actual cargo/maximum cargo capacity)
Pf = f7(L, B, T, D, M, V, C, U)
Energy consumption and emissions are calculated on the basis of the propulsion and auxiliary power Pf and Pa
Finally, main dimensions can be modified and their influence on propulsion power and energy consumption can be determined

01/12/2010Environmental Assessment of Container Ship Transport
10 DTU Mechanical Engineering, Technical University of Denmark
Panamax ships – Lpp versus TEU capacity
100 TEU <= C < 440 TEU: Lpp [m] = 69.6 + (C - 100)0.09 440 TEU <= C < 2700 TEU: Lpp [m] = 9.508 C0.3869
2700 TEU <= C < 5000 TEU: Lpp [m] = 202.15 + (C - 2700)0.0365
0
1000
2000
3000
4000
5000
6000
60 100 140 180 220 260 300Lpp [m]
Capacity [TEU]

01/12/2010Environmental Assessment of Container Ship Transport
11 DTU Mechanical Engineering, Technical University of Denmark
Maximum draught versus Lpp
Maximum draught [m] = 7 Ln(Lpp) - 25.9
2
4
6
8
10
12
14
16
60 100 140 180 220 260 300 340 380Lpp [m]
Draught [m]
01/12/2010Environmental Assessment of Container Ship Transport
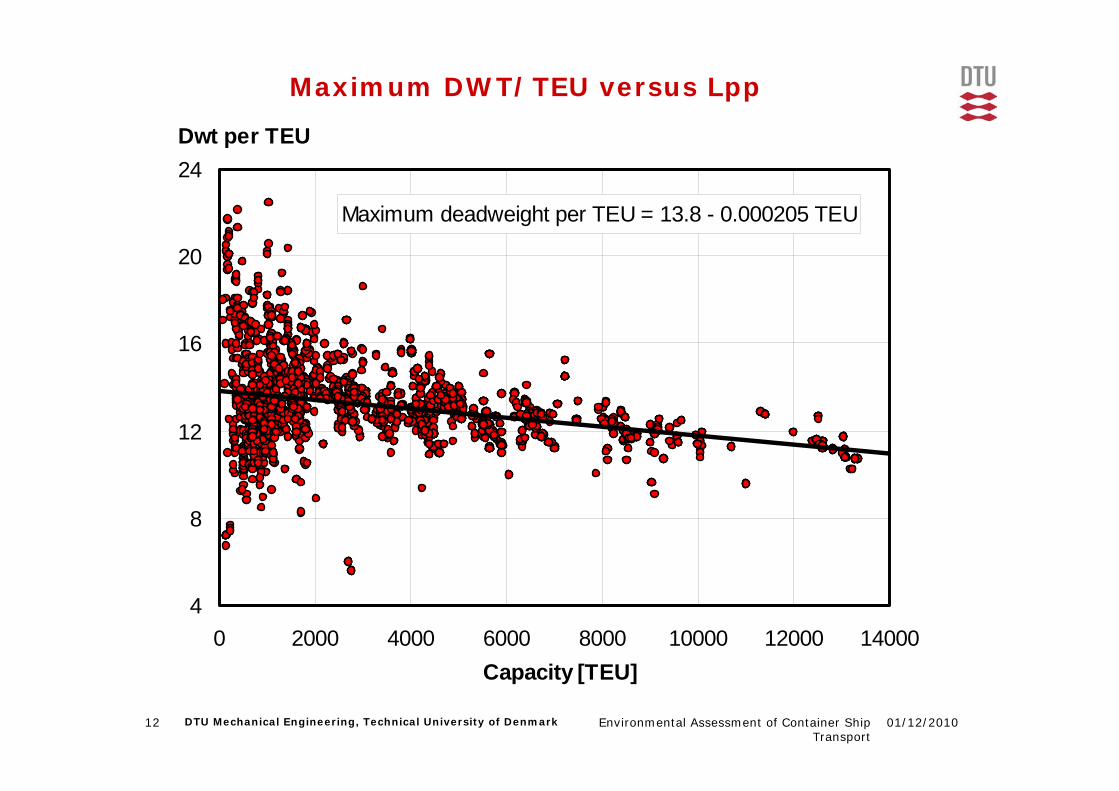
12 DTU Mechanical Engineering, Technical University of Denmark
Maximum DWT/TEU versus Lpp
Maximum deadweight per TEU = 13.8 - 0.000205 TEU
4
8
12
16
20
24
0 2000 4000 6000 8000 10000 12000 14000Capacity [TEU]
Dwt per TEU
01/12/2010Environmental Assessment of Container Ship Transport
13 DTU Mechanical Engineering, Technical University of Denmark
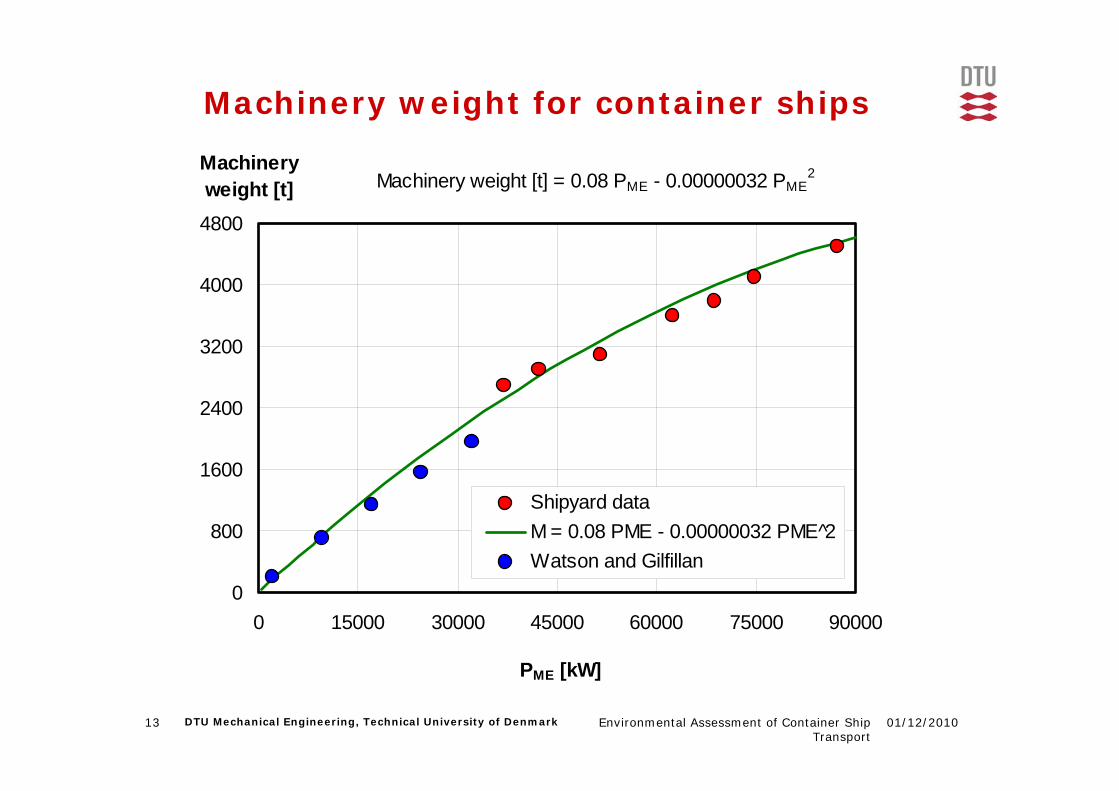
Machinery weight for container ships
Machinery weight [t] = 0.08 PME - 0.00000032 PME2
0
800
1600
2400
3200
4000
4800
0 15000 30000 45000 60000 75000 90000
PME [kW]
Machinery weight [t]
Shipyard dataM = 0.08 PME - 0.00000032 PME 2̂Watson and Gilfillan

01/12/2010Environmental Assessment of Container Ship Transport
14 DTU Mechanical Engineering, Technical University of Denmark
Slenderness ratio – Lpp/Displ.volumue1/3
4.5
5.0
5.5
6.0
6.5
7.0
50 100 150 200 250 300 350 400Lpp [m]
Lpp/D1/3
Panamax shipsPost Panamax shipsPanamax ships - DTU modelPost Panamax ships - DTU modelMax. Lpp for Panama Canal

01/12/2010Environmental Assessment of Container Ship Transport
15 DTU Mechanical Engineering, Technical University of Denmark
EEDI model data
versus IMO baseline
0,0
8,0
16,0
24,0
32,0
0 30000 60000 90000 120000 150000 180000100 % Deadweight [t]
EEDI [g/t/nm]
IMO - MEPC 60/4/14 proposal
DTU model calculation
Potens ( DTU model calculation)

01/12/2010Environmental Assessment of Container Ship Transport
16 DTU Mechanical Engineering, Technical University of Denmark
Speed
Lpp <= 95 m: V = 14 + (Lpp - 95)0.016 95 m < Lpp < 340 m: V = 4 + 0.1216 Lpp - 0.00017 Lpp2
Lpp => 340 m: V = 25.7 kn8
12
16
20
24
28
50 100 150 200 250 300 350 400
Length pp [m]
V [knots]

01/12/2010Environmental Assessment of Container Ship Transport
17 DTU Mechanical Engineering, Technical University of Denmark
Speed exponent N
Power = constant x V N
3.0
3.5
4.0
4.5
5.0
20 21 22 23 24 25 26 27Speed V [knots]
Speed exponent N
10000 TEU
8000 TEU
6000 TEU
5000 TEU
Power = constant x V N
3.0
3.5
4.0
4.5
5.0
5.5
6.0
13 15 17 19 21 23 25 27Speed V [knots]
Speed exponent N
1000 TEU
1500 TEU
5000 TEU
4000 TEU
3000 TEU
2000 TEU

01/12/2010Environmental Assessment of Container Ship Transport
18 DTU Mechanical Engineering, Technical University of Denmark
EEDI and speed

01/12/2010Environmental Assessment of Container Ship Transport
19 DTU Mechanical Engineering, Technical University of Denmark
Influence of speed on EEDI
-50
-40
-30
-20
-10
00 2000 4000 6000 8000 10000 12000 14000
Capacity [TEU]EEDI change [%]
5 % speed reduction10 % speed reduction15 % speed reduction

01/12/2010Environmental Assessment of Container Ship Transport
20 DTU Mechanical Engineering, Technical University of Denmark
EEDI reduction by increased ship length
-12
-10
-8
-6
-4
-2
00 2000 4000 6000 8000 10000 12000 14000
Capacity [TEU]EEDI change [%]
5 % Lpp increase - unchanged B (reduced Cb)
5 % Lpp increase - 5 % B decrease (constant Cb)

01/12/2010Environmental Assessment of Container Ship Transport
21 DTU Mechanical Engineering, Technical University of Denmark
EEDI reduction by changed steel weight
-4
-3
-2
-1
0
1
2
3
4
0 2000 4000 6000 8000 10000 12000 14000
Capacity [TEU]EEDI change [%]
5 % decrease of steel weight
5 % increase of steel weight

01/12/2010Environmental Assessment of Container Ship Transport
22 DTU Mechanical Engineering, Technical University of Denmark
Obtainable EEDI reductions
Design option for improvement of EEDI 4000 TEU 8000 TEU 12000 TEU
Ship designed for normal service speed with 10 % sea margin on resistance and ME engine running 90 % MCR in service condition 0 0 0
Ship designed for normal service speed with NO sea margin on resistance and ME engine running 90 % MCR in service condition 8 8 8
Ship designed for normal service speed with NO sea margin on resistance and derated ME engine running 100 % in service condition 17 17 16
5 % lengthened ship designed for normal service speed with NO sea margin on resistance and derated ME engine running 100 % MCR in service condition 24 22 21
5 % lengthened ship designed for 10 % speed redution with NO sea margin on resistance and derated ME engine running 100 % MCR in service condition 41 39 37
5 % lengthened ship designed for 10 % speed redution with NO sea margin on resistance and derated ME engine running 100 % MCR in service condition. 3 % steel weight reduction
41 40 38
5 % lengthened ship designed for 10 % speed redution with NO sea margin on resistance and derated ME engine running 100 % MCR in service condition. 3 % steel weight reduction and 5 % improved propeller efficiency
44 42 41

01/12/2010Environmental Assessment of Container Ship Transport
23 DTU Mechanical Engineering, Technical University of Denmark
Summary of EEDI reductions(No change of sea margin)
Option 1: Use of derated engine3 % steel weight optimization5 % propulsion improvement
20 – 23 % EEDI reduction
Option 2: Use of derated engine3 % steel weight optimization5 % propulsion improvement10 % speed reduction
37 – 42 % EEDI reduction

01/12/2010Environmental Assessment of Container Ship Transport
24 DTU Mechanical Engineering, Technical University of Denmark
CO2 emissions for ships versus trucks
CO2 emissions for bulk carriers versus trucks
0 5 10 15 20 25 30 35 40
10000
20000
40000
60000
100000
150000
200000
Ship
siz
e (to
n de
adw
ight
)
CO2 emissions per ton cargo per km (g/m/km)
12 m truck carrying 24 t cargoBulk carrier (fully loaded)

01/12/2010Environmental Assessment of Container Ship Transport
25 DTU Mechanical Engineering, Technical University of Denmark
CO2 emissions for ships versus trucksCO2 emissions for container ships versus trucks
0 100 200 300 400 500
1000 TEU
2000 TEU
4000 TEU
6000 TEU
8000 TEU
10000 TEU
12000 TEU
14000 TEU
Ship
cap
acity
in c
onta
iner
s (T
EU)
CO2 emissions per container per km (g/TEU/km)
Container ship (fully loaded)Truck carrying 2 TEU

01/12/2010Environmental Assessment of Container Ship Transport
26 DTU Mechanical Engineering, Technical University of Denmark
CO2 emissions for ships versus trucks
CO2 emissions for Ro-Ro cargo ships versus trucks
0 20 40 60 80 100 120
1000 lanemeters
2000 lanemeters
3000 lanemeters
4000 lanemeters
5000 lanemeters
Ship
siz
e (la
nem
eter
s)
CO2 emissions per lanemeter per km (g/m/km)
12 m truck carrying 24 t cargoRo-Ro cargo ships (fully loaded)
01/12/2010Environmental Assessment of Container Ship Transport
27 DTU Mechanical Engineering, Technical University of Denmark
Thank you !