PRESENTATION OF 2nd QUARTER REPORT...
69
PRESENTATION OF 2nd QUARTER REPORT 2006 OSLO, 9 August 2006
Transcript of PRESENTATION OF 2nd QUARTER REPORT...
PRESENTATION OF 2nd QUARTER REPORT 2006
OSLO, 9 August 2006

Main features 2nd quarter 2006 (2005)• Good improvement in overall result
* Pre-tax operating result totalled NOK 377 million (NOK 307 million).* After-tax return on equity capital amounted to 18.14 per cent (16.77%).* Earnings per Primary Capital Certificate (PCC) totalled NOK 10.93 (NOK 10.06) (Parent
Bank)• Continued increase in income from the sale of products and services from risk-free areas• The Bank’s share of SpareBank 1 Gruppen AS’s result (IFRS) amounted to NOK 69 million
(NOK 37 million)• The overall cost ratio ended up at 53.9 per cent (55.4%)• A weak result from securities and foreign exchange, amounting to an overall loss of NOK 22
million.This was made up of a NOK 55 million loss on securities and a NOK 33 million gain from foreign exchange.
• Low credit losses: Reduced write-downs produced NOK 5 million net income (a loss of NOK 32 million)
• Lending growth during the last 12 months totalled 10.3 per cent (4.5%)* Retail banking market: + 14.8 per cent* Corporate sector: + 2.6 per cent
• Deposit growth during the last 12 months amounted to 11.2 per cent (7.8%)• Overall deposit coverage ratio: 64.7 per cent (64.2%)

SpareBank 1 Nord-Norge – the region’s leading bank• Assets NOK 51 billion
• Good profitability
• Satisfied customes
• High job satisfaction among staff
• The Bank’s strong involvement in the local community strengthens itsmarket position.
• Very good results in SpareBank 1 Gruppen AS
• The SpareBank 1 alliance – thisstrategic and operational platformfor the Bank functions well and is well accepted by the market
Key statistics• Rating
• A3 (Moody’s) and • A- (Fitch Ratings)
• Loans NOK 43.0 billion• Deposits NOK 28.5 billion• Number of branches 90• Number of customers
• Retail banking 240.000• Corporate 17.500• Clubs/associations 23.000• Insurance 96.500

Economic trends
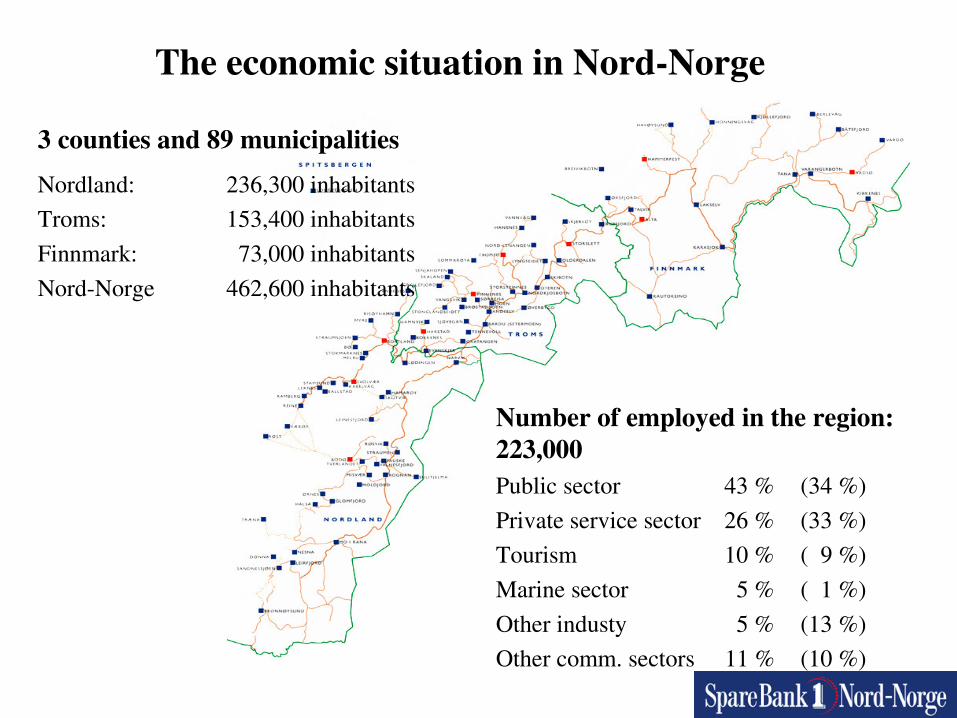
3 counties and 89 municipalities
Nordland: 236,300 inhabitantsTroms: 153,400 inhabitantsFinnmark: 73,000 inhabitantsNord-Norge 462,600 inhabitants
Number of employed in the region: 223,000Public sector 43 % (34 %)Private service sector 26 % (33 %)Tourism 10 % ( 9 %)Marine sector 5 % ( 1 %)Other industy 5 % (13 %)Other comm. sectors 11 % (10 %)
The economic situation in Nord-Norge

The region’s economy is enjoying a period ofstrong expansion
Still strong economic expansion.....1. Growth, business start-ups and restructuring of traditional businesses2. Increased private consumption as well as increased rate of savings 3. Unemployment decreases: number of new jobs increase4. Substantial gas discovery in the Northern region has created great
optimism and investment focus
.... but also challenges� Increase in interest rates might level out growth� Stronger Norwegian currency might weaken the export industry� Lack of workforce within several sectors in the region� Record-high number of elderly in the region over the next ten years

Demographic changes in Northern Norway
Net emigration from Northern Norway 1996 - 2005
0
1000
2000
3000
4000
5000
6000
1996 1997 1998 1999 2000 2001 2002 2003 2004 2005
Demographic changes in Northern Norway at the end of 2005:
• Birth surplus 1.016• National net emigration - 2.625• Net immigration 1.734
Change in population 2005 125
Kilde: SSB, Befolkningsstatistikk; mars 2006
Northern Norway has experienced a strong emigration in earliergrowth periods. However, this time the trend is reversed and thenet migration at the end of 2005 was in surplus.

Important commercial and industrial areas in the north
� Marine sector� Energy� Travel and tourism
� Private service sector� knowledge-based companies� Activity-based tourism
� Commercial and industrial areas in the north� oil/gas� The Barents region
� commerce� culture� travel and tourism

The financial services industry

• Higher requirements for professional competence due to customer demand and product complexity
• Mortgages are to a larger extent used as “glue” in customer context – this produces downward pressure on margins
• Niche players enter high profitability services, such as consumer finance
• Introduction of no-fee banking services – revenue pressure in payment services
• SmartCards (BankID) form the basis for new financial services
• The Nordic banks will continue to strengthen their position in the Norwegian market through aggressive pricing
• Basel 2 reduces banks’ capital requirement, intensifying competition for the most profitable customers
Trends in the financial services industry
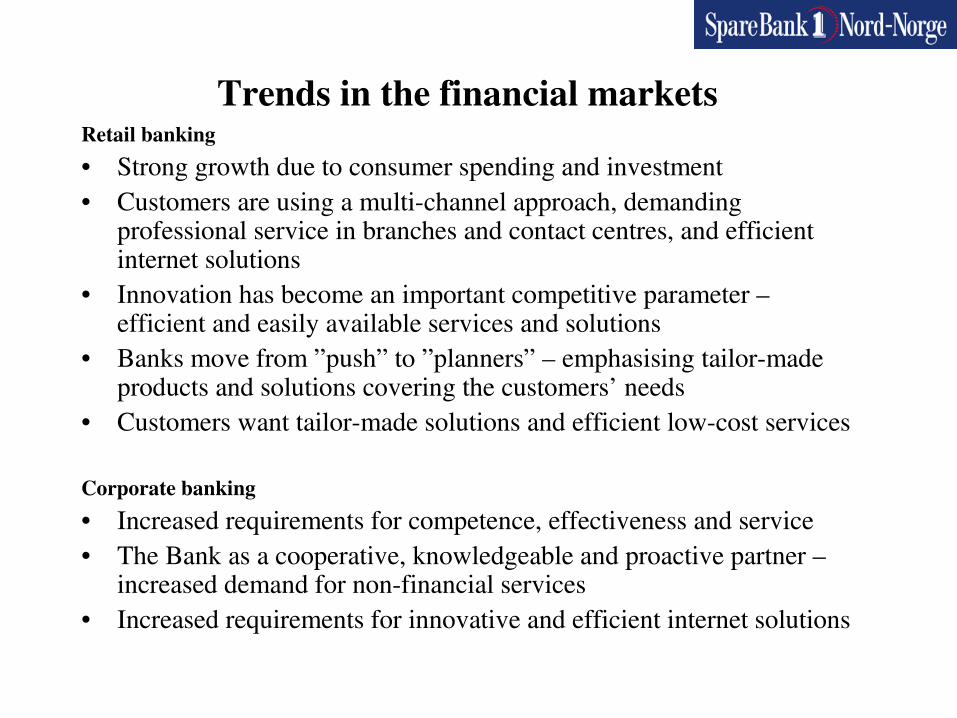
Retail banking• Strong growth due to consumer spending and investment• Customers are using a multi-channel approach, demanding
professional service in branches and contact centres, and efficient internet solutions
• Innovation has become an important competitive parameter –efficient and easily available services and solutions
• Banks move from ”push” to ”planners” – emphasising tailor-made products and solutions covering the customers’ needs
• Customers want tailor-made solutions and efficient low-cost services
Corporate banking• Increased requirements for competence, effectiveness and service• The Bank as a cooperative, knowledgeable and proactive partner –
increased demand for non-financial services• Increased requirements for innovative and efficient internet solutions
Trends in the financial markets

Nordic giant, looking closer at Northern Norway
A major bank with a strong local presence
Growth ambitions, favourable funding, low return on equity
A regional savings bank with a defensive strategy
A proud local bank – and a successful trademark for DnB
DnB’s brand for the”blue-collar” customer
First choice for the self-service-minded customer
The competitive arena - banking

15 %12 %50 %0.2Life insurance exc saving (ann)
50 %33 %45 %3.8Mutual funds
51 %4 %31 %0.8Individual Pensions (annual)
2 %
15 %
6 %
15 %
13 %
Market growth (Norway)
21 %
41 %
34 %
24 %
28 %
Market share SNN
5 %2.0Non-life insurance (annual)
13 %27Deposits, commercial & public
6 %41Deposits, retail sector
4 %62Credit, commercial sector
13 %95Credit, retail sector
Trend SNN
Growth SNN
Market volume (NOK bill)Product area
The financial services market was growing significantly in 2005.
Market shares in Nord-Norge 2005
Market volumes and SNN’s shares of credit and deposits in 2005 are not comparable with previous years due to different definitions of retail and commercial sector. SNN’s market shares of credit, excl state lending institutions, are 34% in retail and 29% in commercial sector. Market volume for Individual Pensions and Life are rough estimates.
Payments transmission services

- Cards and payments transmission services- E-trading
Revenue generation – Parent Bank (2005):NOK mill %
Total income 1,567 100 %Total other (non interest) operatation income 509 32 %
Income from payments transmission services 162 10 % - Cards 64 4 % - Telebank/netbank 30 2 % - Other payments transmission services 68 4 %

The retail banking market has consisted mainly of two different parts:1. The niche players: free use of cards and payments transmission services2. The traditional banks: customers pay on the basis of actual usage or
estimated usage.
This differentiation is in the process of disappearing. The traditional banks are moving towards the niche banks’ pricing models – and cross subsidisationbetween different business areas/segments.
Consequences:• Less (real) differentiation between banks within the card- and payments
transmission services area. Will the promotional work involving branded products be capable of changing (or retaining) this?
• Lost other income from the cards – and payments transmission services area involving the retail banking market as far as the traditional banks are concerned
• Focus to be switched from product- to customer profitability?• Usage costs to be moved from the retail banking- to the corporate banking
market?
Cards and payments transmission services

Cards and payments transmission servicesSpareBank 1 Nord-Norge’s adaptation to the
market:
A larger number of different packages, according to the customers’ usage- and cost preferences, demographic classification (young people, students, senior citizens) and any agreements involving organisations.
The main message in our marketing:• All you need in one package• Free (i.e. free of charge) use of cards and electronic payments transmission
services• A fixed (low) price per month
The abovementioned elements represent a net reduction in overall income of about NOK 6 million.

e-transactions
New settlement- and authentication forms relating to e-transactions have come into force: Verified by Visa, coupled with a new security standard for VISA cards (EMV).
A new national standard for payment involving e-transactions is about to be introduced, BankAxess.
BankID – the banks’ e-legitimation for secure identification and signature on the Internet

e-transactionsSpareBank 1 Nord-Norge’s adaptation to the
market:
• Upgrading of all the Bank’s Visa cards with chip – a new international security standard – has been completed.
• BankID as the security solution for logging onto the NettBank has been implemented.
• Verified By Visa for all our Visa card customers for secure transactions over the Internet has been implemented.
• The necessary preparations have been made for the introduction of the new national payment solution over the Internet: BankAxess.

StrategyStronger competition – a more fine-tuned strategy
Close and competent For Nord-Norge !
Distributive powersThe relations bank
Strategy
Competition within the Bank’s markets has become stronger and more complex.
• Many strong players are investing in the Nord-Norge market.• Competence and innovative solutions have become more important.• Customer relations and local commitment have become more important.• Increased pressure on interest rates, prices and margins

Together, we have devised a strategy which will give us enhancedcompetitiveness. Our ambition is to have a strategy for growth and productivity.Our targets are as follows:
� A stable and high level of profitability� Increased market share� Increased customer satisfaction� Effective work processes� Continuous learning and teaching
For our customers, we shall come across as the local and competent bank as far as all customer relations are concerned.
Our work processes shall be built on our strong powers of distribution, offering the best levels of service within the areas of advisory services and sales, acquisitions, innovation, quality and risk management, coupled with a strong commitment to our communities, involving a strong local presence.
A culture of winners, based on learning, development, the ability to work together, coupledwith open communication, shall represent a dominant feature throughout our organisation.
Strategy broken down by main aspects

SpareBank 1 Nord-Norge’s overall objective is growthwithin all business areas
� through increased sales to existing customers� through sales to new customers� through development of the Bank’s market area� through the development of various services and
business areas
SpareBank 1 Nord-Norge’s overall objective is increased productivity� through quality in everything we do� through effective work processes� through strengthening the levels of our competence� through making the most of our ability to work
together
Growth and productivity

The NettBank• Day-to-day banking• Customer communications• Personal finances• Product purchases and
maintenance
Self service solutions
The NettBank• Day-to-day banking• Customer communications• Personal finances• Product purchases and
maintenance
Self service solutions
New customer centre• Receive phone calls and e-
mail• Extended day-to-day
banking• Service-related products
with additinal sales• Booking of meeting for
adviserResponse and service
New customer centre• Receive phone calls and e-
mail• Extended day-to-day
banking• Service-related products
with additinal sales• Booking of meeting for
adviserResponse and service
A customer-driven distribution channel strategy
”Your local bank”• Customer initiative and follow-
up• Advice and sale• Credit handling• Advanced day-to-day banking
offers• Self service machines• Marketing
Relations-driven; initiative, closeness, competence
”Your local bank”• Customer initiative and follow-
up• Advice and sale• Credit handling• Advanced day-to-day banking
offers• Self service machines• Marketing
Relations-driven; initiative, closeness, competence
� Stronger customer relations
� Customers’ overall and general impression of theBank shall be irrespective ofdistribution channels used
� Reduced operating costs
� Source of innovation
”Your local bank” represents theplatform of our distribution, withresponsibility for customerrelations and profitability.
”Your local bank” represents theplatform of our distribution, withresponsibility for customerrelations and profitability.

Organisation of the financial services group
Eiendomsdrift ASReal estate management
Equity stake 100 %
SpareBank 1 GruppenFin.Services GroupEquity stake 17.63%
SpareBank 1 Nord-Norge Securities ASASecurities firmEquity stake 53,5 %
•Tromsø•Bodø
SpareBank 1 Finans Nord- Norge AS
•Leasing/factoring•Equity stake 100%
•Tromsø•Bodø•Alta•Hammerfest
EiendomsMegler 1 Nord-Norge AS
Real estate brokerage
Equity stake 100 %
Parent Bank
Group
SpareBank 1 Nord-NorgeInvest ASA
Investment companyEquity stake 100 %
•Kirkenes

SpareBank 1 Nord-Norge Group: Head Office: Tromsø� Organisation: 4 regions� Location: 90 branches� Staff at Group: 819

Financial targets:Capital adequacy ratio
SpareBank 1 Nord-Norge shall be a financially strong bank with a capitaladequacy ratio which reflects the risks involved within the Bank’s market area.
� Capital adequacy ratio of 12 %and a core capital coverage of 9 %minimum.
� The confidence interval shall be 99,9%.

Capital adequacy ratio(AMOUNTS IN NOK MILLION)
PARENT BANK - NGAAP GROUP - IFRS
31.12.05 30.06.05 30.06.06 30.06.06 30.06.05 31.12.05
2,986 2,851 2,946 Core capital 2,934 2,810 3,160931 927 927 Supplementary capital in addition to the core capital 927 927 929
Deduction items:456 387 418 Subord. loan-and equity cap. participations in other fin.inst. 0 0 0
0 0 0 Capital adequacy reserves 473 434 453
3,461 3,391 3,455 Net equity and related capital resources 3,388 3,303 3,636
31,118 29,231 31,745 Total risk-weighted assets base 33,042 29,871 32,60411.12 % 11.60 % 10.88 % Capital adequacy ratio 10.25 % 11.06 % 11.15 %9.60 % 9.75 % 9.28 % Core capital adequacy ratio 8.88 % 9.41 % 9.69 %
50 % of result included in the calculations as at 30.06.06 gives 0.41 % higher Group Capitaladequacy ratio.

Profitability� SpareBank 1 Nord-Norge’s return on equity shall reflect the
risk pertaining to the Bank’s business operations and the general level of interest rates
� The targeted after-tax return is minimum 6 percentage points above the yield on long-term government bonds
� The profitability shall be comparable to the performance of competing banks in Norway
Effectiveness
� SpareBank 1 Nord-Norge’s target is a cost-income ratio of50%
� The effectiveness shall be comparable to the level of competing banks in Norway
Financial targets:
Profitability and effectiveness
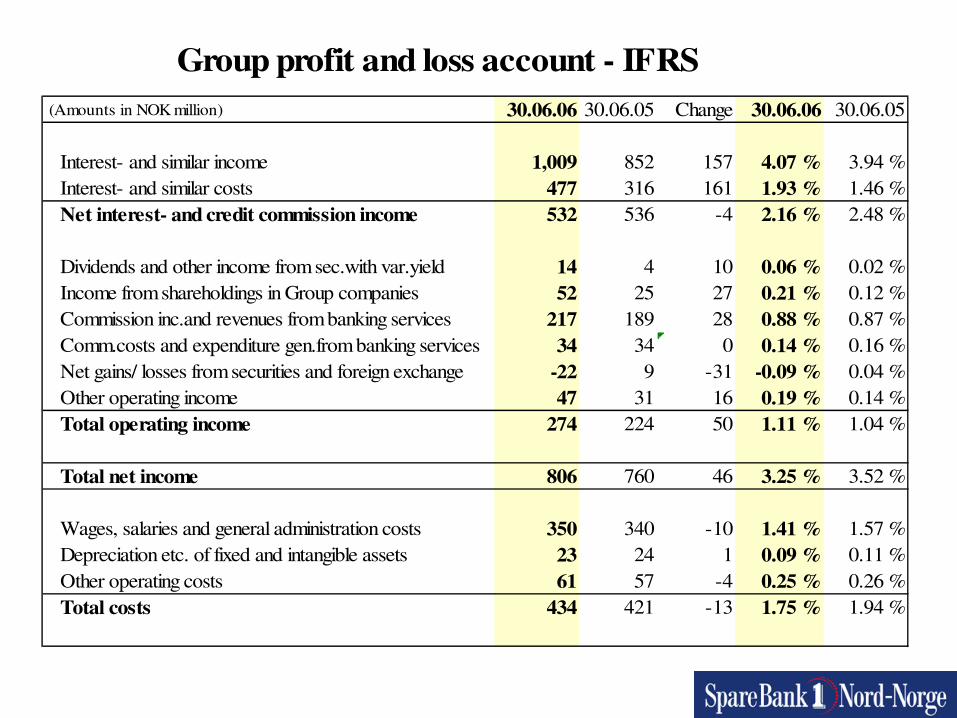
Group profit and loss account - IFRS (Amounts in NOK million) 30.06.06 30.06.05 Change 30.06.06 30.06.05
Interest- and similar income 1,009 852 157 4.07 % 3.94 %Interest- and similar costs 477 316 161 1.93 % 1.46 %Net interest- and credit commission income 532 536 -4 2.16 % 2.48 %
Dividends and other income from sec.with var.yield 14 4 10 0.06 % 0.02 %Income from shareholdings in Group companies 52 25 27 0.21 % 0.12 %Commission inc.and revenues from banking services 217 189 28 0.88 % 0.87 %Comm.costs and expenditure gen.from banking services 34 34 0 0.14 % 0.16 %Net gains/ losses from securities and foreign exchange -22 9 -31 -0.09 % 0.04 %Other operating income 47 31 16 0.19 % 0.14 %Total operating income 274 224 50 1.11 % 1.04 %
Total net income 806 760 46 3.25 % 3.52 %
Wages, salaries and general administration costs 350 340 -10 1.41 % 1.57 %Depreciation etc. of fixed and intangible assets 23 24 1 0.09 % 0.11 %Other operating costs 61 57 -4 0.25 % 0.26 %Total costs 434 421 -13 1.75 % 1.94 %

Group profit and loss account - IFRS-continued
(Amounts in NOK million) 30.06.06 30.06.05 Change 30.06.06 30.06.05
Result before losses and write-downs 372 339 33 1.50 % 1.57 %
Losses on loans, guarantees etc. -5 32 -37 -0.02 % 0.14 %Net losses and write-downs -5 32 -37 -0.02 % 0.14 %
Result before tax 377 307 70 1.52 % 1.42 %Tax payable on ordinary result 105 89 -16 0.42 % 0.41 %Tax payable on ordinary result 5 1 -4 0.00 % 0.00 %Result from ordinary operations after tax 267 217 50 1.10 % 1.01 %

Profit after tax
30.06.06 30.06.05 SpareBank 1 Finans Nord-Norge AS 6,365 7,304 SpareBank 1 Nord-Norge Invest ASA 163 61 Eiendomsdrift AS 6,574 2,440 Eiendomsmegler 1 Nord-Norge AS 4,586 3,914 SpareBank 1 NN Securities ASA (53,50%) 5,349 861 TOTAL 23,037 14,580
Group Companies

Income statement - Group
(Amounts in NOK million) Q2-06 Q1-06 Q4-05 Q3-05 Q2-05Interest income 270 262 268 271 273Total other income 107 167 203 164 114Total operating expenses 226 208 228 223 227Profit before losses 151 221 243 212 160
Losses and write-downs 1 -6 24 9 21Profit before tax 150 227 219 203 139
Income tax expense 43 62 40 43 41Profit after tax 107 165 179 160 98
The quarterly results for 2004 have been changed in accordance with IFRS for all items not covered by IAS 39

Group operating income
In comparison with the second quarter of 2005, the changed result is primarily ascribable to the following factors:
• Reduction in net interest income - NOK 4 million• Increase in other (non-interest) income + NOK 44 million• Net gain/income and value change–securities - NOK 21million• Share of Sp 1 Gruppen AS’s result + NOK 32 million • Share of Sp 1 Utvikling DA’s costs - NOK 5 million• Increased costs - NOK 13 million• Reduction in net loan losses + NOK 37 million• TOTAL + NOK 70 million

Group operating incomeOther (non-interest) income:
30.06.06 30.06.05 ChangeDividend 14 4 + 10Result associated companies 52 25 + 27Net fee-and commission income 183 155 + 33Bonds 0 9 - 9Securities - 55 - 14 - 41Foreign exchange 23 13 + 10Financial derivatives (IFRS) 10 1 + 9Other income 47 31 + 16*)Total other income 274 224 + 50
*) Including gains from sales of properties
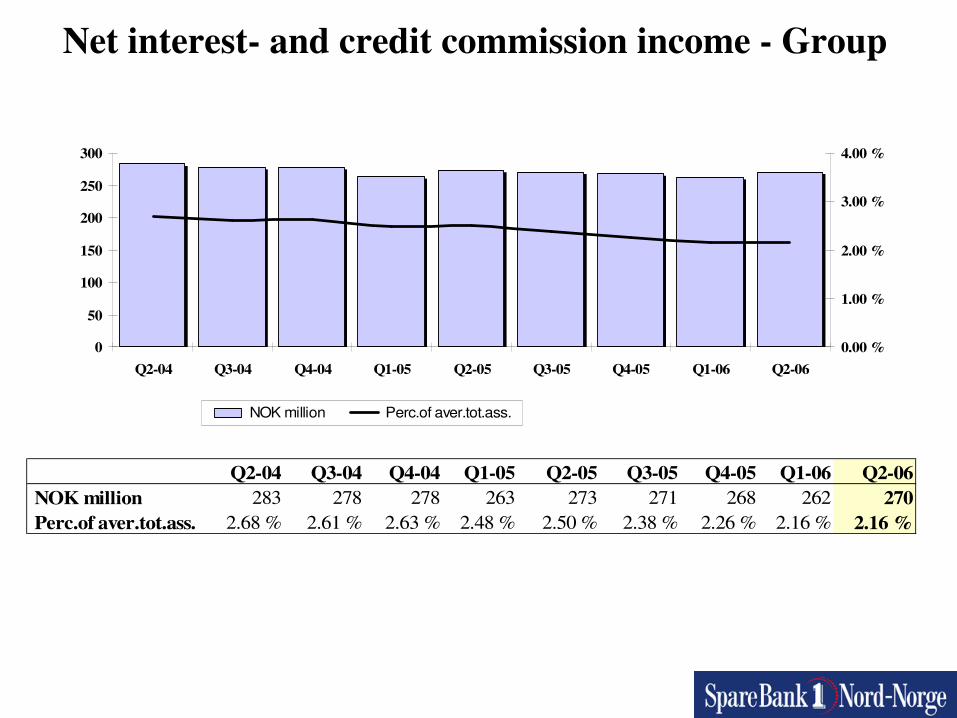
Net interest- and credit commission income - Group
Q2-04 Q3-04 Q4-04 Q1-05 Q2-05 Q3-05 Q4-05 Q1-06 Q2-06 NOK million 283 278 278 263 273 271 268 262 270 Perc.of aver.tot.ass. 2.68 % 2.61 % 2.63 % 2.48 % 2.50 % 2.38 % 2.26 % 2.16 % 2.16 %
0
50
100
150
200
250
300
Q2-04 Q3-04 Q4-04 Q1-05 Q2-05 Q3-05 Q4-05 Q1-06 Q2-060.00 %
1.00 %
2.00 %
3.00 %
4.00 %
NOK million Perc.of aver.tot.ass.
Profitability
� SpareBank 1 Nord-Norge’s return on equity shall reflect the risk pertaining to the Bank’s business operations and the general level of interest rates
� The targeted after-tax return is minimum 6 percentage points above the yield on long-term government bonds
� The profitability shall be comparable to the performance of competing banks in the Norway
Effectiveness
� SpareBank 1 Nord-Norge’s target is a cost-income ratio of50%
� The effectiveness shall be comparable to the level of competing banks in Norway
Financial targets:
Profitability and effectiveness

Group operating costs
Q2-
04
Q3-
04
Q4-
04
Q1-
05
Q2-
05
Q3-
05
Q4-
05
Q1-
06
Q2-
06
NOK million 196 193 224 194 227 223 228 208 226% of av.tot.ass. 1.85 % 1.81 % 2.12 % 1.83 % 2.08 % 1.96 % 1.92 % 1.71 % 1.81 %
From 1st quarter 2004 costs have been revised in accordance with IFRS for all items not covered by IAS 39
0255075
100125150175200225250
Q2-04 Q3-04 Q4-04 Q1-05 Q2-05 Q3-05 Q4-05 Q1-06 Q2-06
NO
K m
ill.
0.00 %0.50 %1.00 %1.50 %2.00 %2.50 %3.00 %3.50 %
%
NOK million % of av.tot.ass.

Group operating costs
1 q.06 1 q.05 Change
•Wages 183 165 + 18•Pensions 24 34 - 10•Sosial costs 22 20 + 2•Administration costs 121 121 + 0•Total 350 340 + 10•Depreciation 23 24 - 1•Other costs 61 57 + 4•Total costs 434 421 + 13
•Costs as a percentage of overall contribution margin:53.9% 55.4% -1.5%

Group development - man years
820 806
708 699 714 697
879 868
770 758778
760
500
550
600
650
700
750
800
850
900
2001 2002 2003 2004 2005 2.q.2006
Parent Bank Group

Financial targets:
Market areas and customer groupsMarket areas
� Nord-Norge represents SpareBank 1 Nord-Norge’s primary market area. In particular, marketing efforts will be focused on Nordland (Helgeland).
� Customers who move away from the region willbe actively followed up by the Bank.
Customer groups
� Retail banking customers represent SpareBank 1 Nord-Norge’s most important customer group –SNN shall be the Bank for these people during all phases of their lives.
� SpareBank 1 Nord-Norge also targets small and medium-sized businesses, the public sector, clubsand associations.

Financial targets:
Market share and income targetsMarket sharesSpareBank 1 Nord-Norge’s target is to achieve market shares of minimum 30% in Nord-Norge within all product areas
Business areasSpareBank 1 Nord-Norge offers a broadrange of products and services within theareas of financing, saving and placement, insurance, and payments transmissionservices. The Bank makes every effortto further develop a diversified productrange as well as new business areas.

Key figures balance sheet
(Amounts in NOK million)
BALANCE SHEET 30.06.06 30.06.05 Change Change %
Total assets 51,496 44,656 6,840 15.3% Gross lending 43,765 39,672 4,093 10.3% Deposits 28,324 25,480 2,844 11.2%

Group lending according to markets
30.06.05
63 %
37 %30.06.0634 %
66 %
(NOK Million) 30.06.06 30.06.05 Change Change %Retail 28,820 25,095 3,725 14.84 %Corporate and public 14,945 14,577 368 2.52 %TOTAL 43,765 39,672 4,093 10.32 %
Retail
Corporate and public

Lending growth in SNN and Norway 2005 - 2006
Corporate market
-9
-6
-3
0
3
6
9
12
15
18
Jan 05 Apr 05 Jul 05 Oct 05 Jan 06 Apr 0612
mon
ths
grow
t(%)
Norway, corporate market SNN, corporate market
Norway, corporate market
SNN, næringskunder
Source: Norges Bank, Kredittindikatoren, 29.06. 06 and SNN.
Retail market
0
3
6
9
12
15
18
Jan 05 Apr 05 Jul 05 Oct 05 Jan 06 Apr 06
12 m
onth
s gr
owt (
%)
Norway, retail market SNN, retail market
Norway, retail market
SNN, retail market

Group customer deposits according to markets
30.06.05
30 %
13 % 57 %
30.06.0630 %
54 %16 %
(NOK Million) 30.06.06 30.06.05 Change Change %Retail 15,232 14,438 794 5.50 %Public 4,605 3,378 1,227 36.32 %Corporate 8,487 7,657 830 10.84 %TOTAL 28,324 25,473 2,851 11.19 %
Retail
Public
Corporate

Lending, Parent bank – retail market
20.000.000
21.000.000
22.000.000
23.000.000
24.000.000
25.000.000
26.000.000
27.000.000
28.000.000
29.000.000
jan.
04fe
b.04
mar
.04
apr.0
4m
ay.0
4ju
n.04
jul.0
4au
g.04
sep.
04oc
t.04
nov.
04de
c.04
jan.
05fe
b.05
mar
.05
apr.0
5m
ay.0
5ju
n.05
jul.0
5au
g.05
sep.
05oc
t.05
nov.
05de
c.05
jan.
06fe
b.06
mar
.06
apr.0
6m
ay.0
6ju
n.06
NO
K
-
0,50
1,00
1,50
2,00
2,50
Inte
rest
con
trib
utio
n
Loan volum retail banking
Loan contribution retail banking

Customer deposits, Parent bank – retail market
12.000.000
12.500.000
13.000.000
13.500.000
14.000.000
14.500.000
15.000.000
15.500.000
16.000.000
jan.
04fe
b.04
mar
.04
apr.0
4m
ay.0
4ju
n.04
jul.0
4au
g.04
sep.
04oc
t.04
nov.
04de
c.04
jan.
05fe
b.05
mar
.05
apr.0
5m
ay.0
5ju
n.05
jul.0
5au
g.05
sep.
05oc
t.05
nov.
05de
c.05
jan.
06fe
b.06
mar
.06
apr.0
6m
ay.0
6ju
n.06
NO
K
-
0,20
0,40
0,60
0,80
1,00
1,20
1,40
1,60
1,80
2,00
Inte
rest
con
trib
utio
n
Deposit volum retail banking
Deposit contribution retail banking

Lending, Parent bank – corporate market
13.000.000
13.500.000
14.000.000
14.500.000
15.000.000
15.500.000
16.000.000
16.500.000
jan.
04fe
b.04
mar
.04
apr.0
4m
ay.0
4ju
n.04
jul.0
4au
g.04
sep.
04oc
t.04
nov.
04de
c.04
jan.
05fe
b.05
mar
.05
apr.0
5m
ay.0
5ju
n.05
jul.0
5au
g.05
sep.
05oc
t.05
nov.
05de
c.05
jan.
06fe
b.06
mar
.06
apr.0
6m
ay.0
6ju
n.06
NO
K
-
0,50
1,00
1,50
2,00
2,50
Inte
rest
con
trib
utio
n
Loan volum corporate
Loan contribution corporate

Customer deposits, Parent bank – corporate market
7.000.000
8.000.000
9.000.000
10.000.000
11.000.000
12.000.000
13.000.000
14.000.000
jan.
04fe
b.04
mar
.04
apr.0
4m
ay.0
4ju
n.04
jul.0
4au
g.04
sep.
04oc
t.04
nov.
04de
c.04
jan.
05fe
b.05
mar
.05
apr.0
5m
ay.0
5ju
n.05
jul.0
5au
g.05
sep.
05oc
t.05
nov.
05de
c.05
jan.
06fe
b.06
mar
.06
apr.0
6m
ay.0
6ju
n.06
NO
K
-
0,20
0,40
0,60
0,80
1,00
1,20
Inte
rest
con
trib
utio
n
Deposit volum corporate
Deposit contribution corporate

The credit area

Management targets for SpareBank 1 Nord-Norge’scredit area
• Risk-adjusted return in the retail banking- and corporate banking market
• Concentration risk* Breakdown between retail banking- and corporate banking market commitments* Largest individual commitment* Maximum exposure involving the Bank’s 20 largest customers* Proportion of risk-adjusted capital per sector
• Operational targets* Proportion of high-risk commitments* Probability of commitments going into default* Maximum expected losses* Maximum unexpected losses

Credit policy
• Special credit handling (credit authority limit) routines for:* the fishing- and fish-related industries* the financing of intangible rights/assets
• Upper credit limits for fish farming, fishing vessels and fishing industry
• Delegated lending authority to be applied ”at arm’s length”

The credit area: Strategy
Growth – with appropriate risk:
• Retail banking market – a two-part strategy:• Maintain current business and develop more business from
existing customers• Capture new market shares, especially where Bank’s
market share is low
• Corporate customers• Strong emphasis on SMB segments• Cultivate and develop existing customer base (’across-the-
board’ sales)• New larger corporate customers providing risk is low
• General points relating to both markets:• Correct pricing in relation to risk• Avoid detrimental concentration within certain sectors and
areas
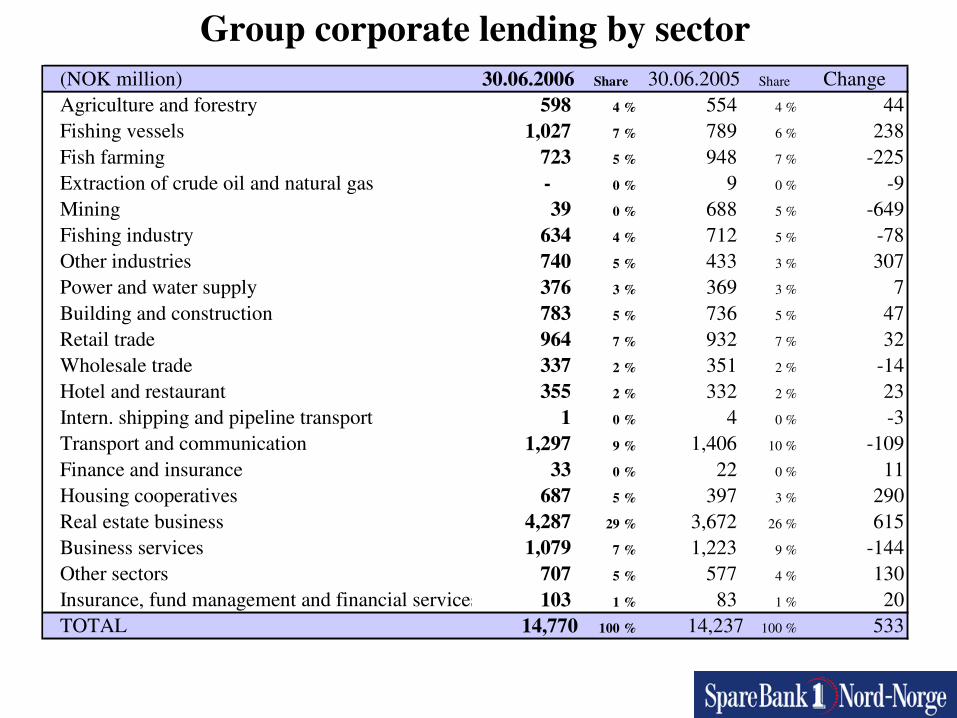
Group corporate lending by sector(NOK million) 30.06.2006 Share 30.06.2005 Share ChangeAgriculture and forestry 598 4 % 554 4 % 44Fishing vessels 1,027 7 % 789 6 % 238Fish farming 723 5 % 948 7 % -225Extraction of crude oil and natural gas - 0 % 9 0 % -9Mining 39 0 % 688 5 % -649Fishing industry 634 4 % 712 5 % -78Other industries 740 5 % 433 3 % 307Power and water supply 376 3 % 369 3 % 7Building and construction 783 5 % 736 5 % 47Retail trade 964 7 % 932 7 % 32Wholesale trade 337 2 % 351 2 % -14Hotel and restaurant 355 2 % 332 2 % 23Intern. shipping and pipeline transport 1 0 % 4 0 % -3Transport and communication 1,297 9 % 1,406 10 % -109Finance and insurance 33 0 % 22 0 % 11Housing cooperatives 687 5 % 397 3 % 290Real estate business 4,287 29 % 3,672 26 % 615Business services 1,079 7 % 1,223 9 % -144Other sectors 707 5 % 577 4 % 130Insurance, fund management and financial services 103 1 % 83 1 % 20TOTAL 14,770 100 % 14,237 100 % 533
Favorable risk development in the Bank’s lendingportfolio
This is due to:
1. Good development within Nord-Norge’s economy and within our customers’financial position
2. Systematic work on the high-risk part of the portfolio• individual commitments have been terminated• individual commitments have been identified as losses and specific
write-downs have been made
3. New corporate customers have largely been low-risk customers.
4. Enhanced quality in the use of the Bank’s portfolio management system (Porto)
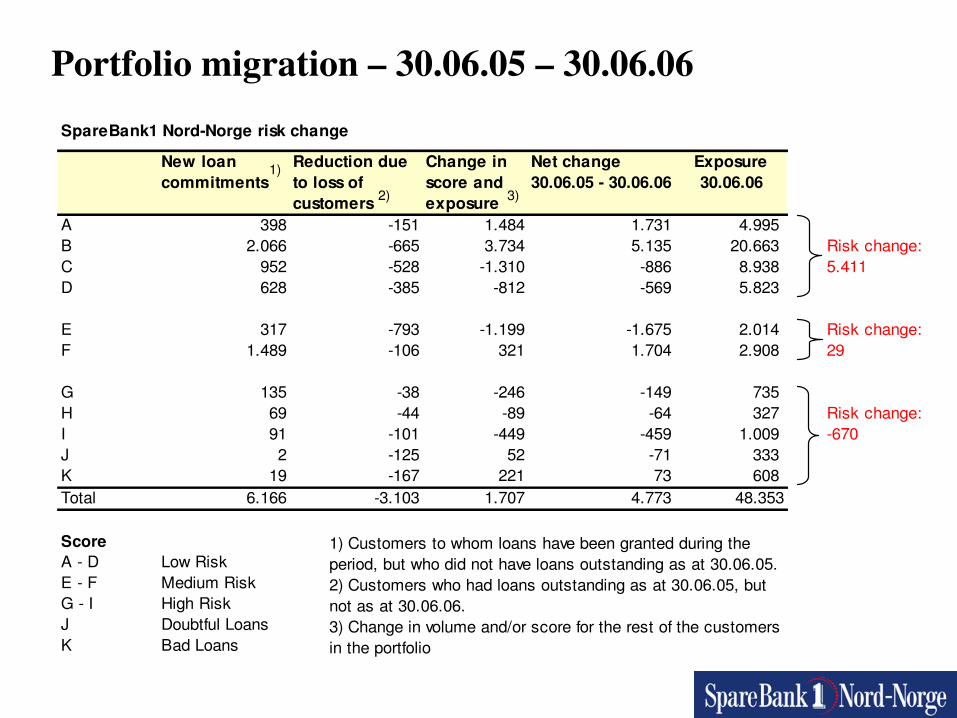
Portfolio migration – 30.06.05 – 30.06.06SpareBank1 Nord-Norge risk change
New loan commitments
Reduction due to loss of customers
Change in score and exposure
Net change 30.06.05 - 30.06.06
Exposure 30.06.06
A 398 -151 1.484 1.731 4.995 B 2.066 -665 3.734 5.135 20.663 Risk change:C 952 -528 -1.310 -886 8.938 5.411D 628 -385 -812 -569 5.823
E 317 -793 -1.199 -1.675 2.014 Risk change:F 1.489 -106 321 1.704 2.908 29
G 135 -38 -246 -149 735 H 69 -44 -89 -64 327 Risk change:I 91 -101 -449 -459 1.009 -670J 2 -125 52 -71 333 K 19 -167 221 73 608 Total 6.166 -3.103 1.707 4.773 48.353
ScoreA - D Low RiskE - F Medium RiskG - I High RiskJ Doubtful LoansK Bad Loans
1)
2) 3)
1) Customers to whom loans have been granted during the period, but who did not have loans outstanding as at 30.06.05.2) Customers who had loans outstanding as at 30.06.05, but not as at 30.06.06.3) Change in volume and/or score for the rest of the customers in the portfolio

Portfolio migration – 30.06.05 – 30.06.06Corporate Market risk change
New loan commitments
Reduction due to loss of customers
Change in score and exposure
Net change 30.06.05 - 30.06.06
Exposure 30.06.06
A 108 -62 525 571 2.120B 974 -301 -287 386 6.776 Risk change:C 366 -149 -1.074 -857 2.303 283D 82 -77 178 183 1.472
E 164 -730 -565 -1.131 1.060 Risk change:F 1.180 -59 330 1.451 1.966 320
G 3 -17 -106 -120 338H 30 -30 14 14 130 Risk change:I 29 -42 -2 -15 419 3J 9 -103 101 7 231K 20 -131 228 117 494Total 2.965 -1.701 -658 606 17.309
ScoreA - D Low RiskE - F Medium RiskG - I High RiskJ Doubtful LoansK Bad Loans
1)
2) 3)
1) Customers to whom loans have been granted during the period, but who did not have loans outstanding as at 30.06.05.2) Customers who had loans outstanding as at 30.06.05, but not as at 30.06.06. 3) Change in volume and/or score for the rest of the customers in the portfolio

Portfolio migration – 30.06.05 – 30.06.06
Retail Market risk change
New loan commitments
Reduction due to loss of customers
Change in score and exposure
Net change 30.06.05 - 30.06.06
Exposure 30.06.06
A 311 -104 953 1.160 2.875B 1.217 -467 3.998 4.748 13.887 Risk change:C 646 -410 -265 -29 6.635 5.127D 576 -320 -1.008 -752 4.351
E 164 -129 -579 -544 955 Risk change:F 361 -54 -54 253 942 -291
G 133 -28 -133 -28 397H 40 -17 -101 -78 196 Risk change:I 68 -63 -449 -444 590 -672J 2 -27 -53 -78 102K 0 -37 -7 -44 114Total 3.518 -1.656 2.302 4.164 31.044
ScoreA - D Low RiskE - F Medium RiskG - I High RiskJ Doubtful LoansK Bad Loans
1)
2) 3)
1) Customers to whom loans have been granted during the period, but who did not have loans outstanding as at 30.06.05.2) Customers who had loans outstanding as at 30.06.05, but not as at 30.06.06. 3) Change in volume and/or score for the rest of the customers in the portfolio

Lending by risk class
-
5,000
10,000
15,000
20,000
25,000
30,000
35,000
40,000
45,000
Low risk Midium risk High risk Commitments in default andwrite downs
30.06.200530.09.200531.12.200531.03.200630.06.2006
30.06.2005 30.09.2005 31.12.2005 31.03.2006 30.06.2006Low risk 35,007 37,033 36,907 38,504 40,419Midium risk 4,894 4,773 4,460 4,873 4,922High risk 2,743 2,428 2,440 2,192 2,071Commitments in default and write downs 939 700 1,268 912 941
Total 43,583 44,934 45,075 46,480 48,353

0
100
200
300
400
500
600
700
2003 2004 2005 30.06.06
NO
K m
ill.
1.35 %1.40 %1.45 %1.50 %1.55 %1.60 %1.65 %1.70 %1.75 %1.80 %1.85 %
NOK million Percentage of gross lending
Net bad and doubtful commitments - Group
2003 2004 2005 30.06.06NOK million 644 682 639 696Percentage of gross lending 1.70 % 1.80 % 1.51 % 1.59 %
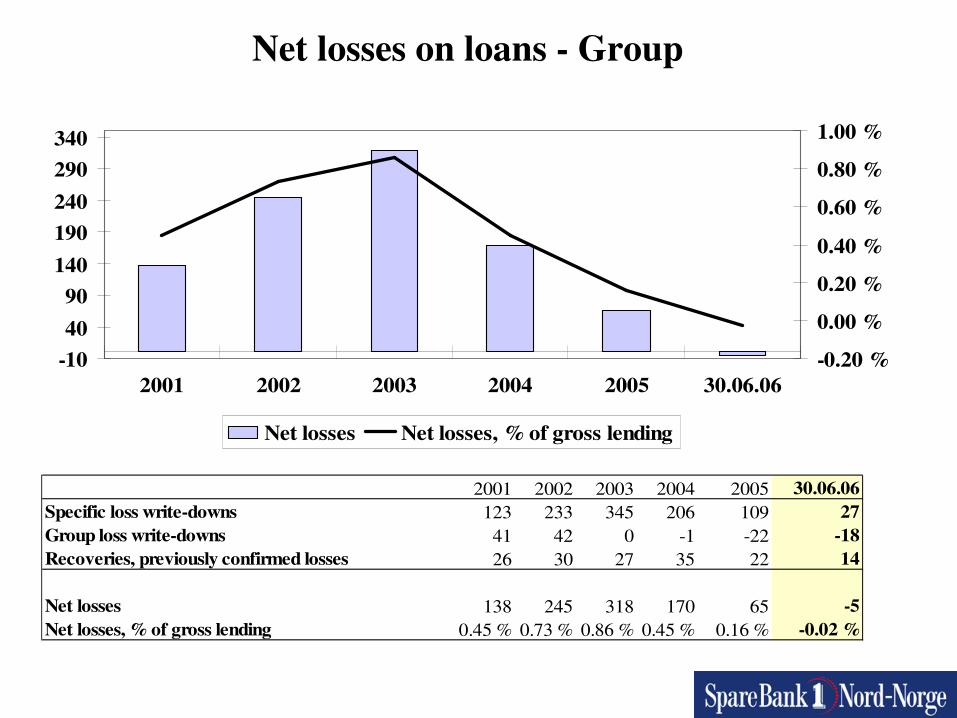
Net losses on loans - Group
-104090
140190240290340
2001 2002 2003 2004 2005 30.06.06-0.20 %
0.00 %
0.20 %
0.40 %
0.60 %
0.80 %
1.00 %
Net losses Net losses, % of gross lending
2001 2002 2003 2004 2005 30.06.06Specific loss write-downs 123 233 345 206 109 27Group loss write-downs 41 42 0 -1 -22 -18Recoveries, previously confirmed losses 26 30 27 35 22 14
Net losses 138 245 318 170 65 -5Net losses, % of gross lending 0.45 % 0.73 % 0.86 % 0.45 % 0.16 % -0.02 %

Group – lending key figures
30.06.06 2005 2004 2003 2002 2001Net losses -0.02 % 0.16 % 0.45 % 0.86 % 0.73 % 0.45 %Loss provisions 1.04 % 1.17 % 1.70 % 2.24 % 2.02 % 1.70 %Specific write-downs 0.57 % 0.65 % 0.85 % 1.36 % 1.06 % 0.79 %Group write-downs 0.47 % 0.52 % 0.85 % 0.87 % 0.96 % 0.91 %Gross lending 2.13 % 2.31 % 2.65 % 3.11 % 3.20 % 2.11 %Net lending 1.59 % 1.68 % 1.80 % 1.75 % 2.13 % 1.32 %

PCC*-holder policy*Primary Capital Certificates
• SpareBank 1 Nord-Norge aims to produce profits which will provide the basis for offering a competitive rate of return on the Bank's PCC's.
• The level of dividend paid to PCC-holders will depend upon the annual profitmade. The sum of the dividend paid and transfer made to the Dividend Equalisation Fund should reflect the PCC-holders share of the Bank's equity capital.
• As far as the split between the total cash dividend payment and transfer to theDividend Equalisation Fund is concerned, the Bank will seek to give priority to achieving a high cash dividend share. When considering the split between these two elements, however, the Board of Directors will also take into consideration the Bank’s equity capital situation.
• The bank will make transfers to/and from the Dividend Equalisation Fund in accordance with the level of profit for the year and currently applicable laws, rules and regulations.
Dividend policy
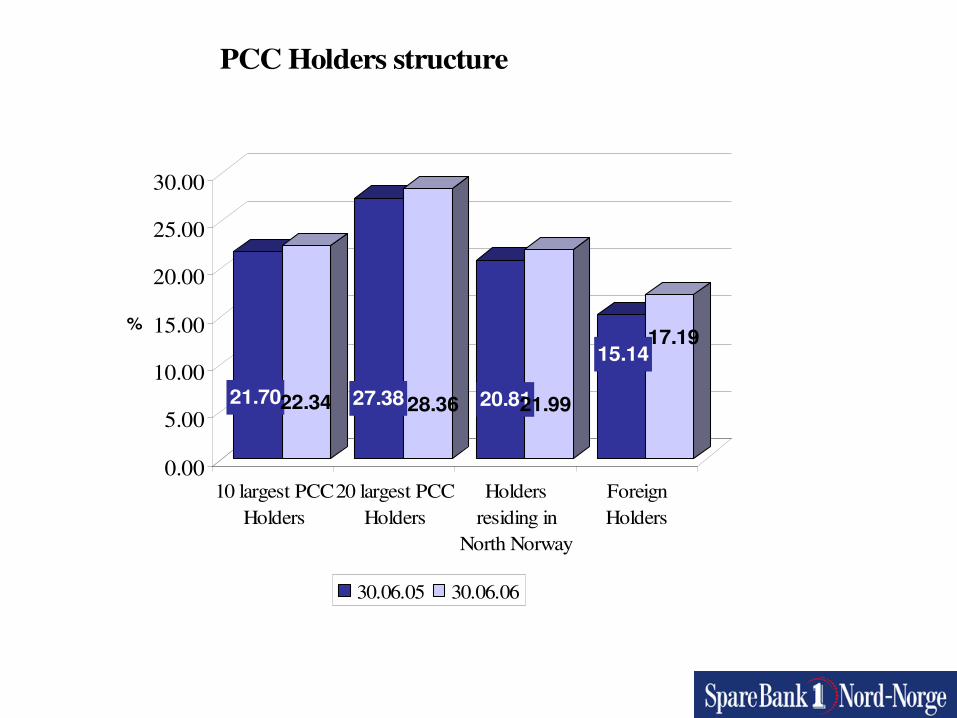
21.7022.34 27.3828.36 20.8121.99
15.1417.19
0.00
5.00
10.00
15.00
20.00
25.00
30.00
%
10 largest PCCHolders
20 largest PCCHolders
Holdersresiding in
North Norway
ForeignHolders
30.06.05 30.06.06
PCC Holders structure

The 20 largest PCC Holders as at 30.06.2006PCC'S SHARE OF TOTAL
PCC CAPITALSwedbank - client account 1,541,640 9.74 %Frank Mohn AS 398,200 2.52 %MP Pensjon 298,560 1.89 %Mellon Bank Agent 246,100 1.55 %Tonsenhagen Forretningssentrum AS 244,200 1.54 %Terra Utbytte 241,260 1.52 %Framo Development AS 200,000 1.26 %National Financial Services Citibank N.A. 126,004 0.80 %Karl Ditlefsen 120,680 0.76 %Trond Mohn 120,000 0.76 %Troms Kraft AS 115,780 0.73 %SpareBank 1 SR-bank 106,413 0.67 %Fred Olsen & Co's Pensjonskasse 102,000 0.64 %Stichting Shell Pensjon 98,100 0.62 %Sparebankstiftelsen 94,600 0.60 %Ringerikes Sparebank 94,080 0.59 %Forvarets Personell Service 86,880 0.55 %PNC Blkrock FDS 85,520 0.54 %Bergen Kommunale Pensjonskasse 85,000 0.54 %JPMorgan Chase Bank - clients account 84,990 0.54 %TOTAL 4,490,007 28.36%
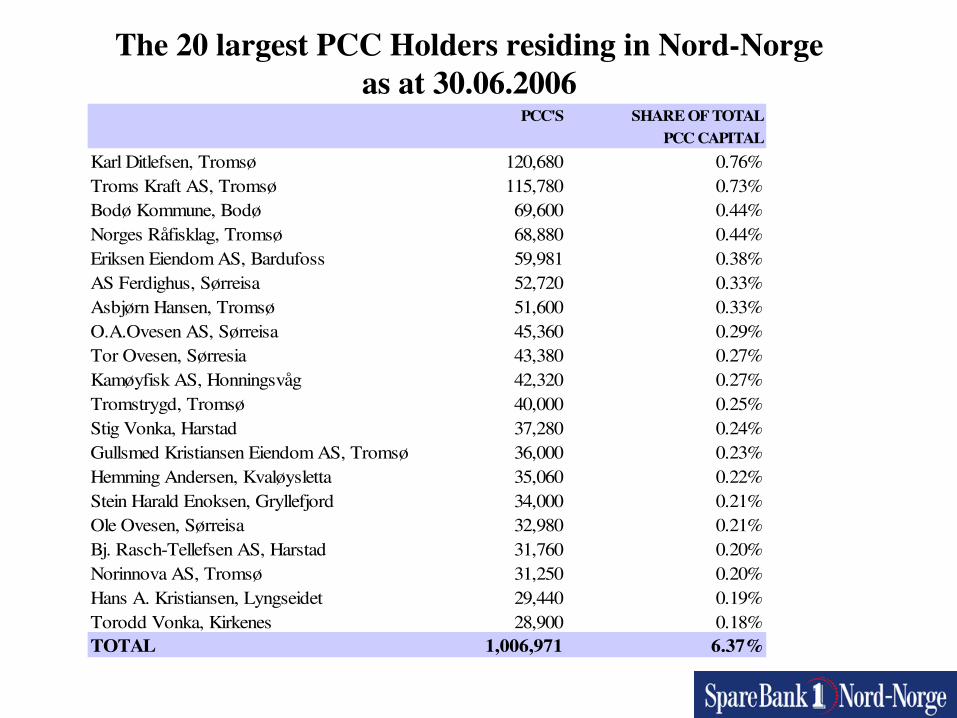
The 20 largest PCC Holders residing in Nord-Norgeas at 30.06.2006
PCC'S SHARE OF TOTALPCC CAPITAL
Karl Ditlefsen, Tromsø 120,680 0.76%Troms Kraft AS, Tromsø 115,780 0.73%Bodø Kommune, Bodø 69,600 0.44%Norges Råfisklag, Tromsø 68,880 0.44%Eriksen Eiendom AS, Bardufoss 59,981 0.38%AS Ferdighus, Sørreisa 52,720 0.33%Asbjørn Hansen, Tromsø 51,600 0.33%O.A.Ovesen AS, Sørreisa 45,360 0.29%Tor Ovesen, Sørresia 43,380 0.27%Kamøyfisk AS, Honningsvåg 42,320 0.27%Tromstrygd, Tromsø 40,000 0.25%Stig Vonka, Harstad 37,280 0.24%Gullsmed Kristiansen Eiendom AS, Tromsø 36,000 0.23%Hemming Andersen, Kvaløysletta 35,060 0.22%Stein Harald Enoksen, Gryllefjord 34,000 0.21%Ole Ovesen, Sørreisa 32,980 0.21%Bj. Rasch-Tellefsen AS, Harstad 31,760 0.20%Norinnova AS, Tromsø 31,250 0.20%Hans A. Kristiansen, Lyngseidet 29,440 0.19%Torodd Vonka, Kirkenes 28,900 0.18%TOTAL 1,006,971 6.37%
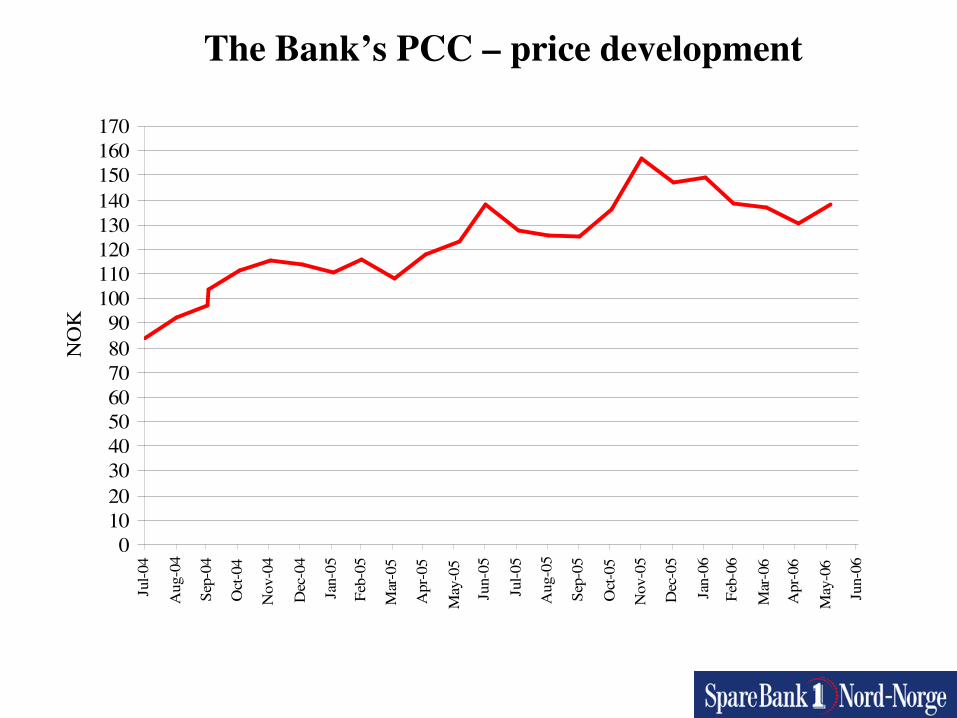
The Bank’s PCC – price development
0102030405060708090
100110120130140150160170
Jul-0
4
Aug
-04
Sep-
04
Oct
-04
Nov
-04
Dec
-04
Jan-
05
Feb-
05
Mar
-05
Apr
-05
May
-05
Jun-
05
Jul-0
5
Aug
-05
Sep-
05
Oct
-05
Nov
-05
Dec
-05
Jan-
06
Feb-
06
Mar
-06
Apr
-06
May
-06
Jun-
06
NO
K

Group: NOK million 30.06.06 30.06.05 Change Change % PROFIT AND LOSS ACCOUNT Result from ordinary operations 377 307 70 22.8%
BALANCE SHEET Total assets 51,496 44,656 6,840 15.3% Gross lending 43,765 39,672 4,093 10.3% Deposits 28,324 25,480 2,844 11.2%
KEY FIGURES 30.06.06 30.06.05 Change Change % Capital Adequacy ratio 10.25% 11.06% -0.80% After-tax return on equity capital 18.14% 16.77% 1.37% Cost as a perc.of overall contrib.margin 53.85% 55.39% -1.55% Man-years 770 773 -3 Parent bank:
Earnings per PCC (NOK) 10.93 10.06 0.86
Summary 2nd quarter 2006