Presentation October 2019 For personal use only · Investor Presentation For personal use only...
18
Investor Presentation October 2019 For personal use only
Transcript of Presentation October 2019 For personal use only · Investor Presentation For personal use only...

Investor PresentationOctober 2019
For
per
sona
l use
onl
y

Carbonxt produces patented, non-brominated, Activated Carbons that are used to eliminate mercury and other toxic pollutants from industrial flue gas and waste water streams.
Our US-based manufacturing plants produce both powdered and pelletised products which are used by customers predominantly operating coal-fired power stations, cement plants and other industrial processes.
Emission reductions are mandated by the Environmental Protection Agency (EPA) and the US power industry has invested billions of dollars installing equipment to mitigate the release of mercury.
Unlike industry peers, our products are non-brominated, which means they do not corrode capital equipment. Industry users are becoming increasingly concerned about bromination, both as a corrosive and pollutant.
We are a solutions-based company, developing customised products for specific industrial needs.
Our products are single-use creating reoccurring revenue with contracts typically several years in duration.
About Carbonxt(CG1.ASX)
For
per
sona
l use
onl
y

3
Carbonxt listed on the ASX in January 2018 raising A$10.0 million through the issue of shares at 70 cents and valuing the Company at $51.1m.
In November 2018 the company raised a further $6.1m in equity via a placement and a 1 for 4 entitlement offer at 40 cents per share.
Advanced CarbonProducts
189%
Revenue Growth in FY19
Price Chart
Company Summary
Share Register
Board of Directors
Werft Pty Ltd (Lang Walker) 11.02%
Walker Group 6.19%
Beville Investments 5.87%
Super Quinn Pty Ltd 3.38%
Washington H Soul Pattinson 3.37%
$0.30
Shares on issue (m)* 88.80
Market Cap (A$m) 26.64
Debt (A$m) 5.50
Enterprise Value (A$m) 32.14
Options/Warrants (m)** 14.14
* Inc 3.6m share in Escrow until Feb 2020
** Various average strike $0.58
Name Position Shares
Matthew Driscoll Chairman 0.42
Warren Murphy1 MD 0.25
David Mazyck2 Director 0.27
1 Warren Murphy holds 1,500,000 exercisable at $0.502 David Mazyck holds 1,000,000 exercisable at $0.50
$0.00
$0.15
$0.30
$0.45
$0.60
For
per
sona
l use
onl
y

4
Our 2 key products
PELLETISED ACTIVATED CARBONPOWDERED ACTIVATED CARBON
Produced from manufacturing facilities at Arden Hills and Gainesville we have capacity to produce 7,000 tonnes per annum.
Our AC pelleted products have a wide range of industrial applications and compete mostly against imported products which suffer from supply side challenges and more recently tariffs. Most imported products come from China.
In FY19 we sold to two customers generating A$9.28m revenue, up 4,937% on FY18.
Over the course of FY19 we started producing from our own facilities and expect future gross margins in the range of is 25-40%.
Produced from Black Birch manufacturing facility with capacity to produce 10,000 tonnes per annum.
Powdered Activated Carbons, or PACS, are the type of product used by coal-fired power plants to achieve emissions compliance. They are injected into the plant’s flue gas, where they can then absorb mercury.
In FY19 we sold 4,940 tons to 8 customers at an average price of A$1,830 to generate A$9.04m revenue, up 47% on FY18.
Over the course of FY19 we enjoyed improving economics of scale and manufacturing efficiencies and expect future gross margins in the range of is 28-38%.
For
per
sona
l use
onl
y

5
FY19 ResultsSummary
5
• Revenues of A$18.3m, up 189% on FY18.
• Pellet sales grew from A$0.2m in FY18 to A$9.3m in FY19, making it the largest revenue division within the group.
• Underlying EBITDA loss of A$5.1m, with significantly better operating performance in the second half.
o 1H underlying EBITDA: A$-4.2m
o 2H underlying EBITDA: A$-0.9m
• Improvement in gross margin from 6.7% in 1H19 to 30.4% in 2H19.
• Operating Cash Flow positive for two months in 2H19.
• Entry into new market verticals such as Industrial Pellets and Water.
• Registration of four new patents in FY19, taking the patent portfolio to a total of nine.
• The company was able to raise both equity and debt capital in FY19, confirming that capital markets are supportive of the growth strategy.
> 90%
Mercury Reduction
9Granted &
Pending Patents
29%
increase in number of customers
For
per
sona
l use
onl
y

6
Profit & Loss
FY19 Gross margins fell from 24% in FY18 to 19% in FY19
▪ Impacted by start-up manufacturing as we moved to own facilities in 1H19
▪ Now rectified, 2H19 gross margin 30%
FY19 Revenues grew 189% YoY to A$18.3m.
▪ Powdered Activated Carbon grew 47% to A$9.0m
▪ 2H19 revenues in powdered segment reflect seasonality of demand.
▪ Pellets grew 4,937% to A$9.3m
A tale of two halves, underlying EBITDA loss fell 5% to A-$5.1m in FY19.
▪ 1H19 EBITDA loss A$-4.2m
▪ 2H19 EBITDA loss A$-0.9m, trending towards profitability.
6
After a period optimisation, Carbonxt is now approaching a period of
sustained profitability. Gross margins are improving, costs are contained, and
our products are in demand.
Opportunities exist for growth within both divisions, but most notably within
Pellets. As the only North American manufacturer, we continue to penetrate
this market segment and are assessing additional use cases for our product.
Increasing tariffs on imported products are assisting this entry.
Powdered is expected to improve on the 2H19 performance.
As at 30 June (A$M) 2H18 1H19 2H19Change
(pcp)
Powdered 3.1 5.4 3.7 17%
Pellets 0.2 3.3 6.0 3389%
Group Revenue 3.3 8.7 9.7 191%
Cost of Goods Sold -2.7 -8.1 -6.7 152%
Gross Margin $ 0.7 0.6 2.9 347%
Gross Margin % 20% 7% 30% 54%
Operating Costs -4.6 -4.9 -3.8 -17%
EBITDA -3.9 -4.3 -0.9 -78%
EBITDA (Underlying) -2.7 -4.2 -0.9 -67%
D&A -0.1 -0.3 -0.4 185%
Net Interest -0.1 -0.3 -0.6 338%
Tax 0.0 0.0 0.0 -
NPAT -4.2 -4.9 -1.8 -57%
One-off costs 1.2 0.1 -0.0 -
NPAT (Underlying) -3.0 -4.8 -1.8 -39%For
per
sona
l use
onl
y

7
We reached our target of being cashflow breakeven in June 2019. Positive
cashflow is expected in 2H20, however, working capital associated with the
ramp up of material new orders may impact 1H20.
Cash receipts from customers increased 186%, inline with the growth
in revenues.
The payment of Black Birch lease liabilities were a key cash outflow, and
a major reason for the rise in broader operating expenses.
7
Experienced a rise in Investing Outflows due to the expansion and
optimisation of production facilities. Capex requirements for
incremental capacity expected to be less material.
Both equity and debt was raised throughout FY19, with capital markets
open and supportive of the strategy.
Cashflow
As at 30 June (A$M) FY18 FY19
Cashflow from Operations
Receipts from Customers 6.1 17.4
Payments to Suppliers and Employees -13.0 -23.2
Net Interest Cost 0.0 -0.5
Net Operating Cashflows -6.9 -6.3
Cashflow from Investing
Payments for Plant and Equipment -0.5 -4.1
Payments for Intellectual Property -0.1 -0.3
Net Investing Cashflows -0.6 -4.4
Cashflow from Financing
Proceeds from Issue of Shares 13.2 6.1
Proceeds from Loan Payable 0.0 5.4
Repayment of Convertible Notes 0.0 -2.5
Other -1.3 -1.3
Net Financing Cashflows 11.9 7.7
Movement in Cash 4.4 -3.0
Opening Balance 0.5 5.2
Effects of exchange rate changes 0.3 0.2
Closing Balance 5.2 2.4
For
per
sona
l use
onl
y

8
FY19 saw significant PP&E investment made in the Arden Hills
and Black Birch facilities.
8
Net borrowing capacity was increased by A$3m as the company repaid
the convertible bond and established a new A$5.5m Syndicated Facility
led by PURE Asset Management and Skye Alba.
The Company remains funded to execute on the pipeline of
opportunities continuing to present in the US market.
Balance Sheet
As at 30 June (A$M) FY18 FY19
Cash 5.2 2.4
Receivables 0.8 1.7
Inventories and Other 1.1 2.7
Total Current Assets 7.1 6.8
Property Plant and Equipment 2.1 10.6
Intangibles 1.5 1.7
Total Non-Current Assets 3.6 12.3
TOTAL ASSETS 10.7 19.1
Borrowings 0.1 1.0
Trade Payables and Other Liabilities 1.8 3.6
Total Current Liabilities 1.9 4.7
Borrowings 2.3 7.5
Other Liabilities 2.0 2.0
Total Non-Current Liabilities 4.3 9.5
TOTAL LIABILITIES 6.2 14.2
NET ASSETS 4.5 5.0 For
per
sona
l use
onl
y

9
We have enjoyed consistent growth over the last two years with group revenues increasing by 383% from FY17 through to FY19.
Demand for both our products has been strong and we are increasingly diversifying our customer base.
Management made a conscious decision to focus on the Pellet opportunity in FY19, driven by:
i) Shorter sales cycle.
ii) Diversification away from large Power Station customers.
iii) Broadening of the addressable market.
iv) Longer-term margin opportunity.
While the decision proved successful, revenues from Powdered Activated Carbon fell in 2H19 as management’s focus shifted. We expect this division to return to growth going forward.
Revenue Growth
4,937%
growth in FY19*
54%CAGR
FY17-19
A$0.0m
A$2.0m
A$4.0m
A$6.0m
A$8.0m
A$10.0m
A$12.0m
1H17 2H17 1H18 2H18 1H19 2H19
Half Yearly Revenues
PELLETS
POWDERED
* Pellet CAGR cannot be determined due to zero base
For
per
sona
l use
onl
y
10
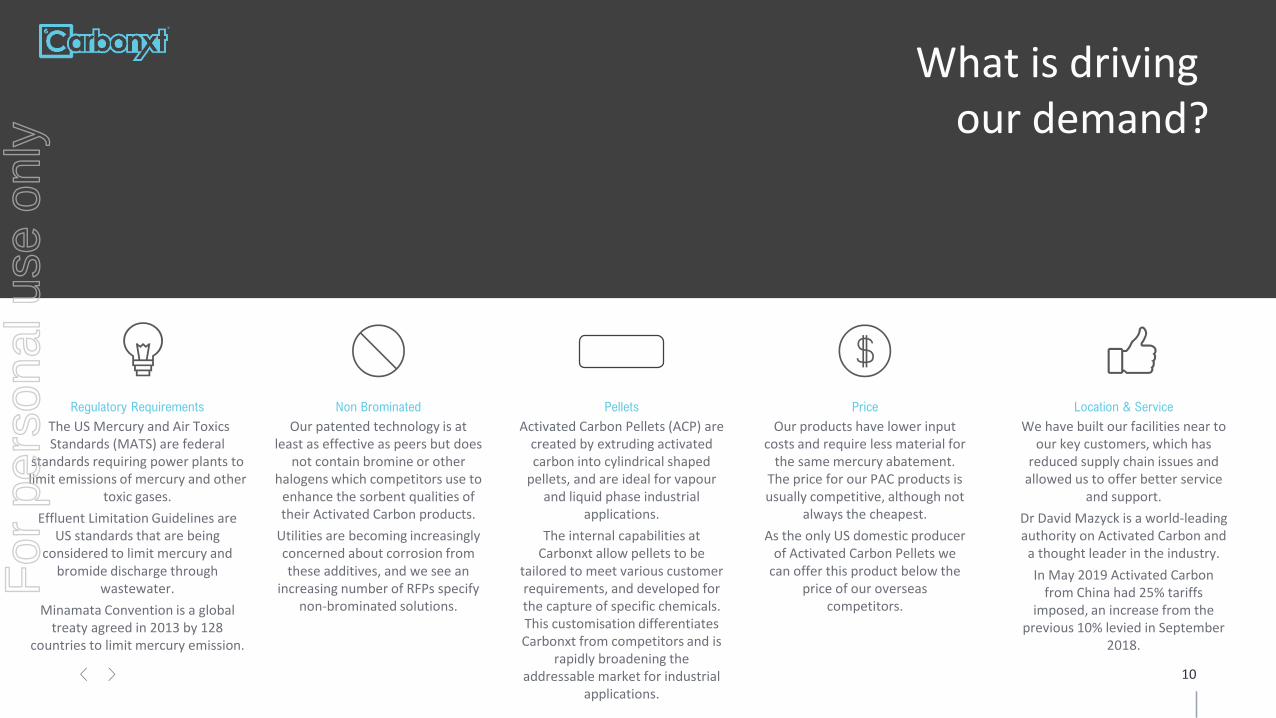
What is driving our demand?
Regulatory Requirements
The US Mercury and Air Toxics Standards (MATS) are federal
standards requiring power plants to limit emissions of mercury and other
toxic gases.
Effluent Limitation Guidelines are US standards that are being
considered to limit mercury and bromide discharge through
wastewater.
Minamata Convention is a global treaty agreed in 2013 by 128
countries to limit mercury emission.
Non Brominated
Our patented technology is at least as effective as peers but does
not contain bromine or other halogens which competitors use to
enhance the sorbent qualities of their Activated Carbon products.
Utilities are becoming increasingly concerned about corrosion from these additives, and we see an
increasing number of RFPs specify non-brominated solutions.
Price
Our products have lower input costs and require less material for
the same mercury abatement. The price for our PAC products is usually competitive, although not
always the cheapest.
As the only US domestic producer of Activated Carbon Pellets we
can offer this product below the price of our overseas
competitors.
Location & Service
We have built our facilities near to our key customers, which has
reduced supply chain issues and allowed us to offer better service
and support.
Dr David Mazyck is a world-leading authority on Activated Carbon and
a thought leader in the industry.
In May 2019 Activated Carbon from China had 25% tariffs
imposed, an increase from the previous 10% levied in September
2018.
Pellets
Activated Carbon Pellets (ACP) are created by extruding activated carbon into cylindrical shaped
pellets, and are ideal for vapour and liquid phase industrial
applications.
The internal capabilities at Carbonxt allow pellets to be
tailored to meet various customer requirements, and developed for the capture of specific chemicals. This customisation differentiates Carbonxt from competitors and is
rapidly broadening the addressable market for industrial
applications.
For
per
sona
l use
onl
y

11
Addressable Market & Pricing
With a limited number of operating producers, much data within the market is proprietary
in nature. As a result, it is difficult to accurately determine the size of the addressable
markets in which Carbonxt operates.
14.7%The CAGR of the Global Activated Carbon Market according
to industry expert MRC from US$4.1bn to US$14.2bn by 2026
76,500
148,500
206,000
114,500
132,500
155,000
0t
50,000t
100,000t
150,000t
200,000t
250,000t
300,000t
350,000t
400,000t
2010A 2015A 2020E
North America Activated Carbon Demand
(Current CG1 Products)
INDUSTRIAL AIR
PURIFICATION
WATER
TREATMENT
25-29 Nov 2019Dates of the next meeting for the Parties to the Minimata
Convention on Mercury, to which activated carbon is a prime beneficiary.
Approx US$150 - 200mADA Carbon Solutions’ estimate of the size of the North
American MATS Powdered Activated Carbon Market.
PelletsWhile the broader AC market is forecast to grow strongly,
pelletized AC is expected to expand faster than legacy powdered products
5% – 15%The amount by which Cabot Corporation plans to increase
prices across all activated carbon products from 1st October 2019SOURCES: World Activated Carbon, Freedonia Focus Reports, World Collection: 2016
For
per
sona
l use
onl
y

12
Our path to profitability
After years of Research and Development, we are now reaching a meaningful level of commercialisation within our product range.
Based on the pipeline of work available, we expect to reach sustainable profitability in 2H20.
While the number of trials and discussions with potential customers continue to grow, the potential deal sizes are also larger than legacy contracts.
The cost base was improved materially in 2H19, providing strong operating leverage as future revenues grow.
Gross margins are expected to improve as the product mix shifts towards higher margin Pellet opportunities.
We are about to close a material contract and expect to reach sustainable profitability in FY20.
-A$6.0m
-A$5.0m
-A$4.0m
-A$3.0m
-A$2.0m
-A$1.0m
A$0.0mA$0.0m
A$1.0m
A$2.0m
A$3.0m
A$4.0m
A$5.0m
A$6.0m
4Q17 1Q18 2Q18 3Q18 4Q18 1Q19 2Q19 3Q19 4Q19
Opex
Gro
ss P
rofit
Gross Profit vs Opex (trailing 6 months)
Rapidly closing the gap to profitability
For
per
sona
l use
onl
y

13
90%
16
Our total order book of
contracted revenue grew 90% to
$20.0m in FY19 , and currently
stands at A$23.5m
We have 16 active trials with
prospective customers. A large
proportion of new trials relate to
Pellet opportunities, where
historical conversion rates are in
excess of 50%
A$20m
The total estimated value of
orders being trialled or
negotiated is A$20m
0
2
4
6
8
10
12
14
16
18
FY17 FY18 FY19 Current
Customers & Trials
CUSTOMER TRIALS
ACTIVE CUSTOMERS
A$0.0m
A$5.0m
A$10.0m
A$15.0m
A$20.0m
A$25.0m
FY17 FY18 FY19 Current
Forward Order Book
PELLETS
POWDERED
For
per
sona
l use
onl
y

14
Powdered - Black Birch: 10,000 tons p/a nameplate capacity
Pellets - Arden Hills and Gainesville: 7,000 tonnes p/a nameplate capacity
Utilisation: Pellet facilities to operate at a minimum of 80% utilisation in FY20
OUR LOCATIONS
Arden Hills
Black Birch
Gainesville
US production facilitiesCurrent estimates suggest our production facilities will be operating at between 45% and 90% utilisation throughout 2020.
Should demand exceed currently capacity in the years ahead it would require approximately US$6m to double the capacity of our Black Birch and Arden Hills facilities.
Utilisation: Black Birch to operate between 45% and 75% utilisation in FY20
For
per
sona
l use
onl
y

15
The Pellet Opportunity
Carbonxt is the only North American manufacturer of Pellet solutions, in what is a fast growing and largely underpenetrated market.
Pellet revenues grew from $0.2m in FY to $9.3m in FY19. Inbound enquiries continue to increase as awareness of our Pellet capabilities grows.
While Pellet orders to date have revolved around fulfilling requirements for power stations, we now see opportunities across a range of industrial applications. This is evidenced by the recently won contract within the Filtration sector.
The development of new solutions continues to expand our addressable market into industries not previously serviced by Carbonxt.
Filtration
Filtration
Benefits • Shorter sales cycle.
• Higher margin opportunity longer term.
• Broadens and diversifies the customer base across multiple industries.
• Significantly increases the company’s addressable market.
Target industries
NATURAL GAS SOLVENT
RECOVERY
FILTRATION LANDFILLS
HEAVYMANUFACTURING
WASTE WATERTREATMENT
VOCABATEMENT
For
per
sona
l use
onl
y

Outlook statement
After reaching periods of cash flow profitability in 2H19, Carbonxtexpects to deliver it’s maiden year of operating cash flow positivity in FY20. Based on current work-in-hand and pipeline of opportunities in discussion, we expect to deliver FY20 revenue in the range of A$24 – A$29m. This represents organic growth of 31% - 58% YoY.
NEXT HORIZON OPPORTUNITIES
WetJectTM is a patented process that targets mercury elimination through the injection of a customised sorbent directly into wet flue gas desulfurization (WFGD) systems - installed in 60% of power stations. This technology is more efficient for mercury removal compared to the standard air phase and is cost-effective to install. Initial sales are expected in FY20.
International Sales – despite being signatories to the Minamata Convention most counties have yet to implement legislation to limit the release of atmospheric mercury. Freedonia estimates global demand for Activated Carbon is growing at a 9.1% CAGR.
New Pellet Verticals – subject to minor chemistry modifications, our Pellet range can be adapted to serve industries far beyond our target market. Management is analysing further opportunities to which the technology can be applied.
16
For
per
sona
l use
onl
y

17
Board & Senior Management
MANAGING DIRECTOR
Warren Murphy
Warren was Co-Head of the Australian
Infrastructure & Project Finance Group
and Head of Energy at Babcock &
Brown. Warren led the development of
Babcock & Brown’s energy sector
capability in Australia and New Zealand,
including the founding of Infigen
Energy. He was also a director of the
ASX listed Alinta Limited and Sydney
Gas Limited, and development of over
2,000MW of Greenfields power
stations and the acquisition of over
3,000MW of generation.
EXECUTIVE DIRECTOR
Dr. David Mazyck
David is a world-leading expert on
activated carbon (AC) and its
applications including mercury
capture. He has developed AC
products for the major
multinationals. Dr. Mazyck is the
former Chairman of the Activated
Carbon Standards Committee for the
American Waterworks Association
and has developed products for
NASA. He is a member of the World
Coal Association and an appointee to
the United Nations.
INDEPENDENT CHAIRMAN
Matthew Driscoll
Matthew has significant experience
across several industries, including
online technologies, financial
services, fintech, property and
resources. He has more than 30
years’ experience in capital markets
and the financial services industry
and is an accomplished company
director in roles across listed and
private companies. He has
significant experience in
international business growth,
mergers and acquisitions, equity and
debt raisings and building strategic
alliances, and remains committed to
ethical, commercial and consumer-
based outcomes. Matthew is NED
Energy Technologies Limited (EGY),
NED Blina Minerals (BDI), NED
BuyMyPlace.com.au (BMP), NED
Smoke Alarms Holdings.
For
per
sona
l use
onl
y

18
Thank you
+61 (0) 413 841 216
CONTACT
Warren Murphy
Managing Director
For
per
sona
l use
onl
y