
Presentation Material for Investor Meeting for Fiscal 2018
43
Presentation Material for Investor Meeting for Fiscal 2018 Securities Code: 7157 TSE Mothers May 13, 2019
Transcript of Presentation Material for Investor Meeting for Fiscal 2018

Presentation
Material for
Investor Meeting
for Fiscal 2018
Securities Code: 7157
TSE Mothers
May 13, 2019
LIFENET is...
ComprehensibleCost-CompetitiveConvenient
Remembering the original purpose of life insurance – mutual support
Reaching customers with insurance needs with the necessary coverage in appropriate methods
1
1. Financial Results for Fiscal 2018
2. New Management Policy and Future Endeavors
Table of Contents
2
3
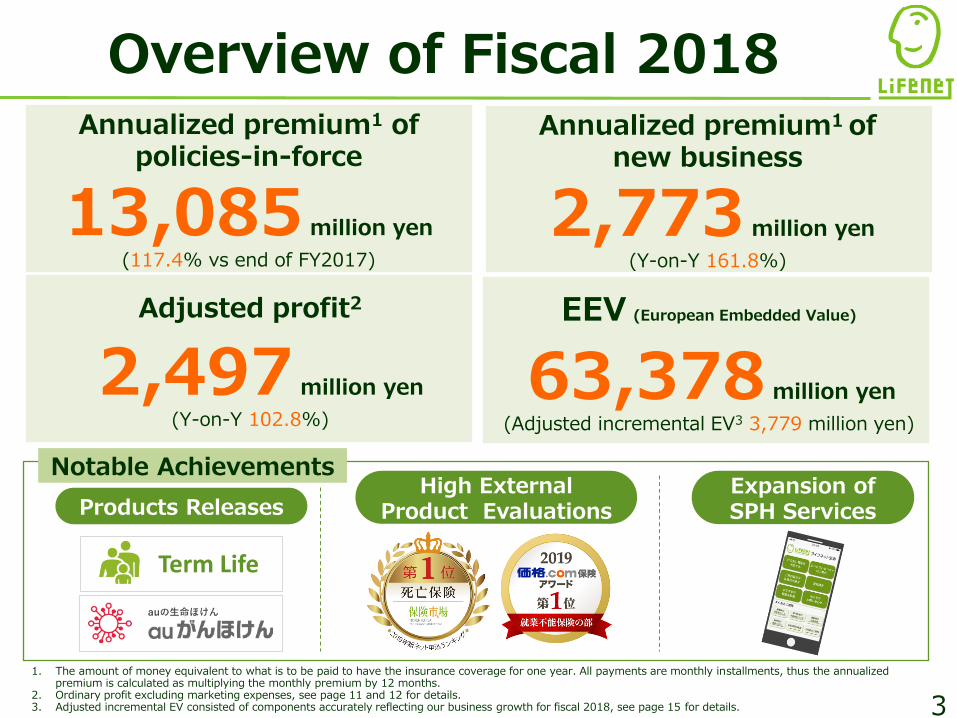
Annualized premium1 of policies-in-force
13,085 million yen
(117.4% vs end of FY2017)
Annualized premium1 of new business
2,773 million yen
(Y-on-Y 161.8%)
Adjusted profit2
2,497 million yen
(Y-on-Y 102.8%)
EEV (European Embedded Value)
63,378 million yen
(Adjusted incremental EV3 3,779 million yen)
Overview of Fiscal 2018
Notable Achievements
1. The amount of money equivalent to what is to be paid to have the insurance coverage for one year. All payments are monthly installments, thus the annualized premium is calculated as multiplying the monthly premium by 12 months.
2. Ordinary profit excluding marketing expenses, see page 11 and 12 for details.3. Adjusted incremental EV consisted of components accurately reflecting our business growth for fiscal 2018, see page 15 for details.
Products ReleasesHigh External
Product EvaluationsExpansion of SPH Services
Term Life
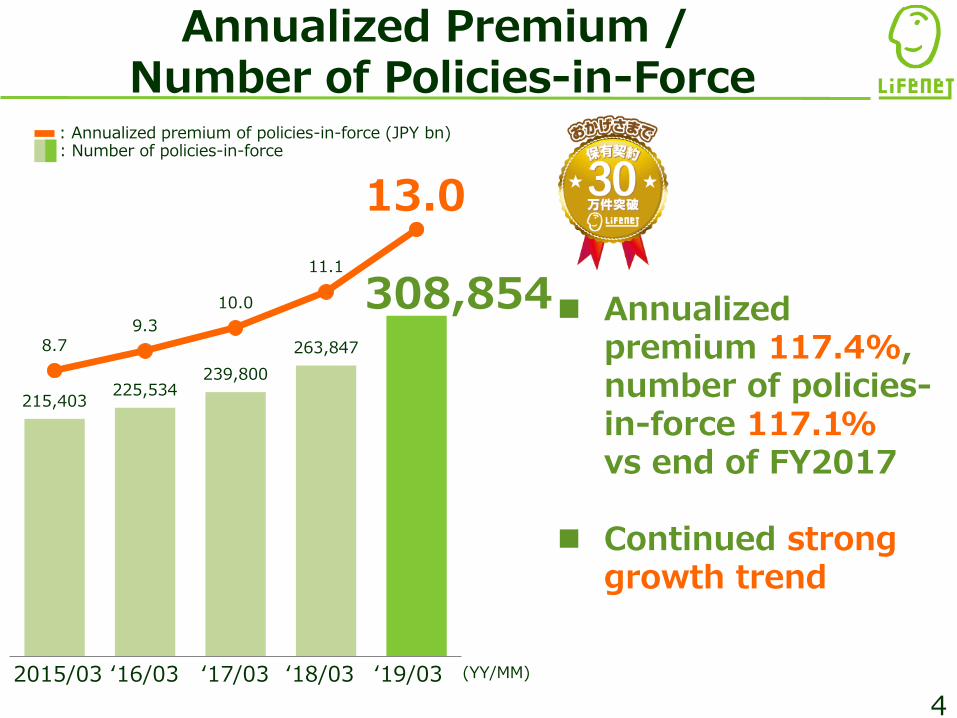
215,403 225,534
239,800
263,847 8.7 9.3
10.0
11.1
13.0
‘17/03
4
Annualized Premium /Number of Policies-in-Force
‘19/03
308,854
: Number of policies-in-force: Annualized premium of policies-in-force (JPY bn)
2015/03 ‘16/03 ‘18/03
Annualized premium 117.4%,number of policies-in-force 117.1%vs end of FY2017
Continued strong growth trend
(YY/MM)
FY2017 FY2018
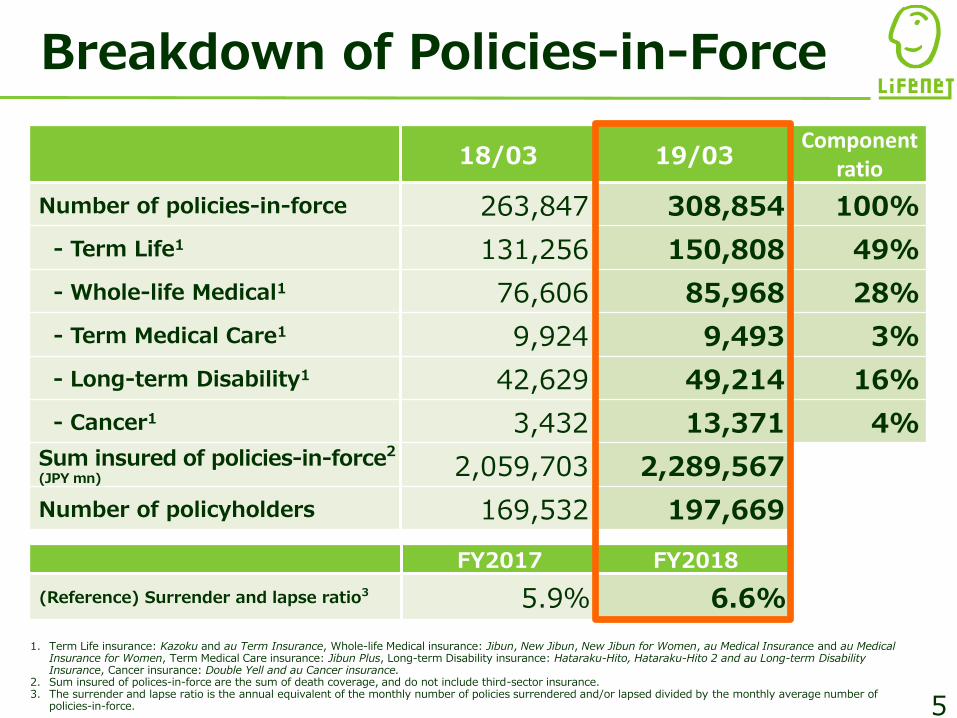
(Reference) Surrender and lapse ratio3 5.9% 6.6%
Breakdown of Policies-in-Force
5
18/03 19/03Component
ratio
Number of policies-in-force 263,847 308,854 100%
- Term Life1 131,256 150,808 49%
- Whole-life Medical1 76,606 85,968 28%
- Term Medical Care1 9,924 9,493 3%
- Long-term Disability1 42,629 49,214 16%
- Cancer1 3,432 13,371 4%Sum insured of policies-in-force2
(JPY mn)2,059,703 2,289,567
Number of policyholders 169,532 197,669
1. Term Life insurance: Kazoku and au Term Insurance, Whole-life Medical insurance: Jibun, New Jibun, New Jibun for Women, au Medical Insurance and au Medical Insurance for Women, Term Medical Care insurance: Jibun Plus, Long-term Disability insurance: Hataraku-Hito, Hataraku-Hito 2 and au Long-term Disability Insurance, Cancer insurance: Double Yell and au Cancer insurance.
2. Sum insured of polices-in-force are the sum of death coverage, and do not include third-sector insurance. 3. The surrender and lapse ratio is the annual equivalent of the monthly number of policies surrendered and/or lapsed divided by the monthly average number of
policies-in-force.
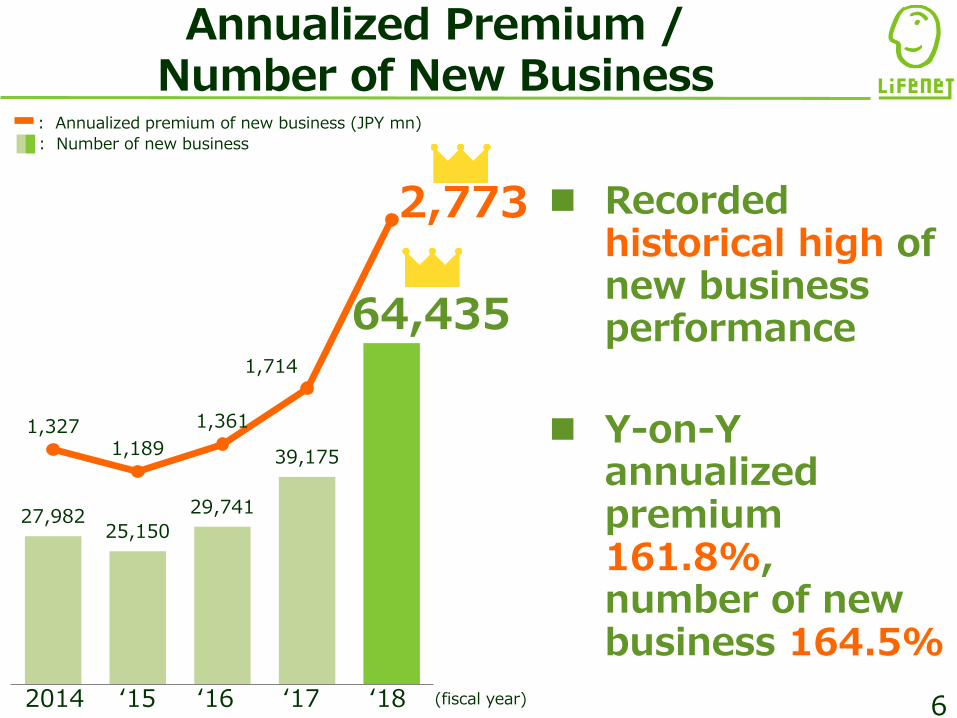
27,982 25,150
29,741
39,175
1,327 1,189
1,361
1,714
2,773
6
Annualized Premium / Number of New Business
‘18‘16 ‘172014 ‘15
Recorded historical high of new businessperformance
Y-on-Y annualized premium 161.8%, number of new business 164.5%
64,435
: Annualized premium of new business (JPY mn)
: Number of new business
(fiscal year)
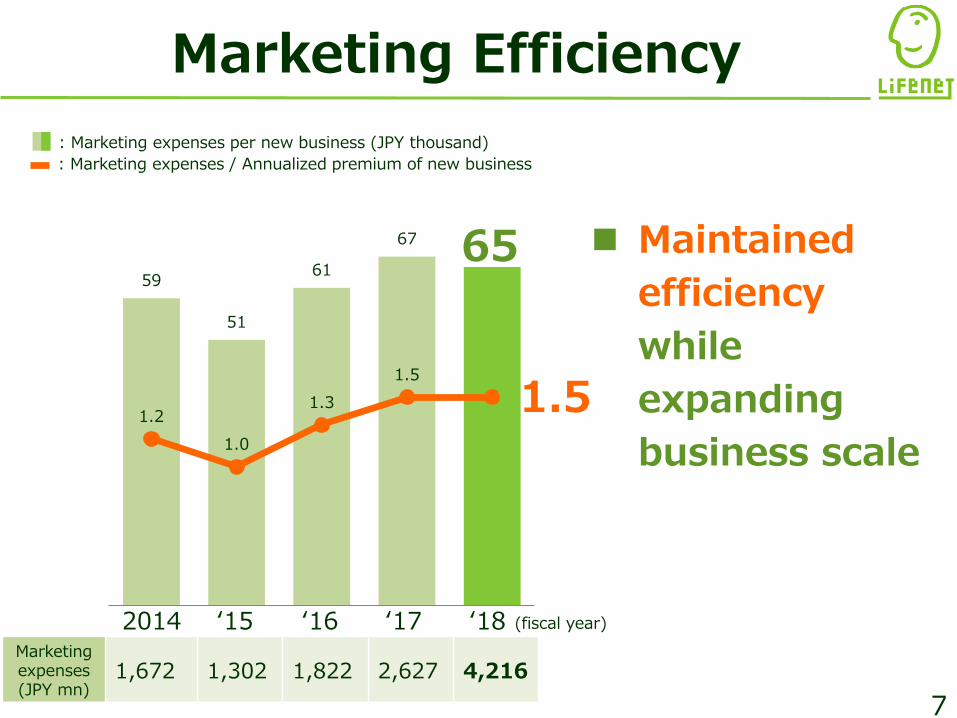
Maintained
efficiency
while
expanding
business scale
Marketing Efficiency
7
65
1.5
: Marketing expenses per new business (JPY thousand)
: Marketing expenses / Annualized premium of new business
‘152014 ‘16 ‘17Marketing expenses(JPY mn)
1,672 1,302 1,822 2,627 4,216
‘18 (fiscal year)
59
51
61
67
1.2
1.0
1.3
1.5
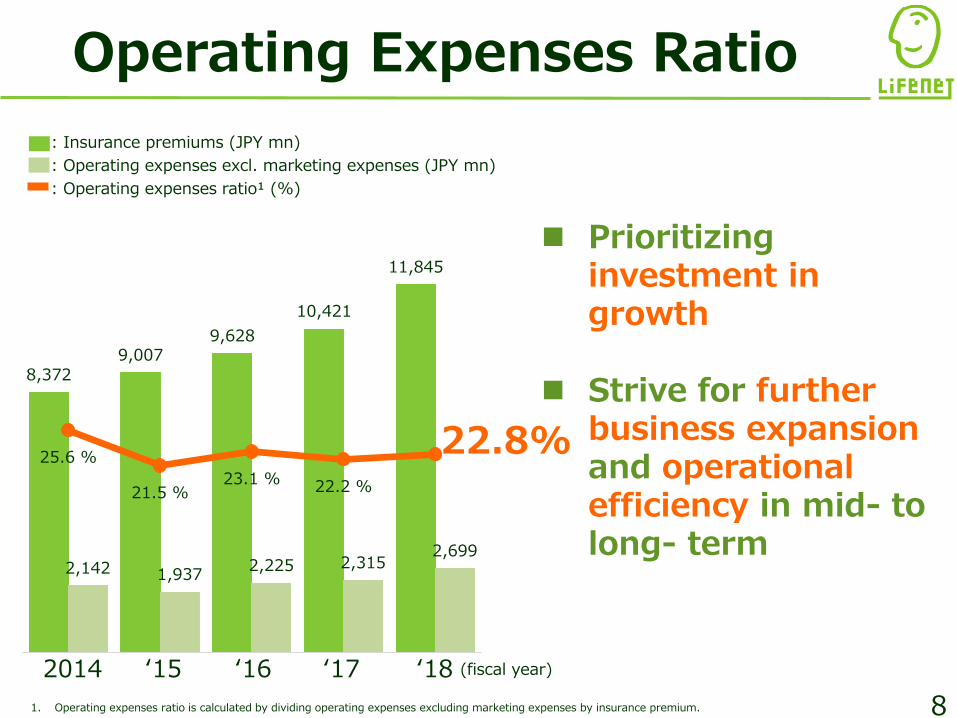
8,372 9,007
9,628
10,421
11,845
2,142 1,937 2,225 2,315
2,699
25.6 %
21.5 %23.1 % 22.2 %
8
Operating Expenses Ratio
Prioritizing investment in growth
Strive for further business expansion and operational efficiency in mid- to long- term
2014 ‘15 ‘16 ‘17
1. Operating expenses ratio is calculated by dividing operating expenses excluding marketing expenses by insurance premium.
‘18
22.8%
: Insurance premiums (JPY mn)
: Operating expenses excl. marketing expenses (JPY mn)
: Operating expenses ratio¹ (%)
(fiscal year)
初年度 2年目 3年目 4年目 … X年目
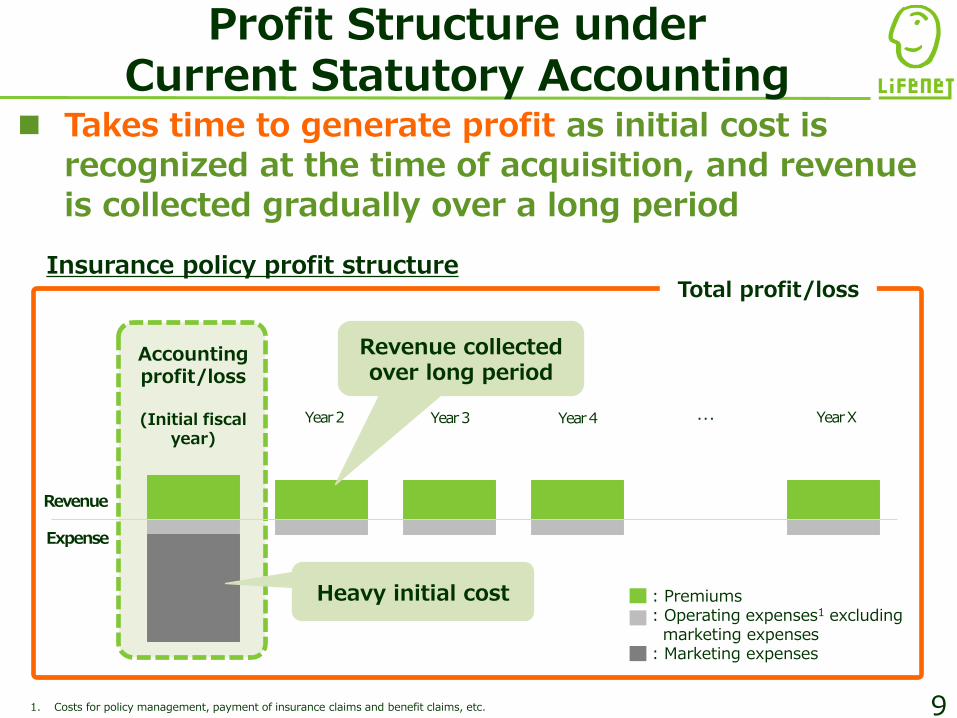
Profit Structure under Current Statutory Accounting
Insurance policy profit structureTotal profit/loss
Accounting profit/loss
(Initial fiscal year)
Year 2 Year 3 Year 4 Year X
Revenue collected over long period
Heavy initial cost
Revenue
Expense
1. Costs for policy management, payment of insurance claims and benefit claims, etc.
Takes time to generate profit as initial cost is recognized at the time of acquisition, and revenue is collected gradually over a long period
: Premiums: Operating expenses1 excluding
marketing expenses: Marketing expenses
9
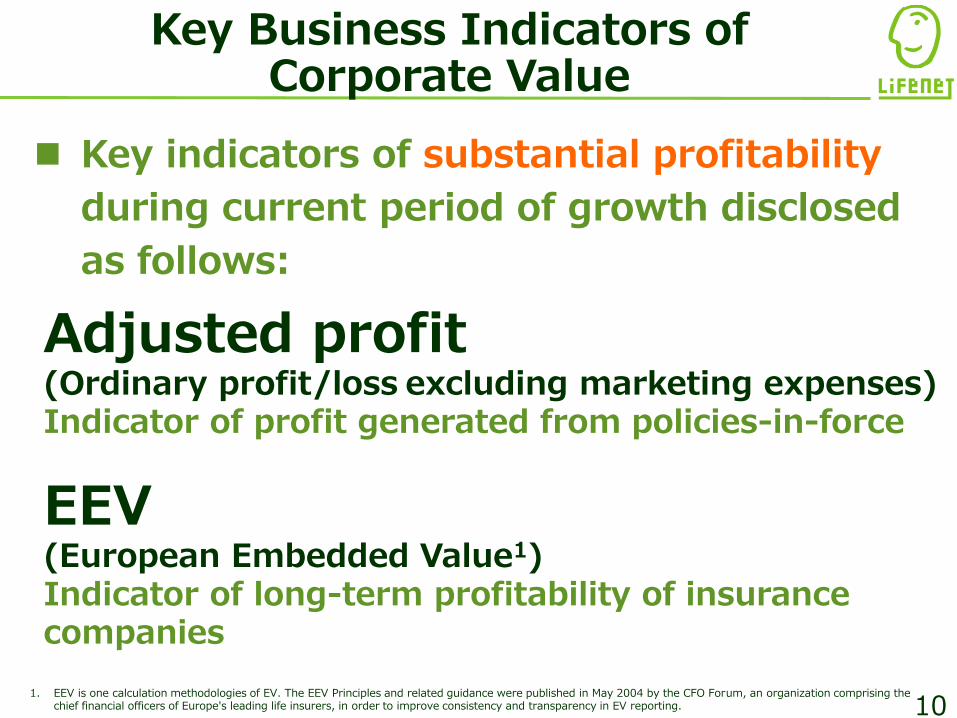
Key Business Indicators ofCorporate Value
Adjusted profit(Ordinary profit/loss excluding marketing expenses)Indicator of profit generated from policies-in-force
EEV(European Embedded Value1)Indicator of long-term profitability of insurance companies
Key indicators of substantial profitability
during current period of growth disclosed
as follows:
1. EEV is one calculation methodologies of EV. The EEV Principles and related guidance were published in May 2004 by the CFO Forum, an organization comprising the chief financial officers of Europe's leading life insurers, in order to improve consistency and transparency in EV reporting. 10

Adjusted Profit
Indicator of profit generated from policies-in-force
Ordinary profit excluding marketing expenses
Adjusted profit
• As accrual timing of cost and revenue do not match, statutory accounting does not necessarily provide an accurate picture of profitability of our business.
• Accrual timing of marketing expenses is far from that of revenue, therefore, excluding marketing expenses from ordinary profit/loss enables the indication of profit generated from policies-in-force.
Significance of Adjusted profit disclosure
11
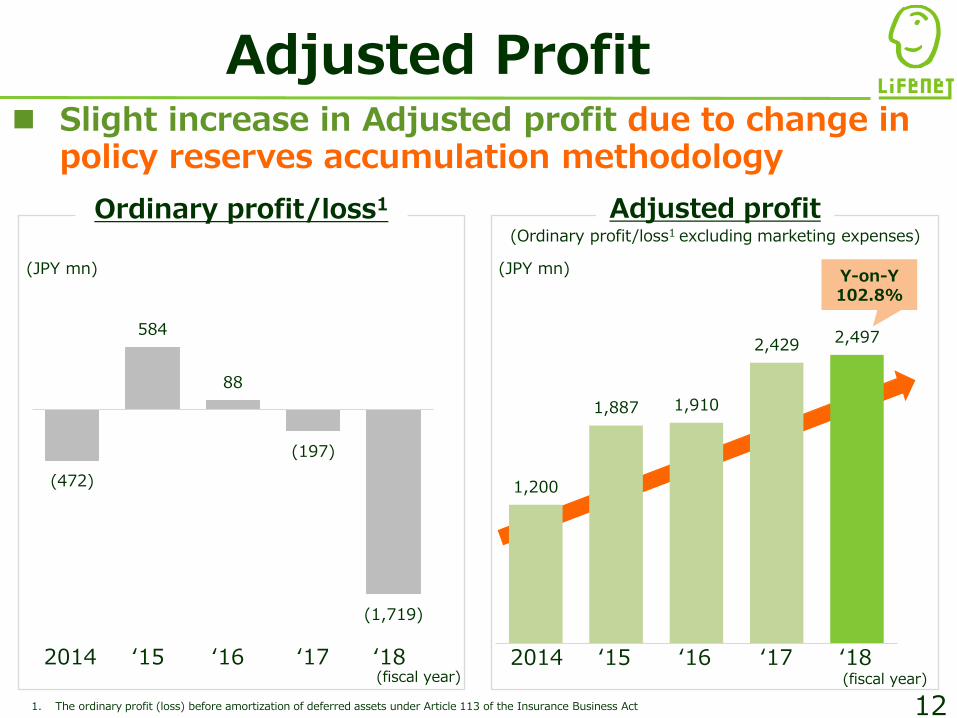
1,200
1,887 1,910
2,429 2,497
12
Slight increase in Adjusted profit due to change in policy reserves accumulation methodology
(JPY mn)
1. The ordinary profit (loss) before amortization of deferred assets under Article 113 of the Insurance Business Act
Ordinary profit/loss1 Adjusted profit
(472)
584
88
(197)
(1,719)
Y-on-Y 102.8%
Adjusted Profit
(JPY mn)
(fiscal year)
(Ordinary profit/loss1 excluding marketing expenses)
(fiscal year)
‘16‘15 ‘18‘172014‘16‘15 ‘18‘172014
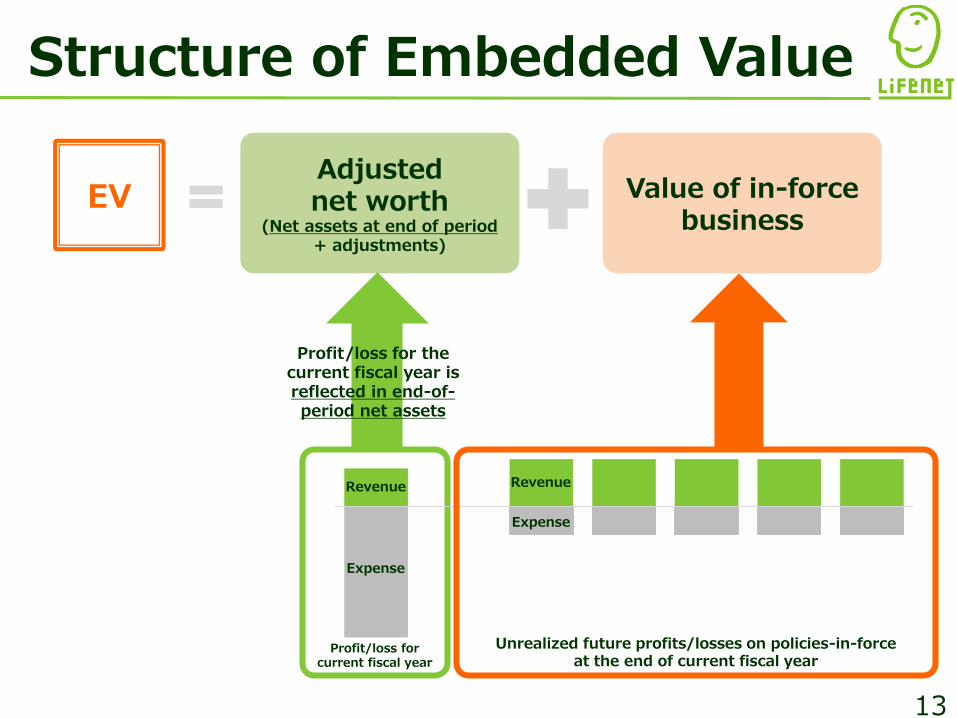
Structure of Embedded Value
EVAdjusted net worth
(Net assets at end of period + adjustments)
Value of in-force business
Unrealized future profits/losses on policies-in-force at the end of current fiscal year
Profit/loss for current fiscal year
Revenue Revenue
Expense
Expense
Profit/loss for the current fiscal year is reflected in end-of-period net assets
13
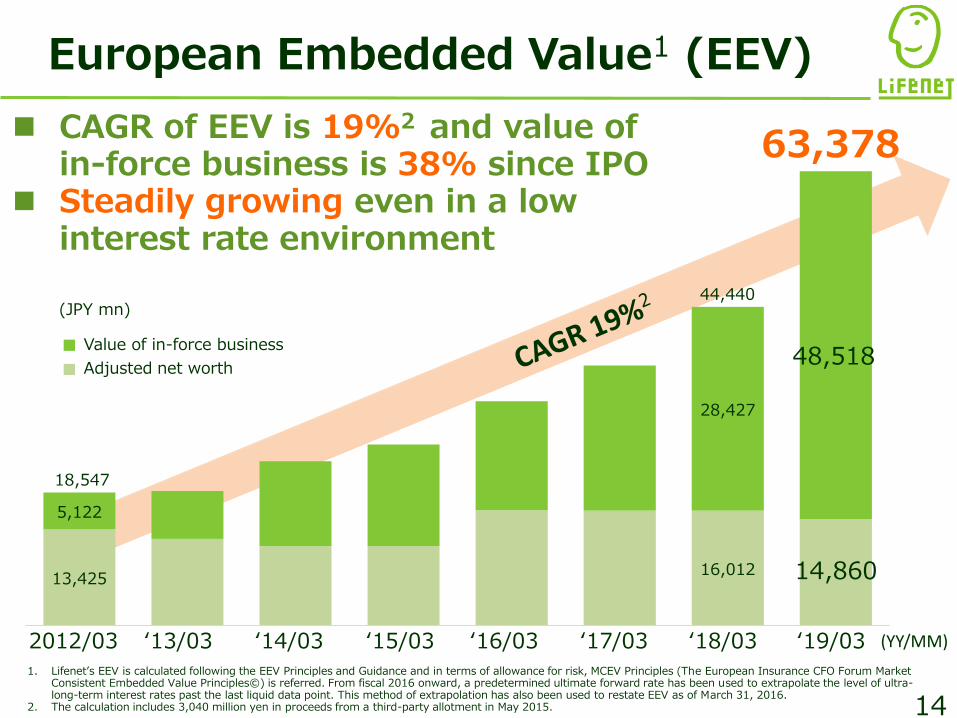
13,425 16,012
5,122
28,427
18,547
44,440
14
2012/03
48,518
14,860
‘13/03 ‘14/03 ‘15/03 ‘16/03 ‘17/03 ‘18/03 ‘19/03
European Embedded Value1 (EEV)
CAGR of EEV is 19%2 and value of in-force business is 38% since IPO
Steadily growing even in a low interest rate environment
Value of in-force business
Adjusted net worth
(JPY mn)
(YY/MM)
1. Lifenet’s EEV is calculated following the EEV Principles and Guidance and in terms of allowance for risk, MCEV Principles (The European Insurance CFO Forum Market Consistent Embedded Value Principles©) is referred. From fiscal 2016 onward, a predetermined ultimate forward rate has been used to extrapolate the level of ultra-long-term interest rates past the last liquid data point. This method of extrapolation has also been used to restate EEV as of March 31, 2016.
2. The calculation includes 3,040 million yen in proceeds from a third-party allotment in May 2015.
63,378
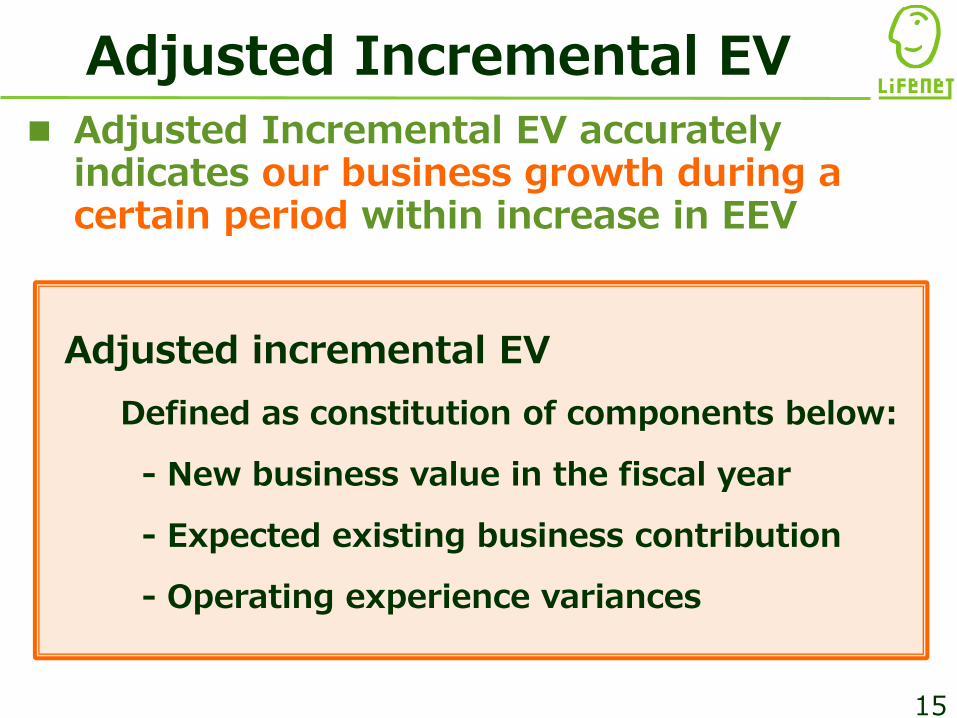
Adjusted incremental EV
Defined as constitution of components below:
- New business value in the fiscal year
- Expected existing business contribution
- Operating experience variances
Adjusted Incremental EV
Adjusted Incremental EV accurately indicates our business growth during a certain period within increase in EEV
15
16
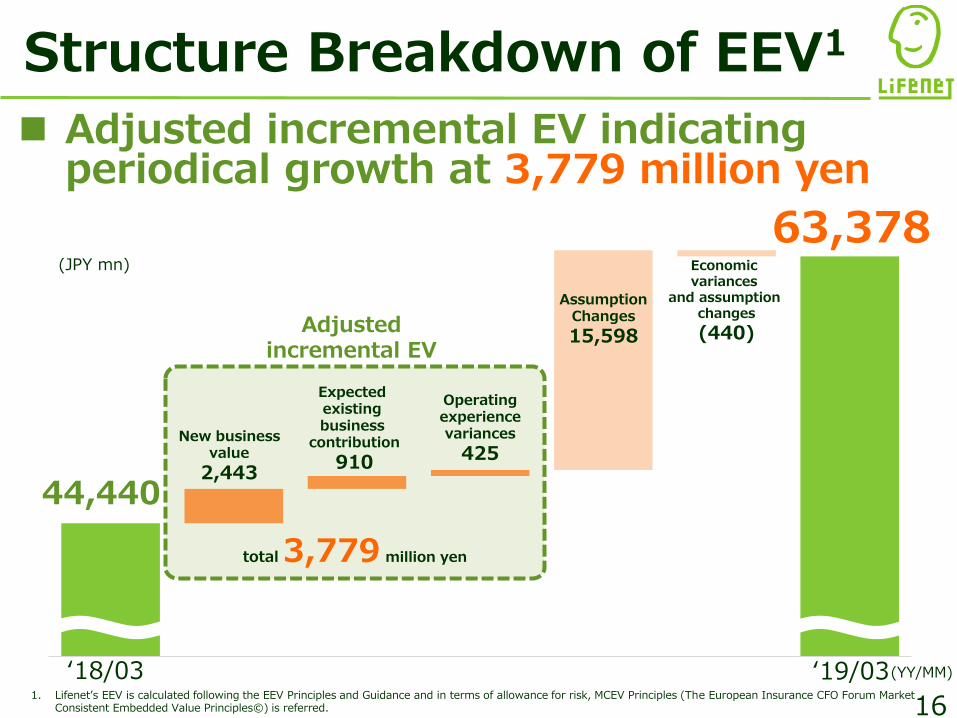
‘19/03
63,378
44,440
Structure Breakdown of EEV1
Adjusted incremental EV indicating periodical growth at 3,779 million yen
‘18/03 (YY/MM)
Adjusted incremental EV
total 3,779 million yen
New businessvalue
2,443
Expected existing business
contribution
910
Operatingexperiencevariances
425
AssumptionChanges
15,598
Economic variances
and assumption changes
(440)
1. Lifenet’s EEV is calculated following the EEV Principles and Guidance and in terms of allowance for risk, MCEV Principles (The European Insurance CFO Forum Market Consistent Embedded Value Principles©) is referred.
(JPY mn)
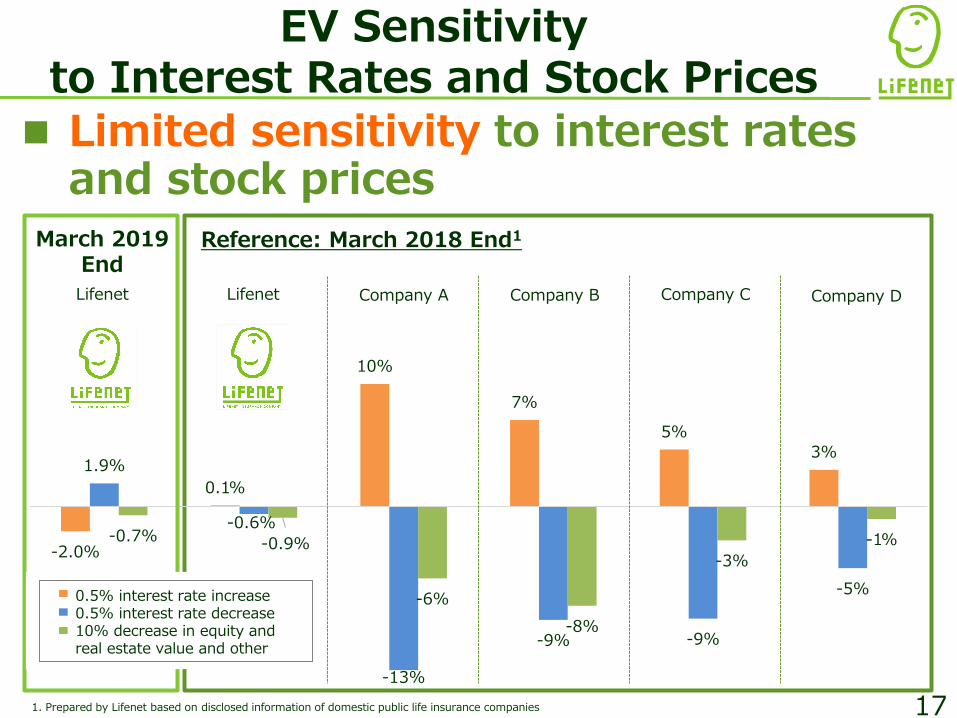
-2.0%
0.1%
10%
7%
5%
3%1.9%
-0.6%
-13%
-9% -9%
-5%
-0.7% -0.9%
-6%
-8%
-3%
-1%
ライフネット生命 ライフネット生命 A社 B社 C社 D社
1. Prepared by Lifenet based on disclosed information of domestic public life insurance companies
Limited sensitivity to interest rates and stock prices
17
Reference: March 2018 End1March 2019 End
EV Sensitivity to Interest Rates and Stock Prices
Lifenet Lifenet Company A Company B Company C Company D
: 0.5% interest rate increase: 0.5% interest rate decrease: 10% decrease in equity and
real estate value and other
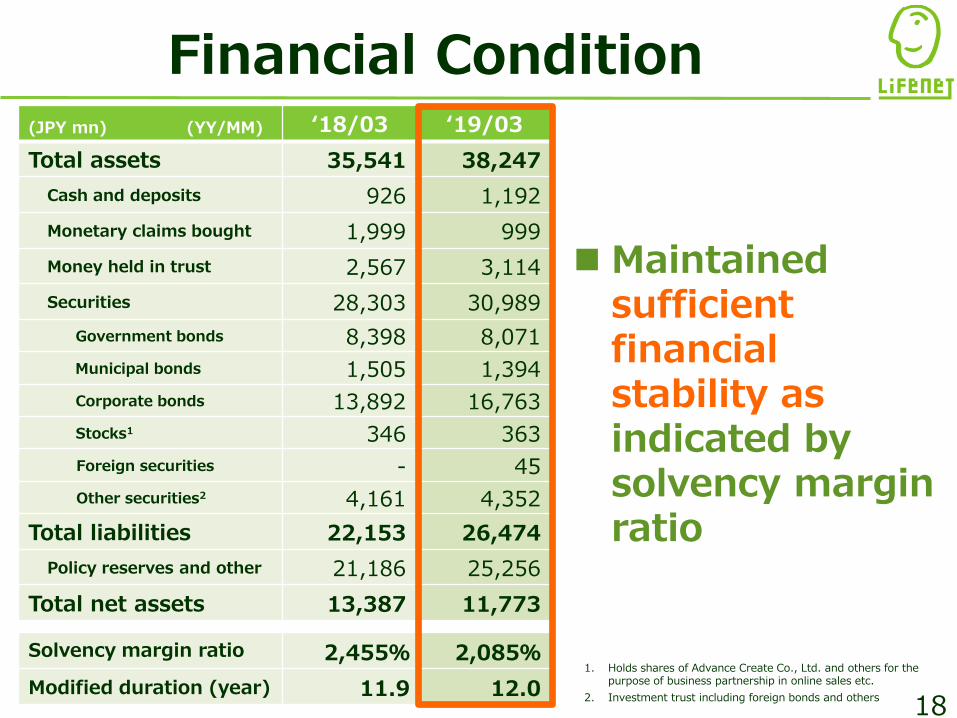
(JPY mn) (YY/MM) ‘18/03 ‘19/03
Total assets 35,541 38,247
Cash and deposits 926 1,192
Monetary claims bought 1,999 999
Money held in trust 2,567 3,114
Securities 28,303 30,989
Government bonds 8,398 8,071
Municipal bonds 1,505 1,394
Corporate bonds 13,892 16,763
Stocks1 346 363
Foreign securities - 45
Other securities2 4,161 4,352
Total liabilities 22,153 26,474
Policy reserves and other 21,186 25,256
Total net assets 13,387 11,773
Solvency margin ratio 2,455% 2,085%
Modified duration (year) 11.9 12.018
Maintained sufficientfinancial stability as indicated by solvency margin ratio
1. Holds shares of Advance Create Co., Ltd. and others for the purpose of business partnership in online sales etc.
2. Investment trust including foreign bonds and others
Financial Condition
19
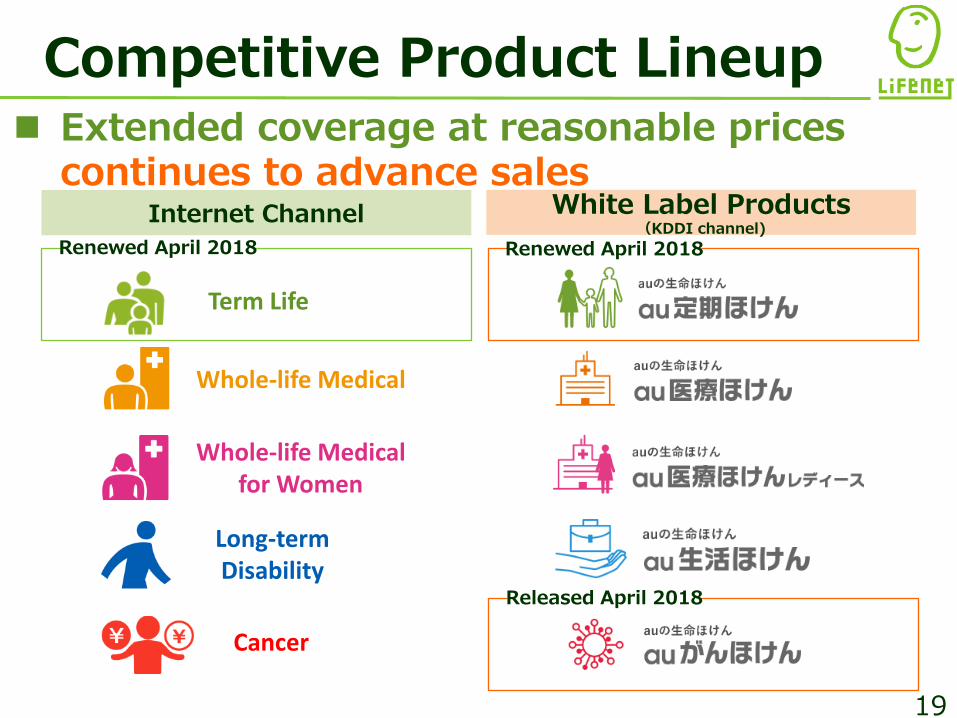
Internet Channel White Label Products(KDDI channel)
Competitive Product Lineup Extended coverage at reasonable prices
continues to advance sales
Renewed April 2018 Renewed April 2018
Released April 2018
Term Life
Long-term Disability
Cancer
Whole-life Medical
Whole-life Medical for Women
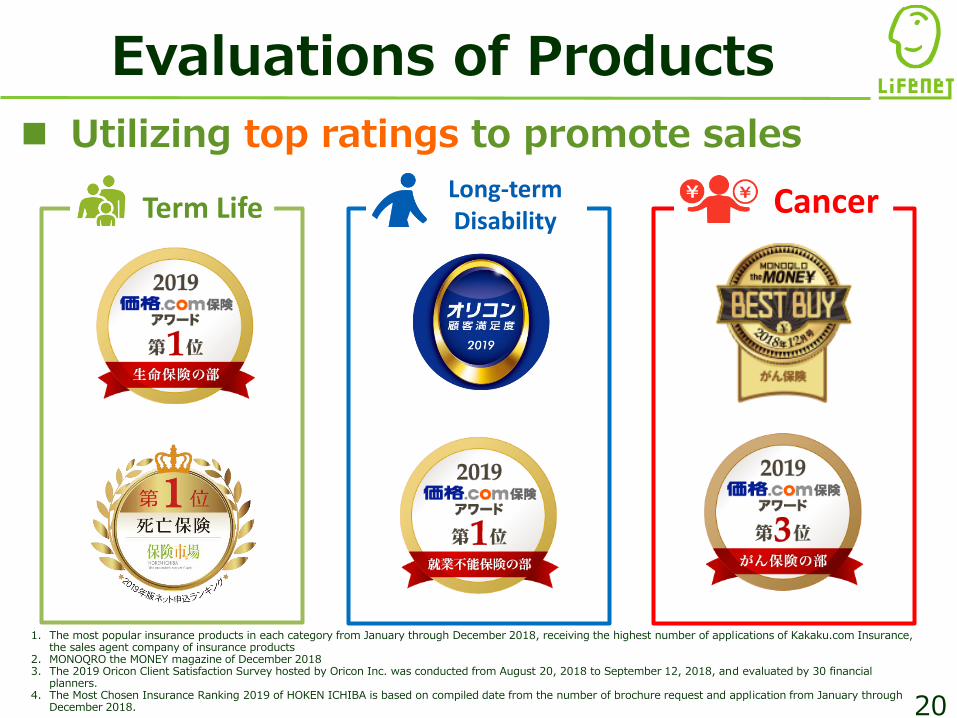
Evaluations of Products
20
Utilizing top ratings to promote sales
CancerLong-term DisabilityTerm Life
1. The most popular insurance products in each category from January through December 2018, receiving the highest number of applications of Kakaku.com Insurance, the sales agent company of insurance products
2. MONOQRO the MONEY magazine of December 20183. The 2019 Oricon Client Satisfaction Survey hosted by Oricon Inc. was conducted from August 20, 2018 to September 12, 2018, and evaluated by 30 financial
planners.4. The Most Chosen Insurance Ranking 2019 of HOKEN ICHIBA is based on compiled date from the number of brochure request and application from January through
December 2018.
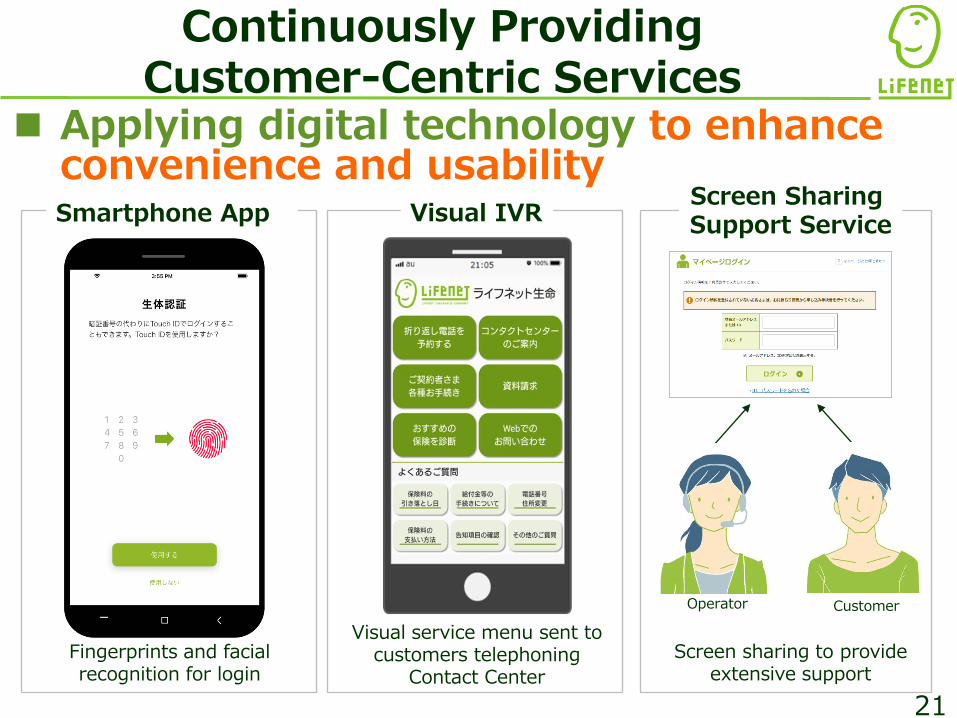
Fingerprints and facial recognition for login
Visual service menu sent to customers telephoning
Contact Center
Continuously Providing Customer-Centric Services
Applying digital technology to enhance convenience and usability
Customer
Smartphone App
Operator
Screen sharing to provide extensive support
Visual IVRScreen Sharing Support Service
21
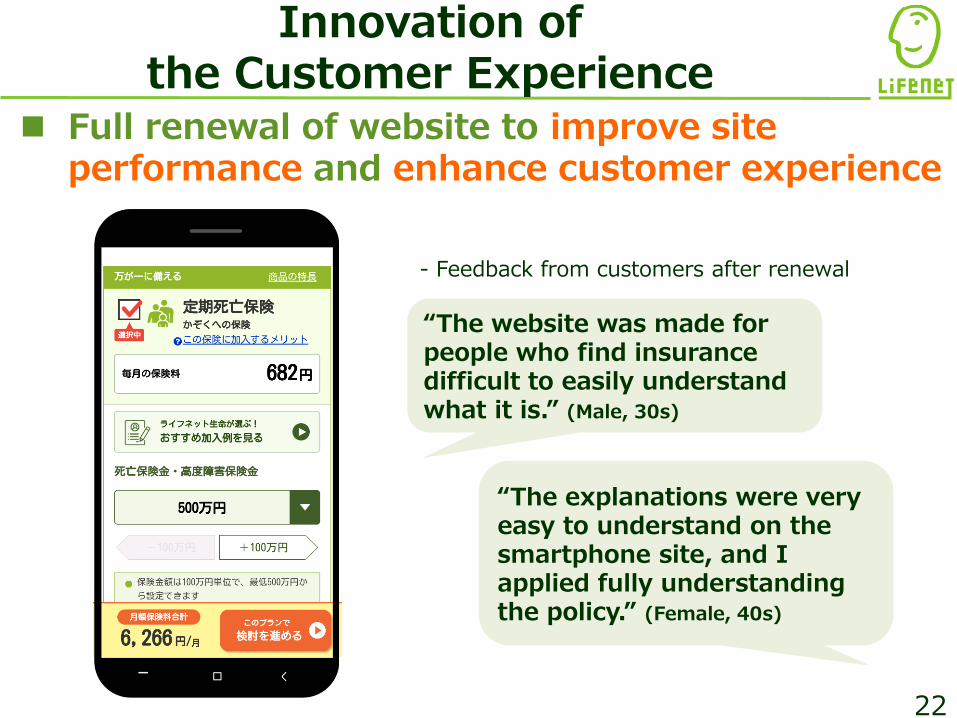
Innovation of the Customer Experience
Full renewal of website to improve site performance and enhance customer experience
- Feedback from customers after renewal
“The website was made for people who find insurance difficult to easily understand what it is.” (Male, 30s)
“The explanations were very easy to understand on the smartphone site, and I applied fully understanding the policy.” (Female, 40s)
22
1. Financial Results for Fiscal 2018
2. New Management Policy and Future Endeavors
Table of Contents
23
0
2,000
4,000
6,000
8,000
10,000
12,000
14,000
16,000
18,000
20,000
0
50,000
100,000
150,000
200,000
250,000
300,000
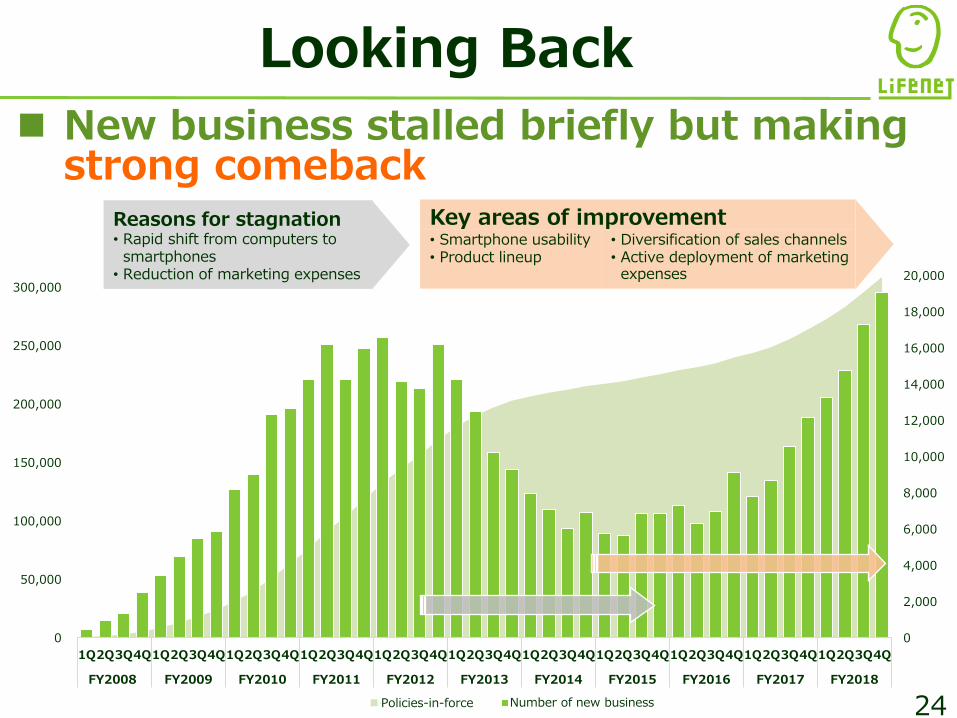
1Q2Q3Q4Q1Q2Q3Q4Q1Q2Q3Q4Q1Q2Q3Q4Q1Q2Q3Q4Q1Q2Q3Q4Q1Q2Q3Q4Q1Q2Q3Q4Q1Q2Q3Q4Q1Q2Q3Q4Q1Q2Q3Q4Q
FY2008 FY2009 FY2010 FY2011 FY2012 FY2013 FY2014 FY2015 FY2016 FY2017 FY2018
保有契約件数 新契約件数 24
Reasons for stagnation • Rapid shift from computers to smartphones
• Reduction of marketing expenses
Looking Back
New business stalled briefly but making strong comeback
Key areas of improvement• Smartphone usability• Product lineup
• Diversification of sales channels• Active deployment of marketing expenses
Number of new businessPolicies-in-force
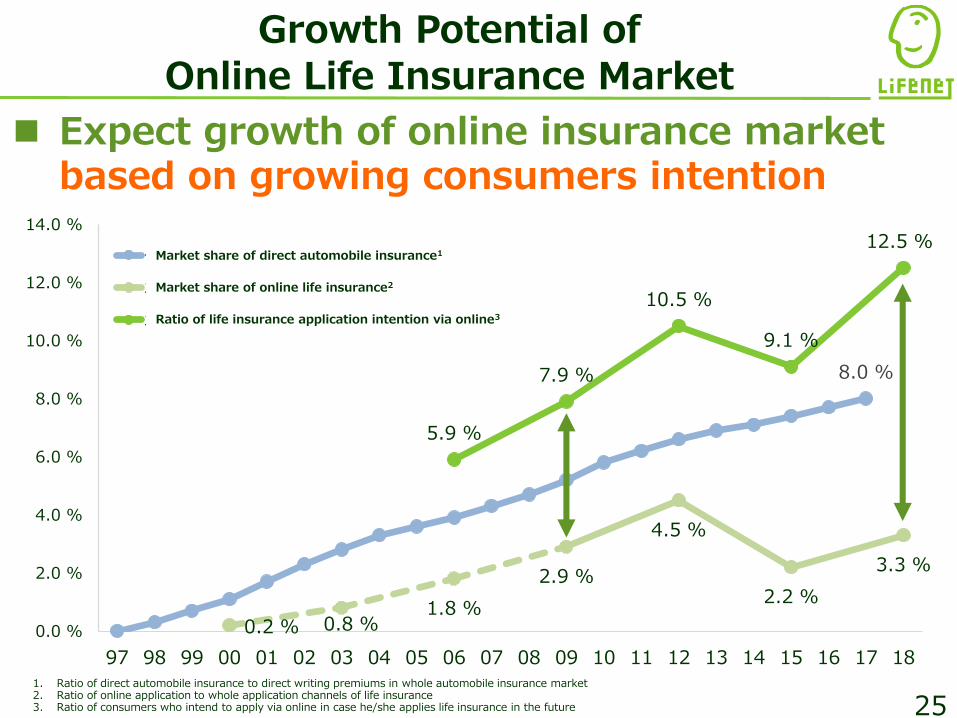
8.0 %
0.2 % 0.8 %1.8 %
2.9 %
4.5 %
2.2 %
3.3 %
5.9 %
7.9 %
10.5 %
9.1 %
12.5 %
0.0 %
2.0 %
4.0 %
6.0 %
8.0 %
10.0 %
12.0 %
14.0 %
97 98 99 00 01 02 03 04 05 06 07 08 09 10 11 12 13 14 15 16 17 18
ダイレクト自動車保険シェア
オンライン生命保険シェア(加入)
オンライン生命保険シェア(加入意向)
Growth Potential of Online Life Insurance Market
Expect growth of online insurance market based on growing consumers intention
1. Ratio of direct automobile insurance to direct writing premiums in whole automobile insurance market2. Ratio of online application to whole application channels of life insurance3. Ratio of consumers who intend to apply via online in case he/she applies life insurance in the future
Market share of direct automobile insurance1
Market share of online life insurance2
Ratio of life insurance application intention via online3
25
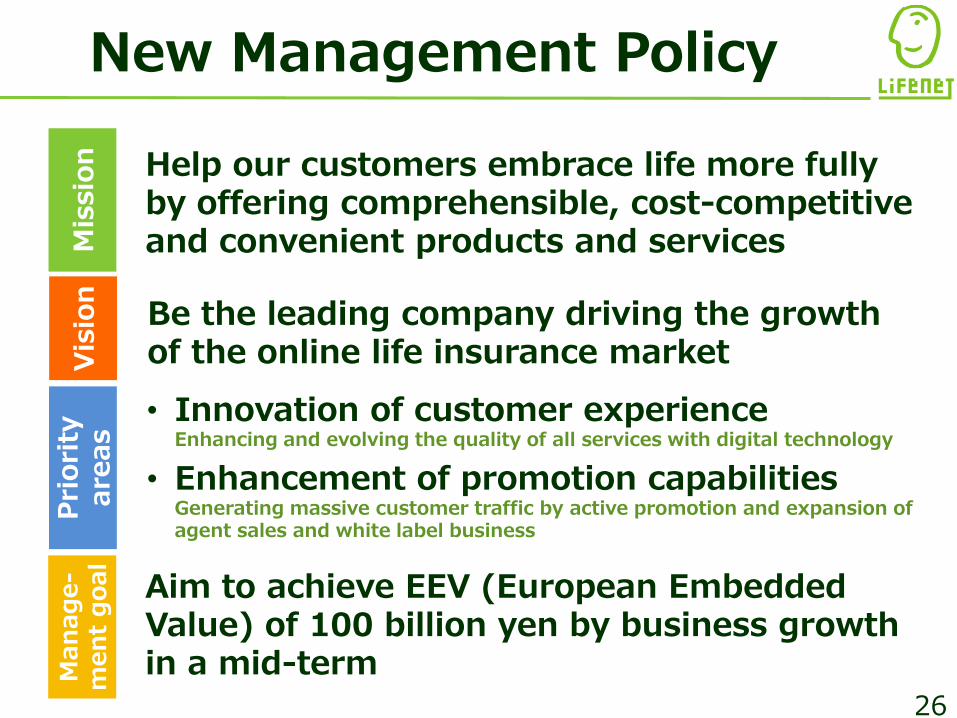
New Management Policy
Help our customers embrace life more fully by offering comprehensible, cost-competitive and convenient products and services
Be the leading company driving the growth of the online life insurance market
Mis
sio
nV
isio
nP
riori
ty
are
as
• Innovation of customer experienceEnhancing and evolving the quality of all services with digital technology
• Enhancement of promotion capabilitiesGenerating massive customer traffic by active promotion and expansion of agent sales and white label business
Aim to achieve EEV (European Embedded Value) of 100 billion yen by business growth in a mid-termM
an
ag
e-
men
t g
oal
26
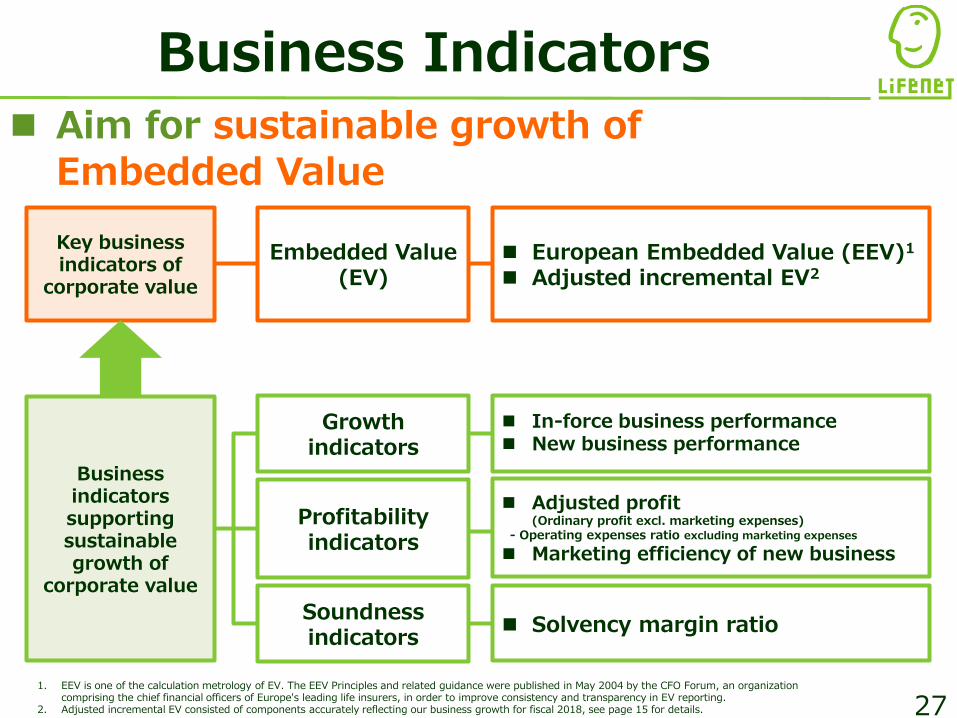
Business Indicators
Key business indicators of
corporate value
Business indicators supporting sustainable growth of
corporate value
European Embedded Value (EEV)1
Adjusted incremental EV2
Solvency margin ratio
Embedded Value (EV)
Growth indicators
Profitability indicators
Soundness indicators
In-force business performance New business performance
Adjusted profit (Ordinary profit excl. marketing expenses)
- Operating expenses ratio excluding marketing expenses
Marketing efficiency of new business
Aim for sustainable growth of Embedded Value
1. EEV is one of the calculation metrology of EV. The EEV Principles and related guidance were published in May 2004 by the CFO Forum, an organization comprising the chief financial officers of Europe's leading life insurers, in order to improve consistency and transparency in EV reporting.
2. Adjusted incremental EV consisted of components accurately reflecting our business growth for fiscal 2018, see page 15 for details. 27
Initiatives for EEV Growth
28
Further growth of new business
Improvement of operating expenses efficiency
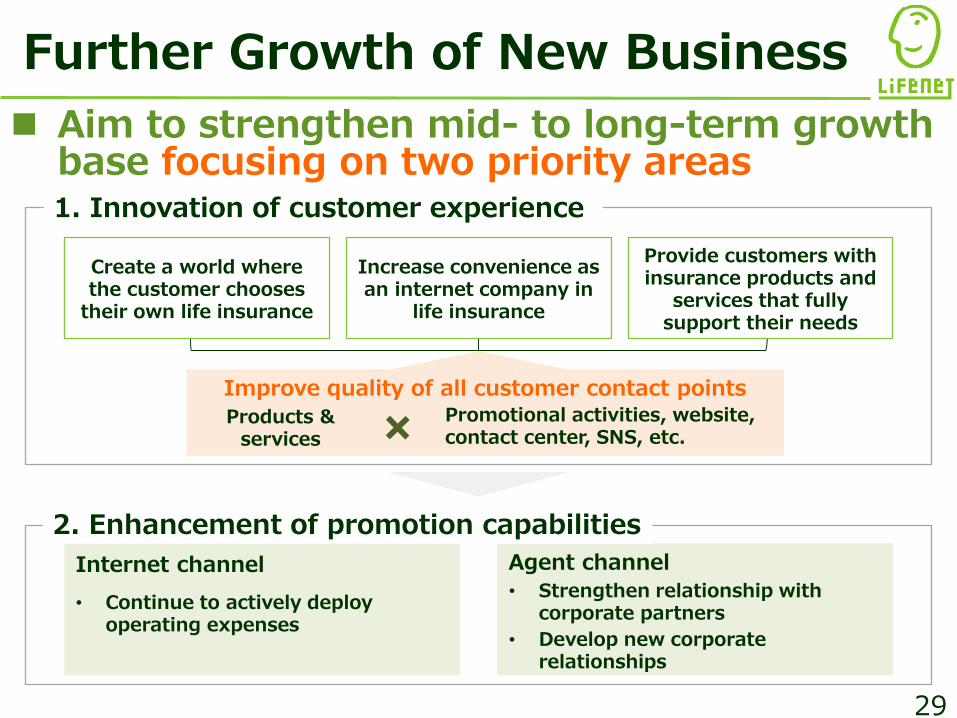
Improve quality of all customer contact points
Further Growth of New Business
Agent channel
1. Innovation of customer experience
2. Enhancement of promotion capabilities
Create a world where the customer chooses
their own life insurance
Increase convenience as an internet company in
life insurance
Products & services
Provide customers with insurance products and
services that fully support their needs
Aim to strengthen mid- to long-term growth base focusing on two priority areas
Promotional activities, website, contact center, SNS, etc.
• Continue to actively deploy operating expenses
Internet channel• Strengthen relationship with
corporate partners
• Develop new corporate relationships
29
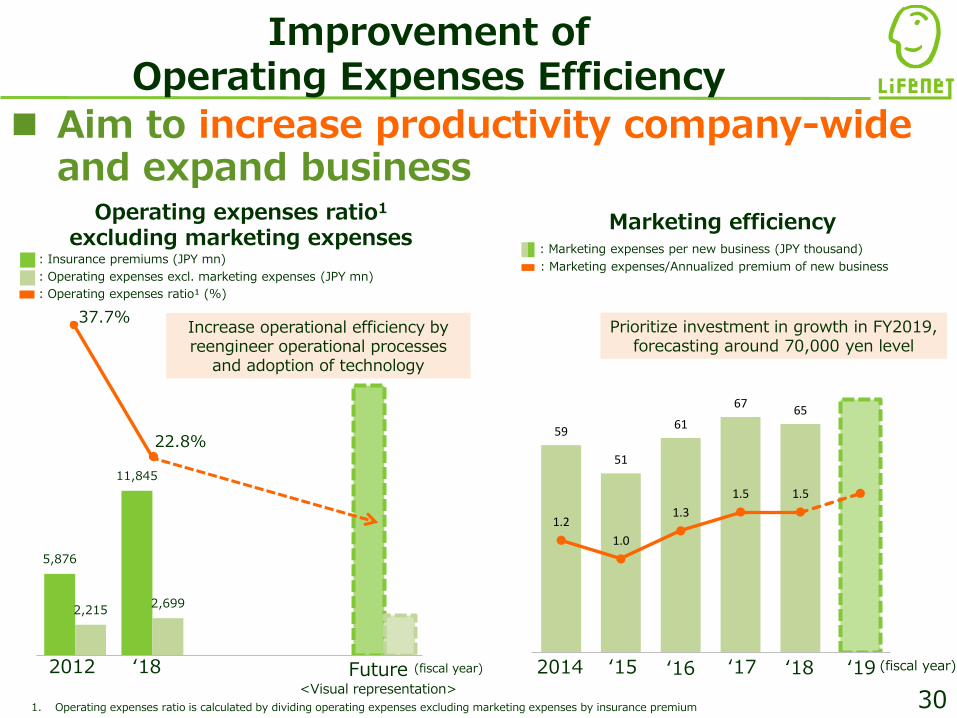
5,876
11,845
2,215 2,699
37.7%
22.8%
30
Future<Visual representation>
Aim to increase productivity company-wide and expand business
1. Operating expenses ratio is calculated by dividing operating expenses excluding marketing expenses by insurance premium
(fiscal year)
Improvement of Operating Expenses Efficiency
2012
Operating expenses ratio1
excluding marketing expensesMarketing efficiency
‘152014 ‘16 ‘17 ‘18
Prioritize investment in growth in FY2019, forecasting around 70,000 yen level
‘18 ‘19
Increase operational efficiency by reengineer operational processes
and adoption of technology
: Insurance premiums (JPY mn)
: Operating expenses excl. marketing expenses (JPY mn)
: Operating expenses ratio¹ (%)
: Marketing expenses per new business (JPY thousand)
: Marketing expenses/Annualized premium of new business
(fiscal year)
59
51
61
67 65
1.2
1.0
1.3
1.5 1.5
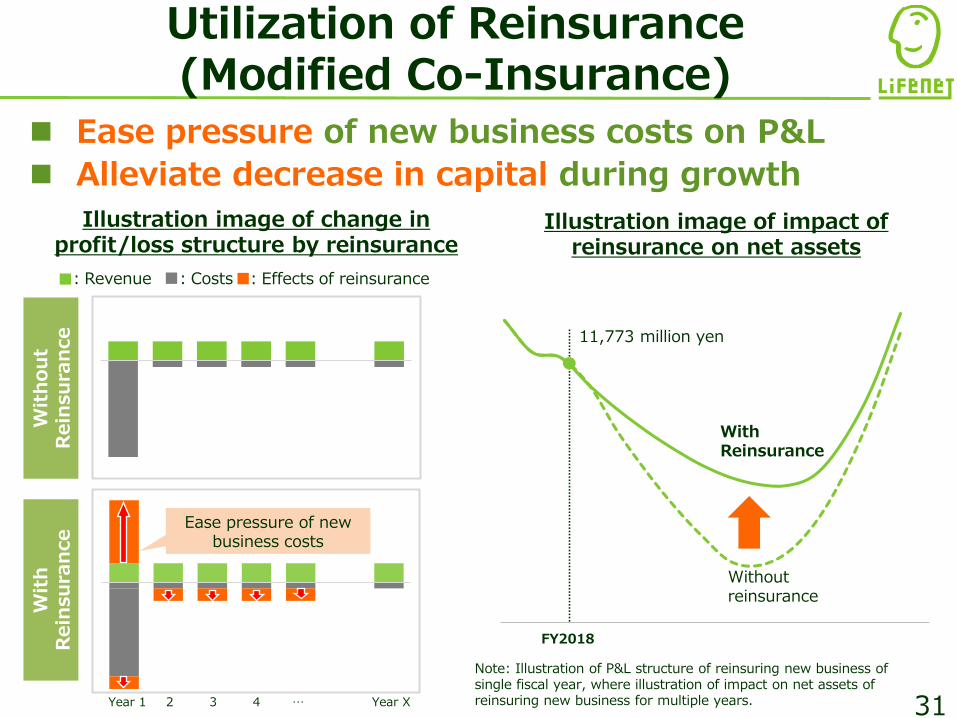
FY2018
Illustration image of change in profit/loss structure by reinsurance
:Effects of reinsurance
31
Illustration image of impact of reinsurance on net assets
Note: Illustration of P&L structure of reinsuring new business of single fiscal year, where illustration of impact on net assets of reinsuring new business for multiple years.Year 1 2 3 4 … Year X
With Reinsurance
Without reinsurance
11,773 million yen
Ease pressure of new business costs
:Costs:Revenue
Ease pressure of new business costs on P&L
Alleviate decrease in capital during growth
Wit
h
Rein
su
ran
ce
Wit
hou
t
Rein
su
ran
ce
Utilization of Reinsurance(Modified Co-Insurance)
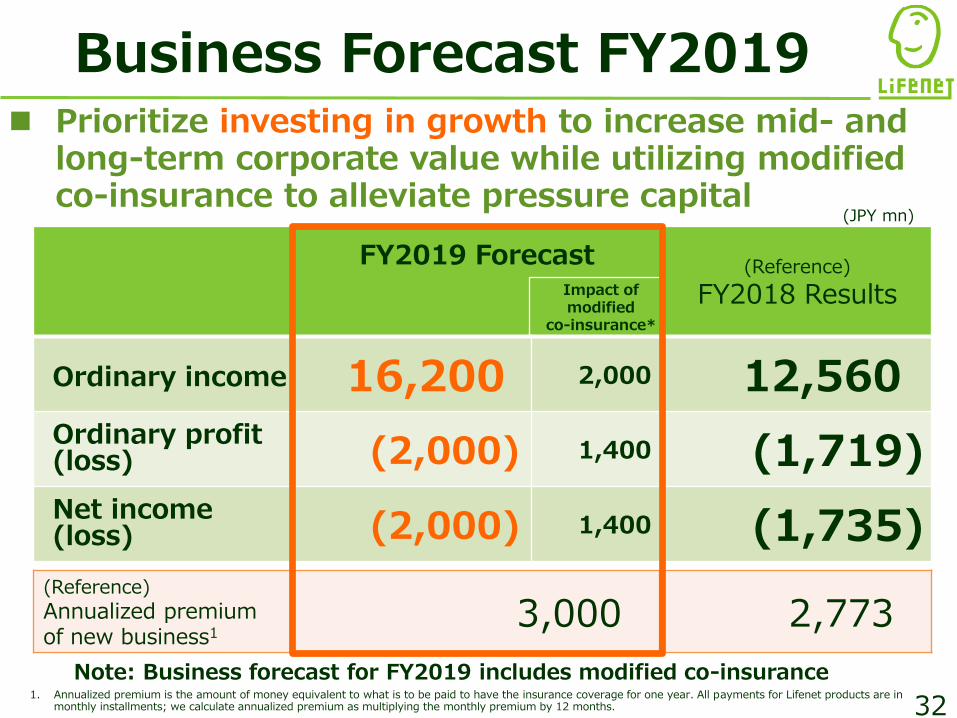
FY2019 Forecast (Reference)
FY2018 Results
Ordinary income 16,200 2,000 12,560Ordinary profit (loss) (2,000) 1,400 (1,719)Net income (loss) (2,000) 1,400 (1,735)
(JPY mn)
1. Annualized premium is the amount of money equivalent to what is to be paid to have the insurance coverage for one year. All payments for Lifenet products are in monthly installments; we calculate annualized premium as multiplying the monthly premium by 12 months. 32
(Reference)
Annualized premium of new business1
3,000 2,773
Business Forecast FY2019 Prioritize investing in growth to increase mid- and
long-term corporate value while utilizing modified co-insurance to alleviate pressure capital
Impact of modified
co-insurance*
Note: Business forecast for FY2019 includes modified co-insurance
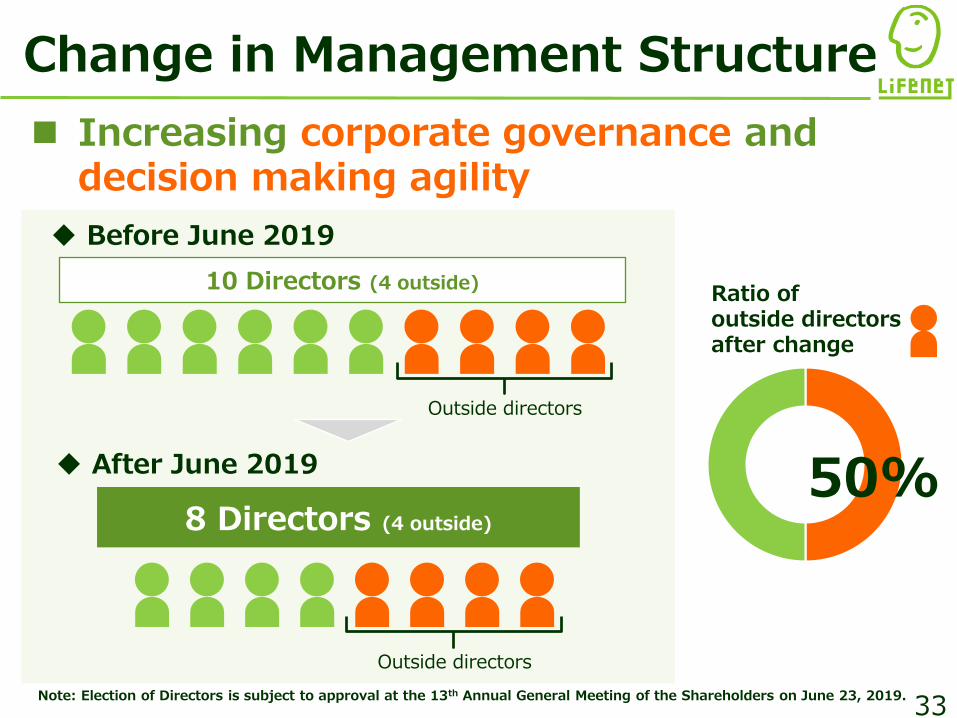
Change in Management Structure
Increasing corporate governance anddecision making agility
8 Directors (4 outside)
10 Directors (4 outside)
50%
Ratio of outside directors after change
Outside directors
Before June 2019
After June 2019
Outside directors
33Note: Election of Directors is subject to approval at the 13th Annual General Meeting of the Shareholders on June 23, 2019.
Base salary(Fixed)
Base salary (Fixed)
34
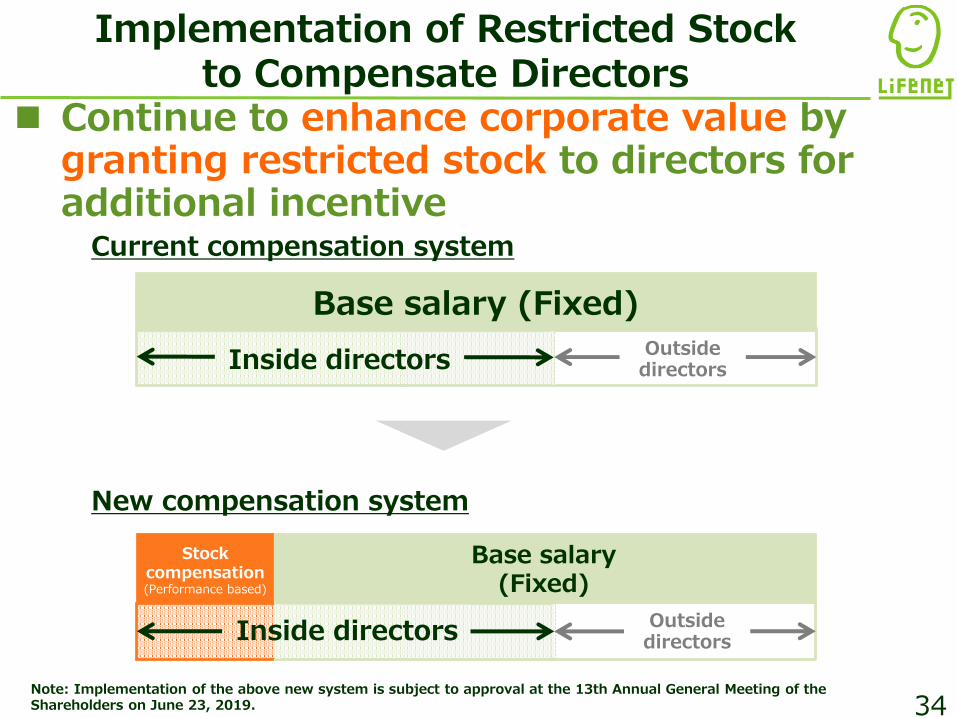
Implementation of Restricted Stock to Compensate Directors
Continue to enhance corporate value by granting restricted stock to directors for additional incentive
Current compensation system
Inside directorsOutside directors
Outside directors
New compensation system
Stock compensation(Performance based)
Inside directors
Note: Implementation of the above new system is subject to approval at the 13th Annual General Meeting of the Shareholders on June 23, 2019.
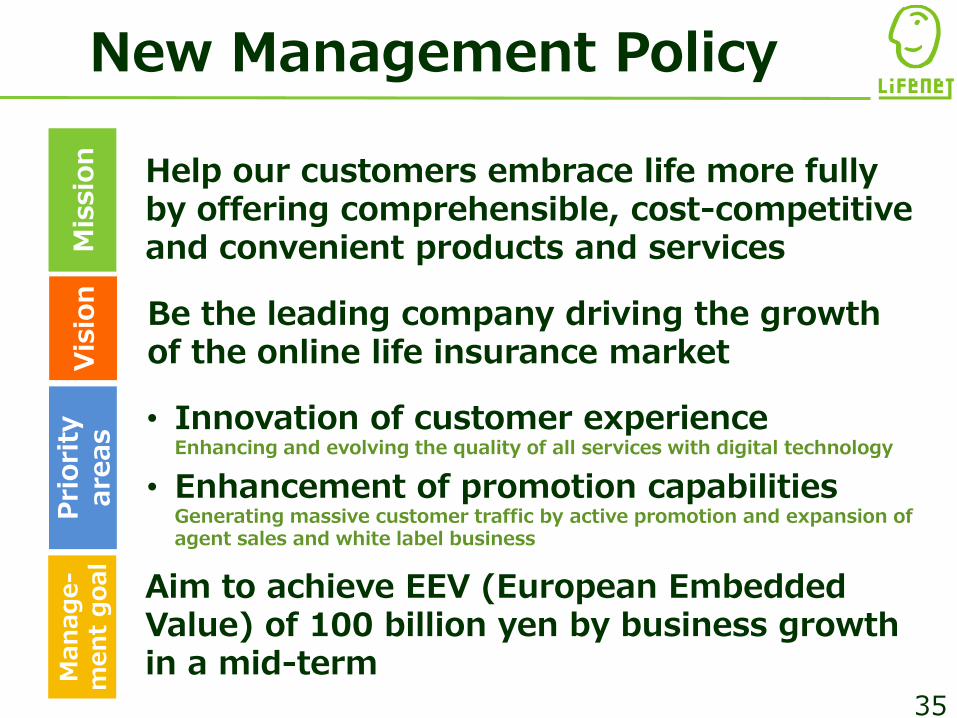
New Management Policy
Help our customers embrace life more fully by offering comprehensible, cost-competitive and convenient products and services
Be the leading company driving the growth of the online life insurance market
Mis
sio
nV
isio
nP
riori
ty
are
as
• Innovation of customer experienceEnhancing and evolving the quality of all services with digital technology
• Enhancement of promotion capabilitiesGenerating massive customer traffic by active promotion and expansion of agent sales and white label business
Aim to achieve EEV (European Embedded Value) of 100 billion yen by business growth in a mid-termM
an
ag
e-
men
t g
oal
35
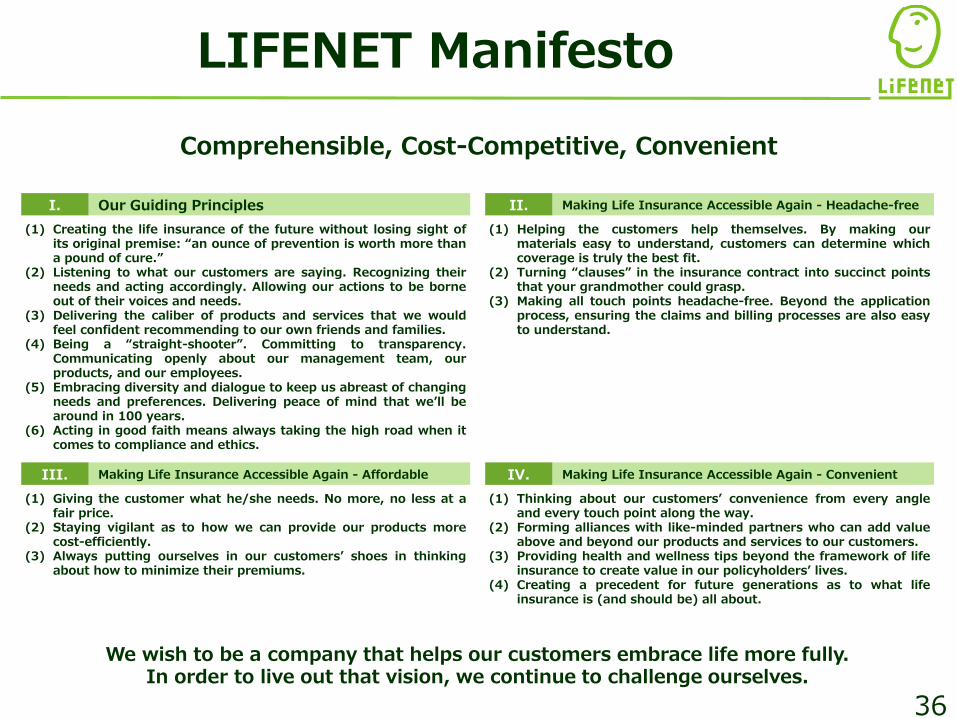
LIFENET Manifesto
We wish to be a company that helps our customers embrace life more fully.In order to live out that vision, we continue to challenge ourselves.
(1) Creating the life insurance of the future without losing sight ofits original premise: “an ounce of prevention is worth more thana pound of cure.”
(2) Listening to what our customers are saying. Recognizing theirneeds and acting accordingly. Allowing our actions to be borneout of their voices and needs.
(3) Delivering the caliber of products and services that we wouldfeel confident recommending to our own friends and families.
(4) Being a “straight-shooter”. Committing to transparency.Communicating openly about our management team, ourproducts, and our employees.
(5) Embracing diversity and dialogue to keep us abreast of changingneeds and preferences. Delivering peace of mind that we’ll bearound in 100 years.
(6) Acting in good faith means always taking the high road when itcomes to compliance and ethics.
(1) Helping the customers help themselves. By making ourmaterials easy to understand, customers can determine whichcoverage is truly the best fit.
(2) Turning “clauses” in the insurance contract into succinct pointsthat your grandmother could grasp.
(3) Making all touch points headache-free. Beyond the applicationprocess, ensuring the claims and billing processes are also easyto understand.
(1) Giving the customer what he/she needs. No more, no less at afair price.
(2) Staying vigilant as to how we can provide our products morecost-efficiently.
(3) Always putting ourselves in our customers’ shoes in thinkingabout how to minimize their premiums.
(1) Thinking about our customers’ convenience from every angleand every touch point along the way.
(2) Forming alliances with like-minded partners who can add valueabove and beyond our products and services to our customers.
(3) Providing health and wellness tips beyond the framework of lifeinsurance to create value in our policyholders’ lives.
(4) Creating a precedent for future generations as to what lifeinsurance is (and should be) all about.
Our Guiding PrinciplesI. Making Life Insurance Accessible Again - Headache-freeII.
Making Life Insurance Accessible Again - AffordableIII. Making Life Insurance Accessible Again - ConvenientIV.
Comprehensible, Cost-Competitive, Convenient
36
Subscribe to our "IR email service" to receive news releases and website updates via email.
All information on this document that is not
historical fact constitutes forward-looking
information and is based on assumptions and
forecasts available to the company at the time of
preparation. The company cannot guarantee the
accuracy of these assumptions and forecasts.
Earnings projections and other information on this
may differ materially from actual performance due
to various risks and uncertainties.
This is a translation of the original Japanese
document, prepared and provided solely for
readers' convenience. In case of any discrepancy or
dispute, the Japanese document prevails.
https://ir.lifenet-seimei.co.jp/en/
Appendix
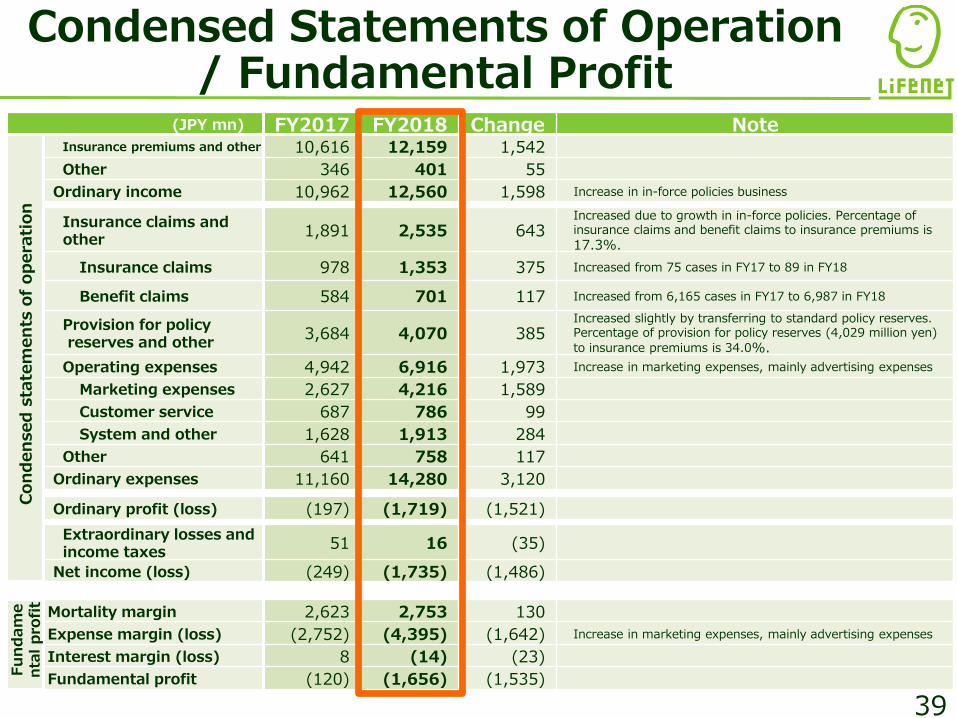
(JPY mn) FY2017 FY2018 Change Note
Con
den
sed
sta
tem
en
ts o
f op
era
tion
Insurance premiums and other 10,616 12,159 1,542
Other 346 401 55
Ordinary income 10,962 12,560 1,598 Increase in in-force policies business
Insurance claims andother
1,891 2,535 643Increased due to growth in in-force policies. Percentage of insurance claims and benefit claims to insurance premiums is
17.3%.
Insurance claims 978 1,353 375 Increased from 75 cases in FY17 to 89 in FY18
Benefit claims 584 701 117 Increased from 6,165 cases in FY17 to 6,987 in FY18
Provision for policy reserves and other
3,684 4,070 385Increased slightly by transferring to standard policy reserves. Percentage of provision for policy reserves (4,029 million yen)
to insurance premiums is 34.0%.
Operating expenses 4,942 6,916 1,973 Increase in marketing expenses, mainly advertising expenses
Marketing expenses 2,627 4,216 1,589
Customer service 687 786 99
System and other 1,628 1,913 284
Other 641 758 117
Ordinary expenses 11,160 14,280 3,120
Ordinary profit (loss) (197) (1,719) (1,521)
Extraordinary losses andincome taxes
51 16 (35)
Net income (loss) (249) (1,735) (1,486)
Fu
nd
am
en
talp
rofi
t
Mortality margin 2,623 2,753 130
Expense margin (loss) (2,752) (4,395) (1,642) Increase in marketing expenses, mainly advertising expenses
Interest margin (loss) 8 (14) (23)
Fundamental profit (120) (1,656) (1,535)
Condensed Statements of Operation/ Fundamental Profit
39
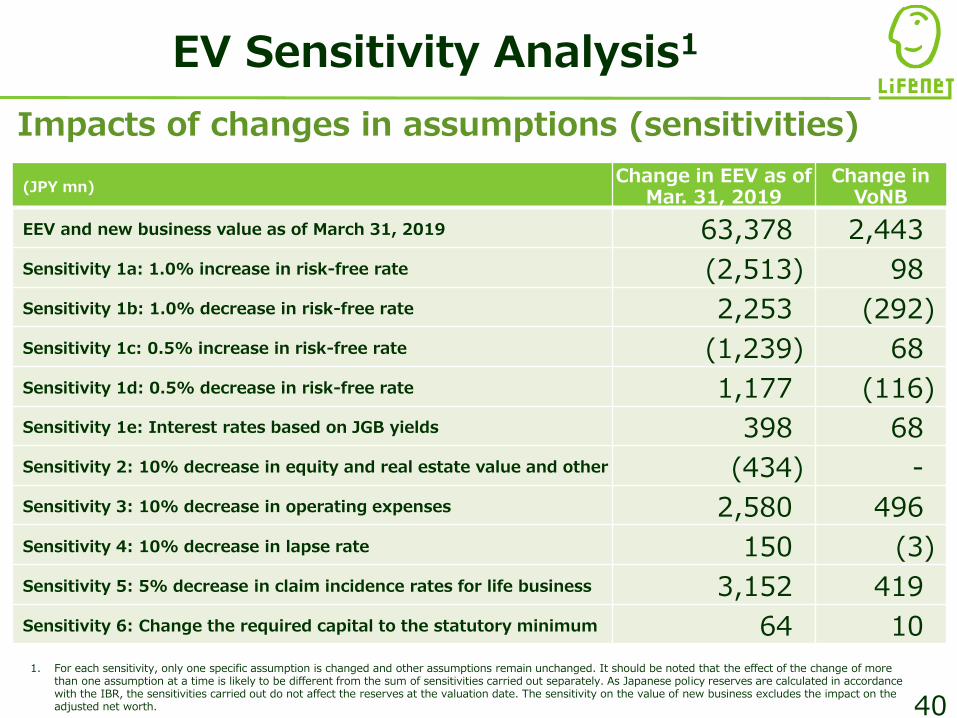
EV Sensitivity Analysis1
(JPY mn)Change in EEV as of
Mar. 31, 2019Change in
VoNB
EEV and new business value as of March 31, 2019 63,378 2,443
Sensitivity 1a: 1.0% increase in risk-free rate (2,513) 98
Sensitivity 1b: 1.0% decrease in risk-free rate 2,253 (292)
Sensitivity 1c: 0.5% increase in risk-free rate (1,239) 68
Sensitivity 1d: 0.5% decrease in risk-free rate 1,177 (116)
Sensitivity 1e: Interest rates based on JGB yields 398 68
Sensitivity 2: 10% decrease in equity and real estate value and other (434) -
Sensitivity 3: 10% decrease in operating expenses 2,580 496
Sensitivity 4: 10% decrease in lapse rate 150 (3)
Sensitivity 5: 5% decrease in claim incidence rates for life business 3,152 419
Sensitivity 6: Change the required capital to the statutory minimum 64 10
1. For each sensitivity, only one specific assumption is changed and other assumptions remain unchanged. It should be noted that the effect of the change of more than one assumption at a time is likely to be different from the sum of sensitivities carried out separately. As Japanese policy reserves are calculated in accordance with the IBR, the sensitivities carried out do not affect the reserves at the valuation date. The sensitivity on the value of new business excludes the impact on the adjusted net worth.
Impacts of changes in assumptions (sensitivities)
40
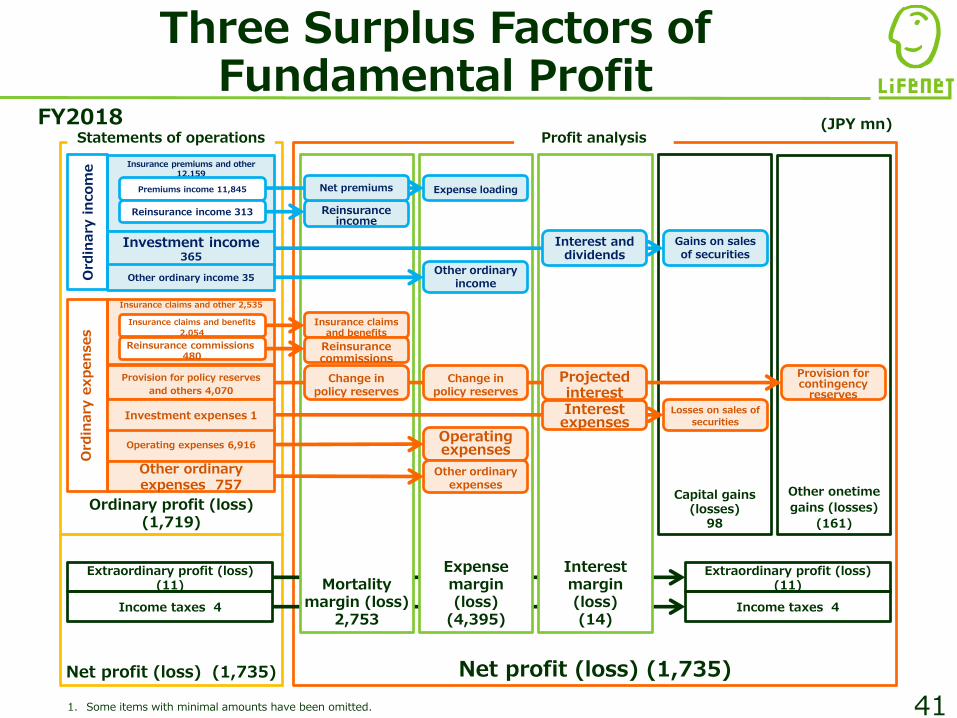
Three Surplus Factors of Fundamental Profit
1. Some items with minimal amounts have been omitted.
Net profit (loss) (1,735)Net profit (loss) (1,735)
Ordinary profit (loss) (1,719)
Mortality margin (loss)
2,753
Insurance claims and benefits
Interest margin (loss) (14)
Expense margin (loss)
(4,395)
Expense loading
Other ordinary income
Operating expenses
Other ordinary expenses
Capital gains (losses)
98
Provision for contingency
reserves
Other onetime
gains (losses)
(161)
Insurance premiums and other 12,159
Investment income 365
Other ordinary income 35Ord
inary
in
com
e
Interest and dividends
Change in policy reserves
Projected interest
Change in policy reserves
Insurance claims and other 2,535
Provision for policy reserves
and others 4,070
Operating expenses 6,916
Other ordinary expenses 757
Ord
inary
exp
en
ses
Investment expenses 1
Income taxes 4
Extraordinary profit (loss) (11)
Income taxes 4
Extraordinary profit (loss) (11)
Premiums income 11,845
Reinsurance income 313 Reinsurance income
Statements of operations
Insurance claims and benefits
2,054
Reinsurance commissions 480
Reinsurance commissions
Net premiums
Profit analysis
Gains on sales of securities
Losses on sales of
securities
(JPY mn)
Interest expenses
FY2018
41
42
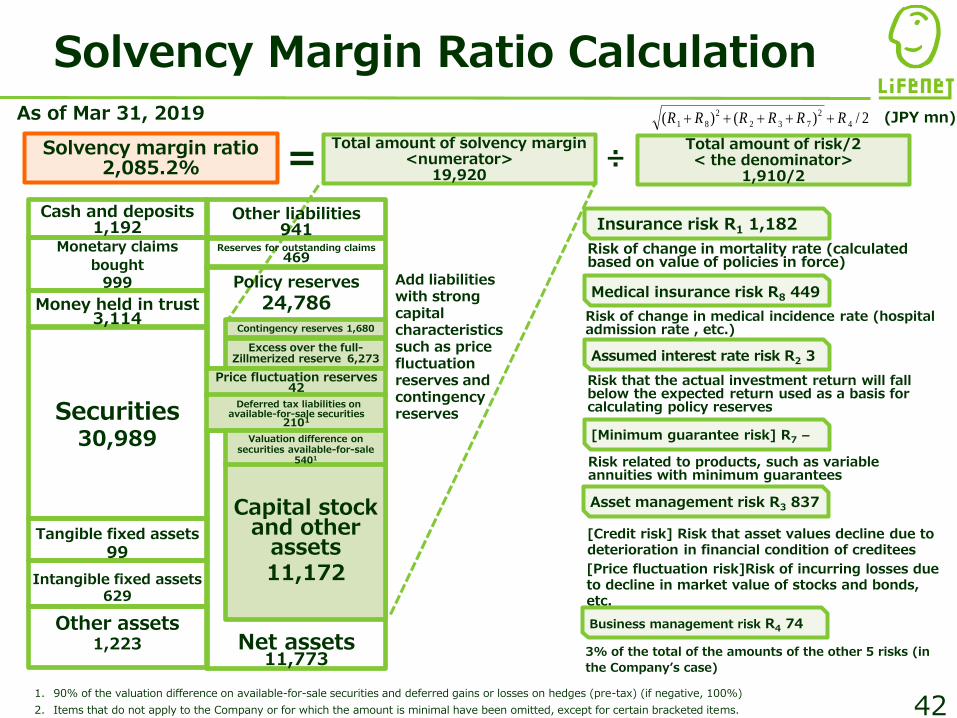
Solvency Margin Ratio Calculation
Total amount of solvency margin<numerator>
19,920
Solvency margin ratio2,085.2%
Insurance risk R1 1,182
Medical insurance risk R8 449
Assumed interest rate risk R2 3
Asset management risk R3 837
[Minimum guarantee risk] R7 -
Business management risk R4 74
Total amount of risk/2< the denominator>
1,910/2
2/)()( 4
2
732
2
81 RRRRRR
Risk of change in mortality rate (calculated based on value of policies in force)
Risk of change in medical incidence rate (hospital admission rate , etc.)
Risk that the actual investment return will fall below the expected return used as a basis for calculating policy reserves
Risk related to products, such as variable annuities with minimum guarantees
[Credit risk] Risk that asset values decline due to deterioration in financial condition of creditees
[Price fluctuation risk]Risk of incurring losses due to decline in market value of stocks and bonds, etc.
3% of the total of the amounts of the other 5 risks (in
the Company’s case)
= ÷
1. 90% of the valuation difference on available-for-sale securities and deferred gains or losses on hedges (pre-tax) (if negative, 100%)
2. Items that do not apply to the Company or for which the amount is minimal have been omitted, except for certain bracketed items.
Add liabilities with strong capital characteristics such as price fluctuation reserves and contingency reserves
As of Mar 31, 2019
Net assets11,773
Policy reserves
24,786
Tangible fixed assets
99
Monetary claims
bought
999
Cash and deposits1,192
Securities30,989
Intangible fixed assets 629
Other assets1,223
Other liabilities941
Excess over the full-Zillmerized reserve 6,273
Capital stock and other
assets11,172
Price fluctuation reserves 42
Deferred tax liabilities on available-for-sale securities
2101
Contingency reserves 1,680
Money held in trust 3,114
Valuation difference on securities available-for-sale
5401
Reserves for outstanding claims 469
(JPY mn)