
Presentation in Lednice 1st July 2004 - CORE
35
DARCOF Presentation in Presentation in Lednice Lednice 1 1 st st July 2004 July 2004 Impact of Organic farming on aquatic environment Impact of Organic farming on aquatic environment By By Erik Steen Erik Steen Kristensen Kristensen and Marie and Marie Trydeman Trydeman Knudsen Knudsen Danish Research Centre for Organic Farming Danish Research Centre for Organic Farming ( ( www.DARCOF.dk www.DARCOF.dk ) )
Transcript of Presentation in Lednice 1st July 2004 - CORE

D A R C O F
Presentation in Presentation in LedniceLednice 11stst July 2004July 2004
Impact of Organic farming on aquatic environment Impact of Organic farming on aquatic environment
ByBy
Erik Steen Erik Steen KristensenKristensen and Marie and Marie TrydemanTrydeman KnudsenKnudsenDanish Research Centre for Organic Farming Danish Research Centre for Organic Farming
((www.DARCOF.dkwww.DARCOF.dk))

DARCOF (Danish Research Centre for Organic
Farming)

D A R C O F
Presentation of DARCOF
• Established in 1996 by the government
• Initiate and coordinate R & D in organic agriculture
• Communicate the results and contribute to further education
• “Centre without walls”: 20 Institutes, 140 Scientists
• 30-50 research projects, 40-60 mill Dkr (5-8 mill €) per year

D A R C O F
Outline
1. Problems in European aquatic environment
2. Development in organic farming
3. Effect of conversion to organic mixed/dairy farming
4. Effect of conversion to organic arable farming
5. Conclusion
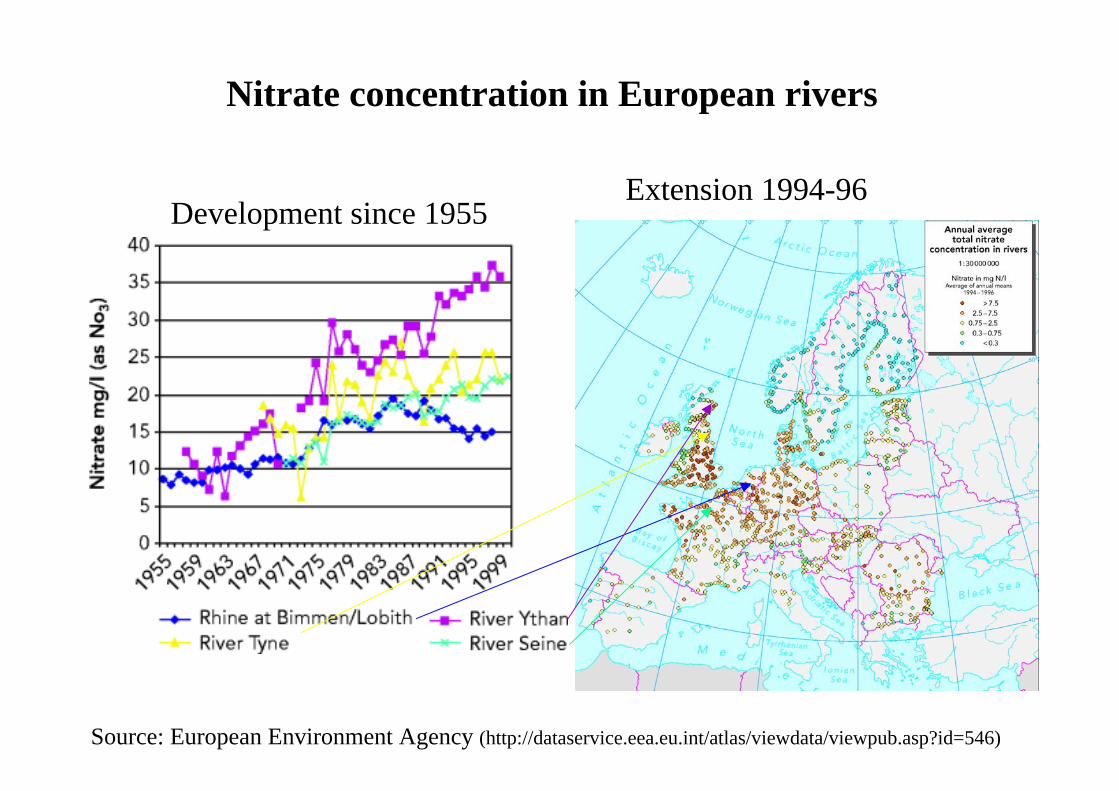
Nitrate concentration in European rivers
Source: European Environment Agency (http://dataservice.eea.eu.int/atlas/viewdata/viewpub.asp?id=546)
Development since 1955Extension 1994-96
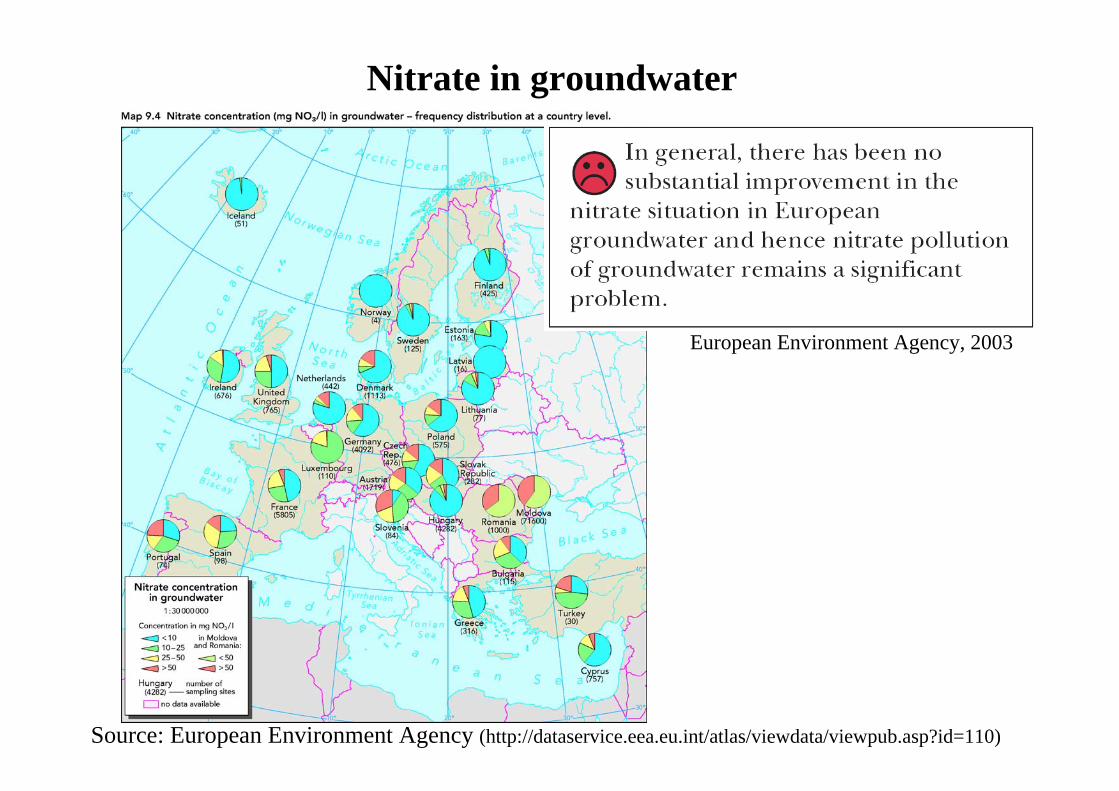
Nitrate in groundwater
Source: European Environment Agency (http://dataservice.eea.eu.int/atlas/viewdata/viewpub.asp?id=110)
European Environment Agency, 2003

Nitrate Vulnerable Zones
Source: European Environment Agency (http://dataservice.eea.eu.int/atlas/viewdata/viewpub.asp?id=150)
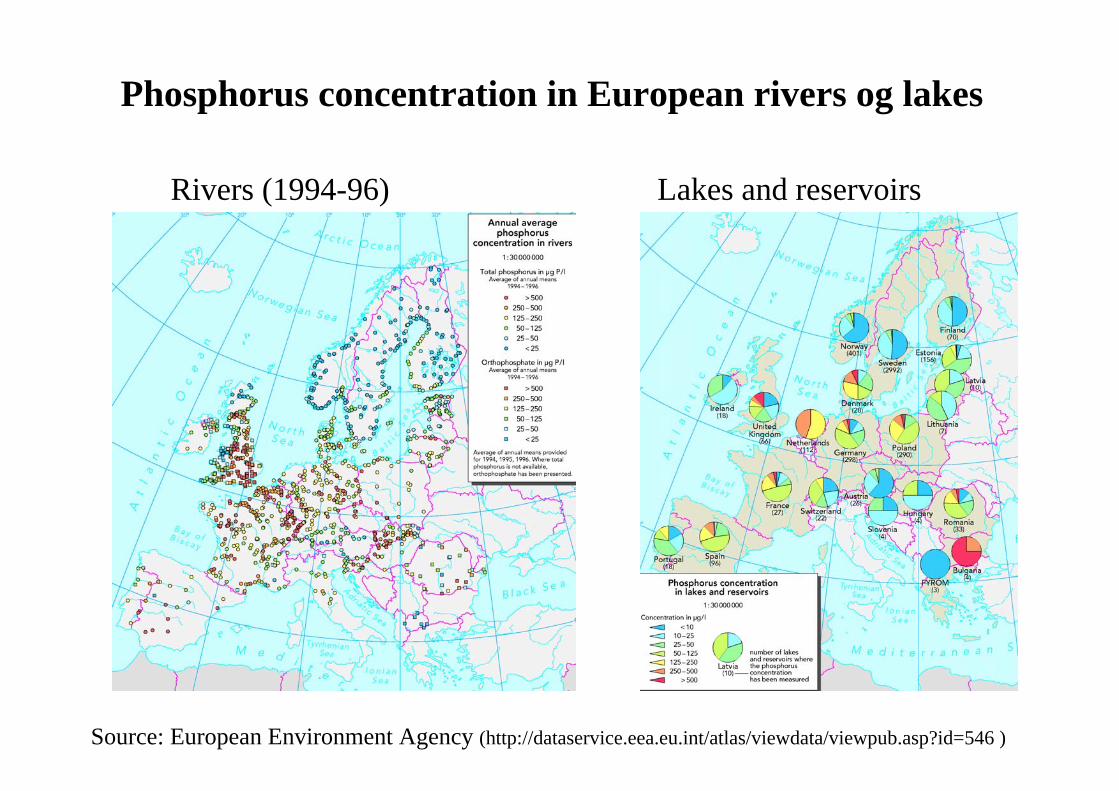
Phosphorus concentration in European rivers og lakes
Source: European Environment Agency (http://dataservice.eea.eu.int/atlas/viewdata/viewpub.asp?id=546 )
Rivers (1994-96) Lakes and reservoirs

European Environment Agency, 2003
Indicators Assessments
Nitrate in groundwater
No decrease (or increase) in levels of nitrate in Europe’s groundwater.
Nitrate drinking water limit values exceeded in one third of the groundwater bodies.
Nitrate in drinking water a common problem across Europe.
Nutrients in rivers
Concentrations of phosphate have decreased in the rivers of the EU and accession countries during the 1990s.Nitrate concentrations in rivers stable throughout the 1990s - highest in western Europe where agriculture is most intensive.
Phosphorus in lakes
Eutrophication of European lakes is decreasing.
Still many lakes and reservoirs with high concentrations of phosphorus - highest in accession countries.
Nutrients in marine waters
Nutrient concentrations in Europe’s seas have generally remained stable over recent years.
Status of European waters

D A R C O F
Outline
1. Problems in European aquatic environment
2. Development in organic farming
3. Effect of conversion to organic mixed/dairy farming
4. Effect of conversion to organic arable farming
5. Conclusion

D A R C O F
Development of organic farming in EU-15 countries
http://www.organic.aber.ac.uk/stats.shtml

0
20000
40000
60000
80000
100000
120000
140000
160000
180000
1988
1990
1992
1994
1995
1996
1997
1998
1999
2000
2001
2002
Tota
l hec
tare
s
0
1000
2000
3000
4000
5000
6000
7000
8000
Num
ber
of fa
rms
Hectares Farms
Development of organic farming in Denmark
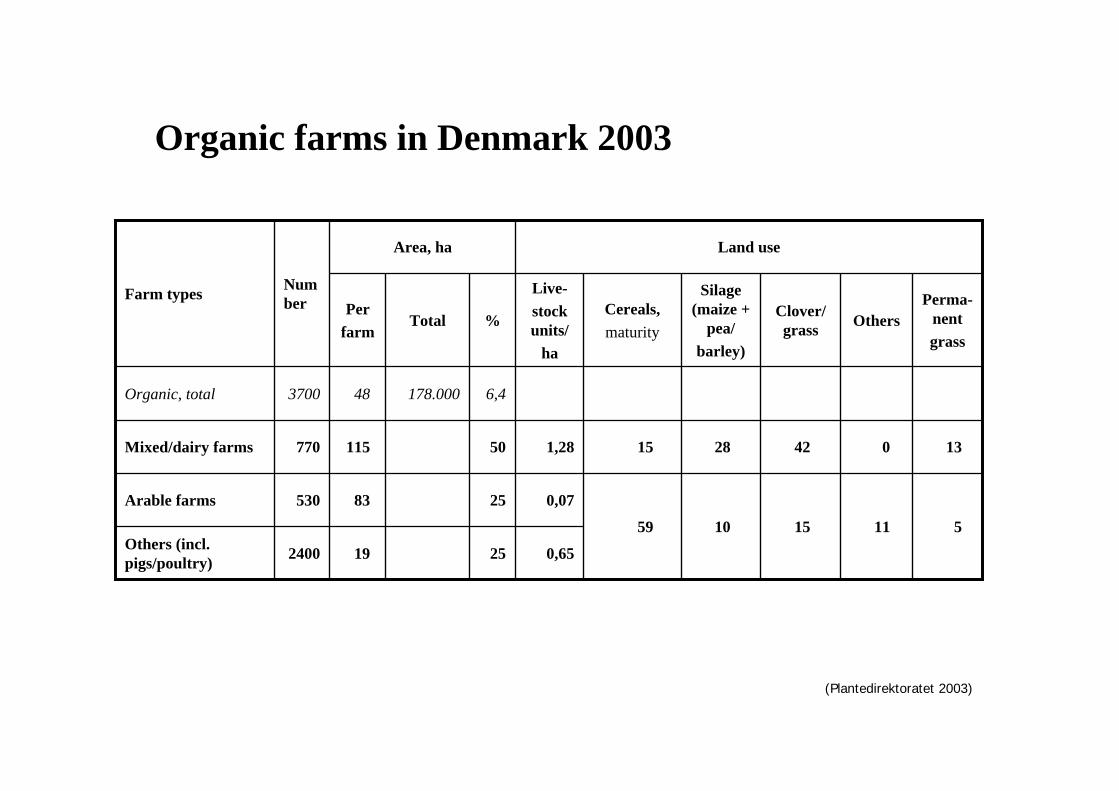
Organic farms in Denmark 2003
11
0
Others
15
42
Clover/ grass
0,6525192400Others (incl. pigs/poultry)
51059
0,072583530Arable farms
1328151,2850115770Mixed/dairy farms
6,4178.000483700Organic, total
Perma-nentgrass
Silage(maize +
pea/barley)
Cereals,maturity
Live-stockunits/
ha
%TotalPer
farm
Land useArea, ha
NumberFarm types
(Plantedirektoratet 2003)

D A R C O F
Outline
1. Problems in European aquatic environment
2. Development in organic farming
3. Effect of conversion to organic mixed/dairy farming
4. Effect of conversion to organic arable farming
5. Conclusion

Characteristics of Danish dairy farms
44594764Animal feed consumption, FU/DE
44005700Average yield, FE/ha
68557373Milk production per cow, Kg milk/cow
4151Cereal yield, hkg/ha,
1,281,46Stocking rate, DE/ha
10068Agricultural area, ha
12899Livestock units (DE)
81,961,3Number of cows per farm
OrganicConventional
Average
FØI-statistik, 1999Kristensen et al., 2003

N surplus on dairy farms (kg N ha-1 year-1)
FØI-statistik, 1999Kristensen et al., 2003
-100
-50
0
50
100
150
200
250
Farm type
kg N
per
ha
Rainfall
Imported fodder
Mineral fertilizer
Organic fertilizer
N2 fixation
Exported crops
Milk
Meat
Organic
Conventional
Input: 238
Output: - 39 Output: - 57
N surplus: 105
Input: 144
N surplus: 181
INPUT
OUTPUT

N surplus and N loss on dairy farms (kg N ha-1 year-1)
181
105
-119
-54
-36-26
-25-26
-119
-54
-26
-26
-36
-25
105
181
-200
-150
-100
-50
0
50
100
150
200
Farm type
kg N
per
ha
N surplus
Ammoniavolatilation
Denitrification
N leaching
Organic
Conventional
FØI-statistik, 1999Kristensen et al., 2003

N surplus on dairy farms(Kg N ha-1 year-1)
FØI-statistik, 1999Kristensen et al., 2003
Note: The numbers below the symbols shows the stocking rate (animal units per ha) of the study.
0
50
100
150
200
250
1988 1993 1998 2003
Years
N s
urpl
us (k
g N
per
ha)
OrganicConventional1.76
1.7 1.46
1.24 1.24
1.30
1.46
1.30

Nitrate leaching from grassland (Foulum) ofdifferent age, composition and management
Grass-clover Ryegrass
kg N
O3-
N h
a-1 y
r-1
0
25
50
75
100
125
kg N
O3-
N h
a-1 y
r-1
0
25
50
75
100
125
0 1 7 7 0 1 7 7
1 2 8 8 1 2 8 8
Production year
Production year
2000-20012001-2002
GrazedCut

P surplus of dairy farms(Kg P ha-1 year-1)
Studielandbrugene, 1997-2001Halberg et al., 2003
http://www.vmp3.dk/Files/Filer/Rap_fra_t_grupper/VMP_III_Final_med_bilag.pdf
-20
0
20
40
60
80
100
0 1 2 3 4 5 6
Dyretæthed, DE/ha
P-ov
ersk
ud b
edri
ft, k
g P/
ha
Konv. planteavl u. dyrKonv. planteavl m. sl.svinKonv. svin indeKonv. svin frilandKonv. kvægØko. kvægØko. svin friland

P surplus on dairy farms(Kg P ha-1 year-1)
Studielandbrugene, 1997-2001Halberg et al., 2003
http://www.vmp3.dk/Files/Filer/Rap_fra_t_grupper/VMP_III_Final_med_bilag.pdf
-15
-10
-5
0
5
10
15
20
25
30
Farm type
kg P
per
ha
Imported fodder
Mineral fertilizer
Organic fertilizer
Exported crops
Milk
Meat
Organic
ConventionalInput: 34
Output: 8
Output: - 17
P surplus: 8
Input: 16
P surplus: 17
OUTPUT
INPUT
D A R C O F
Outline
1. Problems in European aquatic environment
2. Development in organic farming
3. Effect of conversion to organic mixed/dairy farming
4. Effect of conversion to organic arable farming
5. Conclusion
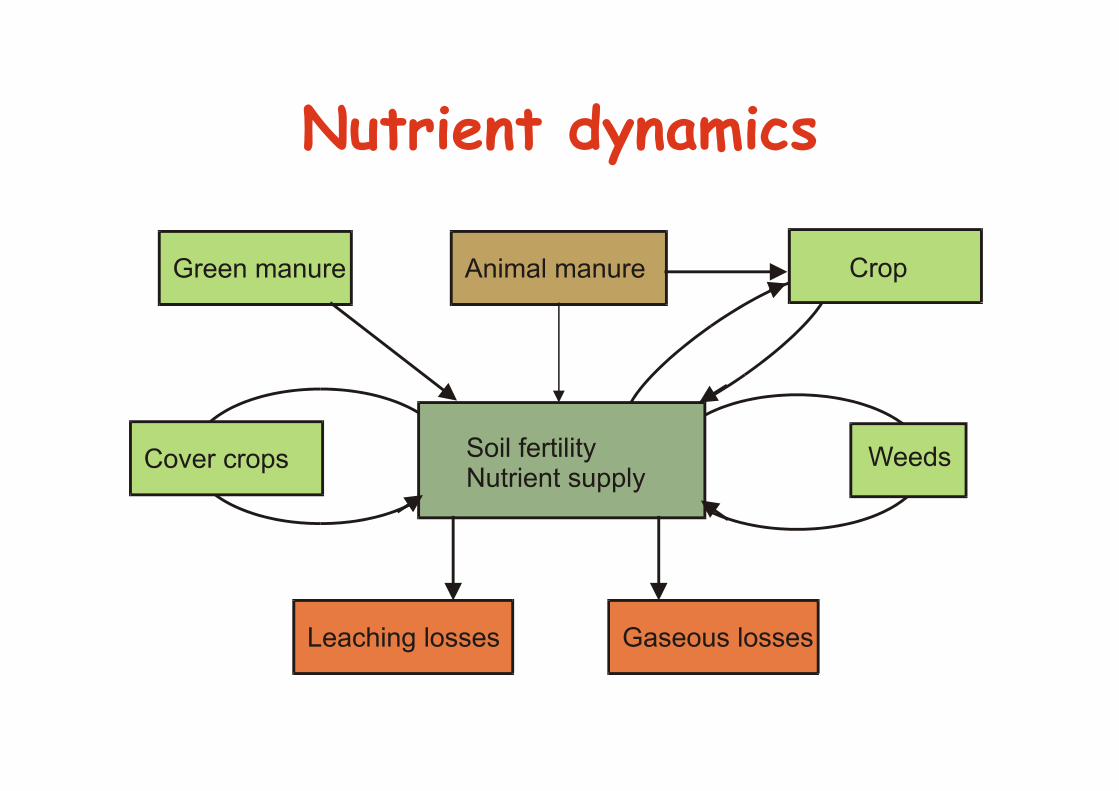
Nutrient dynamics

Crop rotation experimentRotation 1 Rotation 2 Sædskifte 4
S. barley:ley Grass-clover S. wheat* Lupin*
S. barley:ley Grass-clover W. wheat* Peas/barley*
S. oats* W. wheat* W. cereals* Peas/barley*
*: Cover crops are used
Experimental treatments:• Crop rotation (proportion of cereals)• +/- cover crop• +/- animal manure (40% af norm)

1997 1998 1999 2000 2001
kg/h
a (8
5% D
M)
0
2000
4000
6000
8000
JyndevadFoulumFlakkebjerg
Winter wheat ÷ manure
Grain yield in rotation 2

Foulum
0
5
10
15
20
25
30
35
FlakkebjergJyndevad
ppm
10
20
30
NO3-NK
97 98 99 00 97 98 99 00 97 98 99 00
Concentrations of nitrate-N and K in soil water

Jyndevad Foulum Flakkebjerg Holeby
Nitr
ate-
N (k
g N
/ha)
0
20
40
60
80
100Without cover cropWith cover crop
ba
a
a
b
a
N leaching in rotation 2

Model simulation of N balance on Danish arable farms
• Organic scenarios:• Basic: Crop rotation dominated by spring cereals with catch crops in
40% of crops and 20% clover/grass.
• + catch crops: Catch crops (white clover/rye grass) in 70% of the crops.
• 0 fertilisation: No manure is used.
• Conventional scenarios:
• Basic: Crop rotation dominated by winter cereals and catch crops in 6% of the crops.
• + catch crops: Catch crops (ryegrass) in 36% of the crops.
Note: Scenarios are representative for Danish agriculture.
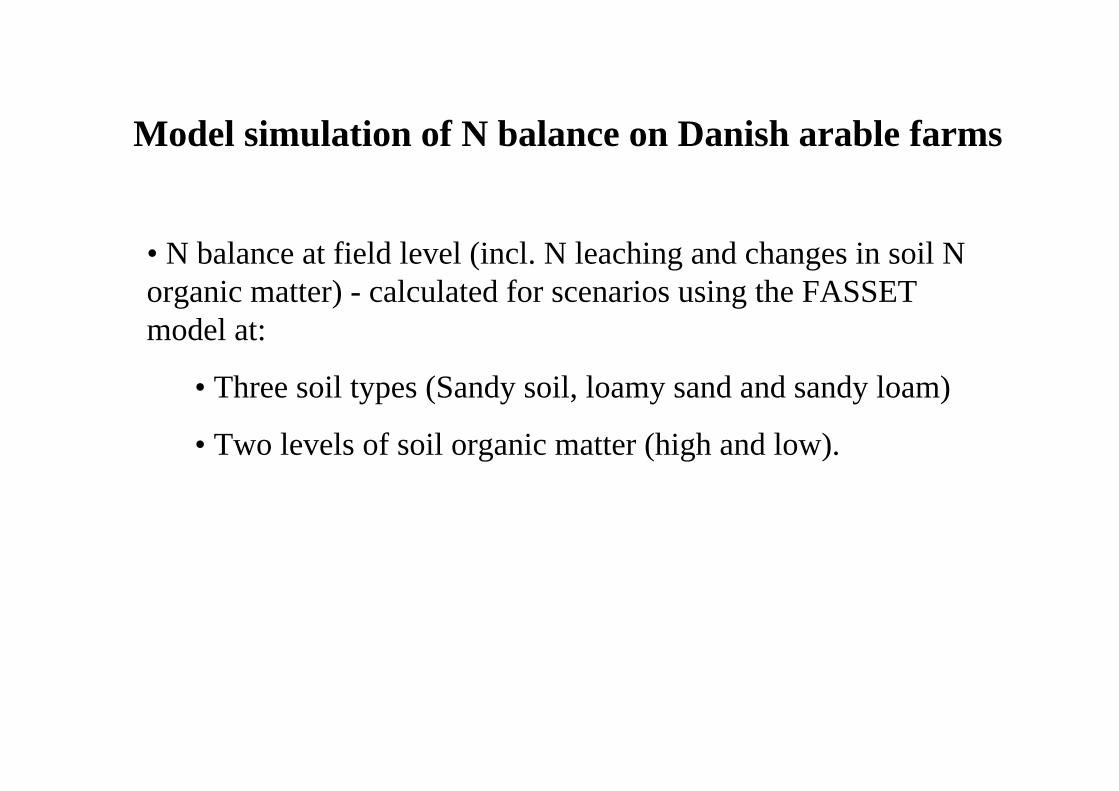
Model simulation of N balance on Danish arable farms
• N balance at field level (incl. N leaching and changes in soil Norganic matter) - calculated for scenarios using the FASSET model at:
• Three soil types (Sandy soil, loamy sand and sandy loam)
• Two levels of soil organic matter (high and low).

N surplus on arable farms (kg N ha-1 year-1)
Berntsen et al., 2004
-150
-100
-50
0
50
100
150
200
Farm type
kg N
per
ha
Mineral fertilizer
Organic fertilizer
N2 fixation
Other inputs
Grain yield
Straw and coarsefodder
ConventionalOrganic
Basic+ catch crops Basic
no fertili-sation
+ catch crops
N surplus: 61 N surplus: 38 N surplus: 40 N surplus: 31 N surplus: 60
Input: 103
Input: 151 Input: 147 Input: 150 Input: 150
Output: - 110
Output: - 72 Output: - 86 Output: - 91
Output: - 112
INPUT
OUTPUT

N surplus and N loss on arable farms (kg N ha-1 year-1)
Berntsen et al., 2004
11 19
-9 -8 -4
-36 -27-32 -36
-29
-11-11
-8 -10-10
31 40 38
-3-3
-2-2
6160
-80
-60
-40
-20
0
20
40
60
80
100
Farm type
kg N
per
ha
N surplus
Ammonia volatilation
Denitrification
N leaching
Soil N pool
ConventionalOrganic
Basic+ catch crops Basic
no fertili-sation
+ catch crops
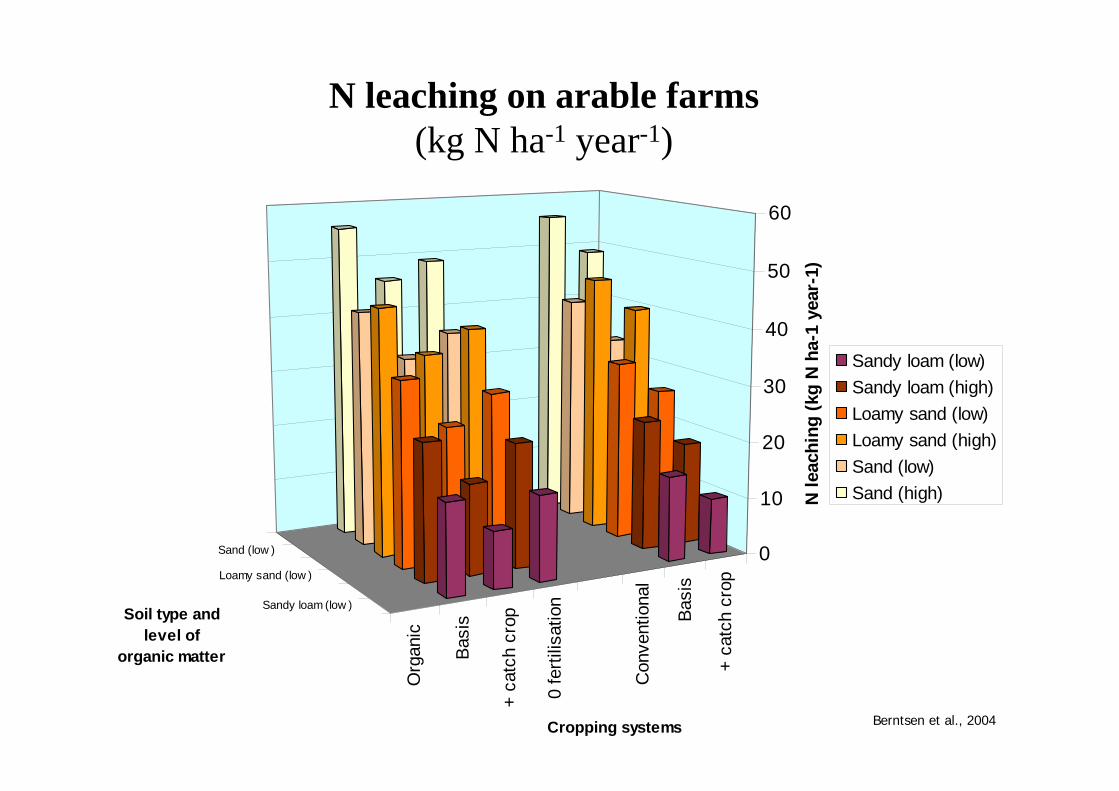
N leaching on arable farms (kg N ha-1 year-1)
Org
anic
Basi
s
+ ca
tch
crop
0 fe
rtilis
atio
n
Con
vent
iona
l
Basi
s
+ ca
tch
crop
Sandy loam (low )
Loamy sand (low )
Sand (low ) 0
10
20
30
40
50
60
N le
achi
ng (k
g N
ha-
1 ye
ar-1
)
Cropping systems
Soil type and level of
organic matter
Sandy loam (low)Sandy loam (high)Loamy sand (low)Loamy sand (high)Sand (low)Sand (high)
Berntsen et al., 2004
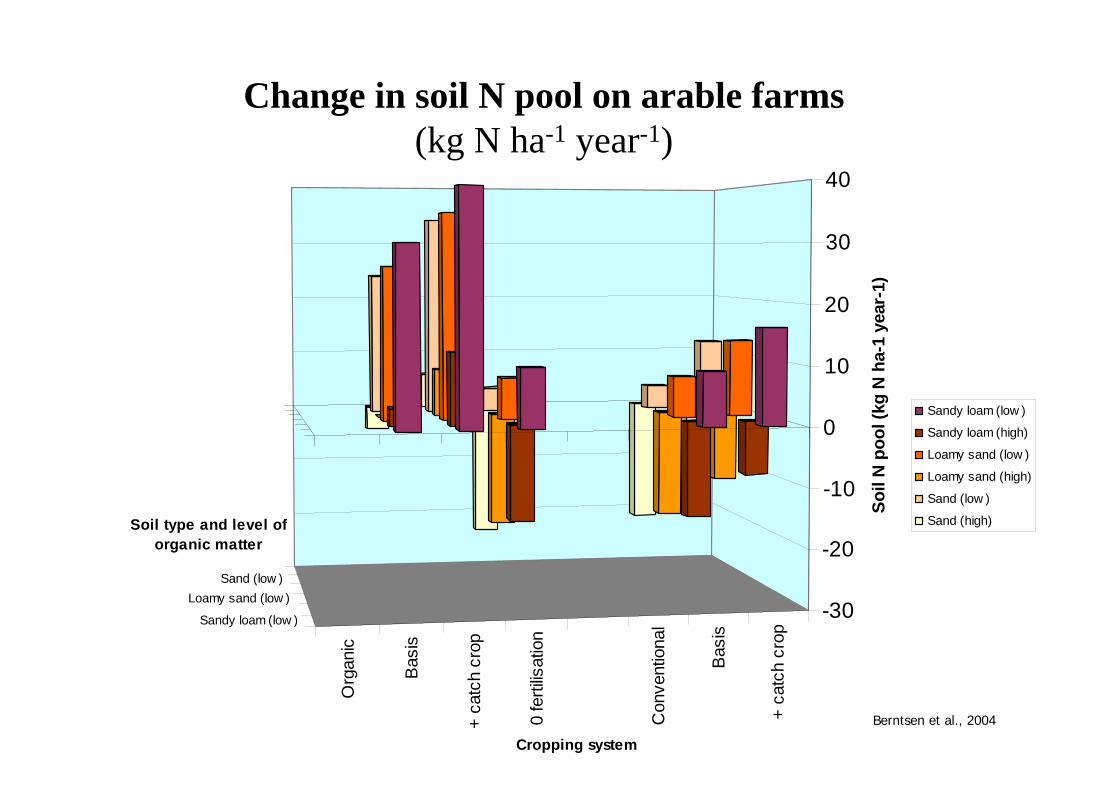
Change in soil N pool on arable farms (kg N ha-1 year-1)
Org
anic
Bas
is
+ ca
tch
crop
0 fe
rtilis
atio
n
Con
vent
iona
l
Bas
is
+ ca
tch
crop
Sandy loam (low )
Loamy sand (low )Sand (low )
-30
-20
-10
0
10
20
30
40
Soil
N p
ool (
kg N
ha-
1 ye
ar-1
)
Cropping system
Soil type and level of organic matter
Sandy loam (low )
Sandy loam (high)
Loamy sand (low )
Loamy sand (high)
Sand (low )
Sand (high)
Berntsen et al., 2004
D A R C O F
Conclusion
• Nitrate leaching from agriculture is a common problem for European aquatic environment
• Conversion to organic mixed/dairy farming decrease leaching of N because of decreased stocking rate and level of N-fertilizer
• Conversion to organic arable farming increase soil fertility, but has little effect on leaching of Nitrate at least at farm level and on a short term
• Organic farming has positive environmental benefits on the soil and the ecosystem

Assessment of environmental impact of organic farming
Source: Hansen et al. (2001)


![1st CoAP Plug test ; Paris, France ; 24 - 25 March 2012€¦ · [1] Constrained Application Protocol (CoAP); draft-ietf-core-coap-08 [2] CoRE Link Format; draft-ietf-core-link-format-11](https://static.fdocuments.in/doc/165x107/5f093f497e708231d425ecba/1st-coap-plug-test-paris-france-24-25-march-2012-1-constrained-application.jpg)