Presentation: Implications for Tax Policy of Lower Trend ... for Tax Policy of Lower Trend...
29
Implications for Tax Policy of Lower Trend Productivity Growth PIIE conference on “Policy Implications of Sustained Low Productivity Growth” Karen Dynan PIIE and Harvard University November 9, 2017 Notes for the slides can be found at the end of the presentation
Transcript of Presentation: Implications for Tax Policy of Lower Trend ... for Tax Policy of Lower Trend...

Implications for Tax Policyof Lower Trend Productivity Growth
PIIE conference on “Policy Implications of Sustained Low Productivity Growth”
Karen DynanPIIE and Harvard University
November 9, 2017
Notes for the slides can be found at the end of the presentation

Motivation: Concerns that the limited productivity growth of recent years will persist
11/9/17 Low Productivity Growth and Taxes 1
0
1
2
3
4
1975 1985 1995 2005 2015
Labor ProductivityGrowthintheUnitedStates5-yearmovingaverage
Source.U.S. DepartmentofLabor
Note:Nonfarmbusinesssector.
0
1
2
3
4
1975 1985 1995 2005 2015
LaborProductivityGrowthinG-7Countries
5-yearmoving average
Source.OECD

What this paper does
Stipulates lower trend productivity growth
Discusses the key relevant economic implications
Considers how we should adapt tax systems, using the different objectives of tax policy as an organizing principle
[Will draw off large related literature on how to reform tax systems to boost productivity growth, but that topic is a different paper]
11/9/17 Low Productivity Growth and Taxes 2

Lower trend productivity growth
Baseline scenario: labor productivity growth and total factor productivity growth settles at an annual pace a few tenths below historical norms
1.8% for labor productivity growth in the United States
Downside risk scenario: labor productivity growth and total factor productivity growth are ½ percentage point below the baseline
1.3% for labor productivity growth in the United States
Not far-fetched—25th percentile of Survey of Professional Forecasters projections is ½ pp below the mean!
11/9/17 Low Productivity Growth and Taxes 3
Other factors that may come along with lower productivity growth
Lower interest rates
(Somewhat) lower inflation
Lower wage growth (maybe flatter lifetime income paths)
Less real bracket creep in the tax code
11/9/17 Low Productivity Growth and Taxes 4

Lower growth and lower interest rates
The Ramsey model implies that r will decline with g, but the exact relationship depends on preferences:
Reasonable parameter choices can yield a one-for-one relationship or something close to that (CEA, 2015)
11/9/17 Low Productivity Growth and Taxes 5
Inversely related to the intertemporal elasticity of substitution
Inversely related to the discount rate
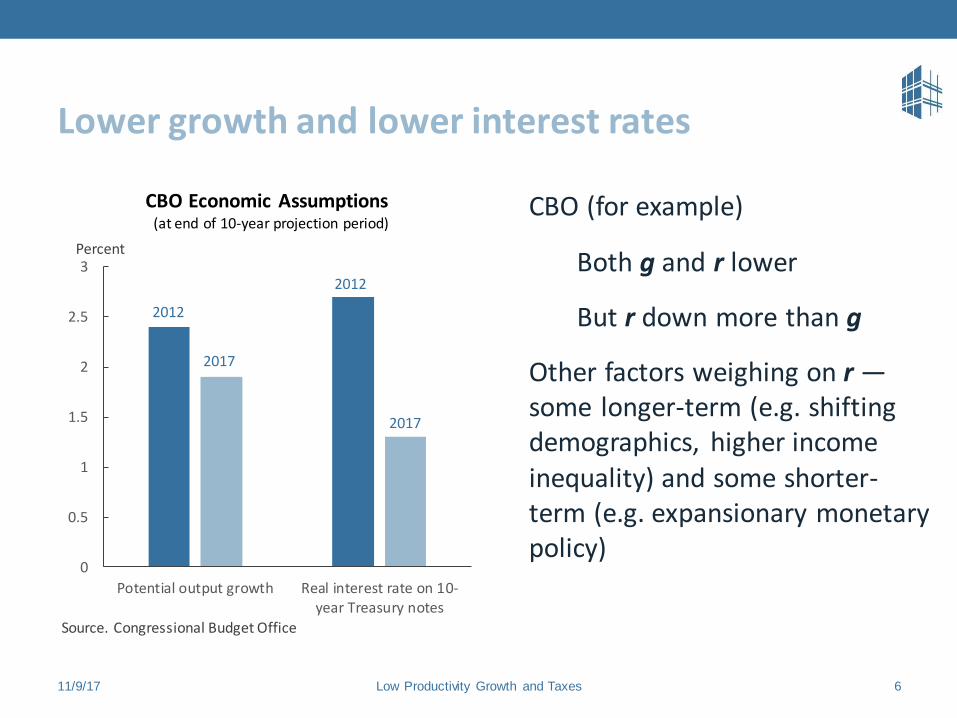
CBO (for example)
Both g and r lower
But r down more than g
Other factors weighing on r —some longer-term (e.g. shifting demographics, higher income inequality) and some shorter-term (e.g. expansionary monetary policy)
11/9/17 Low Productivity Growth and Taxes 6
0
0.5
1
1.5
2
2.5
3
Potential output growth Real interest rate on 10-year Treasury notes
CBO Economic Assumptions (at end of 10-year projection period)
Percent
2012
2012
2017
2017
Source. Congressional Budget Office
Other factors that may come along with lower productivity growth
Lower interest rates
(Somewhat) lower inflation
Lower wage growth (maybe flatter lifetime income paths)
Less real bracket creep in the tax code
11/9/17 Low Productivity Growth and Taxes 7
Other factors that may come along with lower productivity growth
Lower interest rates
(Somewhat) lower inflation
Lower wage growth (maybe flatter lifetime income paths)
Less real bracket creep in the tax code
11/9/17 Low Productivity Growth and Taxes 8
Other factors that may come along with lower productivity growth
Lower interest rates
(Somewhat) lower inflation
Lower wage growth (maybe flatter lifetime income paths)
Less “real bracket creep” in the tax code
11/9/17 Low Productivity Growth and Taxes 9
Real bracket creep
Tax systems are largely indexed for inflation, but real growth will increase effective marginal and average tax rates:
Real growth subjects an ever-larger portion of income to higher tax rates
Real growth pushes more taxpayers above the eligibility limits for certain tax credits (e.g. the EITC, the child tax credit)
Slower growth means less real bracket creep => with revenue implications (see Sheiner, 2017) but also implications for this exercise
11/9/17 Low Productivity Growth and Taxes 10

Tax systems are designed to …
Collect revenues
Minimize disincentives for work
Minimize disincentives for saving
Redistribute income
Mitigate business cycle fluctuations
Minimize other distortions in resource allocation—i.e. minimize tax-based distortions/correct for externalities
11/9/17 Low Productivity Growth and Taxes 11
Will think about implications of low productivity growth for each objective in turn

Collecting revenues
Old age dependency ratios are rising around the world
Government social insurance programs that support the older population are on track to strain government budgets
A sustained period of low productivity growth would sharply worsen these budget challenges
11/9/17 Low Productivity Growth and Taxes 12
0
10
20
30
40
50
60
70
80
1960 1980 2000 2020 2040
Population 65+ Relative to Working-Age Population
Percent
U.S.
Germany
Japan
China
Brazil
Source. World Bank.

Even under the baseline scenario (and taking into account lower interest rates), U.S. federal debt is projected to rise on an unsustainable path
The problem is considerably more severe if productivity growth is lower than in the baseline
11/9/17 Low Productivity Growth and Taxes 13
0
40
80
120
160
200
2000 2010 2020 2030 2040
U.S. Federal Debt Given Different Productivity Growth Assumptions
Percent of GDP
Source. Congressional Budget Office (2016)Note. Assumes fiscal policy as of 2016.
downsiderisk scenario
baselinescenario
173
141

Implications for tax policy
We will need a greater increase in taxes to pay the bills (though will also need to reduce spending)
Could need even more revenues than suggested by CBO’s analysis if the decline in productivity growth …
Implies we should optimally increase national saving
Diminishes labor force participation
Changes redistributional goals such that we want to do more federal spending
WILL RETURN TO THESE ISSUES IN A MOMENT
11/9/17 Low Productivity Growth and Taxes 14
Reducing disincentives for work
Lower wage growth reduces future wages, which reduces the incentive of people to work in the future—this may exacerbate the long-term decline in the labor force participation rate
Having high participation is important:
Reduces fiscal pressures—both through higher tax revenue (all else equal) and through less need for social insurance
Increases self-respect and engagement with society—particularly at the lower end of the income distribution
11/9/17 Low Productivity Growth and Taxes 15

Implications for tax policy
Tax incentives for work should be increased
Focus should be on groups with the most elastic labor supply:
Second earners (e.g. increase child care subsidies)
Less-skilled men (e.g. expand the EITC)
Real bracket creep considerations imply we need to do slightly less of the above than we would do otherwise because these incentives erode more slowly over time
11/9/17 Low Productivity Growth and Taxes 16

Reducing disincentives for saving
It’s not clear whether lower productivity growth warrants an increase or decrease in national saving
A standard Ramsey model finds that a change in g has an ambiguous effect on desired s …
The substitution effect argues for less saving because the rate of return is lower
The income effect argues for more saving because future generations are worse off than otherwise
Parameters used in Elmendorf and Sheiner (2016) imply a small increase in optimal s
11/9/17 Low Productivity Growth and Taxes 17
Lower productivity growth probably warrants an increase in individual saving
Because of possibility of cut in benefits for older population
Moreover, flatter lifetime earnings profile means people should start saving for retirement earlier
11/9/17 Low Productivity Growth and Taxes 18

Implications for tax policy
Unclear whether we want to raise or lower national saving, and the marginal tax rate is a blunt tool for doing so anyway
We probably want more subsidies to encourage people to save(and to start saving earlier)—e.g. tax breaks for firms creating well-designed plans
Real bracket creep considerations imply we need to do slightly less of this than otherwise since people lose eligibility more slowly for incentives with income-based thresholds
11/9/17 Low Productivity Growth and Taxes 19

Redistributing income
For a given distribution of compensation growth around its average, a lower average will lead more people to have zero or negative changes
Harmful because people make fixed nominal commitments (harm exacerbated by low inflation)
Frustrating because people develop expectations—i.e. utility may be a function of (Ct – some benchmark)
Politically destructive because people expect “a fair shot”
So lower productivity growth implies a greater need for redistribution
11/9/17 Low Productivity Growth and Taxes 20
Implications for tax policy
The tax system should be made more progressive generally
The tax system should provide more insurance against bad outcomes—e.g. a tax-based wage insurance program
We should raise tax subsidies for mechanisms that create opportunity—e.g. tax incentives for firms that provide training
Real bracket creep considerations: (1) people move into higher tax brackets more slowly so we might want to do a little more on general efforts (2) people’s incomes rise above eligibility thresholds for some credits more slowly so need slightly smaller subsidies for these credits than otherwise
11/9/17 Low Productivity Growth and Taxes 21
Mitigating business cycle fluctuations
Lower productivity growth leads to lower real interest rates, which means central banks will hit the effective lower bound more frequently
Growing skepticism about the ability of alternative tools to offset the inability to lower policy rates more substantially (Blanchard and Summers, 2017)
So the countercyclical power of monetary policy is blunted
11/9/17 Low Productivity Growth and Taxes 22

Implications for tax policy
We need stronger automatic stabilizers in the tax system
For example, could have automatic adjustments in payroll tax rates when the unemployment rate crosses a given threshold (coupled with automatic general revenue contributions to Social Security to make up for the foregone revenue)
11/9/17 Low Productivity Growth and Taxes 23
Minimizing other distortions in resource allocation
There already is a long literature on features of current tax systems that lead to misallocation of resources and hold back productivity growth by …
distorting investment by industry and assets
distorting choice of financing for investment
distorting how businesses are organized and where they are located
not sufficiently correcting for spillovers / externalities
11/9/17 Low Productivity Growth and Taxes 24
Implications for tax policy
Improving tax systems to address these problems would be important regardless of underlying productivity growth
But such changes are especially important when productivity growth is weak
11/9/17 Low Productivity Growth and Taxes 25

Summary
The decline in trend productivity growth and the other economic implications of that decline affect all of the objectives of tax policy
Those effects of slower productivity growth can justify various changes in tax policy:
collect more revenue
provide a greater incentive to work (and maybe save)
become more progressive
offset business cycle downturns more vigorously
improve resource allocation
11/9/17 Low Productivity Growth and Taxes 26

Some final considerations
It would probably be worthwhile for tax systems to move in many of these directions even if productivity growth were to follow the baseline assumption of being only slightly below historical averages
It will matter how much any reduction in trend productivity growth changes income growth at different points in the distribution
Political feasibility is, of course, another important issue
11/9/17 Low Productivity Growth and Taxes 27

Endnotes
Slide 1: Sources—U.S. Department of Labor for left panel and OECD for right panelSlide 5: See Council of Economic Advisers (2015) Long-term Interest Rates: A SurveySlide 6: Source—Congressional Budget Office; the 2012 assumptions were taken from The Budget and Economic Outlook: Fiscal Years 2012 to 2022; the 2017 assumptions were taken from the 10-year Economic Projections files available hereSlide 10: See Sheiner (2017) The Effects of Low Productivity Growth on Fiscal SustainabilitySlide 12: Source—World BankSlide 13: Source—Chapter 7 from Congressional Budget Office (2016) The 2016 Long-term Budget OutlookSlide 17: See Elmendorf and Sheiner (2016) Federal Budget Policy with an Aging Population and Persistently Low Interest RatesSlide 22: See Blanchard and Summer (2017) Rethinking Stabilization Policy. Back to the Future
11/9/17 Low Productivity Growth and Taxes 28