Presentation FY2016 web vF - Technogym...
18
Financial Results Full Year 2016 March 2017
Transcript of Presentation FY2016 web vF - Technogym...

Financial ResultsFull Year 2016
March 2017

1
Disclaimer
This presentation is being furnished to you solely for your information and may not be reproduced or redistributed to any other person.
This presentation might contain certain forward-looking statements that reflect the Company’s management’s current views with respect
to future events and financial and operational performance of the Company and its subsidiaries. These forward-looking statements are
based on Technogym S.p.A.’s current expectations and projections about future events. Because these forward-looking statements are
subject to risks and uncertainties, actual future results or performance may differ materially from those expressed in or implied by these
statements due to any number of different factors, many of which are beyond the ability of Technogym S.p.A. to control or estimate. You
are cautioned not to place undue reliance on the forward-looking statements contained herein, which are made only as of the date of this
presentation. Technogym S.p.A. does not undertake any obligation to publicly release any updates or revisions to any forward-looking
statements to reflect events or circumstances after the date of this presentation.
Any reference to past performance or trends or activities of the Technogym Group shall not be taken as a representation or indication that
such performance, trends or activities will continue in the future.
This presentation does not constitute an offer to sell or the solicitation of an offer to buy Technogym’s securities, nor shall the document
form the basis of or be relied on in connection with any contract or investment decision relating thereto, or constitute a recommendation
regarding the securities of Technogym.
Technogym’s securities referred to in this document have not been and will not be registered under the U.S. Securities Act of 1933 and may
not be offered or sold in the United States absent registration or an applicable exemption from registration requirements.
Stefano Zanelli, the Manager in charge of preparing the corporate accounting documents, declares that, pursuant to art. 154-bis,
paragraph 2, of the Legislative Decree no. 58 of February 24, 1998, the accounting information contained herein correspond to document
results ,books and accounting records.

CEO RemarksFinancial Results FY2016CEO RemarksFinancial Results FY2016

3
Revenues (€m) Key comments
564,3555,3511,8
2016A (excl. FX)
2015A
8,5%10,3%
A2016
Positive volume effect primarily comingfrom
• Volume effect• New product launches (Group Cycle,
MyRun, Skillmill)• Incremental sales of services and
accessories
Positive price effect primarily comingfrom
• Cardio equipment and Group Activities
Excluding FX impact, revenue growthwould have been 10,3%
• Major negative impact from GBP, BRLand RUB
Revenues _Overview of key performance indicator

4
Revenues _breakdown by geography
APAC
MEIA
+8,5%
North America
68,7(13%)
Europe (excl. Ita)
2016A
21,9(4%)
49,7(10%)
288,1(52%)
51,0(9%)
LATAM
555,3
80,9(15%)
22,7(4%)
54,2(10%)
2015A
58,4(11%)
511,8
45,0(9%)
50,3(10%)
Italy
276,1(54%)
4,3%
17,9%
20.4%
16.0%
Delta 2016A vs 2015A
2.7%
3.8%
€m

5
Revenues _breakdown by channel
5,6(1%)
2015A
Wholesale
511,8
Inside Sales
40,9(7%)
5,7(1%)
354,9(69%)
Retail
112,8(22%)
555,3
Field Sales
2016A
+8,5%
122,3(22%)
38,5(8%)
386,4(70%) 8,9%
6,4%
8,4%
1,7%
€mDelta 2016A
vs 2015A

6
Cost base view
Cost base evolution (% on rev) Key comments
Raw material, WIP &
Finished goods
Services
Personnel
D&A / Impairments
Other
2016A
35.4%
25.2%
21.1%
4.6%1.5%
2015A
35.7%
24.9%
22.9%
4.4% 1.0%
D&A / Impairments• Increase in absolute terms mainly due to
TG Village acquisition
Personnel cost• 2 p.p. decrease thanks to production
processes’ optimization and internal staffreorganization
Services cost• Increase in marketing, sale commissions
and IT consultancy costs.• Rent cost reduction as consequence of TG
Village acquisition
Raw Material, WIP & Finished Goods• 0,3 p.p. decrease thanks to optimization of
purchase and product re-engineeringprocesses.
Revenues
87,5% 86,6%
88,8% 87,7%
€511,8m €555,3m
Cost Annual €448m €481m
% on rev
% on rev
Excl. non-recurring

7
EBITDA
EBITDA evolution (€m) Key comments
EBITDA growing at ∼15% vs Y-1 withpositive impact on profitability (18,0% vs16,9% of Y-1)
EBITDA margin increase thanks to
• operational leverage from the increase insales volume
• optimization of production processes withpositive impact on manufacturing directcosts
• reduction in rent costs following theacquisition of the TG Village2015A
86.7
15.3%
99.9105.5
2016A2016A
21.7%
16.9% 18,0%% on Revenues 18.7%
8
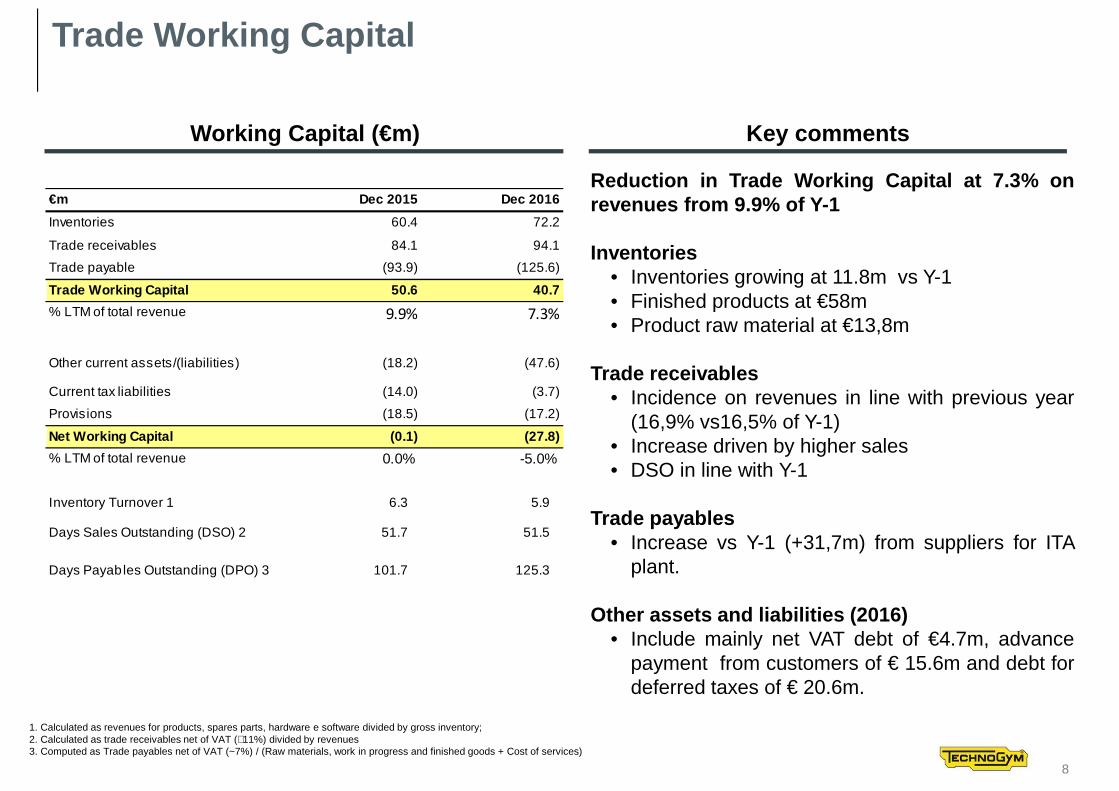
Trade Working Capital
1. Calculated as revenues for products, spares parts, hardware e software divided by gross inventory;2. Calculated as trade receivables net of VAT (∼11%) divided by revenues3. Computed as Trade payables net of VAT (~7%) / (Raw materials, work in progress and finished goods + Cost of services)
Key comments
Reduction in Trade Working Capital at 7.3% onrevenues from 9.9% of Y-1
Inventories• Inventories growing at 11.8m vs Y-1• Finished products at €58m• Product raw material at €13,8m
Trade receivables• Incidence on revenues in line with previous year
(16,9% vs16,5% of Y-1)• Increase driven by higher sales• DSO in line with Y-1
Trade payables• Increase vs Y-1 (+31,7m) from suppliers for ITA
plant.
Other assets and liabilities (2016)• Include mainly net VAT debt of €4.7m, advance
payment from customers of € 15.6m and debt fordeferred taxes of € 20.6m.
Working Capital (€m)
€m Dec 2015 Dec 2016
Inventories 60.4 72.2
Trade receivables 84.1 94.1
Trade payable (93.9) (125.6)
Trade Working Capital 50.6 40.7
% LTM of total revenue 9.9% 7.3%
Other current assets/(liabilities) (18.2) (47.6)
Current tax liabilities (14.0) (3.7)
Provisions (18.5) (17.2)
Net Working Capital (0.1) (27.8)
% LTM of total revenue 0.0% -5.0%
Inventory Turnover 1 6.3 5.9
Days Sales Outstanding (DSO) 2 51.7 51.5
Days Payables Outstanding (DPO) 3 101.7 125.3

9
CAPEX
Capex analysis (€m) Key comments
Low capital intensive business model excludingone-off property and TG Village investments
Excluding the one-off investment of TG Villagethe capex are mainly referred to
Tangibles• Investments in industrial tools, molds and
production lines
Intangibles• Investments for innovation activities and
research and development of new products
4.9%% of total revenue
Acquisition of 2 industrial facilities
% of total Revenue exc. one off
3.1% 4.0%
Acquisition of Technogym Village
19.7%
8.8
87.3
6.9 8.3
25.1
109.6
2016A
14.0
2015A
9.4
PPE IntangiblesOne-off (PPE)

10
Net Financial Debt
Net Financial Debt (€m) Key comments
Cash & cash equivalents increase of ∼€-15mdespite of cash out for
• €42m cash out for TGB Srl acquisition• €46m cash out for the reimbursement of the
loan undertook by TGB Srl• €21m cash out for Exerp acquisitionPositive effect of €25m from reimbursement ofSlovakia VAT
Current bank debt• Mainly composed credit lines stand-by and
short-term financing. As of 31/12/2016− Lines of credit and overdrafts uncommitted for
~€77m of which €10m drawn (revocable / floatingrate: EURIBOR + spread)
− Committed credit line (medium-long term) for~€45m o/w €41m drawn (floating: EURIBOR +spread)
Current portion of non-current debt / Noncurrent financial debt
• Flexible financial structure based on bankamortizing loans with ~2,4y duration (floating:EURIBOR + spread)
€m Dec 2015 Dec 2016
Cash & cash equivalents (68.0) (53.1)
Current financial receivables (0.3) (0.7)
Current Bank debt 35.0 20.0
Current portion of non-current debt 17.9 20.8
Other current financial debt 5.0 7.5
Net current financial debt 57.9 48.3
Non current financial debt 48.5 83.6
Financial Net Debt (“FND”) 38.1 78.0
FND / EBITDA (x) 0.4x 0,78x

11
Free cash flow
94 8816(22)
Cash flows from operatingactivities
Change in NWC Capex Free Cash Flow
80 81 17 (15)
Cash flows from operatingactivities
Change in NWC Capex Free Cash Flow
93%
Cash Conversion %
Note: Cash conversion defined as Free Cash Flow / EBITDA1 Pre income taxes paid2 Excluding non recurring tax payment and reimbursement (Slovakia VAT)3 Excluding the one-off acquisition of two industrial facilities (€9.4m) occurred in 20154 Excluding the Technogym Village acquisition ( €42m)
Cash Conversion %
88%
1
1
2
2
3
42016A(€m)
2015A(€m)

12
Executive SummaryFY 2016
Revenues: €555,3m, +8,5% vs 2015 (+10,3% at constant FX) thanks to positive volume effect coming primarily coming from
• Volume effect• Positive price effect primarily• Incremental sales of services and accessories
Excluding FX impact, revenue growth would have been 10,3%.Major negative impact from GBP, BRLand RUB.
EBITDA: €99,9m, +15,5% vs 2015 (+21,7% at constant FX) thanks to• Operational leverage from the increase in sales volume• Optimization of production processes with positive impact on manufacturing direct costs• Reduction in rent costs following the acquisition of the TG Village
Free Cash Flow 1: equal to €88m (+8,6% vs 2015, €81m) excluding non -recurrent Capex.
Net Financial Debt: €78m vs €38m as of December’15 • Non-recurring investments in TG Village and Exerp
1. Cash flow from operating activities (pre-tax) – var. NWC – Recurrent Capex

13
Annexes

14
Profit and Loss statement
€m Dec 2015 Dec 2016 Dec 2015 vs Dec 2016 ∆ %
Total revenue 511.8 555.3 8.5%
Cost or raw. ancillary and consumable materials and
goods for resale (182.6) (196.4) 7.6%
Service. Rentals and leases (127.2) (139.8) 9.9%
of which (cost) not recurrent (2.6) (2.3)
Personnel cost (117.0) (116.9) (0.0%)
of which (cost) not recurrent (3.1) (0.6)
Depreciations. amortisations and write-downs (20.0) (23.2) 15.7%
Provision for risk and charges (2.6) (2.5) (1.5%)
Other operations cost (4.9) (8.2) 68.4%
of which (cost) not recurrent (0.0) (2.9)
Share of result joint venture 1.0 0.1 (87.1%)
Net operating income 58.4 68.4 17.0%
Margin (%) 11.4% 12.3%
Financial income and (expenses) (3.5) (2.7) (23.3%)
Profit (loss) before tax 55.0 65.7 19.6%
Taxes (26.6) (22.5) (15.4%)
Profit (loss) before minority interest 28.4 43.2 52.4%
Margin (%) 5.5% 7.8%
Profit (loss) for the year of minority interests (0.2) (0.1) (28.0%)
Profit for the year 28.2 43.1 53.0%
15
EBITDA Reconciliation
€m Dec 2015 Dec 2016Dec 2015 vs Dec 2016 ∆ %
Net operating income 58.4 68.4 17.0%LTMIP cost (previous years) 2.5
Consultancy cost 1.5
Restructuring cost 0.9
IPO cost 0.7 3.0
Brasil tax (previous year) 2.2
China litigations 0.6
Total non recurring items 5.6 5.8 3.4%Adjusted net operating income 64.1 74.2 15.8%
Provisions 2.6 2.5 15.7%
Depreciations, amortisations and write-downs 20.0 23.2 (1.5%)
EBITDA 86.7 99.9 15.3%Margin (%) 16.9% 18.0%

16
Cash Flow statement€m Dec 2015 Dec 2016
Dec 2015 vs Dec 2016
∆ ass.
Dec 2015 vs Dec 2016
∆ %
Profit for the year 28.4 43.2 14.9 52%
Depreciation, amortization and impairment losses 20.0 23.2
Provisions 2.6 2.5
Share of net result from joint ventures (1.0) (0.1)
Net financial expenses 2.6 2.5
Income/(expenses) from investments 0.9 0.1
Income tax expenses 26.6 22.5
Cash flows from operating activities before changes in working capital 80.0 94.0 13.9 17%
Increase (decrease) in inventories 2.1 (12.3)
Increase (decrease) in trade receivables (4.2) (5.8)
Increase (decrease) in trade payables (0.2) 33.2
Increase (decrease) in other operating assets and liabilities 19.2 0.9
Non-recurrent fiscal payment (22.8) 22.8
Income taxes paid (19.3) (34.8)
Net cash flow from operating activities (A) 54.8 97.9 43.1 79%
Investments in property, plant and equipment (18.2) (56.1)
Disposals of property, plant and equipment 0.2 0.5
Investments in intangible assets (6.9) (8.7)
Disposals of intangible assets 0.0 0.0
Dividends received from other entities 0.4 -0.1
Dividends received from joint ventures and associates 0.0 0.7
Dividends paid - 0.0
Investments in subsidiaries, associates and other entities 0.5 (18.1)
Disposal of subsidiaries, associates and other entities 0.3 0.0
Net cash inflow (outflow) from investing activities (B) (23.7) (81.9) (58.2) 246%
Proceeds from new borrowings 70.0 65.0
Repayment of borrowings (19.9) (30.9)
Net increase (decrease) of current financial assets and liabilities (54.4) (61.0)
Payments of net financial expenses (0.9) (5.4)
Net cash inflow (outflow) from financing activities (C) (5.2) (32.3) (27.0) 519%
Net increase (decrease) in cash and cash equivalent s (D)=(A)+(B)+(C) 26.0 (16.2) (42.2) (162%)

17
Balance Sheet
€m Dec 2015 % on
Revenues Dec 2016 % on
Revenues
Inventories 60.4 11.8% 72.2 13.0%
Trade receivables 84.1 16.4% 94.1 16.9%
Trade payables (93.9) -18.4% (125.6) -22.6%
Trade Working Capital 50.6 9.9% 40.7 7.3%
Other current assets/(liabilities) (18.2) -3.6% (47.6) -8.6%
Current tax liabilities (14.0) -2.7% (3.7) -0.7%
Provisions (18.5) -3.6% (17.2) -3.1%
Net Working Capital (0.1) 0.0% (27.8) -5.0%
Property. plant and equipment 56.9 11.1% 143.9 25.9%
Intangible assets 21.5 4.2% 24.0 4.3%
Investments in joint ventures 3.8 0.7% 21.3 3.8%
Employee benefit obligations (3.1) -0.6% (3.2) -0.6%
Other non current asset and (liabilities) 2.5 0.5% 7.4 1.3%
Net Fixed Capital 81.6 15.9% 193.5 34.8%
Net Invested Capital 81.5 15.9% 165.7 29.8%
Shareholders' Equity 43.4 87.6
Financial Net Debt 38.1 7.4% 78.0 14.0%
Total Source of Funding 81.5 15.9% 165.7 29.8%