Presentation for Investor Conference Call - Borets:...
48
Presentation for Investor Conference Call Wednesday 15 th March 2017 2016
Transcript of Presentation for Investor Conference Call - Borets:...

Presentation for Investor Conference CallWednesday 15th March 2017
2016

Contents
2
2016: Facts & Figures 4
Borets ESP Global Market Share 2015-2016 5
Borets Technologies and Solutions 6
Borets Manufacturing Facilities Worldwide 7
Borets Service Capabilities 8
Borets Service Company Worldwide Locations 9
Borets’ Global Share of Installed ESPs 10
ESP System Design and Configuration 11
Financial Results 12
Rouble Devaluation May Be Reversing 13
Sales declined by 7.5% vs 10.6% Rouble fall 14
Services are a growing share of revenues 15
“Real” revenues kept growing while “nominal” revenues are effected by exchange rate 16
Russian Revenues grew by 11% in 2016 17
Record Oil Production Continues in Russia in 2016 18
Non Russian Revenues hit by collapse in North America and slow down in Latin America 19
International Revenues vs Oil Price 20

Contents
3
Growing Gross Profit Margin 21
9% drop in Cost of Sales 22
Operating Costs down by 22% 23
Operating Profit Margin recovered strongly in 2016 24
Decline in Net Income due to Rouble depreciation and higher tax burden 25
EBITDA Reconciliations (2) 26-27
Record EBITDA margin 28
Positive Free Cash Flow 29
Leverage ratios are compliant with Leverage Policy 30
Consolidated Net Leverage Ratio calculation 31
Guarantors test 32
Capex 33
Cash holdings (3) 34-36
Balance Sheet Items (2) 37-38
Сash Analyses (4) 39-43
Tight Control Over Net Working Capital 44
Changes in PP&E in 2014-2016 45
Risk Management 46-48

2016: Facts & Figures
No. 1 ESP manufacturer worldwide
(c13,000 ESPs manufactured annually)
No. 3 ESP global sales position
$482 MM annual revenue in 2016
No. 1 ESP service company worldwide
c46,700 ESPs installed base
7,000+ PMMs in operation worldwide
22,000+ serviced wells
500+ clients worldwide
Borets traces its history back to 1897.
In 2016:
– с9,000 employees worldwide, including
– 3,500 dedicated field personnel
– 11 Manufacturing Facilities
– 25 Service Centers in 10 countries 4

Borets ESP Global Market Share
Despite continued Rouble depreciation, Borets maintains 11% of global ESP sales in 2016
Borets leads in the Russian ESP market with 29% share in 2016
5
Baker Hughes, 24%
Schlumberger, 21%
Borets, 11%
GE, 8%
Novomet, 5%
Alkhoraef, 5%
Other, 26%
Global ESP Market by Competitors in 2016, %100% c. $4.2 Billion
Baker Hughes, 25%
Schlumberger, 20%
Borets, 11%
GE, 9%
Novomet, 5%
Alkhoraef, 4%
Other, 26%
Global ESP Market by Competitors in 2015, %100% c. $5 Billion

Borets Technologies and Solutions
Borets is the world’s only vertically integrated ESP provider, supplying complete ESP systems
6

Borets’ 11 Manufacturing Facilities Worldwide
7

Borets Service Capabilities
Borets is the largest ESP service provider worldwide
More than 22,000 wells under service worldwide
Capable of servicing and repairing equipment
manufactured by all global ESP manufacturers
Capable of providing turnkey ESP solutions to clients
Maintained stock of equipment and components for
repair and equipment maintenance
Knowledgeable, fully-trained professionals to meet the
needs of our clients 24 hours per day
High level repairing process
Unique centers to provide services for more than 7,000
wells in each region
Unmatched experience which allows Borets to create
service centers “from zero” in any part of the world
8

Borets Service Company 25 Locations Worldwide
9

Borets’ Global Share of Installed ESPs
10
Total ESP Wells of which Rental ESP Wells
Total
(‘000s)
Borets
(‘000s)%
Total
(‘000s)
Borets
(‘000s)%
Russia 97.0 44.0 45% 21.0 6.1 29%
Rest of the World 64.0 2.7 4% 19.0 0.6 3%
TOTAL 161.0 46.7 29% 40.0 6.7 17%

ESP System Design and Configuration
11

2016 FINANCIAL RESULTS
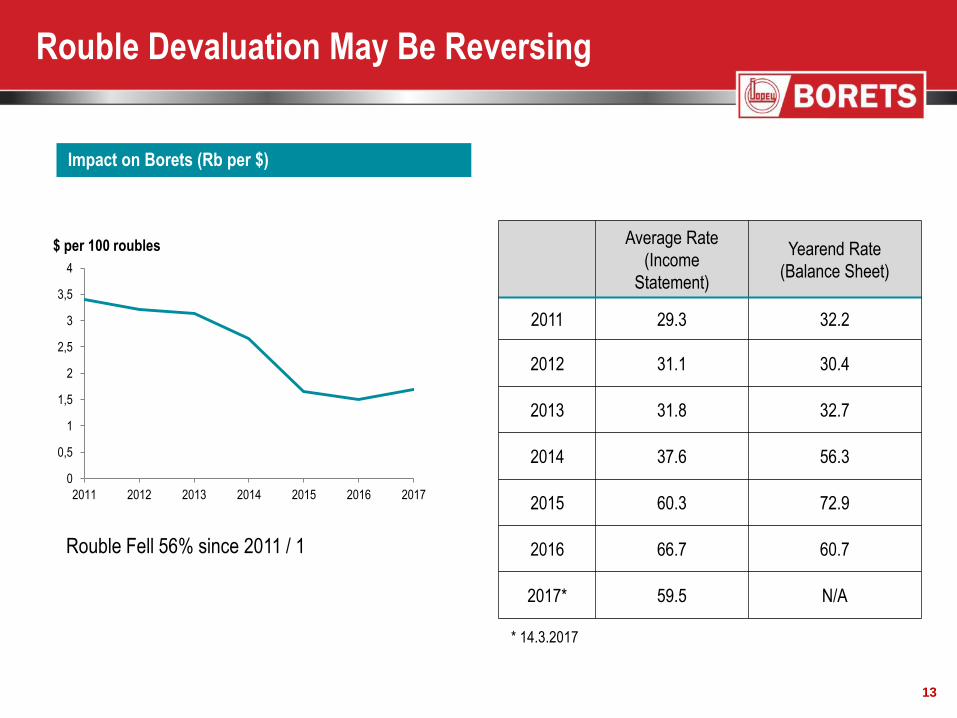
Rouble Devaluation May Be Reversing
Impact on Borets (Rb per $)
Average Rate
(Income
Statement)
Yearend Rate
(Balance Sheet)
2011 29.3 32.2
2012 31.1 30.4
2013 31.8 32.7
2014 37.6 56.3
2015 60.3 72.9
2016 66.7 60.7
2017* 59.5 N/A
0
0,5
1
1,5
2
2,5
3
3,5
4
2011 2012 2013 2014 2015 2016 2017
$ per 100 roubles
Rouble Fell 56% since 2011 / 1
* 14.3.2017
13

Revenues ($ mm)
Sales declined by only 7.5% as Rouble fell by
10.6%
742,7766,9
720,1
521,6482,4
566,0 579,1
510,1
367,4 368,8
176,7 187,8210,0
154,2113,6
0
100
200
300
400
500
600
700
800
900
2012 2013 2014 2015 2016
Consolidated
Russia
International
14
US $1 = RUB 31.1 RUB 31.8 RUB 37.6 RUB 60.3 RUB 66.7

68,1% 65,9% 62,1%54,2%
31,9% 34,1% 37,9%45,8%
0%
10%
20%
30%
40%
50%
60%
70%
80%
90%
100%
2013 2014 2015 2016
Product Sales Services (including rental)
Revenues ($ mm and %)
Services are a growing share of revenues
766,9 720,1 521,6 482,4
15

707743
767
720
522
482
707
778817
872910
953
400
450
500
550
600
650
700
750
800
850
900
950
1000
2011 2012 2013 2014 2015 2016
Based on actual rate Using rate of 29.3 RUB/USD (2011 average rate)
“Real” revenues kept growing while “nominal” revenues
are effected by exchange rate
Total revenue 2011-2016 ($ mm)
16
Actual Rate
US $1 = RUB 29.3 RUB 31.0 RUB 31.8 RUB 37.6 RUB 60.3 RUB 66.7

Russian Revenues grew by 11% in 2016
Russia Revenues (roubles bn)
17
14,8
17,1 17,618,4
19,2
22,2
24,6
7,18,3 8,9 9,1 9,1
10,811,9
0,0
5,0
10,0
15,0
20,0
25,0
30,0
2010 2011 2012 2013 2014 2015 2016
Year H1

Record Oil Production continues in Russia in 2016
Source: East office of Finnish Industries, Minenergo, Company Data.
85
90
95
100
105
110
Jan Feb March April May June July Aug Sep Oct Nov Dec
%
Russian Extraction of oil (incl. gas condensate)Physical output % of Dec 2011 level (Dec11=100%)
2013 2014 2015 2016 (forecast)
18

Non Russian Revenues hit by collapse in North America
and slow down in Latin America
International Revenues breakdown ($ mm)
124 177 188 210 154 114
19
70
7971
64 46 34
130
31
38 3318
1012
19
21
22
19
67 19
3517
7
17 17 14 16 10
8
20 32 34 36 2628
0%
10%
20%
30%
40%
50%
60%
70%
80%
90%
100%
2011 2012 2013 2014 2015 2016
USA Colombia Egypt Venezuela Canada Other

International Revenues (USDm) vs. Oil Price (USD) 2012 - 2016
20
112 10999
5244
177
188
210
154
114
$0
$50
$100
$150
$200
$250
2012 2013 2014 2015 2016
Average oil price (Brent), $/bbl International Revenues (USDm)

Growing Gross Profit Margin
Gross Profit ($ mm) and Gross Profit Margin (%)
26.7%
28.3% 28.4%
21
205,1 203,7
148,0143,2
99,0105,5
76,864,0
26,7%28,3% 28,4%
29,7%
2%
12%
22%
32%
$0
$50
$100
$150
$200
$250
$300
2013 2014 2015 2016
Year-Gross profit 1H-Gross profit Year-Gross profit margin

While Revenues drop by 7.5% Cost of
Sales declined by 9%
2013 2014 2015 2016
Materials 338.7 327.2 213.7 210.4
Labour 155.1 147.5 101.8 94.6
D&A 49.3 45.8 55.7 64.7
Prod. Overheads 30.5 27.8 23.9 24.8
Transport 21 16.9 12.2 11.4
Rental tools sold 5.1 4.3 5.6 1.8
External services used 3.8 4.5 4.9 4.0
Decrease \ (increase) in stock and capitalised goods (41.7) (57.7) (44.3) (72.6)
TOTAL 561.8 516.3 373.5 339.1
Cost of sales ($ mm)
22

Operating Costs down by 22%
2013 2014 2015 2016
Sales & Marketing 8.4 7.5 4.8 3.8
G & A 111.1 111.1 94.6 83.3
Other 24.6 16.3 11.6 (1.0)
TOTAL 144.1 134.9 111.0 86.1
Operating costs ($ mm)
23

Operating Profit Margin recovered strongly in
2016
Operating Profit ($ mm) and Operating Profit Margin (%)
24
61,068,7
37,0
57,1
37,9
43,9
23,1 24,7
8,0%
9,5%
7,1%
11,8%
9,9%
12,4%
8,6%
11,0%
0%
5%
10%
15%
0
10
20
30
40
50
60
70
80
90
100
2013 2014 2015 2016
Year-operating profit 1H-operating profit Year-operating profit margin 1H-operating profit margin

47,145,3
23,1 22,6
58,0
44,8
12,3
6,4
0,0
10,0
20,0
30,0
40,0
50,0
60,0
70,0
2013 2014 2015 2016
PBT Net profit
Decline in Net Income due to
Rouble depreciation and higher tax burden
Profits before income tax and net profits ($ mm)
* Includes $11 mm one-off tax benefit
*
25
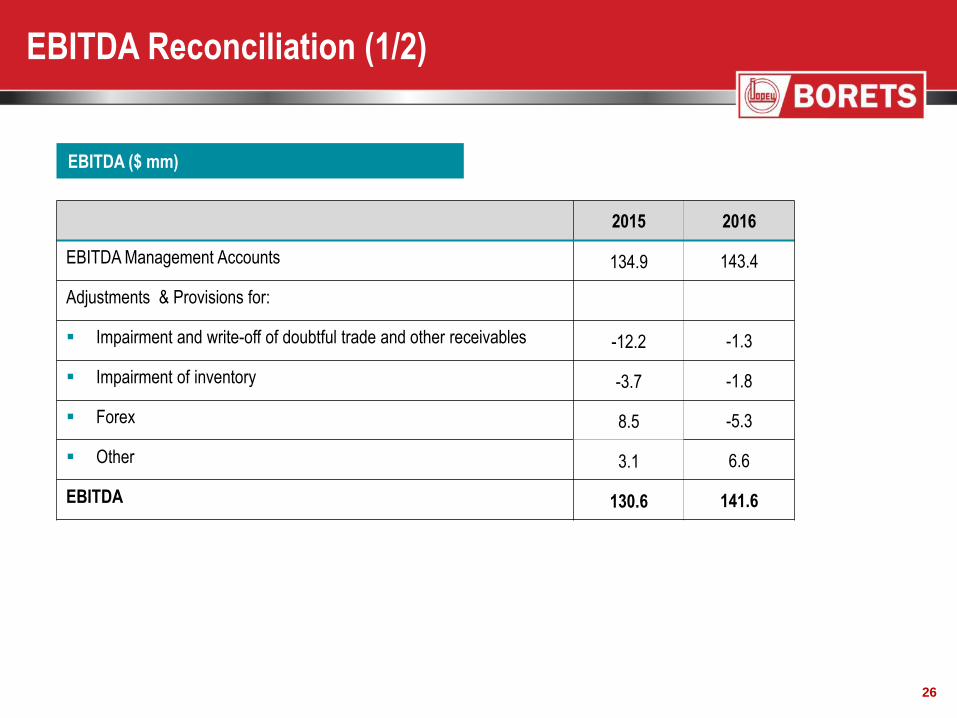
EBITDA Reconciliation (1/2)
2015 2016
EBITDA Management Accounts 134.9 143.4
Adjustments & Provisions for:
Impairment and write-off of doubtful trade and other receivables -12.2 -1.3
Impairment of inventory -3.7 -1.8
Forex 8.5 -5.3
Other 3.1 6.6
EBITDA 130.6 141.6
EBITDA ($ mm)
26

2013 2014 2015 2016
Net Profit 58.0 44.8 12.3 6.4
Adjustments for:
Income Tax (11.0) 0.5 10.8 16.2
Interest Expense (net) 13.8 33.1 34.8 35.6
Service Agreement 11.3 15.0 15.3 15.3
D&A 52.5 50.8 57.4 66.7
Extraordinary item 6.7 - - 1.4
EBITDA 131.3 144.2 130.6 141.6
EBITDA Reconciliation (2/2)
EBITDA ($ mm)
27
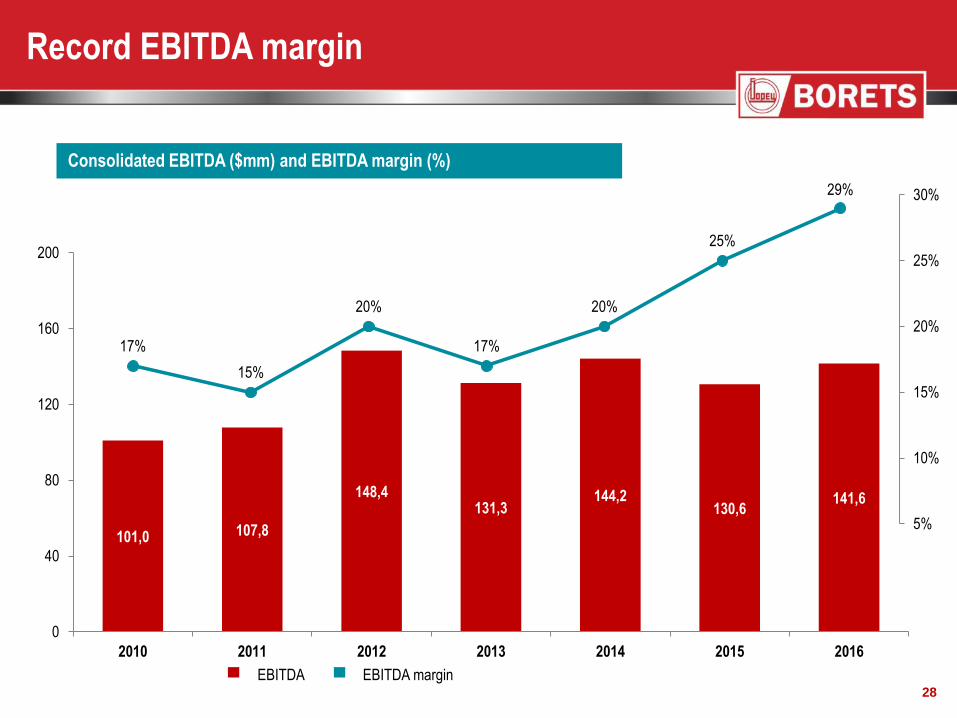
Record EBITDA margin
EBITDA EBITDA margin
Consolidated EBITDA ($mm) and EBITDA margin (%)
28
101,0 107,8
148,4131,3
144,2130,6
141,6
0
40
80
120
160
200
2010 2011 2012 2013 2014 2015 2016
17%
15%
20%
17%
20%
25%
29%
5%
10%
15%
20%
25%
30%

Positive Free Cash Flow
Capital Expenditure and Rental Investment (USDm) Free Cash Flow4 (USDm)
Operating Cash Flow1 (USDm)
Notes:
1. EBITDA – Non-cash Adjustments – Management Fees – Interest – Taxes – Change in NWC
2. OCF / FCF cash conversion is defined as OCF / CFC divided by EBITDA
3. Rental business is high margin and spending is discretionary
4. Operating Cash Flow – Capex – Rental investment – R&D – Other
5. The figures presented on this slide are based on the management accounts
Comments
Stable cash flow generation, remaining steady through 2013-
15 despite a 68% fall in Nominal Revenues:
In 2016 OCF and FCF cash conversion increased to 75% and
20% respectively
– Tight cost control increasing margins, helping to preserve
EBITDA despite fall in top-line growth
– Strong track record of adjusting capex to manage cash
flows given strong pipeline visibility, shown through a 66%
reduction between 2013 - 2016
36
56
3220 2
27
34%37%
24%
14%
1%
20%
0%
20%
40%
$0
$40
$80
2011 2012 2013 2014 2015 2016
Free Cash Flow FCF Cash Conversion (%)
83106 103 95
62
101
77%71% 78%
66%
47%
75%
0%
20%
40%
60%
80%
100%
$0
$40
$80
$120
2011 2012 2013 2014 2015 2016
Operating Cash Flow OCF Cash Conversion (%)
18 2131
2314 1120 18 24
4932
60
$0
$20
$40
$60
$80
2011 2012 2013 2014 2015 2016
Capex Rental Investment3
2
2
29

Leverage ratios are compliant with Leverage Policy
According to the conditions of the Notes the Consolidated Net Leverage Ratio should not exceed 3 to 1 on an incurrence basis
For 2016 the Consolidated Net Leverage Ratio equals 2,6 with headroom of 13,3% to the covenant restriction value
Net Debt ($ mm) and Net Debt /EBITDA multiple
Net debt / EBITDA
Net debt
30
116,284,8
32,8
339,2 341,5385,6 367,8
0
100
200
300
400
500
2010 2011 2012 2013 2014 2015 2016
1,1
0,8
0,2
2,6
2,4
2,95
2,6

2013 2014 2015 2016
Total Debt ($ mm) 426.5 416.9 448.6* 400.6
Cash ($ mm) 87.4 75.5 63 32.8
Net Debt ($ mm) 339.1 341.4 385.6 367.8
EBITDA ($ mm) 131.3 144.2 130.6 141.6
Ratio (<3.0x) 2.58 2.37 2.95 2.60
Headroom (%) 13.9 21.1 1.6 13.3
Consolidated Net Leverage Ratio calculation
Debt ($ mm), Ratios / multiples & percentages
31
* Including NGML

Guarantors test
Net Assets and EBITDA (previous 12 months) of the Guarantors ($ mm)
According to the bond issuance documentation after the publication of the annual or interim financial statements the Guarantors undergo Guarantors Test, which implies compliance with the following:
- aggregate consolidated net assets after intragroup eliminations of the Guarantors comprises 80 % or more of the consolidated net assets of the Group
- EBITDA of the Guarantors comprises 80 % or more of the EBITDA of the Group
Guarantors Test2015 2016
Net Assets EBITDA Net Assets EBITDA
PK Borets 167.8 118.0 216.7 101.9
Borets US 61.9 -18.7 57.2 -5.6
OOO Lemaz 13.1 2.6 39.9 3.6
SK Borets 15.7 0.3 13.4 -2.3
Neftegazmash 6.8 16.0 40.2 28.7
Borets Canada 10.7 - 3.1 12.1 -1.5
ZTS-Kabel 9.1 3.1 18.3 0.9
Borets International Ltd Sucursal Colombia Branch - 2.2 - -
Borets International Ltd. (HQ) 137.8 - 3.2 121.9 -3.6
Consolidated 75.9 130.6 225.5 141.6
% of Consolidated 557% 90% 230% 86%
32

Capex
Capex calculation ($ mm)
Cash flows from investing activities 2013 2014 2015 2016
Purchase of PPE and IA 33.5 20.2 14.6 9.5
Development costs 8.0 7.5 4.8 5.3
Acquisition of subsidiaries 17.4 0.0 10.8 0.0
Divestments -9.5 -5.2 -1.2 -1.5
Total investing activities 49.4 22.5 29.0 13.3
33
Rental Capex presented in Operational activities
Period 2013 2014 2015 2016
Amount, $ mm29.5 45.9 33.4 70.9

Cash Holdings (1/3)
International vs. Russia Holdings ($ mm)
22,531,2
22,031,6
23,516,0
28,4
11,8
54,7
56,2
39,5
43,9
39,947,0
27,0
21,0
0
20
40
60
80
100
30-06-13 31-12-13 30-06-14 31-12-14 30-06-15 31-12-15 30-06-16 31-12-16
International Russia
32,8
34
77,2
87,4
61,5
75,5
63,4 63,0
55,4

Cash Holdings (2/3)
By Currency (US$ or RUB)
$63.0 mm $32.8 mm$75.5 mm$87.4 mm
4,2%10,5%
18,1%
6,4%
33,8%
36,3%
10,3%
47,0%
62,0%
53,2%
71,6%
46,6%
0%
20%
40%
60%
80%
100%
31-12-13 31-12-14 31-12-15 31-12-16
Other RUB USD
35

Cash Holdings (3/3)
by banks 31.12.2014* 31.12.2015* 31.12.2016* 31.12.2014 31.12.2015 31.12.2016
TOTAL 75.5 63.0 32.8 100% 100% 100%
Alef 35.8 10.1 6.3 47% 16% 19%
Nordea 7.9 5.3 - 10% 8% -
ING Group 20.5 36.4 18.5 27% 58% 57%
JPMorgan (USA) 3.2 1.0 1.1 4% 2% 3%
Banco Mercantil (VEN) 2.9 7.5 - 4% 12% -
HSBC 2.5 2.2 4.2 3% 3% 13%
Other 2.7 0.5 2.7 4% 1% 8%
* US $ millions
36

2013 2014 2015 2016
Trade Receivables ($ mm) 124.5 126.5 115.3 121.5
Impairment ($ mm) (2.2) (4.9) (14.7) (13.7)
Net ($ mm) 122.3 121.6 100.6 107.8
Others (net, $ mm) 7.9 8.2 1.5 1.5
Total ($ mm) 130.2 129.8 102.1 109.3
Days Receivable* (days) 62 66 71 83
Balance Sheet Items (1/2)
* Total Receivables ÷ (Sales Revenues/365)
Trade & Other Receivables
37

2013 2014 2015 2016
Inventories:
• Raw Materials ($ mm) 91.9 72.1 54.9 41.2
• W.I.P ($ mm) 20.2 16.0 6.3 10.7
• Goods for Sale ($ mm) 67.2 62.9 70.1 68.4
179.3 151.0 131.3 120.3
• Impairment ($ mm) (14.7) (13.9) (13.7) (14.2)
Total (net, $ mm) 164.6 137.2 117.6 106.1
Days Inventory* (days): 78 70 82 80
Balance Sheet Items (2/2)
* Total Inventory ÷ (Sales/365)
Inventories
38

Inventory + A/C Receivable - A/C Payable x 365 days
Cost of sales* Sales* Cost of Sales*
Сash Analyses (1/5)
a. Evolution of Cash Conversion Cycle (Days)
112
133
98
130 136 138 138
0
50
100
150
200
2013 / 12 2014 / 6 2014 / 12 2015 / 6 2015 / 12 2016 / 6 2016 / 12
Cash cycle
39
( * Last 12 months )

Сash Analyses (2/5)
b. Evolution of Operating Cycle (Days)
169
205
163
201186
213197
0
50
100
150
200
250
300
2013 / 12 2014 / 6 2014 / 12 2015 / 6 2015 / 12 2016 / 6 2016 / 12
Operating cycle
Inventory + A/C Receivable
Cost of sales* Sales*
40
( * Last 12 months )
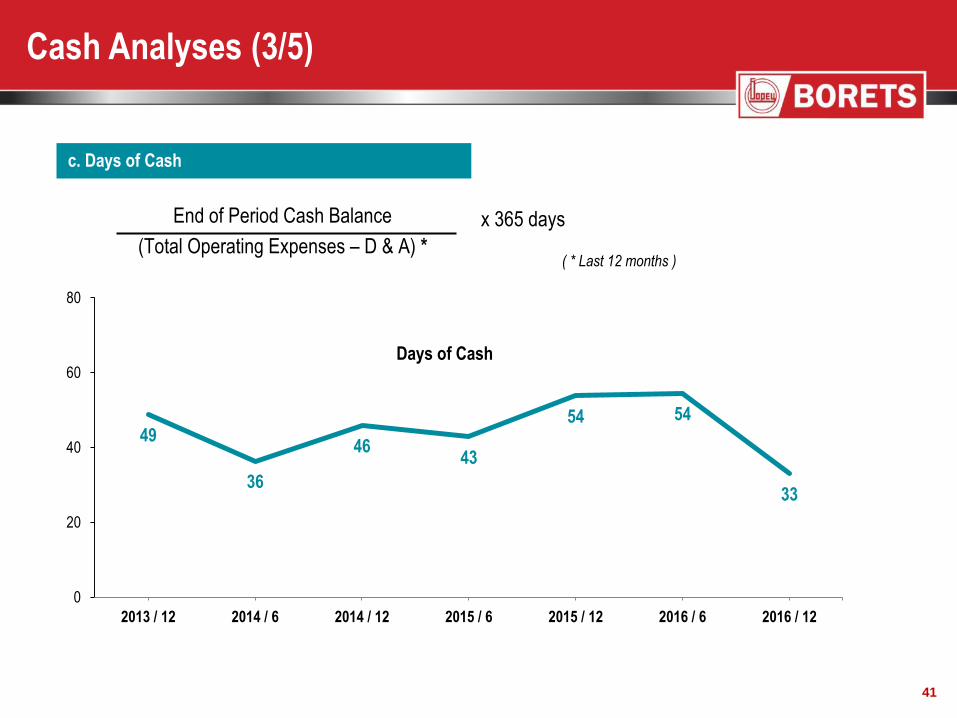
End of Period Cash Balance
(Total Operating Expenses – D & A) *
x 365 days
Сash Analyses (3/5)
c. Days of Cash
49
36
4643
54 54
33
0
20
40
60
80
2013 / 12 2014 / 6 2014 / 12 2015 / 6 2015 / 12 2016 / 6 2016 / 12
Days of Cash
41
( * Last 12 months )

Сash Analyses (4/5)
d. Current Ratio
3,08 3,082,84
3,012,7
2,14
2,56
0
1,5
3
4,5
2013 / 12 2014 / 6 2014 / 12 2015 / 6 2015 / 12 2016 / 6 2016 /12
Current Assets / Current Liabilities
42
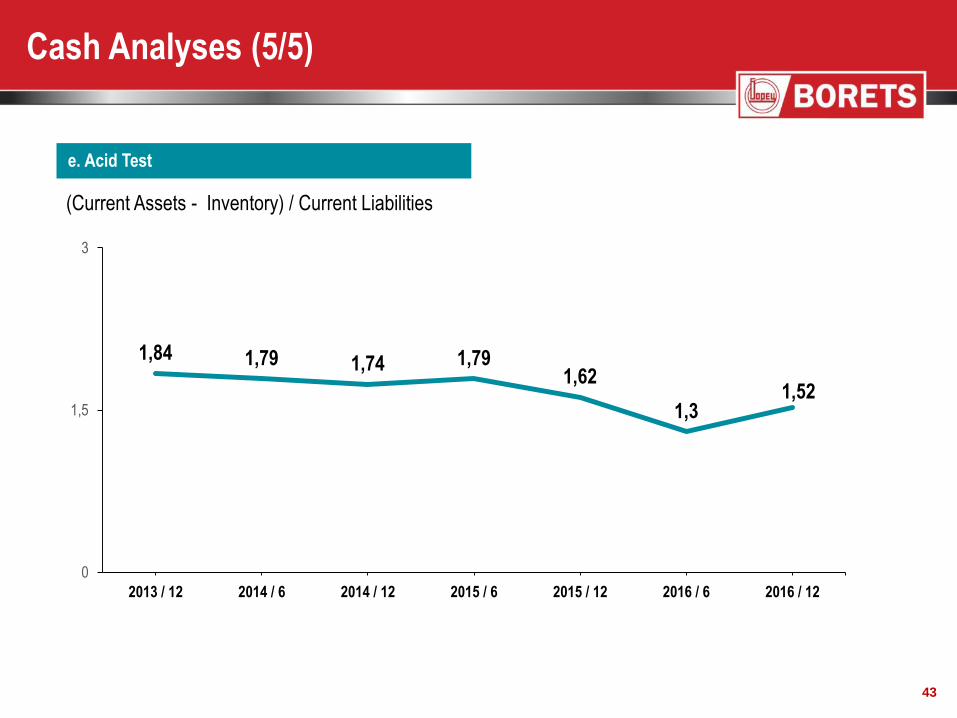
Сash Analyses (5/5)
e. Acid Test
1,84 1,79 1,74 1,791,62
1,31,52
0
1,5
3
2013 / 12 2014 / 6 2014 / 12 2015 / 6 2015 / 12 2016 / 6 2016 / 12
(Current Assets - Inventory) / Current Liabilities
43

Tight Control Over Net Working Capital (USDm)
172 165137
118 106
151 157
143
114122
-119 -119 -116
-78-92
-$150
-$100
-$50
$0
$50
$100
$150
$200
$250
$300
$350
2012 2013 2014 2015 2016
Inventories Accounts Receivables and Other current assets
Accounts payable and Other current liabilities Working Capital
44
Net W.C. $204m $203m $164m $154m $136m
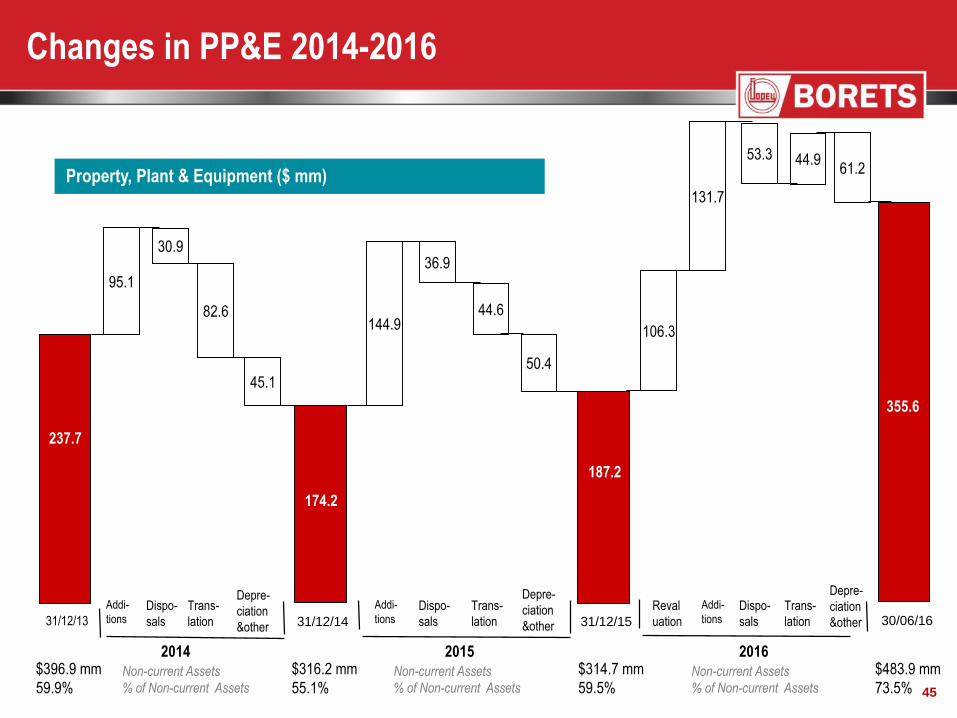
Changes in PP&E 2014-2016
$396.9 mm
59.9%
$316.2 mm
55.1%
$314.7 mm
59.5%
$483.9 mm
73.5% Non-current Assets
% of Non-current Assets
Non-current Assets
% of Non-current Assets
Non-current Assets
% of Non-current Assets 45
Property, Plant & Equipment ($ mm)
237.7
174.2
31/12/13 31/12/14
Addi-
tionsDispo-
sals
Trans-
lation
Depre-
ciation
&other
95.1
30.9
82.6
45.1
2014
187.2
31/12/15
144.9
36.9
44.6
50.4
2015
30/06/16
131.7
53.3 44.9
106.3
Addi-
tionsDispo-
sals
Trans-
lation
Depre-
ciation
&other
355.6
Addi-
tionsDispo-
sals
Trans-
lation
Depre-
ciation
&other
Reval
uation
61.2
2016

Five largest balances of accounts receivable of the
major counterparties:
2016 ($ mm) % of total AR Days Sales
Outstanding*
Rosneft group 42.5 39% 69
PDVSA group 6.9 6% n/a
Surgutneftegaz group 5.2 5% 57
Lukoil group 5.1 5% 55
Ecopetrol S.A. 4.1 4% 84
TOTAL 63.8 59%
Risk Management (1/3)
46
* Days Sales Outstanding (DSO) = (Accounts Receivable / Revenue) * 365

Contractual currency analysis of monetary assets and liabilities is as follows:
47
Currency Exchange Risk Analysis
31 December 2016
RUB USD EUR Other Total
USD’000 USD’000 USD’000 USD’000 USD’000
Financial assets
Trade and other receivables less prepayments 68,595 36,372 79 4,260 109,307
Cash and cash equivalents 15,402 15,976 (1,579) 2,994 32,793
Total financial assets 83,997 52,348 (1,500) 7,254 142,099
Financial liabilities
Loans and borrowings (3) (400,562) - - (400,565)
Trade and other payables less advances received (33,676) (15,090) (1,129) (4,597) (54,492)
Total financial liabilities (33,679) (415,652) (1,129) (4,597) (455,058)
Net position 50,318 (363,304) (2,629) 2,657 (312,958)
If the USD strengthened against the RUB, Euro and other currencies by 10%
then this would have the following impact:
30 Jun 2016 31 Dec 2015
USD’000 USD’000
Foreign currency
RUB (5,032) (230)
EUR 263 4
Other (266) (1,178)
Had the USD weakened against the RUB, Euro
and other currencies by 10% then this would
have the equal but opposite effect on the
amounts shown above given that all other
variables remained constant.
Risk Management (2/3)

48
Interest Rate Risk Analysis ($ mm)
Fixed rate instruments 2013 2014 2015 2016
Term deposits 32.9 24.6 41.4 5.3
Loans received (426.5) (416.9) (417.4) (400.6)
Total (393.6) (392.3) (376.0) (395.3)
Variable rate instruments
Loans received 0.0 0.0 (31.2) 0.0
Overdraft (3.0) (3.4) (3.4) (2.0)
TOTAL (3.0) (3.4) (34.6) (2.0)
Risk Management (3/3)
At the reporting date the interest rate profile of the Group’s interest bearing financial instruments was: