Presentation: Digability – A New Take on an Old Topic
25
Presentation: Digability – A New Take on an Old Topic Stephen Lochner MineWare Incorporated
Transcript of Presentation: Digability – A New Take on an Old Topic

Presentation:
Digability – A New Take on an Old Topic
Stephen LochnerMineWare Incorporated

Digability
1. History of Digability
2. Current Interpretation of Digability
3. How the Digability Index (DI) Metric is being used today
4. Future Possibilities of Digability

History of Digability
• Digability origins?– Equipment Selection
● English Surface Coal Mines in the 1970’s– Geological parameters:
● Weathering● Rock Strength● Joint Spacing● Bedding Space
History of Digability• Digability origins?
– Blasting Analysis and Machine Performance● Williamson & Mol in the 1980’s● Hendricks, Peck & Scobie in the 1990’s
– Correlating Drill Logs with Excavator Performance with Fragmentation Studies
– Where a “Diggability Index (DI) is calculated as the product of the ratios of total vertical signal lengths, for hoist armature voltage & current, to the area under these signals.”
– The DI is cross referenced to a fragmentation analysis to show a correlation

Current Interpretation The Digital / Computer improvements over the last decade has allowed for amazing ability of monitoring systems to:• Record accurate data for almost every aspect of
shovels & draglines• Make complex calculations within milliseconds of
cycle completion• Share and store all data on Machine, in Mine Office
and at Corporate Head Quarters for easy trending
Basic Equation
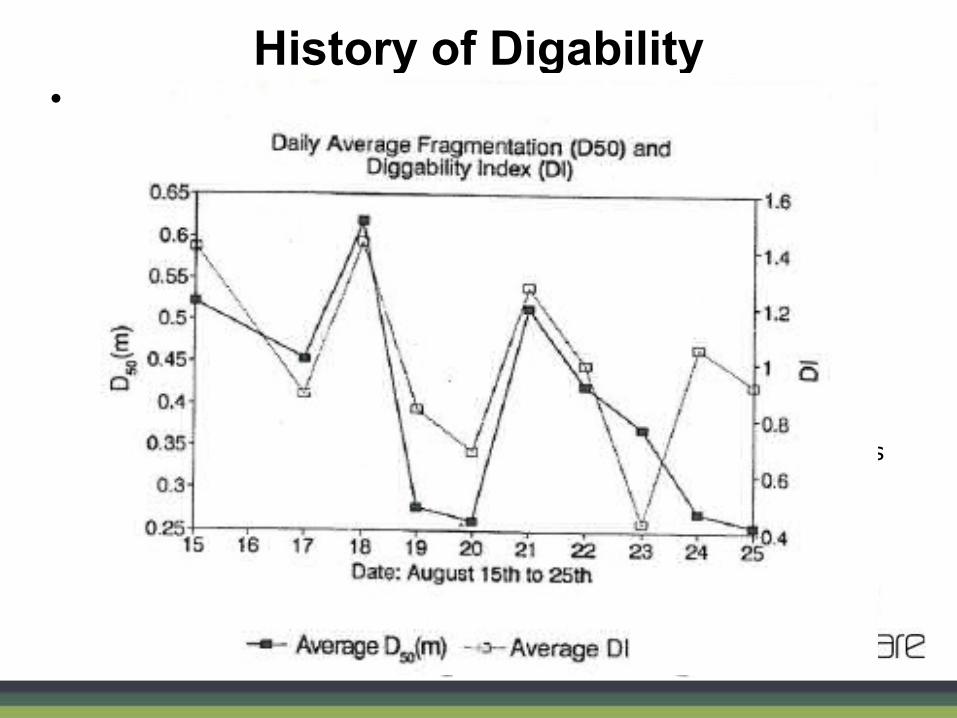
Today’s Usage Analysis & Plotting

Operator # Payload Fill TimeSwing Time
Return Time
Cycle Time
Swing Angle
Return Swing
Stress Index
Trk Payload Compliance
Production Rate
Fill Energy
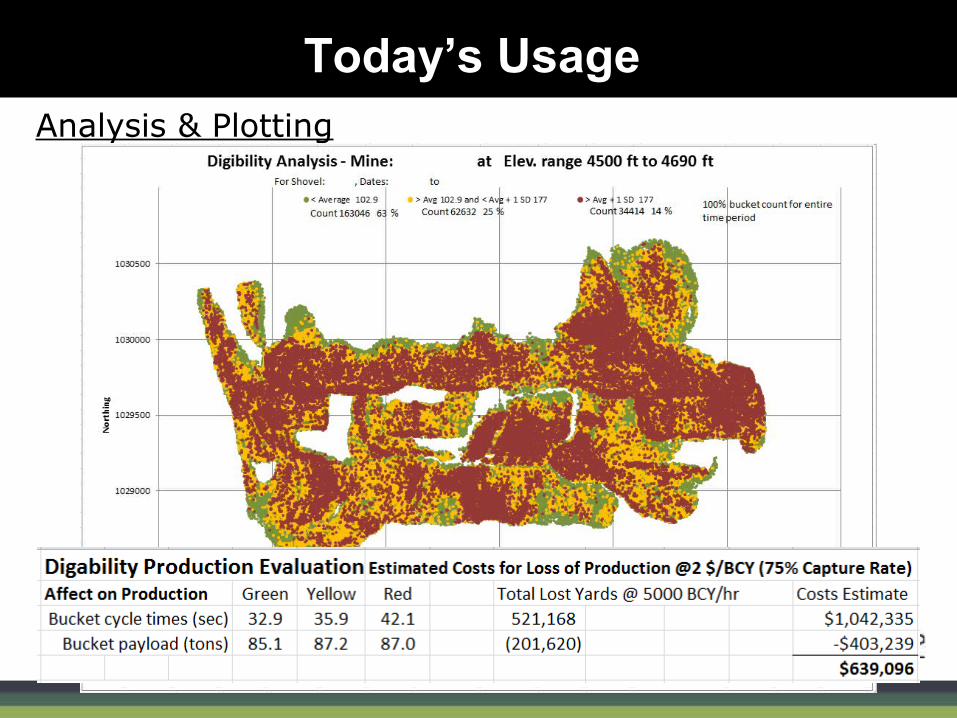
Average 86.8 9.6 7.5 15.7 35.6 39.0 -46.8 2251.0 94.4 6189 2557.4Avg + 1 S.D. 102.7 14.0 10.0 21.3 41.6 83.7 -99.6 2818.5 122.7 6731.4 3531.7
100 83.1 8.0 8.0 15.7 34.7 50.2 -55.8 2155.0 93.0 6090.0 2142.686 90.4 10.4 6.6 15.4 35.3 48.4 -60.0 2249.9 95.0 6517.0 2728.871 86.1 10.2 8.6 14.7 36.5 30.5 -36.8 2209.0 100.5 5997.0 2637.459 85.7 11.4 8.2 17.4 39.9 59.8 -69.9 2317.2 98.5 5206.0 3084.496 97.6 10.1 7.0 14.6 34.6 50.5 -62.5 2386.5 102.6 7169.0 2908.365 93.1 9.8 7.6 16.0 36.1 27.5 -34.3 2344.1 96.3 6522.0 2729.8
0 85.9 9.3 7.0 15.2 34.5 49.9 -59.4 2179.3 93.9 6334.0 2529.284 84.6 10.7 8.4 16.5 38.4 59.8 -69.9 2261.1 100.9 5606.0 2478.762 96.1 9.6 6.9 17.2 36.5 53.8 -67.9 2150.1 101.5 6687.0 2466.899 83.5 9.9 6.6 15.6 35.0 49.0 -60.4 2299.6 88.2 6069.0 2722.898 86.7 8.6 6.9 15.0 33.4 54.0 -66.5 2310.0 89.1 6607.0 2579.5
Operator # Payload Fill TimeSwing Time
Return Time
Cycle Time
Swing Angle
Return Swing
Stress Index
Trk Payload Compliance
Production Rate
Fill Energy
Average 86.8 9.6 7.5 15.7 35.6 39.0 -46.8 2251.0 94.4 6189 2557.4Avg + 1 S.D. 102.7 14.0 10.0 21.3 41.6 83.7 -99.6 2818.5 122.7 6731.4 3531.7
100 83.1 8.0 8.0 15.7 34.7 50.2 -55.8 2155.0 93.0 6090.0 2142.686 90.4 10.4 6.6 15.4 35.3 48.4 -60.0 2249.9 95.0 6517.0 2728.871 86.1 10.2 8.6 14.7 36.5 30.5 -36.8 2209.0 100.5 5997.0 2637.459 85.7 11.4 8.2 17.4 39.9 59.8 -69.9 2317.2 98.5 5206.0 3084.496 97.6 10.1 7.0 14.6 34.6 50.5 -62.5 2386.5 102.6 7169.0 2908.365 93.1 9.8 7.6 16.0 36.1 27.5 -34.3 2344.1 96.3 6522.0 2729.8
0 85.9 9.3 7.0 15.2 34.5 49.9 -59.4 2179.3 93.9 6334.0 2529.284 84.6 10.7 8.4 16.5 38.4 59.8 -69.9 2261.1 100.9 5606.0 2478.762 96.1 9.6 6.9 17.2 36.5 53.8 -67.9 2150.1 101.5 6687.0 2466.899 83.5 9.9 6.6 15.6 35.0 49.0 -60.4 2299.6 88.2 6069.0 2722.898 86.7 8.6 6.9 15.0 33.4 54.0 -66.5 2310.0 89.1 6607.0 2579.5
Today’s Usage Operator Digability Analysis
One Page Manager to One Number Manager

Today’s Usage Operator Digability Analysis
One Page Manager to One Number Manager
Today’s Usage Operator Digability Analysis
One Page Manager to One Number Manager

Today’s Usage Operator Digability Analysis
One Page Manager to One Number Manager

Today’s Usage Operator Digability Analysis
One Page Manager to One Number Manager

Today’s Usage Operator Digability Analysis
One Page Manager to One Number Manager

Today’s Usage
Plotting

Today’s Usage
Plotting

digability fill_energy gross_weight payload fill_time fill_length Delta_Fill stress_index
Average 315.23 13,053.10 215.38 139.39 10.17 57.36 12.37 12,799.15
Median 279.31 13,018.74 216.59 140.60 9.80 58.71 11.60 12,664.32
Stdev 230.70 2,439.19 21.42 21.42 1.56 11.23 7.68 2,391.66
Avg +Stdev 545.92 15,492.29 236.80 160.81 11.72 68.59 20.05 15,190.81
Avg - Stdev 84.53 10,613.91 193.97 117.98 8.61 46.14 4.69 10,407.50
Easier Digging Conditions
Digability

digability fill_energy gross_weight payload fill_time fill_length Delta_Fill stress_index
Average 315.23 13,053.10 215.38 139.39 10.17 57.36 12.37 12,799.15
Median 279.31 13,018.74 216.59 140.60 9.80 58.71 11.60 12,664.32
Stdev 230.70 2,439.19 21.42 21.42 1.56 11.23 7.68 2,391.66
Avg +Stdev 545.92 15,492.29 236.80 160.81 11.72 68.59 20.05 15,190.81
Avg - Stdev 84.53 10,613.91 193.97 117.98 8.61 46.14 4.69 10,407.50
Stress

Dragline Digability (IDX) Fill_EnergyGross_Weight
(TSL)(tons)Payload (tons) Fill_Time (sec) Fill_Length (ft) Fill_Height (ft) Stress_Index
Average 358.71 13,481.38 215.91 139.92 10.37 55.54 12.50 12,656.41
Median 320.71 13,552.72 217.53 141.54 10.10 56.40 10.99 12,461.80
Stdev 209.12 3,171.72 20.89 20.89 1.60 11.64 8.43 2,300.38
Average + STDEV 567.83 16,653.10 236.80 160.81 11.97 67.17 20.93 14,956.79
Average - STDEV 149.59 10,309.66 195.02 119.03 8.77 43.90 4.07 10,356.03
Digability

Dragline Digability (IDX) Fill_EnergyGross_Weight
(TSL)(tons)Payload (tons) Fill_Time (sec) Fill_Length (ft) Fill_Height (ft) Stress_Index
Average 358.71 13,481.38 215.91 139.92 10.37 55.54 12.50 12,656.41
Median 320.71 13,552.72 217.53 141.54 10.10 56.40 10.99 12,461.80
Stdev 209.12 3,171.72 20.89 20.89 1.60 11.64 8.43 2,300.38
Average + STDEV 567.83 16,653.10 236.80 160.81 11.97 67.17 20.93 14,956.79
Average - STDEV 149.59 10,309.66 195.02 119.03 8.77 43.90 4.07 10,356.03
Stress

Potential Areas for Improvement through Digability Evaluation
● Dipper/Bucket comparisons● Ground Engaging Tool Analysis● Operator Performance Measurement
● Drill & Blast Performance Measurement
● Improve Reliability● Reduced Maintenance Costs
● Improve Productivity● Measurable

Future Possibilities – Integration LASER Scanning (currently a pilot study)

Future Possibilities - Possible Integration of Fragmentation Software on front Cameras.
Camera

Future Possibilities - Possible Analysis of Fragmentation, Dig Rates and Blasting Costs

• DI is a more comprehensive metric that incorporates several aspects of a Shovel/Dragline operation that allows for an easy, single score comparison of:
● Operators ● Buckets & Dippers● Ground Engaging Tools (GET)● Hoist & Drag motors
• DI gives real feedback to the Drill & Blast crew. Hopefully turning a lagging indicator into a leading one.
Review – Digability Analysis Benefits

• Peabody Energy• Kemeny, Mofya, Kaunda & Lever, 2001, Improvements in Blast Fragmentation
Models Using Digital Image Processing• Hansen, 2001, Electric Rope Shovel Monitoring• Onederra, Brunton, Battista & Grace, 2004, ‘Shot to Shovel’ – Understanding
the Impact of Muckpile Conditions and Operator Proficiency on Instantaneous Shovel Productivity
• Bobo, Norton, Jeremy and Taylor, 2004, Split-Online Digital Image Analysis System to Quantify Particle Size for the Industrial Mineral Industry
• Hendricks, Peck, Scobie, 1991, Machine Performance Monitoring in Surface Mines
• Mol, Leung, 1987, Studies of Rock Fragmentation by Drilling & Blasting in Open Cut Mines
Acknowledgements & References

Thank you
Stephen Lochner
[email protected](m) +1 720 347 5308
www.mineware.com
Greg Ladewig
[email protected](m) +1 303 957 8065
North America
Australia & Africa Mark Connolly
[email protected](m) +61 408 604 267