Presentation CIOMS VIII
51
CIOMS VIII – What to expect and EMEA initiatives Mr François MAIGNEN, PharmD, MSc (Paris), MSc (London), GradStat Principal Scientific Administrator, EMEA (London) http://www.linkedin.com/in/francoismaignen
-
Upload
francois-maignen -
Category
Health & Medicine
-
view
751 -
download
1
Transcript of Presentation CIOMS VIII

CIOMS VIII – What to expect and EMEA initiatives
Mr François MAIGNEN, PharmD, MSc (Paris), MSc (London), GradStat
Principal Scientific Administrator, EMEA (London)
http://www.linkedin.com/in/francoismaignen

Conflicts of interests (1)
Over the past 5 years, no direct or indirect conflicts of interest.
(a) No financial interests in the pharmaceutical industry
(b) No work carried out for the pharmaceutical industry whether or not these activities have been subject to regular or occasional remuneration in cash or kind.
(c) No other links with pharmaceutical industry e.g. grants for study or research allocated by the industry, no fellowships or sponsorships endowed by pharmaceutical industry e.g. IT industry, manufacturing company, Directorship of recruitment agency.
Public declaration of interest available from the Agency.

Disclaimer (1)
The views and opinions expressed in the following PowerPoint slides are those of the individual presenter and should not be attributed to Drug Information Association, Inc. (“DIA”), its directors, officers, employees, volunteers, members, chapters, councils, Special Interest Area Communities or affiliates, or any organization with which the presenter is employed or affiliated.
These PowerPoint slides are the intellectual property of the individual presenter and are protected under the copyright laws of the United States of America and other countries. Used by permission. All rights reserved. Drug Information Association, DIA and DIA logo are registered trademarks or trademarks of Drug Information Association Inc. All other trademarks are the property of their respective owners.

Disclaimer (2)
This presentation also includes some of my views (my understanding) and not necessarily those of the CIOMS VIII (or any of its members).
Objectives of the presentation
• Understand the scope and objectives of CIOMS VIII• Understand the fundamental concepts and
terminology of signal detection• Understand the fundamental principles of the
quantitative methods, their advantages but also their limitations
• This knowledge helps to have a rationale approach to signal detection: integrating the quantitative methods with the traditional methods of PhV
• Incl. important points concerning decision making• Key EMEA initiatives

Increasing complexityIncreasing volume of information (more signals)PhV databases more and more complexElectronic reportingNew standards ICH E2B(R), M2, MedDRA, M5, ISO …).
Limited resources
Quantitative methods (PRR, BCPNN, MGPS, other descriptive methods).
SignalsResources /
Performances

• Added to the complexity– Scientific challenges and
elements of interpretation• Tightly linked to the (other)
pharmacovigilance activities• These changes have revealed
some strength but also deficiencies of our current systems– Lack of standardisation of
information– Lack of international standards
for some critical terminologies (medicinal products, active substances, …)
– Data quality issues (incl. level of documentation of the reports, presence and handling of duplicates, …)
– Handling of different languages
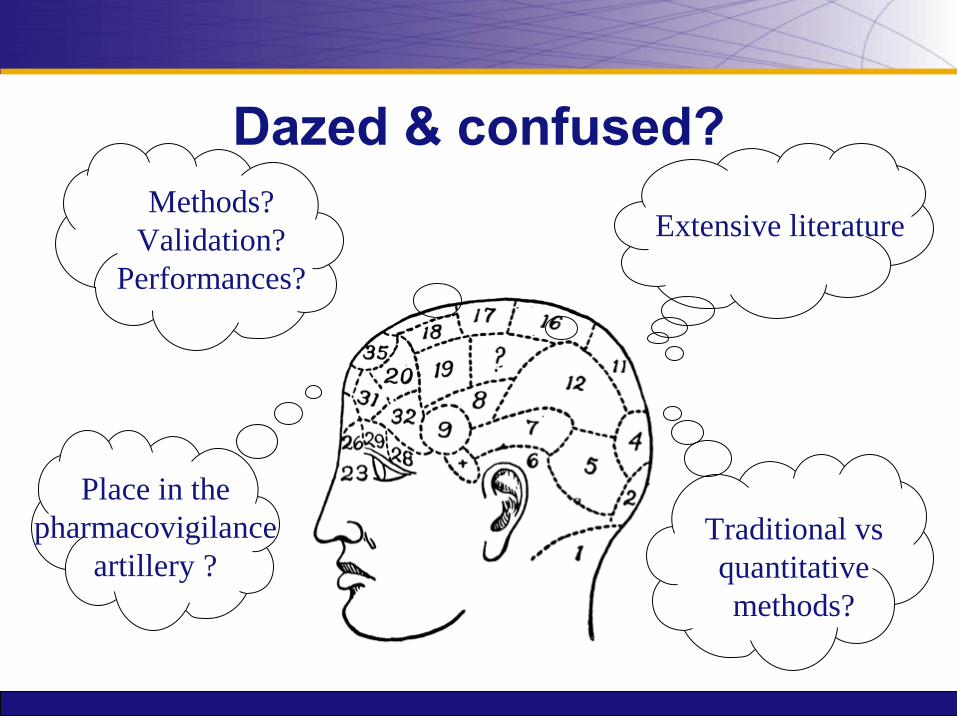
Dazed & confused?
Extensive literatureMethods?
Validation? Performances?
Place in the pharmacovigilance
artillery ?Traditional vs quantitative methods?

Lost?

The need for guidance
Some (regulatory) guidance has been published on signal detection activities, concerning the use of quantitative methods and extensive scientific literatureNot internationally recognised, database specific– Guidance for Industry – Good pharmacovigilance practices and
pharmacoepidemiologic assessment Food and Drug Administration March 2005
– White paper FDA-PhRMA on the PhV data mining (Drug Safety 2005)
– Guideline on the use of statistical methods in EV-DASThere is a need to have some clear, consensual and internationally agreed guidance on the elements to consider when doing signal detection

CIOMS VIII
Practical Aspects of Signal detection in PharmacovigilanceBetween 20-30 members: world-wide regulatory authorities (US, EU, JP, AU, CA), WHO, industry, software providers, Experts (non-affiliated).6 meetings: London, Geneva, WDC, Bonn, Paris.Dr June Raine (MHRA) Chief of the EB.The CIOMS VIII process is still ongoing and should be finished by 1Q2009.

Signal detection: a
complex multifactorial
process
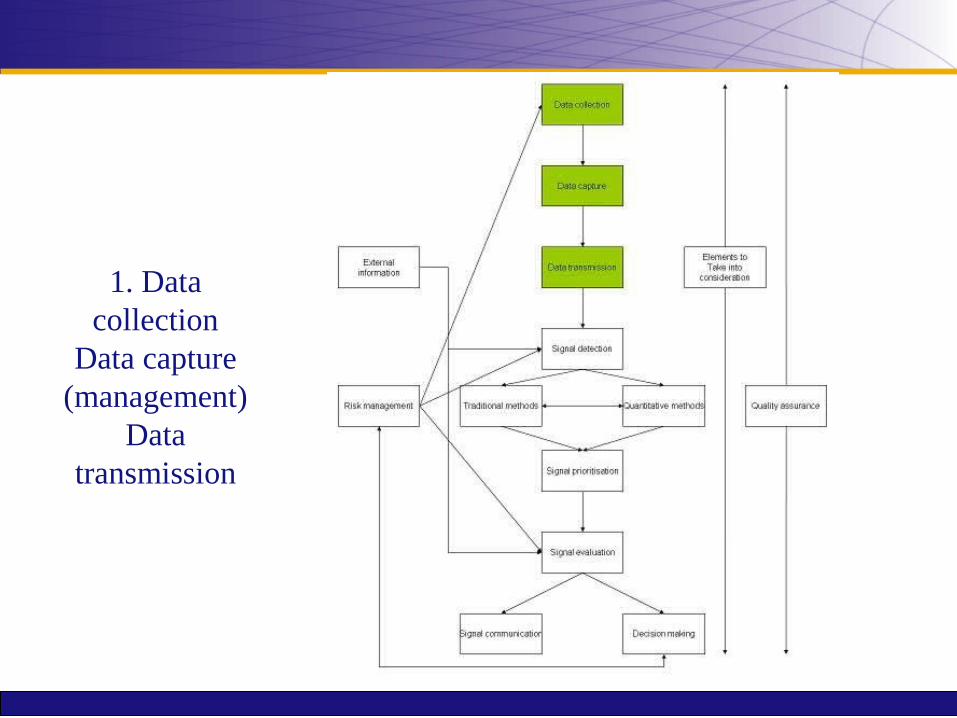
1. Data collection
Data capture (management)
Data transmission

2. Methods, signal
detection & data analysis

3. Signal management
(prioritisation, evaluation, decision &
communication)

4. Link with risk management

5. Quality assurance &
points to consider
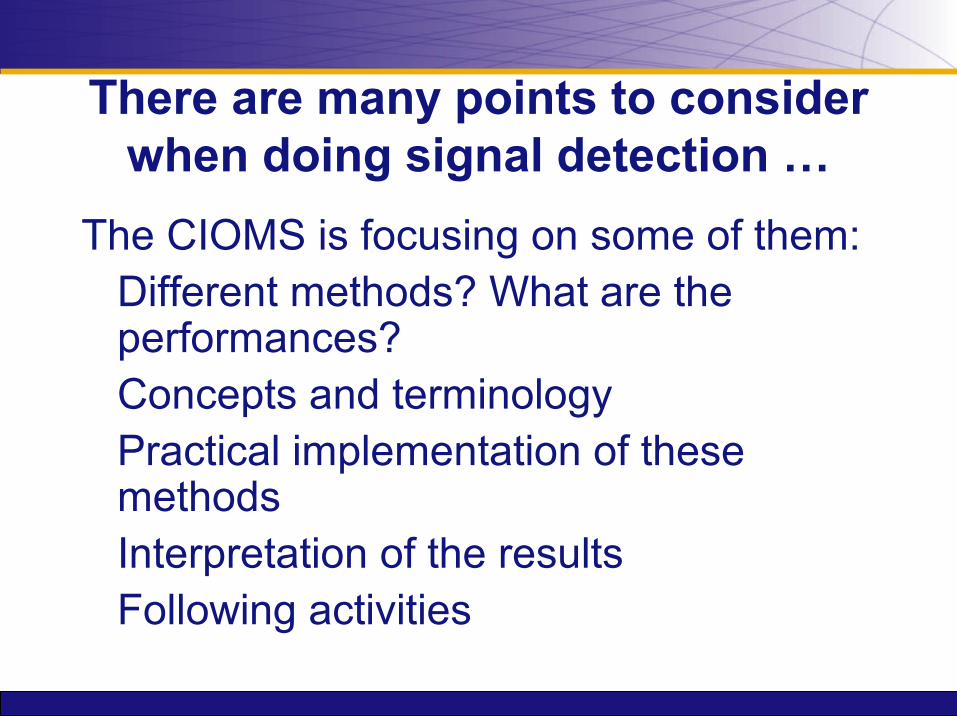
There are many points to consider when doing signal detection …
The CIOMS is focusing on some of them:Different methods? What are the performances?Concepts and terminologyPractical implementation of these methodsInterpretation of the resultsFollowing activities

1. Data capture and data management
Data capture and data management (1)
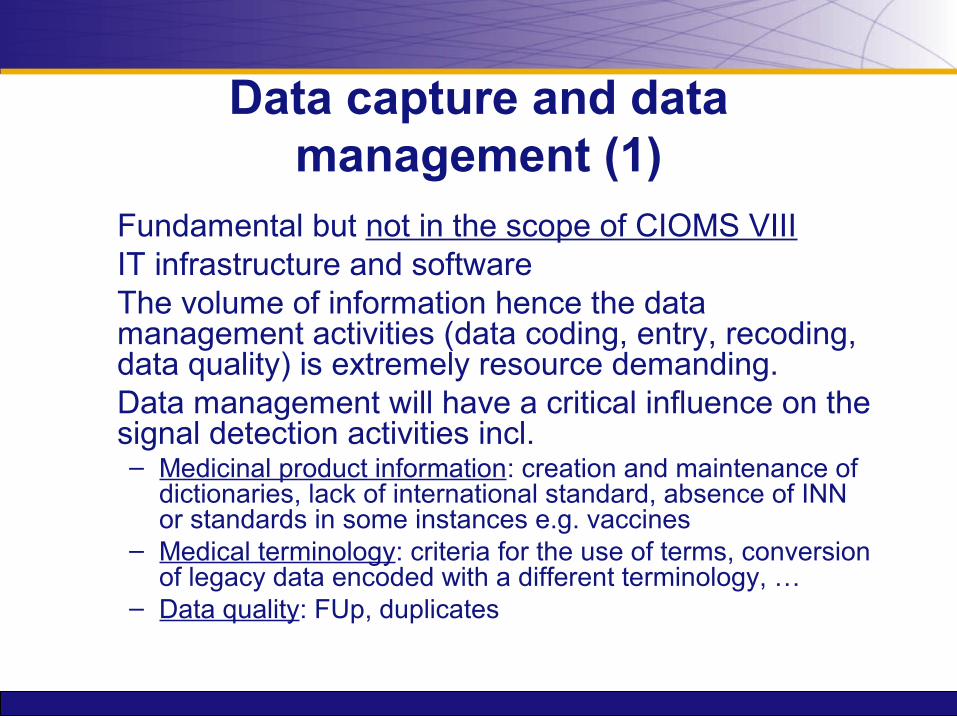
Fundamental but not in the scope of CIOMS VIIIIT infrastructure and softwareThe volume of information hence the data management activities (data coding, entry, recoding, data quality) is extremely resource demanding.Data management will have a critical influence on the signal detection activities incl.– Medicinal product information: creation and maintenance of
dictionaries, lack of international standard, absence of INN or standards in some instances e.g. vaccines
– Medical terminology: criteria for the use of terms, conversion of legacy data encoded with a different terminology, …
– Data quality: FUp, duplicates

2. Methods: “traditional” and quantitative methods

“Traditional” methods
Qualitative methods (opposed to quantitative)
Numerous data sources (SRS, RCTs, PASS, etc ..)
Mostly empirical based on more or less standardised scientific criteria (e.g. evaluation of case reports - Sir Bradford-Hill criteria)
Not validated? CURRENT STANDARD

Quantitative methods
Primarily designed for SRS databases: Disproportionality analysis.Drug-event pairs highlighted by the methods indicate a disproportionality of reporting (increased observed value compared to the expected value computed on the database, the drug-event pair is on average reported more often than the majority of the drug-event pairs in the database).The underlying principle of this method is that a drug –event pair is reported more often than expected relative to an independence model, based on the frequency of ICSRs on the reported drug and the frequency of ICSRs of a specific adverse event. The drug-event pairs highlighted by the different data mining algorithms are based on arbitrary thresholds and / or case count numbers defined by the user.For a same drug-event pair, the result of a DMA is DATABASE and TIME specific.One can find almost everything if the analysis is conducted on different sets of data in the same database.

Advantages of the quantitative methods
Operational viewpoint: allow a systematic screening of the database to identify new safety issues (better allocation of resources)Fairly easy to implement (for some of them)Public Health viewpoint:– Can identify some signals (not all) before “traditional”
methods of PhV (the reverse is also true)– The DMAs can identify signals which have not been picked
up by other methods (recent example is abacavir and didanosine and risk of myocardial infarction see Lancet 371: 1417 and 372: 805).
– Quantitative methods have not been sufficiently evaluated on a Public Health perspective.

Limitations of the quantitative methods
The concept of threshold implies that not all the reports will be reviewed and the quantitative methods will not detect all the signals (for which the data have been reported to the database on which the DMA is used)See Importance of reporting negative findings in data mining – the example of exenatide and pancreatitis Pharm Med 2008; 22(4): 215-219).

Limitations of the quantitative methods
Important to identify the information which must be reviewed systematically (without relying on the use of the quantitative methods)– TMEs: Targeted Medical Events (link with
Risk Management)– DMEs: Designated Medical Events– Important Medical Events / Serious
Medical Events.
Limitations of the quantitative methods
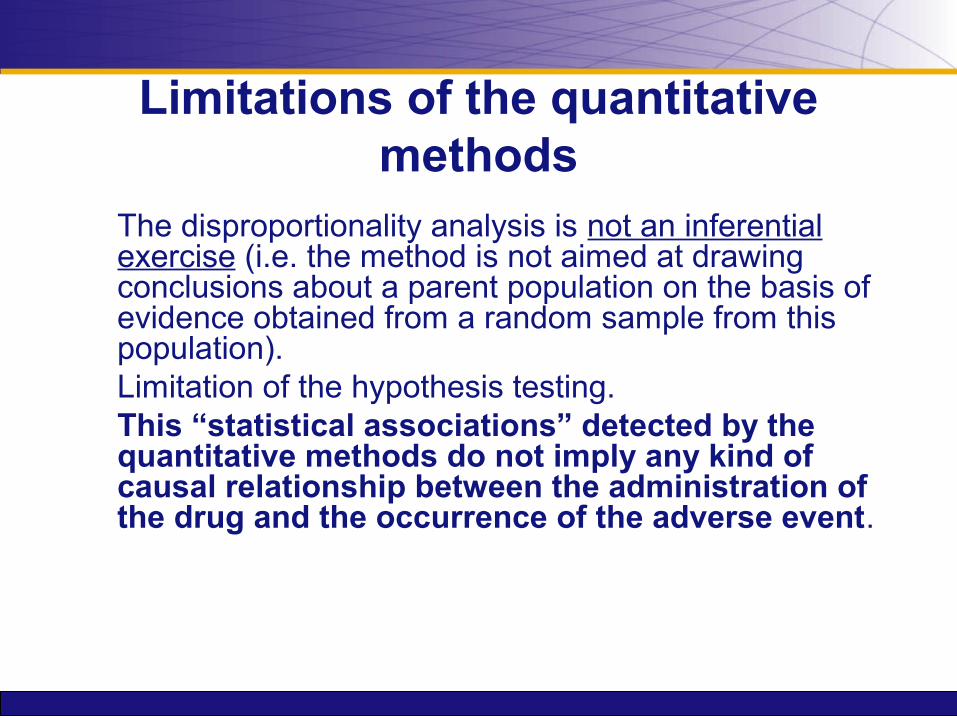
The disproportionality analysis is not an inferential exercise (i.e. the method is not aimed at drawing conclusions about a parent population on the basis of evidence obtained from a random sample from this population). Limitation of the hypothesis testing.This “statistical associations” detected by the quantitative methods do not imply any kind of causal relationship between the administration of the drug and the occurrence of the adverse event.

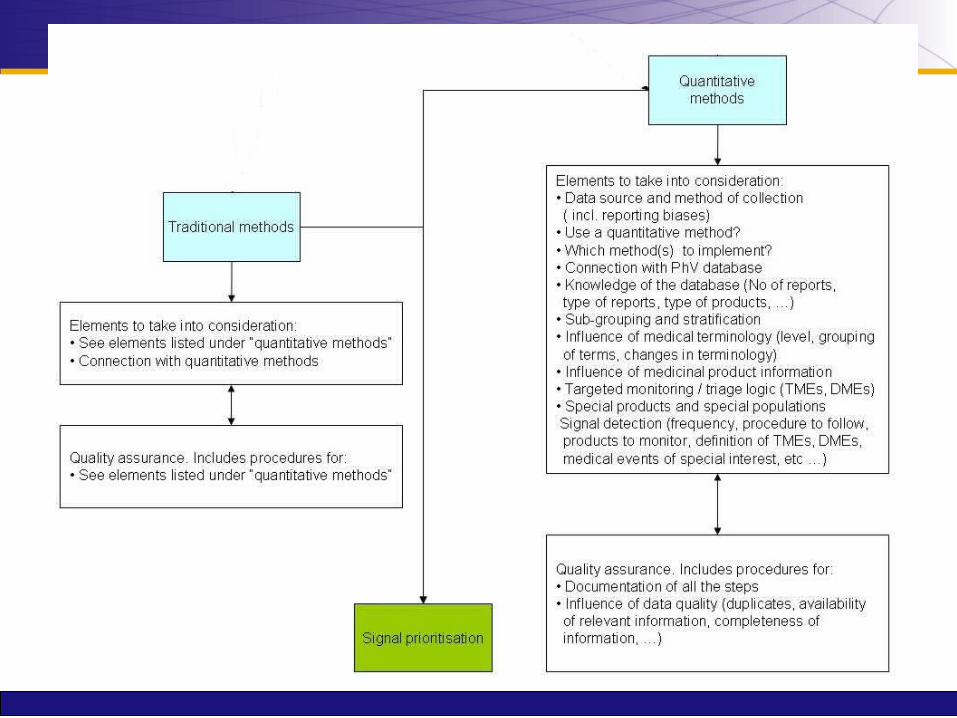
Elements to consider when integrating the two methods
Maximise the benefits of the quantitative methodsTake into consideration their limitations.The implementation of these methods is highly situation dependent (volume of reports and available resources, type of products, type of database, resources available, trade-off between true and false positive, number of false negative, etc …).


3. Signal detection, selection, evaluation and decision making

Importance of interpretation
Need to define precisely the primary objective of the searchWhen interpreting the results of DMAs it is important to bear in mind …– The limitations of the method of collection of data
(spontaneous reporting)– The background chosen to perform the analysis (e.g.
vaccines, EudraVigilance vs AERS / Vigibase)– The level / medical terms used to perform the analysis (e.g.
PT osteonecrosis, LLT: osteonecrosis of jaw)– The criteria used to identify the suspected medication
(medicinal product / active substance) (e.g. Methotrexate).– Use its medical judgement (which can hardly be
standardised in a guidance document)
Important concepts and corresponding terminology
Different concepts, different acronyms a great deal of confusionSignal of disproportionate reporting (SDR), Signal and Risk (established / theoretical).Many discussions AND no real consensus on the subject …
Different concepts / different definitions
SDR (signal of disproportionate reporting): refer to drug-event pairs highlighted by DMAs. (see EMEA guideline) NOTE: The term SIGNAL in SDR will not be retained by the CIOMS VIII.Signal: A signal is information on an adverse event that is new or incompletely documented that may have causal relationship to treatment and is recognized as being worthy of further explorations (see CIOMS VIII). The SDRs must be systematically medically confirmed.(Identified) Risk: An untoward occurrence for which there is adequate evidence of an association with the medicinal product of interest (see Guideline on risk management systems for medicinal products for human use EMEA/CHMP/96268/2005).

These concepts connect directly with the decision making process

DMADatabase (drug-events pairs)
SDRs
SIGNALSSIGNALS(other data sources)
Medical judgement
RISKS
Further evaluation / characterisation
Regulatory action
NO

I bet that the CIOMS IX, X, XI and LXI will come up with a new
(different) definition of a signal …

And there will be no consensus (again) …
The need for systematic evaluation / characterisation
The upgrade of some SDRs to the status of signals requires a medical judgement / evaluation.
The SDRs need to be medically confirmed.
The signals require further evaluation / characterisation.
No regulatory actions should be based only on the basis of the presence of a SDR.

Process flow included in the EMEA guideline on the use of statistical methods implemented in the EV data analysis system (EMEA/106464/06) July 2008.

Signal management
Similarly the CIOMS has identified an additional step which includes:
• Triage• Prioritisation and impact analysis (see
presentation from Philippe)• Evaluation• Decision• Communication (broad sense)• Follow-up• Link with risk management

5. EMEA initiatives (and future directions)

EMEA initiatives (1)
EudraVigilance and signal detection– Revised EMEA guideline on the use of statistical
signal detection published in July.– Finalisation of a performance study of the
quantitative methods implemented in EV-DAS.
– New Interface between EU-RMP and EudraVigilance (EU-RMP Annex 1) (VB interface).
– New approaches to signal detection.
Stratification
New development and functionalities to support signal detection activities scheduled in 2009 (adjustment for confounding and sub-grouping) (see latest Drug Safety)

EMEA initiatives (2)
EudraVigilance– Publication of the access policies and start
of the technical implementation.– Data management strengthened.– Involvement in the international
harmonisation activities (ICH) and standards development organisations (ISO, CEN, HL7).
EMEA initiatives (3)
Pharmacoepidemiology, active surveillance and R/B of medicines (incl. communication).– ENCEPP– IMI Call No 6 – PROTECT (strengthening
the benefit / risk of medicines in the EU)

6. Concluding remarks

Before we can fly …

Key points
Importance of concepts and terminology
Understand the methods, their strengths but also their limitations – optimum integration
Define the primary objectives of the search and take the time to interpret the results (i.e. don’t rush)
The guidance will clarify some important issues