
Presentación de PowerPoint - euskaltel.com · PLAN EXPANSIÓN NAVARRA –Hitos clave Test técnico...
23
Presentación de resultados 1Q18 3 de Mayo de 2018
Transcript of Presentación de PowerPoint - euskaltel.com · PLAN EXPANSIÓN NAVARRA –Hitos clave Test técnico...

Presentación de resultados1Q183 de Mayo de 2018

Presentación de resultados 1Q18
Disclaimer
This presentation (the "Presentation") has been prepared and is issued by, and is the sole responsibility of Euskaltel, S.A. ("Euskaltel" or "the Company"). For the purposes hereof, the Presentation shall mean and include the slides that follow, any prospectiveoral presentations of such slides by the Company, as well as any question-and-answer session that may follow that oral presentation and any materials distributed at, or in connection with, any of the above.
The information contained in the Presentation has not been independently verified and some of the information is in summary form. No representation or warranty, express or implied, is made by the Euskaltel Group (including Euskaltel, S.A., R Cable yTelecomunicaciones Galicia, S.A.U. and Parselaya, S.L.U. and its subsidiaries (Telecable Capital Holding, S.A.U. and Telecable de Asturias S.A.U.)), nor by their directors, officers, employees, representatives or agents as to, and no reliance should be placed on, thefairness, accuracy, completeness or correctness of the information or opinions expressed herein. None of Euskaltel Group, nor their respective directors, officers, employees, representatives or agents shall have any liability whatsoever (in negligence orotherwise) for any direct or consequential loss, damages, costs or prejudices whatsoever arising from the use of the Presentation or its contents or otherwise arising in connection with the Presentation, save with respect to any liability for fraud, and expresslydisclaim any and all liability whether direct or indirect, express or implied, contractual, tortious, statutory or otherwise, in connection with the accuracy or completeness of the information or for any of the opinions contained herein or for any errors, omissionsor misstatements contained in the Presentation.
Euskaltel cautions that this Presentation contains forward looking statements with respect to the business, financial condition, results of operations, strategy, plans and objectives of the Euskaltel Group. The words "believe", " expect", " anticipate", "intends", "estimate", "forecast", "project", "will", "may", "should" and similar expressions identify forward-looking statements. Other forward-looking statements can be identified from the context in which they are made. While these forward-looking statementsrepresent our judgment and future expectations concerning the development of our business, a certain number of risks, uncertainties and other important factors, including those published in our past and future filings and reports, including those with theSpanish Securities and Exchange Commission (“CNMV”) and available to the public both in Euskaltel’s website (www.euskaltel.com) and in the CNMV’s website (www.cnmv.es), as well as other risk factors currently unknown or not foreseeable, which may bebeyond Euskaltel’s control, could adversely affect our business and financial performance and cause actual developments and results to differ materially from those implied in the forward-looking statements. There can be no assurance that forward-lookingstatements will prove to be accurate, as actual results and future events could differ materially from those anticipated in such statements. Accordingly, readers should not place undue reliance on forward-looking statements due to the inherent uncertaintytherein.
The information contained in the Presentation, including but not limited to forward-looking statements, is provided as of the date hereof and is not intended to give any assurances as to future results. No person is under any obligation to update, complete,revise or keep current the information contained in the Presentation, whether as a result of new information, future events or results or otherwise. The information contained in the Presentation may be subject to change without notice and must not be reliedupon for any purpose.
Market and competitive position data in the Presentation have generally been obtained from industry publications and surveys or studies conducted by third-party sources. There are limitations with respect to the availability, accuracy, completeness andcomparability of such data. Euskaltel has not independently verified such data and can provide no assurance of its accuracy or completeness. Certain statements in the Presentation regarding the market and competitive position data are based on the internalanalyses of Euskaltel, which involve certain assumptions and estimates. These internal analyses have not been verified by any independent source and there can be no assurance that the assumptions or estimates are accurate. Accordingly, no undue relianceshould be placed on any of the industry, market or Euskaltel’s competitive position data contained in the Presentation.
You may wish to seek independent and professional advice and conduct your own independent investigation and analysis of the information contained in this Presentation and of the business, operations, financial condition, prospects, status and affairs of theEuskaltel Group. Euskaltel is not nor can it be held responsible for the use, valuations, opinions, expectations or decisions which might be adopted by third parties following the publication of this Presentation.
No one should purchase or subscribe for any securities in the Company on the basis of this Presentation. This Presentation does not constitute or form part of, and should not be construed as, (i) an offer, solicitation or invitation to subscribe for, sell or issue,underwrite or otherwise acquire any securities, nor shall it, or the fact of its communication, form the basis of, or be relied upon in connection with, or act as any inducement to enter into any contract or commitment whatsoever with respect to any securities;or (ii) any form of financial opinion, recommendation or investment advice with respect to any securities.
The distribution of this Presentation in certain jurisdictions may be restricted by law. Recipients of this Presentation should inform themselves about and observe such restrictions. Euskaltel disclaims any liability for the distribution of this Presentation by any ofits recipients.
By receiving or accessing to this Presentation you accept and agree to be bound by the foregoing terms, conditions and restrictions.
1

Presentación de resultados 1Q18 2
Hitos relevantes del primer trimestre de 2018
Estabilización del negocio residencial en nuestras tres regiones históricas (Euskadi,Galicia y Asturias)
Recuperación de los ingresos del segmento de empresa
Plan de expansión en línea con lo anunciado, suponiendo un crecimiento delcapex en el trimestre
Capex recurrente en 1Q18 < 17% de los ingresos
Crecimiento de EBITDA respecto al 1Q17 gracias a la consecución de las sinergias yeficiencias anunciadas

Principales magnitudes 1Q18 (datos estatutarios)
3 Presentación de resultados 1Q18
€176.6m+26.6% a/a
€84.2m+23.8% a/a
€50.3m+12.3% a/a
€14.6m+10.9% a/a
Ingresos totales
EBITDA AjustadoMargen EBITDA Ajust. 47.7%
OpCF1
Margen OpCF 28.5%2
Beneficio neto
576.0k+0.6k t/t
15.6%-182bps t/t
€60.4+0.6% t/t
2,349k+24.5k t/t
Clientes fijos
Ratio Churn
Global ARPU
Total RGUs
Datos financieros KPIs Residencial
Nota: 1. Cash Flow operativo calculado como EBITDA-capex2. Margen Cash Flow operativo excluyendo capex de expansión se situó en 31.5% de ingresos

Presentación de resultados 1Q18
Análisis Operativo
4
Nota: Todos los datos de 2017 que se muestran son proforma para incluir a Telecable

Residencial | Alcanzada la estabilización en clientes fijos
5Presentación de resultados 1Q18
Evolución de clientes fijos del segmento residencial (000’)
Altas netas procedentes de la expansión en Navarra:
+0.15592.9
575.4 576.0
(2.1)
(4.7)
(4.7)
(6.1)+0.6
EOP 4Q16 Altas netas 1Q17 Altas netas 2Q17 Altas netas 3Q17 Altas netas 4Q17 EOP 4Q17 Altas netas 1Q18 EOP 1Q18

6Presentación de resultados 1Q18
68.0% 3P/4P penetration
77.1% Mobile penetration
Residencial | Mejora del Churn en un mercado más racional
Churn clientes fijos residencial (% YTD) ARPU residencial (€/mes)
+0.6%
16.6%
15.9%
17.0%
17.5%
15.6%
1Q17 2Q17 3Q17 4Q17 1Q18
60.0 60.1 60.5 60.7 60.4
1Q17 2Q17 3Q17 4Q17 1Q18
Impacto negativo en el año: • Fútbol (0.4€)• Interconexión (0.1€)

Residencial | Crecimiento de ARPU por mayor convergencia y upselling
7Presentación de resultados 1Q18
Convergencia Banda Ancha Móvil TV de pago
68.6% Penetración 3P/4P
(+67pbs t/t)
85.4% Penetración BA
(+44pbs t/t)
78.9% Penetración móvil
(+177pbs t/t)
69.3% Penetración TV de pago
(+97pbs t/t)
RGUs2,349k
RGUs492k
RGUs933k
RGUs399k
(incluidos RGUs clientes “solo móvil”)

Empresa|Colaboraciones estratégicas para una oferta mejorada
8 Presentación de resultados 1Q18
ARPU negocios (€/mes)
Clientes fijos segmento negocios (000’) Evolución clientes pymes y grandes cuentas (#) Alianza estratégica con
Francisco Arteche (CEO Euskaltel) y Pilar López (Presidenta Microsoft España)
▪ Durante 1Q18 Euskaltel y Microsoft firmaron unacolaboración estratégica que nos permitirá liderar latransformación digital de nuestros clientes deempresa e institucionales, así como nuestra propiatransformación digital.
▪ Euskaltel y Microsoft trabajarán conjuntamentepara identificar soluciones innovadoras basadas entecnología cloud, inteligencia artificial, Big Data y elinternet de las cosas.
▪ Esta colaboración también contribuirá aincrementar el alcance de los servicios a nuestrosclientes.
69.3 69.0 69.0 69.1 68.3
1Q17 2Q17 3Q17 4Q17 1Q18
105 105 103 101 100
1Q17 2Q17 3Q17 4Q17 1Q18
Impacto negativo en el año: • Fútbol (0.5€)• Interconexión (0.2€)
14,963
14,670 14,728
(145)(56)
(74) (18)
+58
EOP 4Q16 Altas netas1Q17
Altas netas2Q17
Altas netas3Q17
Altas netas4Q17
EOP 4Q17 Altas netas1Q18
EOP 1Q18

Navarra | Nuestra presencia es una realidad
9 Presentación de resultados 1Q18
15/01/2018 28/02/2018
PLAN EXPANSIÓN NAVARRA – Hitos clave
✓ Test técnico
01/02/2018
✓ Test comercial
31/03/2018
FASE 1 FASE 2 FASE 3
Patrocinio del equipo de fútbol Osasuna
✓ Interconexión con la red de Orange
✓ CustomerRelationshipManagement (CRM) implementado
✓ Equipamiento de cliente compatible con la tecnología FTTH
Apertura primera tienda 28 de febrero
152Clientes activos
HOGARES ENTREGADOS A TRAVÉS DEL ACUERDO CON ORANGE
Lanzamiento de campaña comercial
Apertura de nuevos puntos de venta

Presentación de resultados 1Q18
Análisis Financiero
10
Nota: Todos los datos de 2017 que se muestran son proforma para incluir a Telecable

Evolución de ingresosEl crecimiento del segmento empresa compensa una menor base de clientes residencial en el año
11
Ingresos residencial (€m)Ingresos totales (€m)
77.1% Mobile penetration
0.0%
176.6
Presentación de resultados 1Q18
176.0 176.2 176.6 178.2
+0.4%Global ARPU fijo
8.7 8.8 9.1 10.3 11.0
48.1 47.9 47.0 48.8 49.3
119.1 119.5 120.5 119.1 116.3
1Q17 2Q17 3Q17 4Q17 1Q18
Wholesale & otros Empresa Residencial
119.1
116.3
(2.9)1.5 (0.2)
(0.7)(0.6)
1Q17 Menor base declientes fijos
ARPU telecomclientes fijos
Interconexión Fútbol Otros 1Q18

Evolución del EBITDAGestión continuada de costes
12 Presentación de resultados 1Q18
EBITDA ajust. (€m) y margen EBITDA ajust. (% sobre ingresos)
+0.3%
Evolución EBITDA ajustado 1Q18 vs 1Q17 (€m)
Host móvil+1.1
Contenidos TV +1.1
Tasa CRTVE(1.4)
Equipamiento de cliente(3.9)
Otros(1.1)
84.085.2
84.1
87.6
84.2
47.7%48.4%
47.6%
49.2%
47.7%
40,0%
42,0%
44,0%
46,0%
48,0%
50,0%
52,0%
54,0%
50,0
55,0
60,0
65,0
70,0
75,0
80,0
85,0
90,0
1Q17 2Q17 3Q17 4Q17 1Q18
84.0 84.2
+0.6 (4.2) +3.8
1Q17 Ingresos Costes Directos Comerciales ygenerales
1Q18
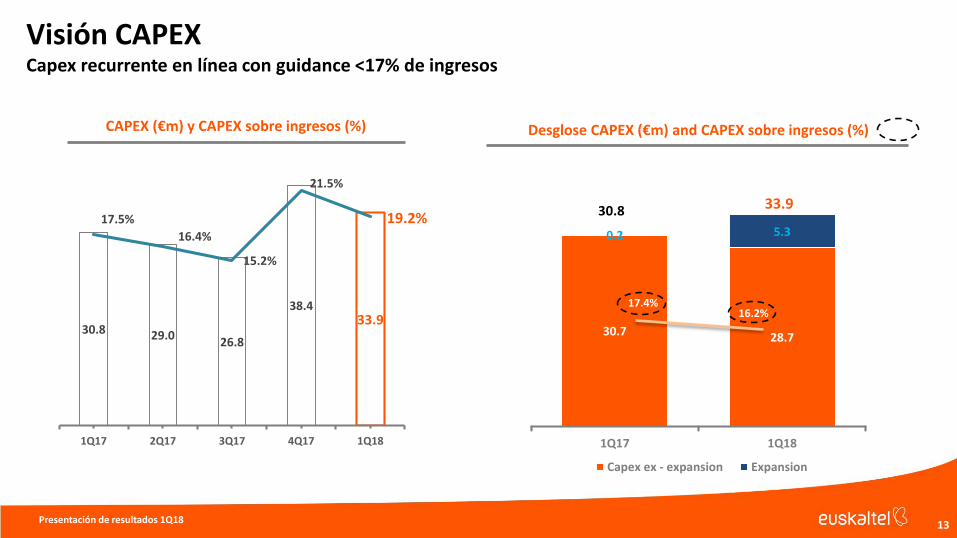
Visión CAPEXCapex recurrente en línea con guidance <17% de ingresos
13 Presentación de resultados 1Q18
0.0%
Desglose CAPEX (€m) and CAPEX sobre ingresos (%)CAPEX (€m) y CAPEX sobre ingresos (%)
30.8 33.9
30.8 29.026.8
38.433.9
17.5%
16.4%
15.2%
21.5%
19.2%
0,0%
5,0%
10,0%
15,0%
20,0%
0,0
5,0
10,0
15,0
20,0
25,0
30,0
35,0
40,0
1Q17 2Q17 3Q17 4Q17 1Q18
30.7 28.7
0.2 5.3
1Q17 1Q18
Capex ex - expansion Expansion
17.4%16.2%

Generación de caja
14 Presentación de resultados 1Q18
Generación de caja (€m)
4.5x
Deuda neta Deuda neta/EBITDA3 Coste promedio deuda Vencimiento medio
€1,605m 2.8%5.2
años
Nota:
1. Cash Flow operativo calculado como EBITDA-capex2. Cash Flow Libre calculado como ‘EBITDA-capex-necesidades de capital circulante&otros-intereses financieros-impuestos’ 3. Incluyendo la totalidad de las sinergias
53.2 56.3 57.349.2 50.3
30.2%31.9% 32.5%
27.6% 28.5%
0,0%
5,0%
10,0%
15,0%
20,0%
25,0%
30,0%
0,0
10,0
20,0
30,0
40,0
50,0
1Q17 2Q17 3Q17 4Q17 1Q18
OpCF1 (€m) y margen OpCF (% sobre ingresos)
Sobre ingresos (%)
13.7%
16.9% 17.4%
2
31.5% ex - expansion
29.8 30.7
24.3
(6.4)
22.7
FCF 1Q17 para elpago de deuda
FCF 1Q18 para elpago de deuda
Pagos no recurrentes FCF 1Q18 para elaccionista
Pago de Dividendos

Gracias

Q&A

Presentación de resultados 1Q18
Apéndice IResultados consolidados y KPIs del Grupo Euskaltel en 1Q18
Nota: las cuentas anuales del año 2017 incluyen datos de Telecable del 1 de agosto de 2017 al 31 de diciembre de 2017.
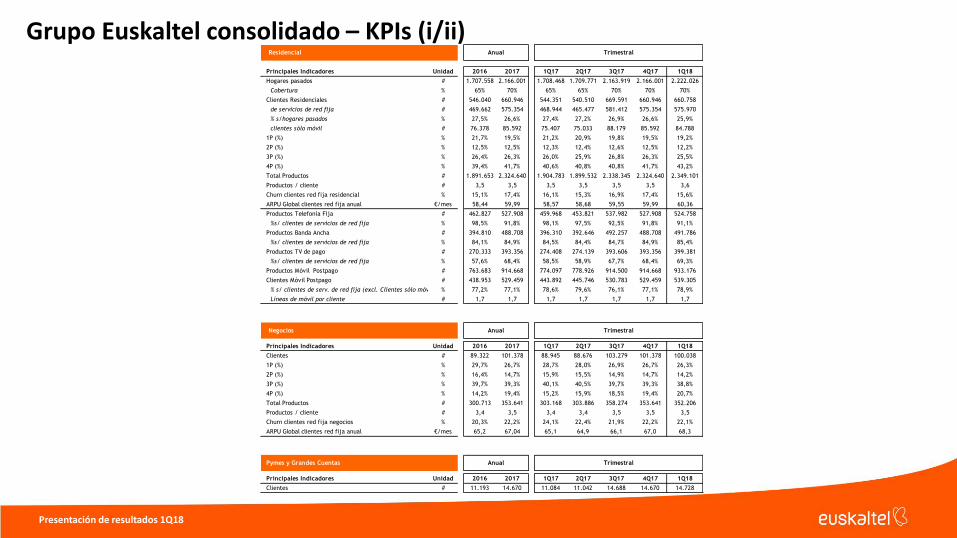
Grupo Euskaltel consolidado – KPIs (i/ii)
Presentación de resultados 1Q18
0.0%
Residencial
Principales Indicadores Unidad 2016 2017 1Q17 2Q17 3Q17 4Q17 1Q18
Hogares pasados # 1.707.558 2.166.001 1.708.468 1.709.771 2.163.919 2.166.001 2.222.026
Cobertura % 65% 70% 65% 65% 70% 70% 70%
Clientes Residenciales # 546.040 660.946 544.351 540.510 669.591 660.946 660.758
de servicios de red fija # 469.662 575.354 468.944 465.477 581.412 575.354 575.970
% s/hogares pasados % 27,5% 26,6% 27,4% 27,2% 26,9% 26,6% 25,9%
clientes sólo móvil # 76.378 85.592 75.407 75.033 88.179 85.592 84.788
1P (%) % 21,7% 19,5% 21,2% 20,9% 19,8% 19,5% 19,2%
2P (%) % 12,5% 12,5% 12,3% 12,4% 12,6% 12,5% 12,2%
3P (%) % 26,4% 26,3% 26,0% 25,9% 26,8% 26,3% 25,5%
4P (%) % 39,4% 41,7% 40,6% 40,8% 40,8% 41,7% 43,2%
Total Productos # 1.891.653 2.324.640 1.904.783 1.899.532 2.338.345 2.324.640 2.349.101
Productos / cliente # 3,5 3,5 3,5 3,5 3,5 3,5 3,6
Churn clientes red fija residencial % 15,1% 17,4% 16,1% 15,3% 16,9% 17,4% 15,6%
ARPU Global clientes red fija anual €/mes 58,44 59,99 58,57 58,68 59,55 59,99 60,36
Productos Telefonía Fija # 462.827 527.908 459.968 453.821 537.982 527.908 524.758
%s/ clientes de servicios de red fija % 98,5% 91,8% 98,1% 97,5% 92,5% 91,8% 91,1%
Productos Banda Ancha # 394.810 488.708 396.310 392.646 492.257 488.708 491.786
%s/ clientes de servicios de red fija % 84,1% 84,9% 84,5% 84,4% 84,7% 84,9% 85,4%
Productos TV de pago # 270.333 393.356 274.408 274.139 393.606 393.356 399.381
%s/ clientes de servicios de red fija % 57,6% 68,4% 58,5% 58,9% 67,7% 68,4% 69,3%
Productos Móvil Postpago # 763.683 914.668 774.097 778.926 914.500 914.668 933.176
Clientes Móvil Postpago # 438.953 529.459 443.892 445.746 530.783 529.459 539.305
% s/ clientes de serv. de red fija (excl. Clientes sólo móvil) % 77,2% 77,1% 78,6% 79,6% 76,1% 77,1% 78,9%
Líneas de móvil por cliente # 1,7 1,7 1,7 1,7 1,7 1,7 1,7
Negocios
Principales Indicadores Unidad 2016 2017 1Q17 2Q17 3Q17 4Q17 1Q18
Clientes # 89.322 101.378 88.945 88.676 103.279 101.378 100.038
1P (%) % 29,7% 26,7% 28,7% 28,0% 26,9% 26,7% 26,3%
2P (%) % 16,4% 14,7% 15,9% 15,5% 14,9% 14,7% 14,2%
3P (%) % 39,7% 39,3% 40,1% 40,5% 39,7% 39,3% 38,8%
4P (%) % 14,2% 19,4% 15,2% 15,9% 18,5% 19,4% 20,7%
Total Productos # 300.713 353.641 303.168 303.886 358.274 353.641 352.206
Productos / cliente # 3,4 3,5 3,4 3,4 3,5 3,5 3,5
Churn clientes red fija negocios % 20,3% 22,2% 24,1% 22,4% 21,9% 22,2% 22,1%
ARPU Global clientes red fija anual €/mes 65,2 67,04 65,1 64,9 66,1 67,0 68,3
Pymes y Grandes Cuentas
Principales Indicadores Unidad 2016 2017 1Q17 2Q17 3Q17 4Q17 1Q18
Clientes # 11.193 14.670 11.084 11.042 14.688 14.670 14.728
Anual
Anual
Anual
Trimestral
Trimestral
Trimestral
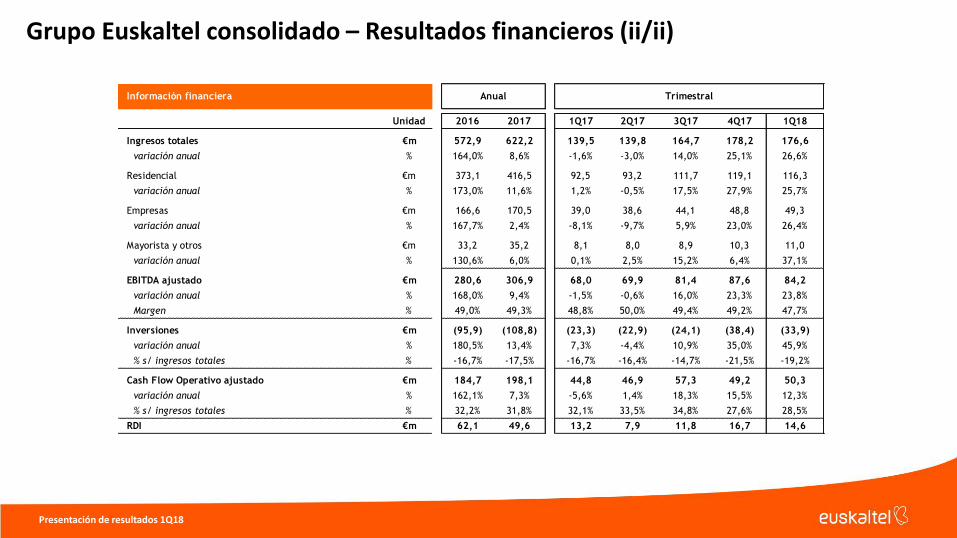
Grupo Euskaltel consolidado – Resultados financieros (ii/ii)
Presentación de resultados 1Q18
0.0%
Información financiera
Unidad 2016 2017 1Q17 2Q17 3Q17 4Q17 1Q18
Ingresos totales €m 572,9 622,2 139,5 139,8 164,7 178,2 176,6
variación anual % 164,0% 8,6% -1,6% -3,0% 14,0% 25,1% 26,6%
Residencial €m 373,1 416,5 92,5 93,2 111,7 119,1 116,3
variación anual % 173,0% 11,6% 1,2% -0,5% 17,5% 27,9% 25,7%
Empresas €m 166,6 170,5 39,0 38,6 44,1 48,8 49,3
variación anual % 167,7% 2,4% -8,1% -9,7% 5,9% 23,0% 26,4%
Mayorista y otros €m 33,2 35,2 8,1 8,0 8,9 10,3 11,0
variación anual % 130,6% 6,0% 0,1% 2,5% 15,2% 6,4% 37,1%
EBITDA ajustado €m 280,6 306,9 68,0 69,9 81,4 87,6 84,2
variación anual % 168,0% 9,4% -1,5% -0,6% 16,0% 23,3% 23,8%
Margen % 49,0% 49,3% 48,8% 50,0% 49,4% 49,2% 47,7%
Inversiones €m (95,9) (108,8) (23,3) (22,9) (24,1) (38,4) (33,9)
variación anual % 180,5% 13,4% 7,3% -4,4% 10,9% 35,0% 45,9%
% s/ ingresos totales % -16,7% -17,5% -16,7% -16,4% -14,7% -21,5% -19,2%
Cash Flow Operativo ajustado €m 184,7 198,1 44,8 46,9 57,3 49,2 50,3
variación anual % 162,1% 7,3% -5,6% 1,4% 18,3% 15,5% 12,3%
% s/ ingresos totales % 32,2% 31,8% 32,1% 33,5% 34,8% 27,6% 28,5%
RDI €m 62,1 49,6 13,2 7,9 11,8 16,7 14,6
Anual Trimestral

Presentación de resultados 1Q18
Apéndice IIResultados y KPIs proforma (para consolidación del año completo de Telecable)

Proforma (para consolidación del año completo de Telecable) – KPIs (i/ii)
Presentación de resultados 1Q18
0.0%
Residencial
Principales Indicadores Unidad 1Q17 2Q17 3Q17 4Q17 1Q18
Hogares pasados # 2.160.946 2.162.408 2.163.919 2.166.001 2.222.026
Cobertura % 70% 70% 70% 70% 70%
Clientes Residenciales # 679.432 675.130 669.591 660.946 660.758
de servicios de red fija # 590.764 586.094 581.412 575.354 575.970
% s/hogares pasados % 27,3% 27,1% 26,9% 26,6% 25,9%
clientes sólo móvil # 88.668 89.036 88.179 85.592 84.788
1P (%) % 19,7% 19,5% 19,8% 19,5% 19,2%
2P (%) % 12,5% 12,6% 12,6% 12,5% 12,2%
3P (%) % 27,4% 27,2% 26,8% 26,3% 25,5%
4P (%) % 40,4% 40,8% 40,8% 41,7% 43,2%
Total Productos # 2.358.696 2.356.503 2.338.345 2.324.640 2.349.101
Productos / cliente # 3,5 3,5 3,5 3,5 3,6
Churn clientes red fija residencial % 16,6% 15,9% 17,0% 17,5% 15,6%
ARPU Global clientes red fija anual €/mes 60,01 60,14 60,55 60,69 60,36
Productos Telefonía Fija # 557.948 550.424 537.982 527.908 524.758
%s/ clientes de servicios de red fija %
Productos Banda Ancha # 498.112 494.209 492.257 488.708 491.786
%s/ clientes de servicios de red fija %
Productos TV de pago # 397.641 396.182 393.606 393.356 399.381
%s/ clientes de servicios de red fija %
Productos Móvil Postpago # 904.995 915.688 914.500 914.668 933.176
Clientes Móvil Postpago # 529.069 533.501 530.783 529.459 539.305
% s/ clientes de serv. de red fija (excl. Clientes sólo móvil) % 74,5% 75,8% 76,1% 77,1% 78,9%
Líneas de móvil por cliente # 1,7 1,7 1,7 1,7 1,7
Negocios
Principales Indicadores Unidad 1Q17 2Q17 3Q17 4Q17 1Q18
Clientes # 105.281 104.757 103.279 101.378 100.038
1P (%) % 27,8% 27,2% 26,9% 26,7% 26,3%
2P (%) % 15,3% 14,9% 14,9% 14,7% 14,2%
3P (%) % 40,2% 40,5% 39,7% 39,3% 38,8%
4P (%) % 16,7% 17,4% 18,5% 19,4% 20,7%
Total Productos # 361.257 361.797 358.274 353.641 352.206
Productos / cliente # 3,4 3,5 3,5 3,5 3,5
Churn clientes red fija negocios % 24,2% 22,7% 22,1% 22,3% 22,1%
ARPU Global clientes red fija anual €/mes 69,3 69,0 69,0 69,1 68,3
Pymes y Grandes Cuentas
Principales Indicadores Unidad 1Q17 2Q17 3Q17 4Q17 1Q18
Clientes # 14.818 14.762 14.688 14.670 14.728
Trimestral
Trimestral
Trimestral

Proforma (para consolidación del año completo de Telecable) – Financieros (ii/ii)
Presentación de resultados 1Q18
0.0%
Información financiera
Unidad 1Q17 2Q17 3Q17 4Q17 1Q18
Ingresos totales €m 176,0 176,2 176,6 178,2 176,6
variación anual % -1,0% -1,9% -1,6% 0,0% 0,4%
Residencial €m 119,1 119,5 120,5 119,1 116,3
variación anual % 1,8% 0,2% 0,1% -0,2% -2,4%
Empresas €m 48,1 47,9 47,0 48,8 49,3
variación anual % -6,5% -7,1% -7,0% 0,4% 2,5%
Mayorista y otros €m 8,7 8,8 9,1 10,3 11,0
variación anual % -5,0% -0,3% 5,2% 1,2% 26,5%
EBITDA ajustado €m 84,0 85,2 84,1 87,6 84,2
variación anual % -1,8% -1,9% -2,3% 0,9% 0,3%
Margen % 47,7% 48,4% 47,6% 49,2% 47,7%
Inversiones €m (30,8) (29,0) (26,8) (38,4) (33,9)
variación anual % 4,9% -0,3% -5,8% 12,0% 10,1%
% s/ ingresos totales % -17,5% -16,4% -15,2% -21,5% -19,2%
Cash Flow Operativo ajustado €m 53,2 56,3 57,3 49,2 50,3
variación anual % -5,4% -2,7% -0,6% -6,4% -5,4%
% s/ ingresos totales % 30,2% 31,9% 32,5% 27,6% 28,5%
Trimestral