
Presentación de PowerPoint/media/Files/I/Iam-Corp/...IX Región / Temuco Aguas Araucanía R.M. /...
22
Corporate Presentation October 2018 AGUAS ANDINAS
Transcript of Presentación de PowerPoint/media/Files/I/Iam-Corp/...IX Región / Temuco Aguas Araucanía R.M. /...
Corporate Presentation
October 2018
AGUAS ANDINAS
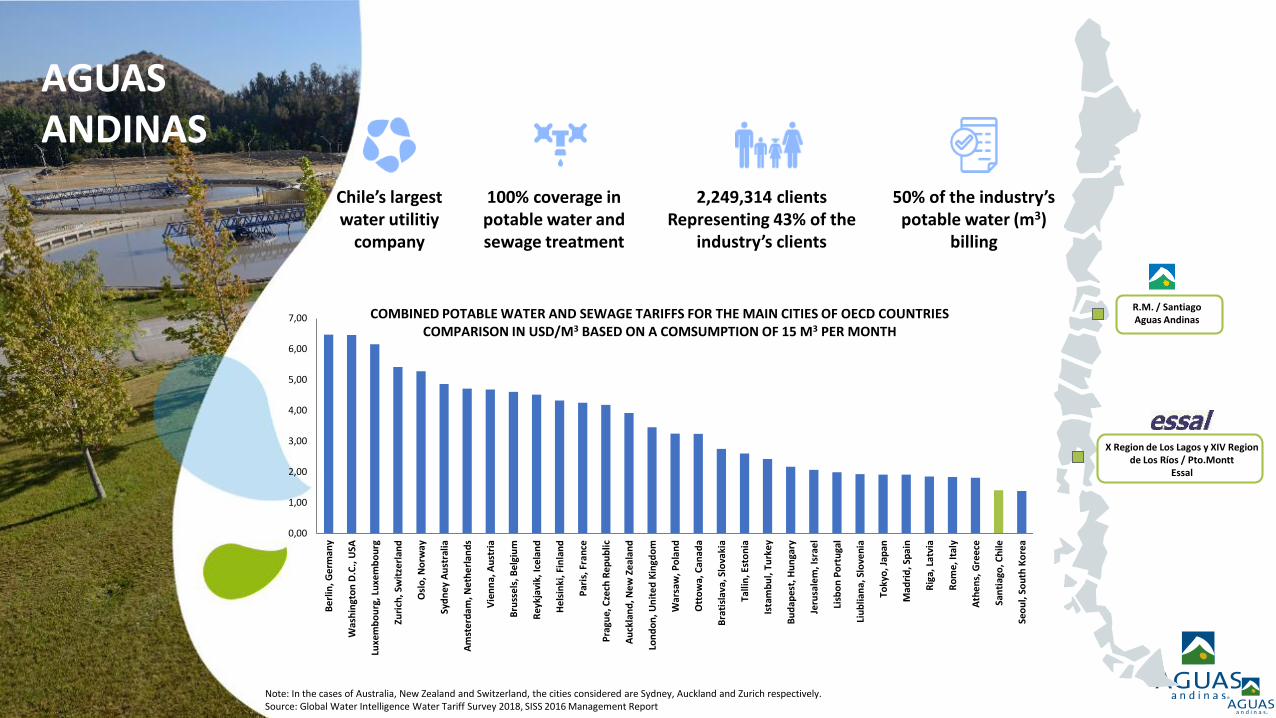
AGUAS ANDINAS
Chile’s largest water utilitiy
company
100% coverage in potable water and sewage treatment
2,249,314 clientsRepresenting 43% of the
industry’s clients
50% of the industry’s potable water (m3)
billing
R.M. / SantiagoAguas Andinas
X Region de Los Lagos y XIV Regionde Los Ríos / Pto.Montt
Essal
Note: In the cases of Australia, New Zealand and Switzerland, the cities considered are Sydney, Auckland and Zurich respectively.Source: Global Water Intelligence Water Tariff Survey 2018, SISS 2016 Management Report
0,00
1,00
2,00
3,00
4,00
5,00
6,00
7,00B
erl
in, G
erm
any
Was
hin
gto
n D
.C.,
USA
Luxe
mb
ou
rg, L
uxe
mb
ou
rg
Zuri
ch, S
wit
zerl
and
Osl
o, N
orw
ay
Syd
ney
Au
stra
lia
Am
ste
rdam
, Net
he
rlan
ds
Vie
nn
a, A
ust
ria
Bru
sse
ls, B
elg
ium
Rey
kjav
ik, I
cela
nd
He
lsin
ki, F
inla
nd
Par
is, F
ran
ce
Pra
gue,
Cze
ch R
ep
ub
lic
Au
ckla
nd
, Ne
w Z
eal
and
Lon
do
n, U
nit
ed
Kin
gdo
m
War
saw
, Po
lan
d
Ott
ow
a, C
anad
a
Bra
tisl
ava,
Slo
vaki
a
Talli
n, E
sto
nia
Ista
mb
ul,
Tu
rke
y
Bu
dap
est,
Hu
nga
ry
Jeru
sale
m, I
srae
l
Lisb
on
Po
rtu
gal
Liu
blia
na,
Slo
ven
ia
Toky
o, J
apan
Mad
rid
, Sp
ain
Rig
a, L
atvi
a
Ro
me,
Ital
y
Ath
en
s, G
ree
ce
San
tiag
o, C
hile
Seo
ul,
Sou
th K
ore
a
COMBINED POTABLE WATER AND SEWAGE TARIFFS FOR THE MAIN CITIES OF OECD COUNTRIESCOMPARISON IN USD/M3 BASED ON A COMSUMPTION OF 15 M3 PER MONTH
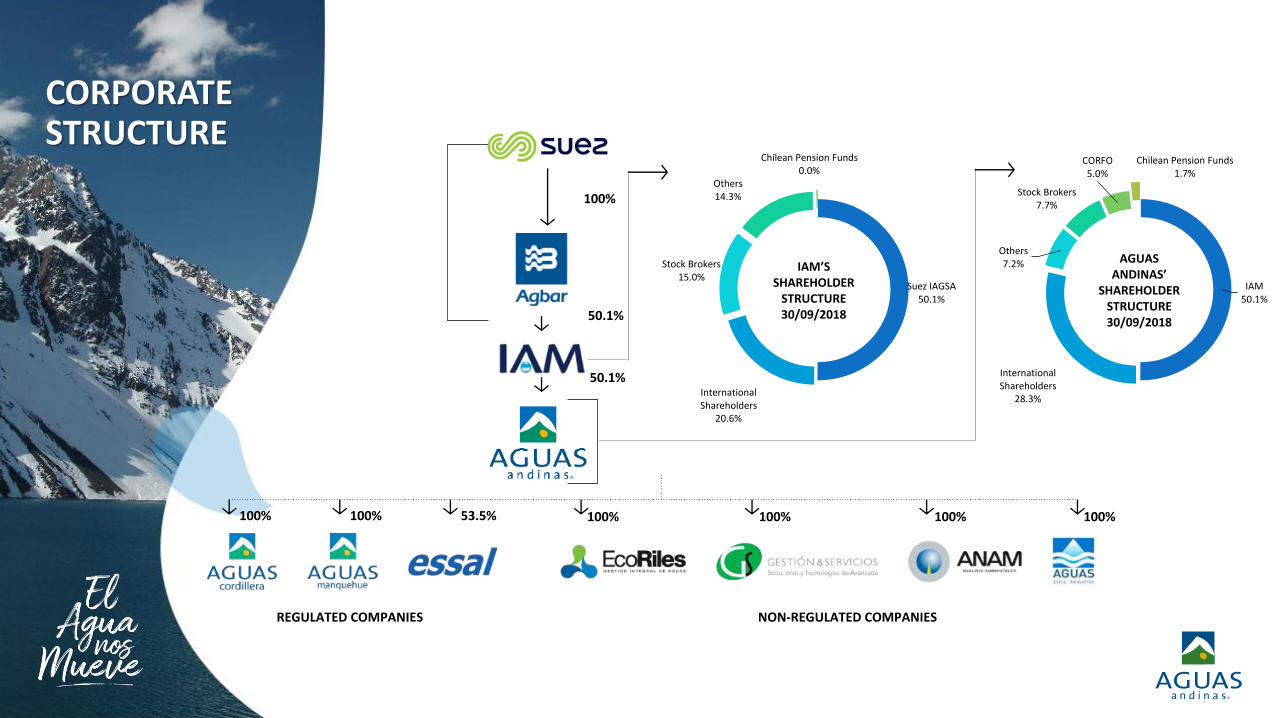
CORPORATE STRUCTURE
Suez IAGSA50.1%
International Shareholders
20.6%
Stock Brokers15.0%
Others14.3%
Chilean Pension Funds0.0%
IAM50.1%
International Shareholders
28.3%
Others7.2%
Stock Brokers7.7%
CORFO5.0%
Chilean Pension Funds1.7%
AGUAS ANDINAS’
SHAREHOLDER STRUCTURE30/09/2018
100%
50.1%
100%
50.1%
100% 100%53.5% 100%100% 100%
REGULATED COMPANIES NON-REGULATED COMPANIES
IAM’S SHAREHOLDER
STRUCTURE30/09/2018

HEMOS SIDO PARTE
DE UN IMPORTANTE
DESAFÍO PAÍS Vision Go beyond water, managing resources sustainably.
We are dedicated to our clients 24 hours a day.
We manage the underground city in order to guaranteethe continuity of our services.
We deliver quality water and transform residues intoresources.
We create shared value with our surroundings.
We are committed with the quality life of people and thedevelopment of the country.
Excellence - Co-creation - Shared value – Commitment -Talent - Sustainability.
Mission
Values

Business Model
Resilience
Digitalization
Circular Economy
Social Legitimacy
Innovation and People
Water and Quality of Life
STRATEGY
THE BEST FOR
SANTIAGO
SANTIAGO DESERVES AN A+

• Transform its sewagetreatment plants intobiofactories
• Reuse 100% of residues and transform them into energy fortheir production.
• Drastically reduce its carbonfoot print and that of thecountry.
• Aguas Andinas and itssubsidiaries are contributing to the country, through 15 of the17 Sustainable DevelopmentGoals.
• The SDGs were suscribed to bythe Chilean Government as a guide in sustainabledevelopment matters.
ALIGNED WITH THE SUSTAINABLE DEVELOPMENT GOALS

TEXTOREGULATORY FRAMEWORK
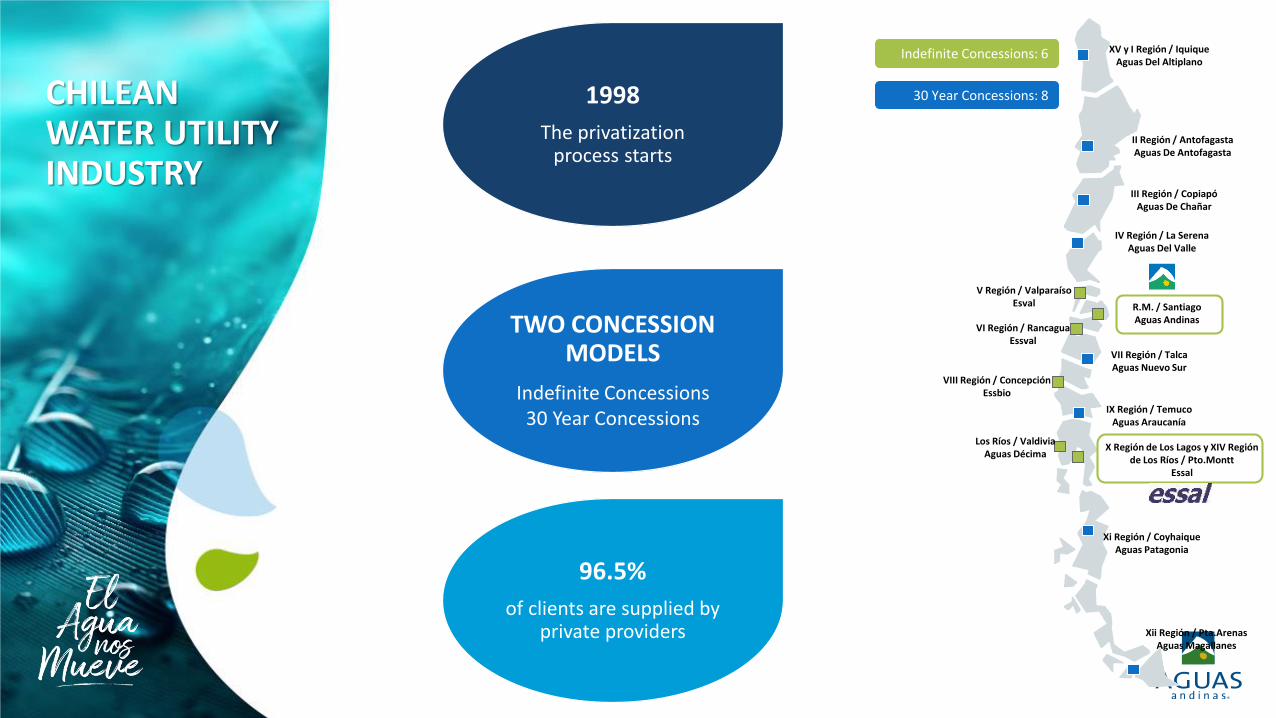
CHILEAN WATER UTILITY INDUSTRY
1998
The privatization process starts
TWO CONCESSIONMODELS
Indefinite Concessions30 Year Concessions
96.5%
of clients are supplied byprivate providers
30 Year Concessions: 8
Indefinite Concessions: 6
VIII Región / ConcepciónEssbio
Xii Región / Pta.ArenasAguas Magallanes
XV y I Región / IquiqueAguas Del Altiplano
V Región / ValparaísoEsval
VI Región / RancaguaEssval
VII Región / TalcaAguas Nuevo Sur
Los Ríos / ValdiviaAguas Décima
Xi Región / CoyhaiqueAguas Patagonia
II Región / Antofagasta Aguas De Antofagasta
III Región / CopiapóAguas De Chañar
IV Región / La SerenaAguas Del Valle
IX Región / TemucoAguas Araucanía
R.M. / SantiagoAguas Andinas
X Región de Los Lagos y XIV Región de Los Ríos / Pto.Montt
Essal
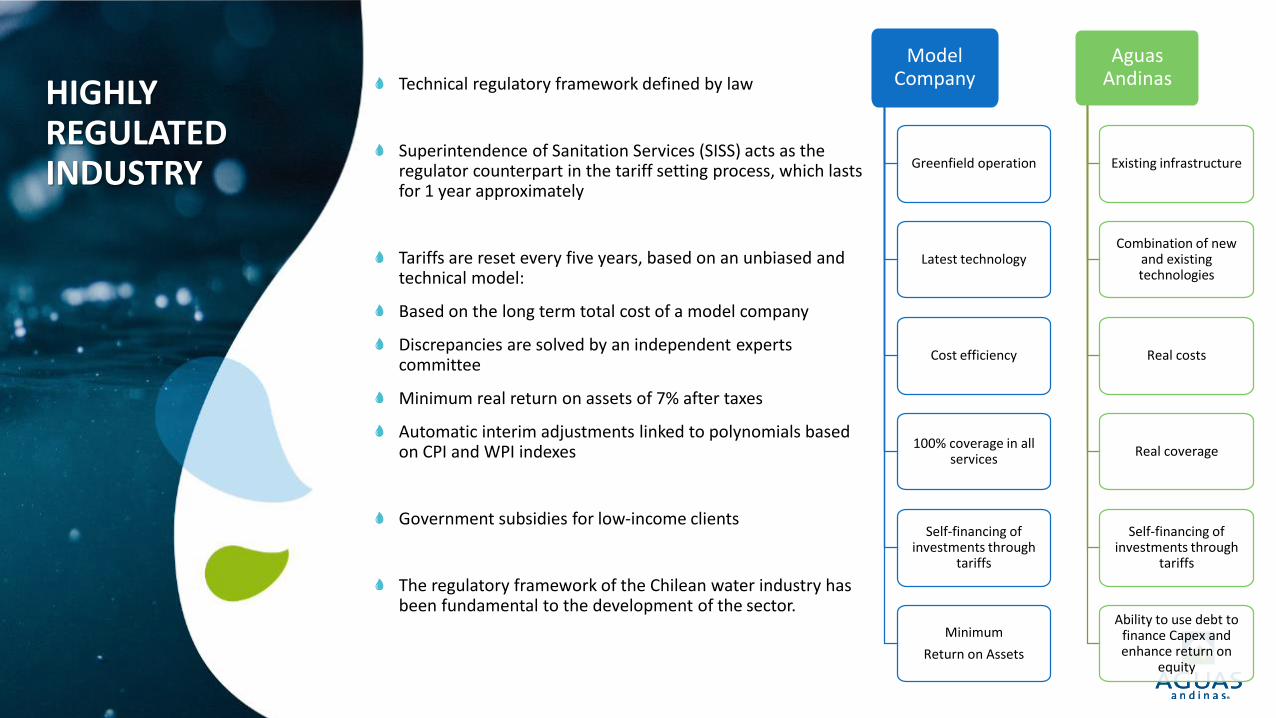
HIGHLY REGULATED INDUSTRY
Technical regulatory framework defined by law
Superintendence of Sanitation Services (SISS) acts as the regulator counterpart in the tariff setting process, which lasts for 1 year approximately
Tariffs are reset every five years, based on an unbiased and technical model:
Based on the long term total cost of a model company
Discrepancies are solved by an independent experts committee
Minimum real return on assets of 7% after taxes
Automatic interim adjustments linked to polynomials based on CPI and WPI indexes
Government subsidies for low-income clients
The regulatory framework of the Chilean water industry has been fundamental to the development of the sector.
Model Company
Greenfield operation
Latest technology
Cost efficiency
100% coverage in all services
Self-financing of investments through
tariffs
Minimum
Return on Assets
Aguas Andinas
Existing infrastructure
Combination of new and existing technologies
Real costs
Real coverage
Self-financing of investments through
tariffs
Ability to use debt to finance Capex and enhance return on
equity

STAGES OF THE TARIFF NEGOTIATION PROCESS
SISS analyses the Model Company
Aguas Andinas analyses the Model Company
Aguas Andinas highlights discrepancies
Negotiation
Tariff Decree
Experts Committee
Agreement?YesNo
Publication of the Tariff Setting Process Parameters and Methodology
Aguas Andinas provides information about the Real Company to the SISS
Committee Decision
SISS PROPOSAL

TIMELINE
01 OCT 2019
Tariff studies exchanged between company and SISS
2013-18 infoprovided
for tariff study
Final parameters
and methodology
published
SISS rules on observations
on preliminary parameters
14 DEC 2018 16 FEB 2019
30 days
01 NOV 2019
Company presents
discrepancies / observations
17 NOV 2019
Expert committee called by
SISS
16 days
02 JAN 2020
SISS requests minutes from
expert committee to
make final ruling
46 days
30 JAN 2020
SISS establishes new tariffs
01 MAR 2020
New Tariff Settlement
30 days
26 DEC 2018
Administrative appeal over the SISS decision on the parameters
Final Parameters
14 JAN 201931 OCT 2018
Publication of parameters and
methodology
List of ‘middle candidate’ for
Expert Committee is determined
Observations on preliminary
parameters made
30 NOV 2018
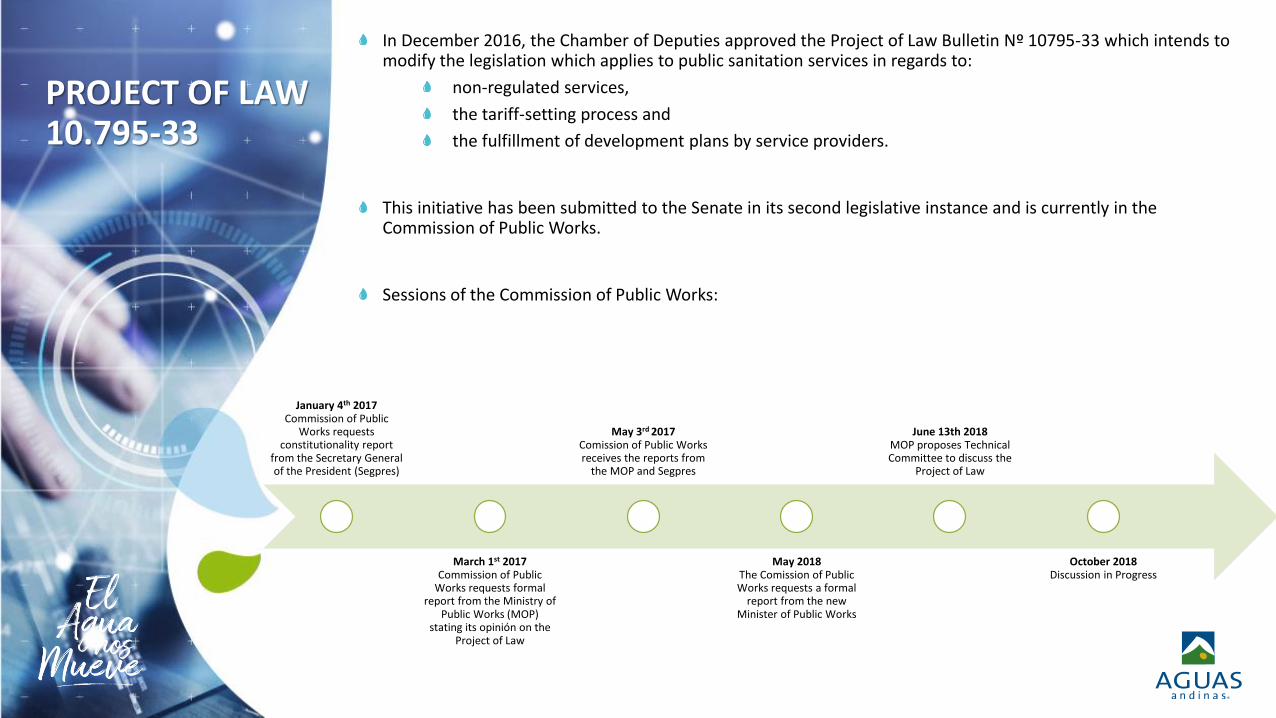
PROJECT OF LAW 10.795-33
In December 2016, the Chamber of Deputies approved the Project of Law Bulletin Nº 10795-33 which intends to modify the legislation which applies to public sanitation services in regards to:
non-regulated services,
the tariff-setting process and
the fulfillment of development plans by service providers.
This initiative has been submitted to the Senate in its second legislative instance and is currently in the Commission of Public Works.
Sessions of the Commission of Public Works:
January 4th 2017Commission of Public
Works requestsconstitutionality report
from the Secretary General of the President (Segpres)
March 1st 2017Commission of Public
Works requests formal report from the Ministry of
Public Works (MOP) stating its opinión on the
Project of Law
May 3rd 2017Comission of Public Works receives the reports from
the MOP and Segpres
May 2018The Comission of PublicWorks requests a formal
report from the new Minister of Public Works
June 13th 2018MOP proposes TechnicalCommittee to discuss the
Project of Law
October 2018Discussion in Progress

INVESTMENTS
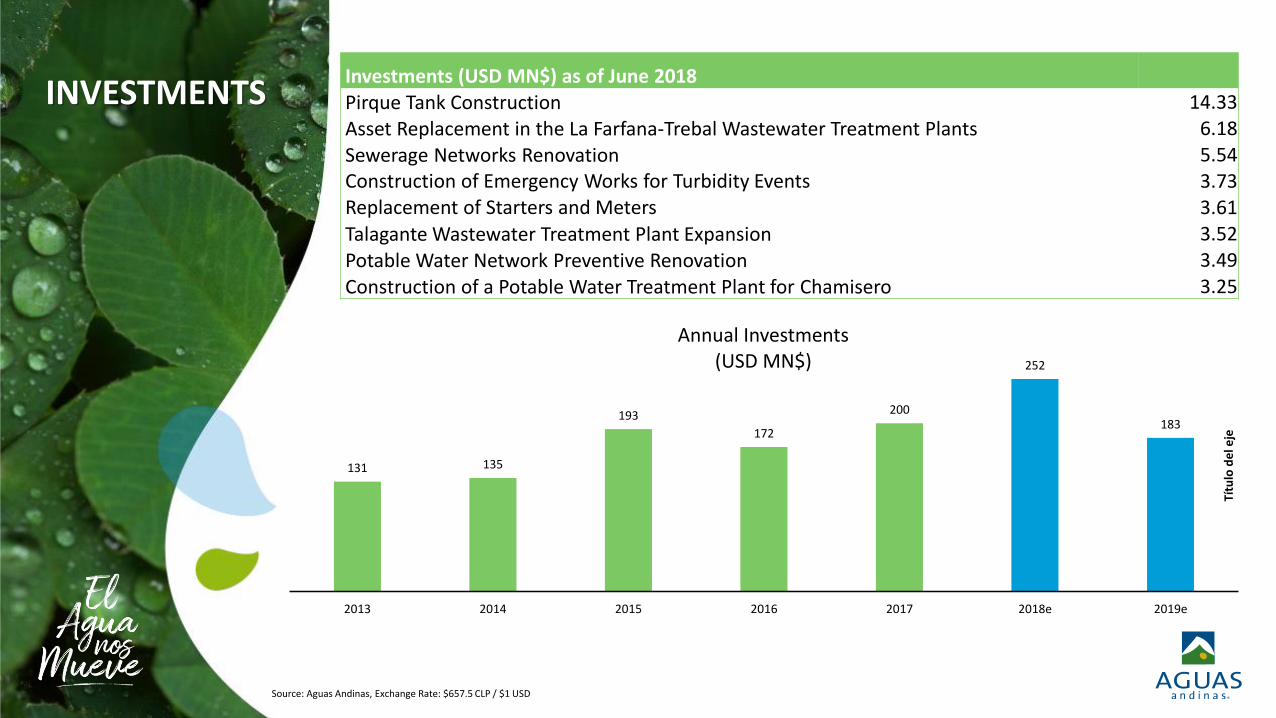
INVESTMENTSInvestments (USD MN$) as of June 2018Pirque Tank Construction 14.33
Asset Replacement in the La Farfana-Trebal Wastewater Treatment Plants 6.18
Sewerage Networks Renovation 5.54Construction of Emergency Works for Turbidity Events 3.73Replacement of Starters and Meters 3.61
Talagante Wastewater Treatment Plant Expansion 3.52
Potable Water Network Preventive Renovation 3.49
Construction of a Potable Water Treatment Plant for Chamisero 3.25
131 135
193
172
200
252
183
2013 2014 2015 2016 2017 2018e 2019e
Títu
lo d
el e
je
Annual Investments(USD MN$)
Source: Aguas Andinas, Exchange Rate: $657.5 CLP / $1 USD

PROGRESS IN INCREASED AUTONOMY WORKS
20189
Reserve tankswith 54 milllion liters
of capacity.
Wells to extractunderground water.
$24
Million USD invested.
11HOURS
OF AUTONOMYfor emergencies
16
20196
mega reserve tanks.
milllion litersof capacity.
$121
Million USD invested.
34HOURS
OF AUTONOMYfor emergencies
with 1,500
Stage 1 Progress: 37.6%Construction Civil Works, Supply of Equipment, Assembly and Commissioning, Elevation and Emptying Works– Reserve Tanks
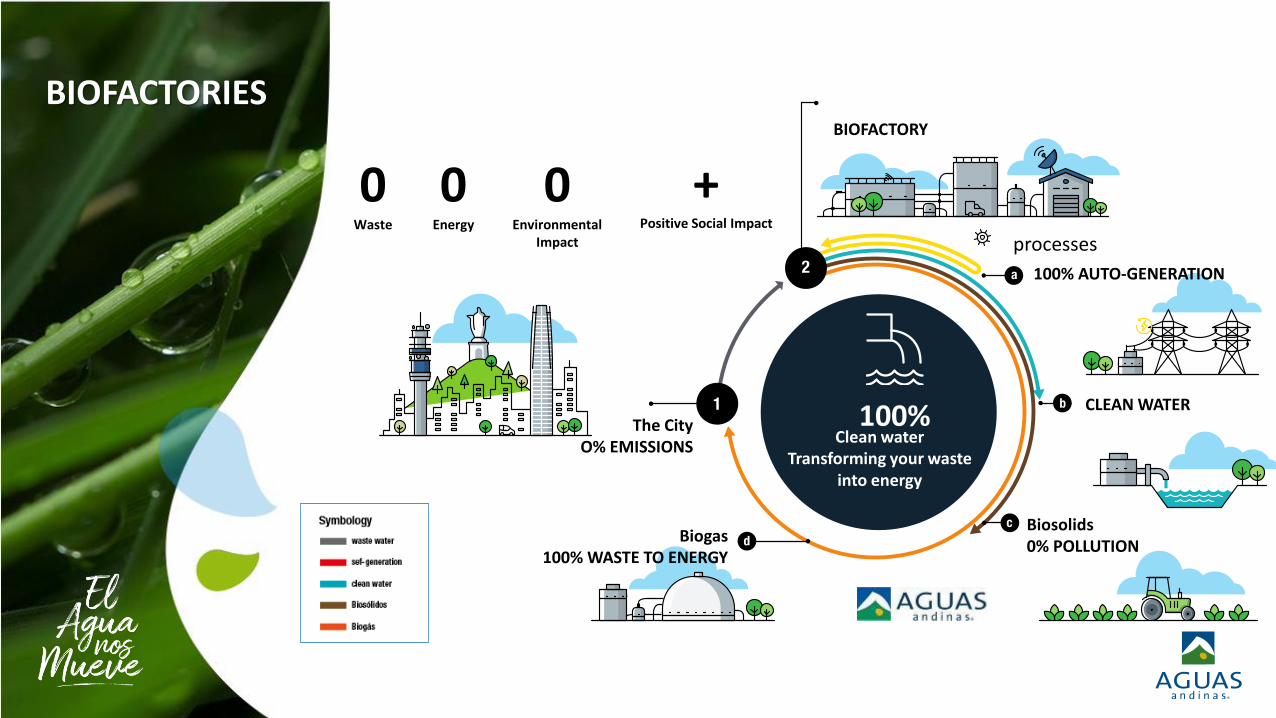
BIOFACTORIESBIOFACTORY
100% AUTO-GENERATION
CLEAN WATER
Biosolids0% POLLUTION
Biogas100% WASTE TO ENERGY
processes
Clean waterTransforming your waste
into energy
The CityO% EMISSIONS
100%
0 Waste
0Energy
0Environmental
Impact
+Positive Social Impact

PROGRESS IN CIRCULAR ECONOMY
Texto Texto Texto Texto
2022 Goal: 0% of biosolids produced in the Metropolitan Region to be sent to landfills
From January to September 2018, 9% of biosolids went to landfills in comparison to 20% theprevious year.
During this period, the use of sludge as fertilizer increased to 54% in comparison to 41% theprevious year.
This is mainly due to:
Improvements in transport management, allowing for more trips to agricultural fields
Improvements in the application of biosolids in fields
Improvements in the managament of available fields
0
50.000
100.000
150.000
200.000
250.000
300.000
2008 2009 2010 2011 2012 2013 2014 2015 2016 2017 sept-18
Biofactory Biosolids Disposal(Ton, Year)
AGRICULTURE CGIB EL RUTAL LANDFILL
0
20.000
40.000
60.000
80.000
100.000
120.000
jan-sept 2017 jan-sept 2018
Biofactory Biosolids Disposal(Ton, Jan-Sept)
AGRICULTURE CGIB EL RUTAL LANDFILL
FINANCIAL PERFORMANCE

FINANCIAL PERFORMANCE AS OF JUNE 30 2018
Numbers in Millions of USD
378416
430443 454
237254
0%
10%
20%
30%
40%
50%
60%
70%
80%
90%
100%
0
50
100
150
200
250
300
350
400
450
500
2013 2014 2015 2016 2017 jun-17 jun-18
EBITDA & EBITDA Margin
EBITDA EBITDA Margin
614670
720748
775
398 420
0
100
200
300
400
500
600
700
800
900
2013 2014 2015 2016 2017 jun-17 jun-18
Revenues
177 182 196 206 212
114 123
0%
5%
10%
15%
20%
25%
30%
35%
0
50
100
150
200
250
2013 2014 2015 2016 2017 jun-17 jun-18
Net Income and Net Income Margin
Recurring Net Income Non-Recurring Net Income Net Income Margin
Source: Aguas Andinas, Exchange Rate: $657.5 CLP / $1 USD
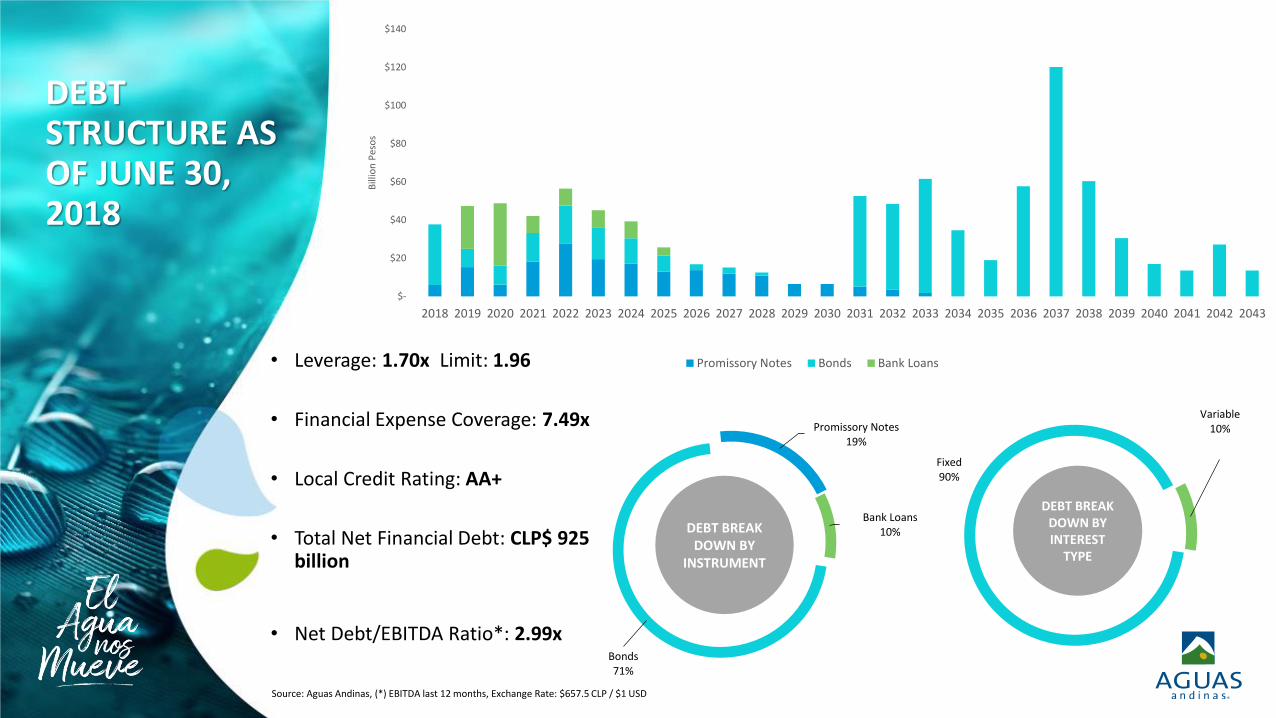
DEBT STRUCTURE AS OF JUNE 30, 2018
• Leverage: 1.70x Limit: 1.96
• Financial Expense Coverage: 7.49x
• Local Credit Rating: AA+
• Total Net Financial Debt: CLP$ 925 billion
• Net Debt/EBITDA Ratio*: 2.99x
Bank Loans10%
Bonds71%
Promissory Notes19%
DEBT BREAK DOWN BY
INSTRUMENT
Variable10%
Fixed90%
DEBT BREAK DOWN BY INTEREST
TYPE
$-
$20
$40
$60
$80
$100
$120
$140
2018 2019 2020 2021 2022 2023 2024 2025 2026 2027 2028 2029 2030 2031 2032 2033 2034 2035 2036 2037 2038 2039 2040 2041 2042 2043
Bill
ion
Pes
os
Promissory Notes Bonds Bank Loans
Source: Aguas Andinas, (*) EBITDA last 12 months, Exchange Rate: $657.5 CLP / $1 USD

CONTACT DETAILS
Stephanie Baier Arocha
Head of Investor Relations
Email: [email protected]
Phone: +562 2569 2301
Address: Avda. Presidente Balmaceda N°1398, 14th floor, Santiago, Chile

Corporate Presentation
AGUAS ANDINAS


