Presentación de PowerPoint - Enjoyinversionistas.enjoy.cl/upload/pdf/201606080951070528.pdf ·...
31
May, 2016
Transcript of Presentación de PowerPoint - Enjoyinversionistas.enjoy.cl/upload/pdf/201606080951070528.pdf ·...

May, 2016

DISCLAIMER
This presentation has been prepared by ENJOY exclusively for the benefit and internal use of the recipient (the “Recipient”) to whom it is
addressed. The Recipient is not permitted to reproduce in whole or in part the information provided in this Presentation (the “Information”)
or to communicate the information to any third party without our prior written consent. No party may rely on this Presentation without our
prior written consent.
The content provided herein is for informational and illustrative purposes only and is not, and does not seek to be, a source of financial
advice on any subject. This information does not constitute an offer of any sort and is subject to change without notice.
ENJOY expressly disclaims for any responsibility for actions taken or not taken based on this information. ENJOY does not accept any
responsibility for losses that might result from the execution of the proposals or recommendations presented. ENJOY is not responsible for
any content that may originate with third parties. ENJOY may have provided, or might provide in the future, information that is inconsistent
with the information herein presented.
2
TABLE OF CONTENTS
I. Key Highlights
II. Company Overview
III. Financial Highlights
3

SECTION I
Key Highlights
4
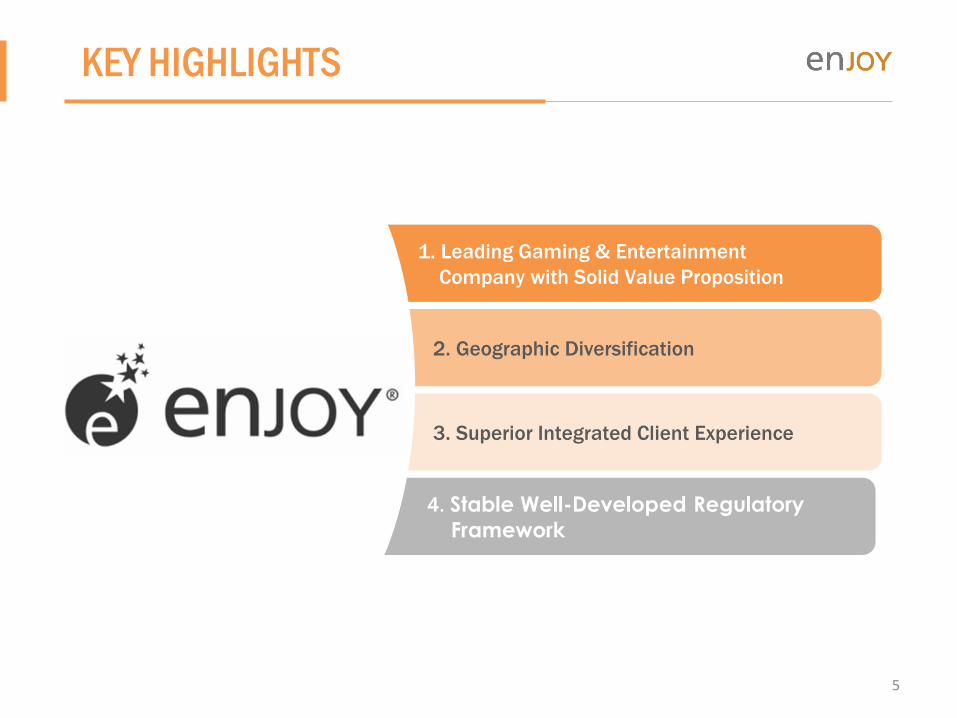
KEY HIGHLIGHTS
5
1. Leading Gaming & Entertainment
Company with Solid Value Proposition
4. Stable Well-Developed Regulatory
Framework
3. Superior Integrated Client Experience
2. Geographic Diversification
6
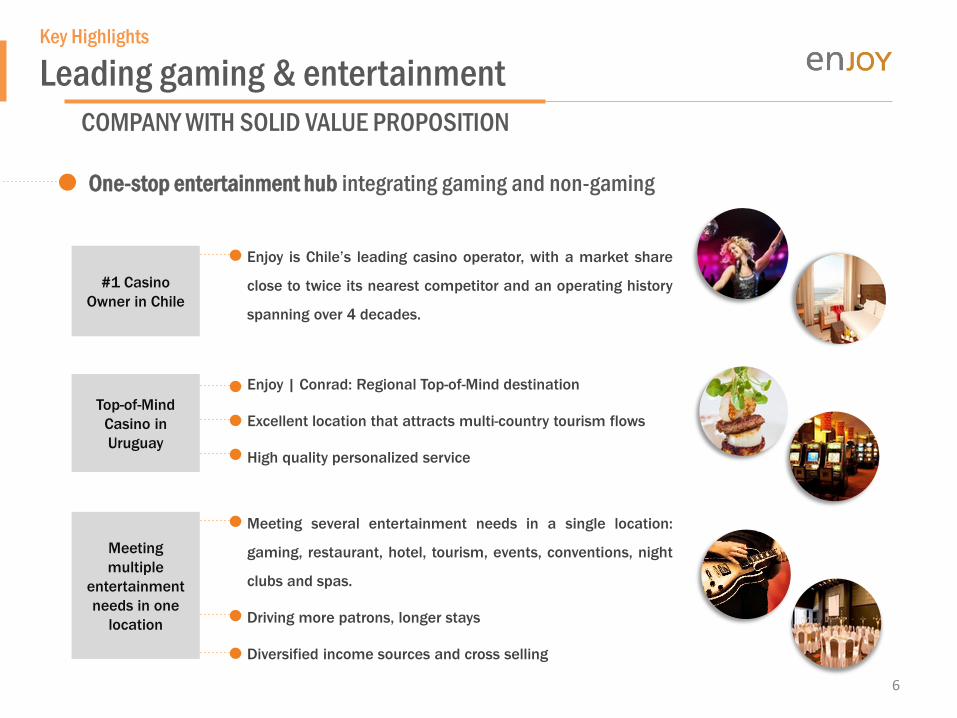
One-stop entertainment hub integrating gaming and non-gaming
COMPANY WITH SOLID VALUE PROPOSITION
#1 Casino
Owner in Chile
Enjoy is Chile’s leading casino operator, with a market share
close to twice its nearest competitor and an operating history
spanning over 4 decades.
Top-of-Mind
Casino in
Uruguay
Enjoy | Conrad: Regional Top-of-Mind destination
Excellent location that attracts multi-country tourism flows
High quality personalized service
Meeting
multiple
entertainment
needs in one
location
Meeting several entertainment needs in a single location:
gaming, restaurant, hotel, tourism, events, conventions, night
clubs and spas.
Driving more patrons, longer stays
Diversified income sources and cross selling
Key Highlights
Leading gaming & entertainment

7
The Company has a diversified geographic footprint
anchored by Chile and Uruguay, two investment grade
countries with Chile rated Aa3 / AA- / A+, all stable, and
Uruguay rated Baa2 / BBB / BBB-, all stable.
Recently signed a Memorandum of Understanding with
the hotel chain Decameron allowing it to develop and
operate casinos in 3 of their resorts located in Colombia
(San Andres and Baru) & Peru (Punta Sal).
Within-Country
Diversification
Within Chile, the Company’s operations are located
throughout the country’s regions.
In Uruguay, Enjoy benefits from diversified tourism flows.
Cross-Border
Geographic
Diversification
Key Highlights
Geographic Diversification

8
Brand recognition drawing repeat visits / longer client stays
Leveraging client knowledge to continually update gaming experience: reward high value clients
High quality service level throughout the service chain
Enjoy offers an integrated entertainment hub incorporating its gaming and non-gaming offerings into a seamless
client experience.
Superior Gaming
Experience
High quality properties including five 5-star hotels, 5 nightclubs,
Supports longer gaming stays, traffic to our other non-gaming offerings
Attractive “destination” locations
#1 non-fast food chain in all of Chile by size
Multi-brand Food & Beverage strategy segmenting customer preferences
31 bars, 23 restaurants
Events provide an additional entertainment “spoke” in our integrated entertainment hub
Live shows, comedy, industry conventions
+246 shows
“Enjoy Club” loyalty program has a membership
Driver of client “stickiness” with 85% point redemption
Source of data to constantly improve customer experience – Enjoy knows +65% of its clients
Attractive
Hospitality
Offerings
Varied &
Awarded Food &
Beverage
Traffic-Drawing
Events
Loyalty Program
8
Key Highlights
Superior integrated client experience
9
9
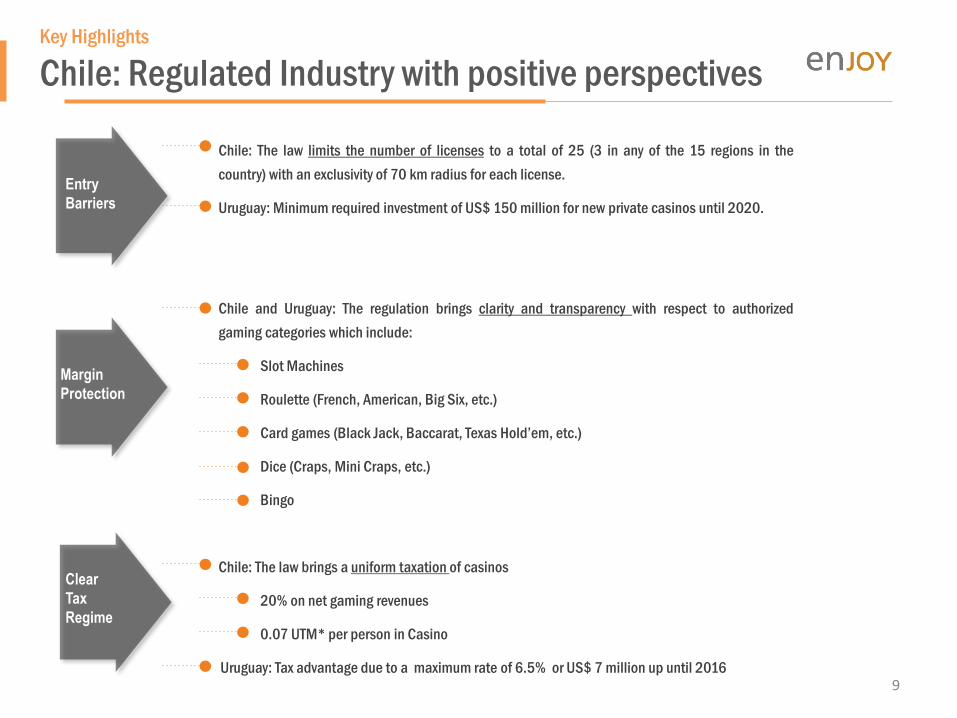
Entry
Barriers
Margin
Protection
Clear
Tax
Regime
Chile: The law limits the number of licenses to a total of 25 (3 in any of the 15 regions in the
country) with an exclusivity of 70 km radius for each license.
Uruguay: Minimum required investment of US$ 150 million for new private casinos until 2020.
Chile and Uruguay: The regulation brings clarity and transparency with respect to authorized
gaming categories which include:
Slot Machines
Roulette (French, American, Big Six, etc.)
Card games (Black Jack, Baccarat, Texas Hold’em, etc.)
Dice (Craps, Mini Craps, etc.)
Bingo
Chile: The law brings a uniform taxation of casinos
20% on net gaming revenues
0.07 UTM* per person in Casino
Uruguay: Tax advantage due to a maximum rate of 6.5% or US$ 7 million up until 2016
Key Highlights
Chile: Regulated Industry with positive perspectives

10
CASINO LICENSES IN CHILE
Prior to 2005, Chile had 7 Municipal casino licenses, granted through
special laws between 1982 and 1990.
On January 4, 2005, the new Casino Law No. 19,995 was enacted,
expanding the number of casino licenses from 7 to 25.
From 2018, tax payment for these casinos will be set as the rest of the
industry: 10% of their revenue will be paid to local government and
another 10% to the regional government. The last tax depends on the
economic offer which is presented to the “Superintendencia de
Casinos de Juego”.
Current municipalities where casinos operate have the right to
continue as main base for a casino for a total of 3 periods of 15 years
each, with the possibility of being extended for subsequent periods of
15 years.
The law presents no changes in the number of licenses granted and
the area of influence which is 70 km and no more than 3 casinos in
each region.
The implications of the new law affect 3 Enjoy casinos: Coquimbo, Viña
del Mar and Pucón.
*Under the provisions of current bill.
Key Highlights
Chile: Regulated Industry with positive perspectives
SECTION II
Company Overview
11

Company Overview
Company at a Glance
Direct Enjoy presence
Indirect Enjoy presence
(Casinos are illegal in Brazil)
8
1
3
2
6
7
4
5
9
10
Group Presence Group Structure
1
2
3
4
5
6
7
Enjoy S.A.
Enjoy Gestión Ltda. Inversiones Enjoy
SpA.
Inversiones
Inmobiliarias Enjoy SpA.
100%
Other Investors Martínez Family
42.6% 57.4%
99.98% 63.20%
Uruguay
8
9
Current casinos operated by Enjoy
Enjoy commercial offices
Chile
Antofagasta
Coquimbo
Santiago
Viña del Mar
Colchagua*
Pucón
Chiloé
Argentina
Conrad
Mendoza*
*Do not consolidate their financials.
10 San Andres
12

Company Overview
Key Milestones: A History of Growth
Source: The Company
1975
1995
1997 2002
2008
2009 2010 2011
2012 2015
1994
2007
Viña del Mar
(Casino)
Coquimbo
(Casino)
Pucón
(Casino)
Pucón
(New Hotel)
Viña del Mar
(Hotel)
Coquimbo
(New Casino
and Hotel)
Antofagasta,
(Hotel & Casino)
IPO in the
Chilean Stock
Exchange
Bond issuance
for USD 200 MM
in local market
Santiago
(Casino & Hotel)
Conrad Punta del
Este
(Casino & Hotel)
Chiloé
(Casino & Hotel)
1
casino
Operating
10 casinos in
4 countries
Corporate History: Openings and Others
2013
Mendoza,
Colchagua
(Casino)
Pucón
(Hotel)
Enjoy-Decameron
Strategic Alliance
2016
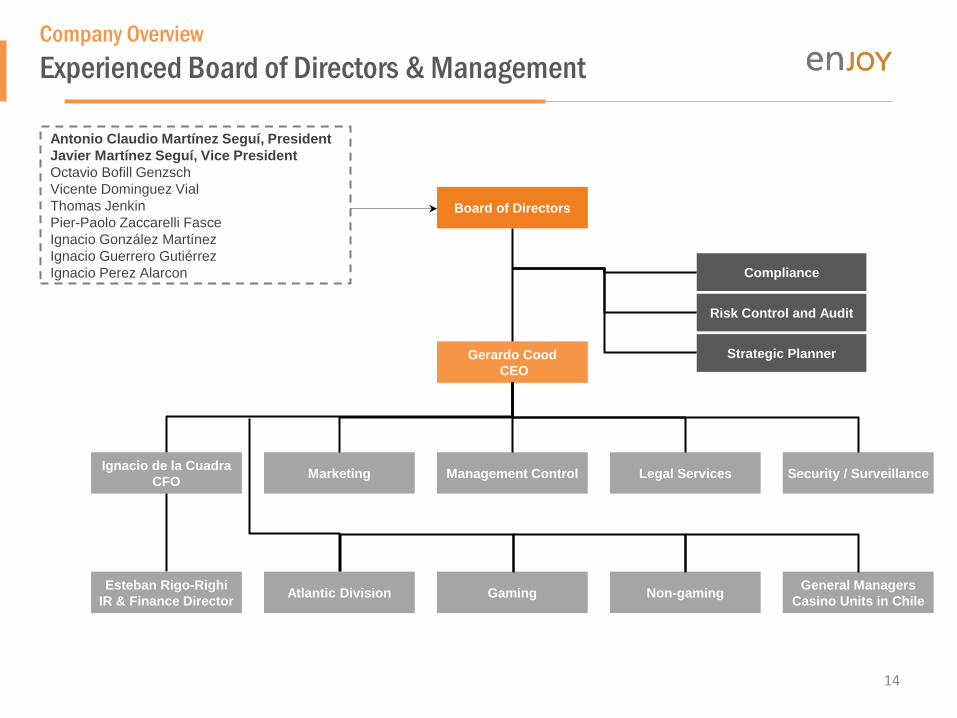
Company Overview
Experienced Board of Directors & Management
Management Control Marketing
Non-gaming
Security / Surveillance
Gaming Esteban Rigo-Righi
IR & Finance Director
Legal Services
Gerardo Cood
CEO
Board of Directors
Atlantic Division
Risk Control and Audit
Compliance
Strategic Planner
Antonio Claudio Martínez Seguí, President
Javier Martínez Seguí, Vice President
Octavio Bofill Genzsch
Vicente Dominguez Vial
Thomas Jenkin
Pier-Paolo Zaccarelli Fasce
Ignacio González Martínez
Ignacio Guerrero Gutiérrez
Ignacio Perez Alarcon
Ignacio de la Cuadra
CFO
General Managers
Casino Units in Chile
14

Company Overview
Business Unit Overview
Conrad Antofagasta Coquimbo Santiago Pucón Chiloé Viña del Mar Colchagua
Mendoza, Argentina
Slot Machines 560 788 909 1,380 543 230 1,450 248 567
Gaming Tables 77 40 32 57 38 19 63 21 24
Lodging Units 294 92 111 120 272 72 60 - 180
Restaurants and Cafeterias
7 6 9 8 8 4 9 - 5
Employees 1,166 789 791 991 665 314 1,372 166 324
License Renewal 12-31-2036 11-11-2023 12-31-2017 08-29-2024 12-31-2017 05-08-2027 12-31-2017 09-12-2023 Indefinite
Non-Consolidating Investments. Operated by the Company. Consolidated in Financials
6,675 Slot Machines 371Gaming Tables 654 Bingo Positions
1,021 Lodging Units 56 Restaurants / Bars 8 Recreation/Spa Centers 7 Convention Centers
Market Share Enjoy Chile Brand Non-Gaming Gaming
38.0%
21.2%
19.2%
7.9%
8.4%
5.3% Enjoy
Dreams
Monticello
Marina del Sol
Sol
Others
Commercial Offices:
Source: The Company
SECTION III
Financial Highlights
16
17
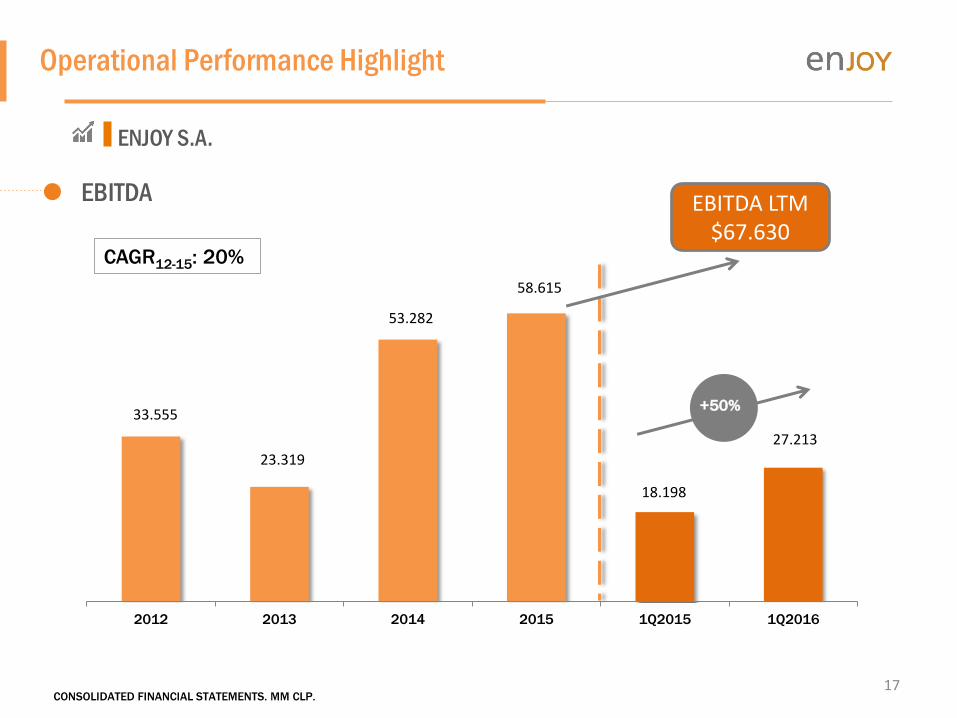
Operational Performance Highlight
33.555
23.319
53.282
58.615
18.198
27.213
2012 2013 2014 2015 1Q2015 1Q2016
CAGR12-15: 20%
+50%
EBITDA LTM $67.630
ENJOY S.A.
EBITDA
CONSOLIDATED FINANCIAL STATEMENTS. MM CLP.
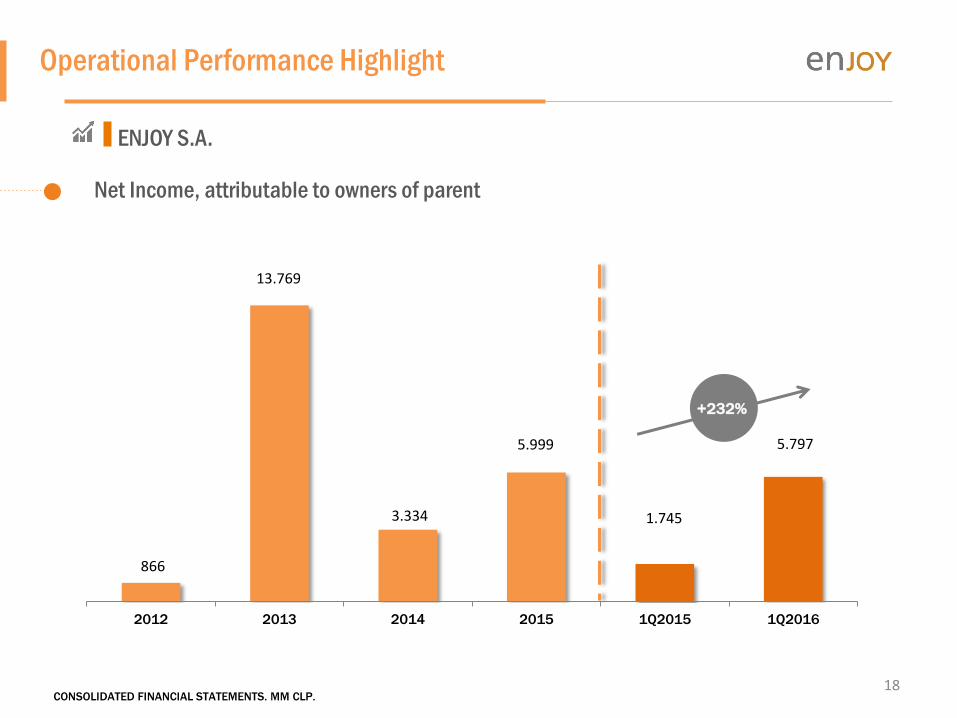
18
Net Income, attributable to owners of parent
ENJOY S.A.
866
13.769
3.334
5.999
1.745
5.797
2012 2013 2014 2015 1Q2015 1Q2016
+232%
Operational Performance Highlight
CONSOLIDATED FINANCIAL STATEMENTS. MM CLP.

19
Revenue
Operational Efficiency
ENJOY S.A.
33.555
23.319
53.282 58.615
18.198
27.213
23,2% 14,7%
24,8% 25,1% 27,5% 30,1%
-50,0%
-40,0%
-30,0%
-20,0%
-10,0%
0,0 %
10, 0%
20, 0%
30, 0%
2012 2013 2014 2015 1Q 2015 1Q 2016
EBITDA Margin
144.413 158.652
214.627 233.238
66.224
90.364
0
50. 000
100 .000
150 .000
200 .000
250 .000
2012 2013 2014 2015 1Q 2015 1Q 2016
Slot Machines Gaming Tables Non Gaming
CAGR12-15: 17%
+36%
Operational Performance Highlight
CONSOLIDATED FINANCIAL STATEMENTS. MM CLP.

20
EBITDA – EBITDA MARGIN
33.557
18.615
35.577 39.187
11.846 13.424
2012 2013 2014 2015 1Q 2015 1Q 2016
EBITDA – EBITDA MARGIN ENJOY S.A.
EBITDA – ENJOY Chile
C
HI
LE
33.555
23.319
53.282 58.615
18.198
27.213
23,2% 14,7%
24,8% 25,1% 27,5% 30,1%
-50,0%
-40,0%
-30,0%
-20,0%
-10,0%
0,0 %
10, 0%
20, 0%
30, 0%
2012 2013 2014 2015 1Q 2015 1Q 2016
EBITDA Margin
+13%
Enjoy Chile revenues + 16 % , leveraged by + 11% more visits.
Tables Income + 24% better performance VIP Tables.
Slots income + 14 %.
Hospitality Revenue + 10 % in A & B and higher average ticket covers and Hotel + 11% increase in ADR + 12 %.
Operational Performance Highlight
CONSOLIDATED FINANCIAL STATEMENTS. MM CLP.

21
EBITDA – EBITDA MARGIN
4.707
17.707 19.480
6.353
13.908
2013 2014 2015 1Q 2015 1Q 2016
EBITDA – EBITDA MARGIN ENJOY S.A.
EBITDA – ENJOY Conrad Punta del Este
UR
UG
UA
Y
Revenue game: good compliance in Tables is highlighted by increased volume of customers vip game .
Hotel: higher occupancy and higher ADR. the biggest selling groups - events and individual tourism highlights .
Efficiencies: Personnel expenses , Marketing and Utilities.
33.555
23.319
53.282 58.615
18.198
27.213
23,2% 14,7%
24,8% 25,1% 27,5% 30,1%
-50,0%
-40,0%
-30,0%
-20,0%
-10,0%
0,0 %
10, 0%
20, 0%
30, 0%
2012 2013 2014 2015 1Q 2015 1Q 2016
EBITDA Margin
+119%
Operational Performance Highlight
CONSOLIDATED FINANCIAL STATEMENTS. MM CLP.

SECTION III - B
Financial Statements
22

Financial Statements
23
CONSOLIDATED FINANCIAL STATEMENTS ENJOY S.A.
MM CLP 31.03.2016 31.12.2015
ASSETS
Current Assets 86.587 88.577
Non-Current Assets 525.726 546.691
TOTAL ASSETS 612.314 635.268
LIABILITIES
Current Liabilities 128.382 136.918
Non-Current Liabilities 324.892 338.247
TOTAL LIABILITIES
453.274 475.165
EQUITY
Share capital 119.445 119.445
Retained earnings 22.802 18.744
Others 16.793 21.915
Equity 159.039 160.103
TOTAL LIABILITIES & EQUITY 612.314 635.268
PUT Value.
Exchange rate variation.
Decrease in equity by translation
adjustments of foreign subsidiaries.
Property, plant and equipment.
Exchange rate variation.
CONSOLIDATED FINANCIAL STATEMENTS. MM CLP.
Financial Statements
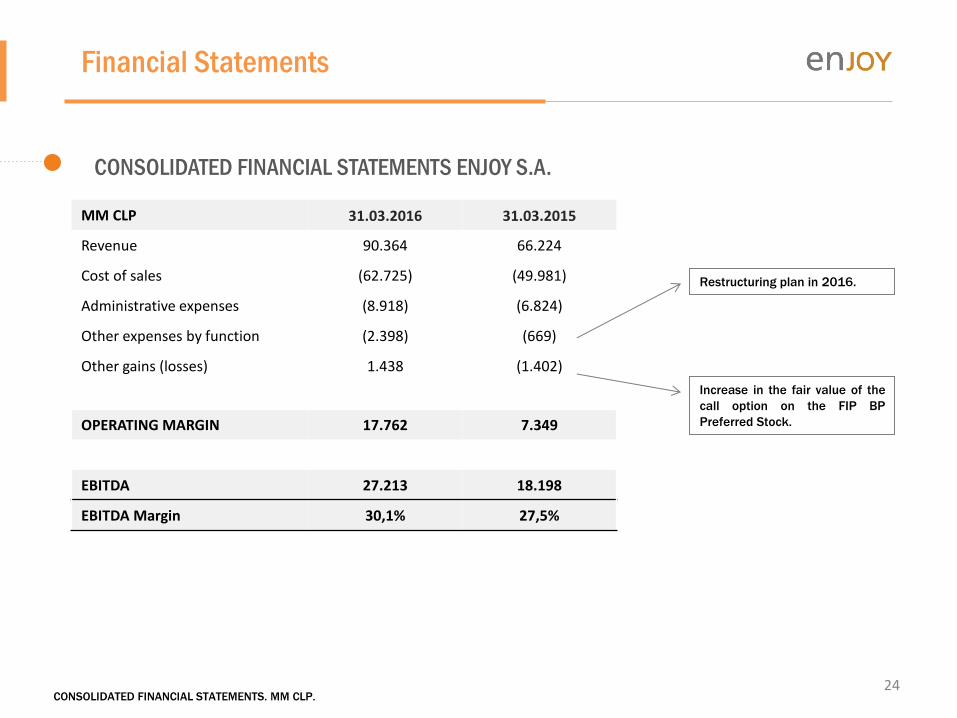
24
MM CLP 31.03.2016 31.03.2015
Revenue 90.364 66.224
Cost of sales (62.725) (49.981)
Administrative expenses (8.918) (6.824)
Other expenses by function (2.398) (669)
Other gains (losses) 1.438 (1.402)
OPERATING MARGIN 17.762 7.349
EBITDA 27.213 18.198
EBITDA Margin 30,1% 27,5%
Restructuring plan in 2016.
Increase in the fair value of the
call option on the FIP BP
Preferred Stock.
CONSOLIDATED FINANCIAL STATEMENTS ENJOY S.A.
CONSOLIDATED FINANCIAL STATEMENTS. MM CLP.
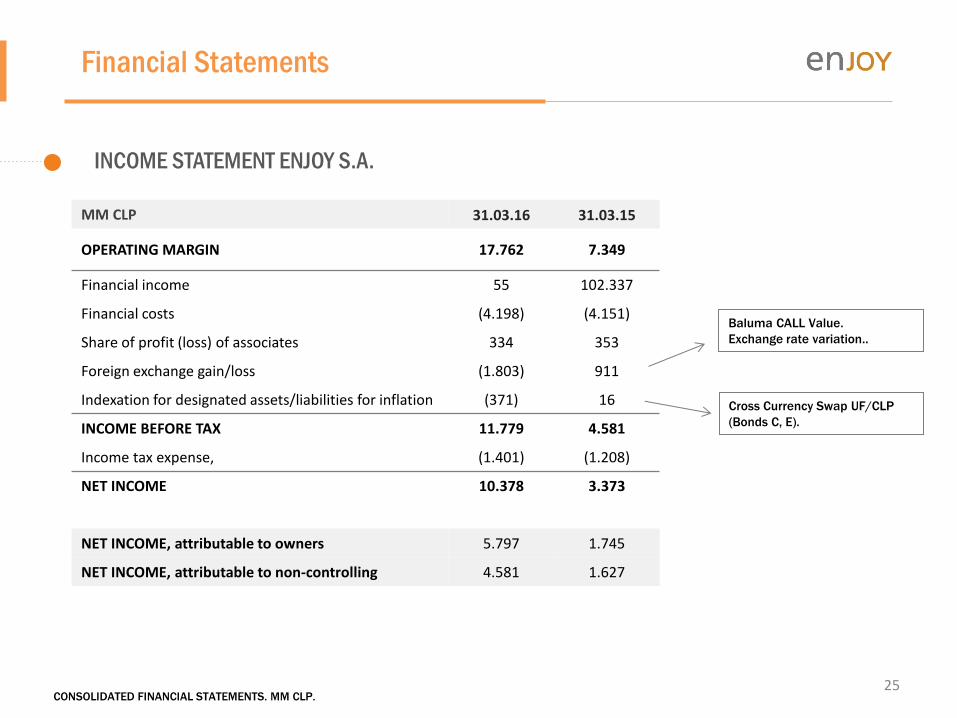
Financial Statements
25
INCOME STATEMENT ENJOY S.A.
MM CLP 31.03.16 31.03.15
OPERATING MARGIN 17.762 7.349
Financial income 55 102.337
Financial costs (4.198) (4.151)
Share of profit (loss) of associates 334 353
Foreign exchange gain/loss (1.803) 911
Indexation for designated assets/liabilities for inflation (371) 16
INCOME BEFORE TAX 11.779 4.581
Income tax expense, (1.401) (1.208)
NET INCOME 10.378 3.373
NET INCOME, attributable to owners 5.797 1.745
NET INCOME, attributable to non-controlling 4.581 1.627
Baluma CALL Value.
Exchange rate variation..
Cross Currency Swap UF/CLP
(Bonds C, E).
CONSOLIDATED FINANCIAL STATEMENTS. MM CLP.

2,06
1,30
0,87
1,38 1,46 1,32
1,45
1,20 1,35
1,07 1,11 1,04
1,13 1,13
dic
-12
mar
-13
jun
-13
sep
-13
dic
-13
mar
-14
jun
-14
sep
-14
dic
-14
mar
-15
jun
-15
sep
-15
dic
-15
mar
-16
26
HISTORICAL PERFORMANCE
NET FINANCIAL DEBT/ EQUITY
NET FINANCIAL DEBT/ EBITDA
Financial Highlights
4,42 4,26 4,33
3,89
3,57
5,41
4,82
3,90
3,86 3,69
3,54 3,36
3,08
2,66
dic
-12
mar
-13
jun
-13
sep
-13
dic
-13
mar
-14
jun
-14
sep
-14
dic
-14
mar
-15
jun
-15
sep
-15
dic
-15
mar
-16
Rating Agency Credit Rating Outlook
Fitch Ratings (May ’15) BBB- Stable
Humphreys (May ‘15) BBB Stable
ICR (Jun ‘15) BBB Stable
DOMESTIC CREDIT RATING

27
DEBT COMPOSITION
(1, 2) Financial Debt = Other current financial liabilities + Other non-current financial liabilities
Equity
43%
Short-Term
30%
Long-Term
70%
57%
Financial
Debt
Equity
44%
Short-Term;
29%
Long-Term;
71%
CAPITAL STRUCTURE as of Dec-15 (1) CAPITAL STRUCTURE as of Mar-16 (2)
Financial Highlights
56%
Financial
Debt

144.413 158.652
214.627
233.238
66.224 90.364
2012 2013 2014 2015 1Q 2015 1Q 2016
CAGR 12-15: 17.3%
33.555 23.319
53.282 58.615
18.198 27.213
23,2%
14,7%
24,8% 25,1% 27%
30%
0,0 %
5,0 %
10, 0%
15, 0%
20, 0%
25, 0%
30, 0%
35, 0%
0
10.000
20.000
30.000
40.000
50.000
60.000
70.000
2012 2013 2014 2015 1Q 2015 1Q 2016
EBITDA EBITDA Margin
CAGR 12-15: 20%
REVENUES
EBITDA & MARGIN
NET INCOME, attributable to owners
HISTORICAL PERFORMANCE: INCOME STATEMENT (CLP MM except percentages)
28
Financial Highlights
866
13.769
3.334
6.000
1.745
5.797
2012 2013 2014 2015 1Q 2015 1Q 2016

29
HISTORICAL PERFORMANCE
REVENUES BY GEOGRAPHY
Financial Highlights
Antofagasta Coquimbo Viña* Rinconada Pucón Chiloé Uruguay Colombia
1Q 2016 9% 12% 12% 8% 9% 0% 50% 0%
1Q 2015 11% 19% 15% 10% 9% 0% 35% -
EBITDA BY GEOGRAPHY
Antofagasta Coquimbo Viña* Rinconada Pucón Chiloé Uruguay Colombia
1Q 2016 9% 11% 20% 11% 9% 2% 39% 0%
1Q 2015 10% 13% 10% 14% 9% 2% 41% -
- Accounting Criteria: Income Distribution, does not consider the Central. * VIÑA begins to consolidate the results of AMC from 1Q 2016.

30
HISTORICAL PERFORMANCE
Financial Highlights
DEBT AMORTIZATION PROFILE MM CLP
• Loans and Commercial Paper, is being renovated short term.
7.000
37.654
67.279
28.149 33.895
20.452 20.625 18.048
15.479 15.292
5.575
-6.000
4.000
14.000
24.000
34.000
44.000
54.000
64.000
74.000
-
10.000
20.000
30.000
40.000
50.000
60.000
70.000
80.000
2016 2017 2018 2019 2020 2021 2022 2023 2024
Leasing Syndicated Loan Public bonds Commercial Paper Loans Total
Structured Revolving

May, 2016