Presentación de PowerPoint0D6E01AD-3F14-0F6D-2AB0-0A5544CBC139}.pdf · Quarterly Report July -...
42
Quarterly Report November 28th, 2018 July – September 2018
Transcript of Presentación de PowerPoint0D6E01AD-3F14-0F6D-2AB0-0A5544CBC139}.pdf · Quarterly Report July -...
Quarterly Report
November 28th, 2018
July – September 2018
Quarterly Report July - September 2018 1
Outline
External conditions1
Current situation of the Mexican economy2
Forecasts and final remarks5
Inflation3
Monetary policy4
0
1
2
3
4
5
6
7
8
20
10
20
11
20
12
20
13
20
14
20
15
20
16
20
17
20
18
20
19
World economy
2
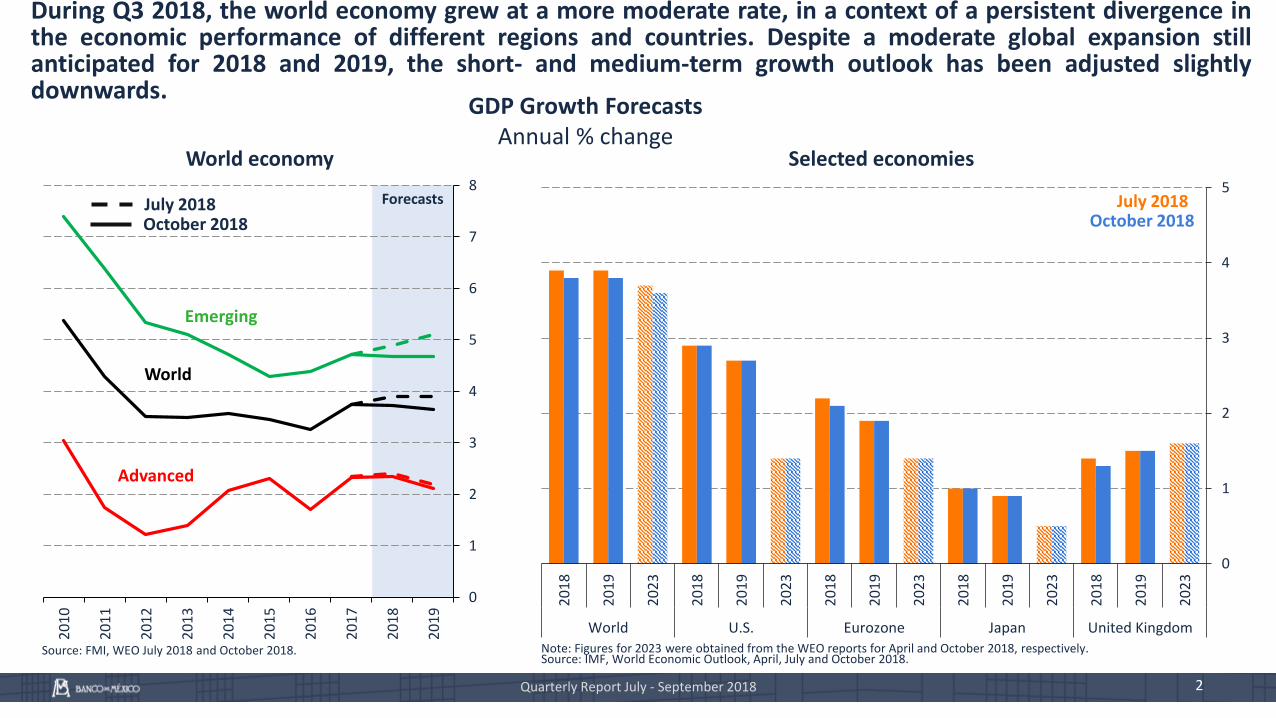
During Q3 2018, the world economy grew at a more moderate rate, in a context of a persistent divergence inthe economic performance of different regions and countries. Despite a moderate global expansion stillanticipated for 2018 and 2019, the short- and medium-term growth outlook has been adjusted slightlydownwards.
20
18
20
19
20
23
20
18
20
19
20
23
20
18
20
19
20
23
20
18
20
19
20
23
20
18
20
19
20
23
World U.S. Eurozone Japan United Kingdom
0
1
2
3
4
5
Selected economies
Source: FMI, WEO July 2018 and October 2018. Note: Figures for 2023 were obtained from the WEO reports for April and October 2018, respectively.Source: IMF, World Economic Outlook, April, July and October 2018.
Quarterly Report July - September 2018
July 2018October 2018
Advanced
Emerging
World
GDP Growth ForecastsAnnual % change
October 2018July 2018Forecasts

60
61
62
63
64
65
66
67
68
69
70
48
49
50
51
52
53
54
55
56
20
14
20
15
20
16
20
17
20
18
3
The latter, in part, reflected the materialization of some risks on the international scene, such as theintensification of trade disputes at the global level, which resulted in a weaker growth of world trade andinvestment, and in lower confidence levels among businesses.
Volume of world tradeAnnual % change of the 3-month moving
average, s. a.
Global Manufacturing PMIDiffusion indices, s. a.
s. a. / Seasonally adjusted figures.Source: IMF, CPB Netherlands, and Haver Analytics.
s. a. / Seasonally adjusted figures.Source: Markit.
-4
-2
0
2
4
6
8
10
20
14
20
15
20
16
20
17
20
18
RWI container traffic
CPB Netherlands
September
World Economy
October
New orders
Exports orders
Future production
Quarterly Report July - September 2018

Quarterly Report July - September 2018 4
Headline inflation in the main advanced economies reduced its upward trend, in a context of considerabledivergence persisting across countries.
-1
0
1
2
3
4
20
13
20
14
20
15
20
16
20
17
20
18
Headline inflationAnnual % change
-2
-1
0
1
2
3
4
20
13
20
14
20
15
20
16
20
17
20
18
Core inflationAnnual % change
1/ U.S. figures correspond to the Consumer Price Index (CPI).Source: National Statistical Offices.
2/ U.S. figures correspond to the Consumer Price Index (CPI).3/ Japan figures exclude fresh food and energy, as well as the effect of the higher consumption tax.Source: National Statistical Offices.
October
Advanced Economies
October
Eurozone
United Kingdom
Japan
U.S. 1/
Eurozone
United Kingdom
Japan3/
U.S. 2/

-1.0
-0.5
0.0
0.5
1.0
1.5
2.0
2.5
3.0
3.5
Jan
-16
May
-16
Sep
-16
Jan
-17
May
-17
Sep
-17
Jan
-18
May
-18
Sep
-18
85
88
91
94
97
100
103
106
Jan
-16
May
-16
Sep
-16
Jan
-17
May
-17
Sep
-17
Jan
-18
May
-18
Sep
-18
-1.0
-0.5
0.0
0.5
1.0
1.5
2.0
2.5
3.0
3.5
Jan
-16
May
-16
Sep
-16
Jan
-17
May
-17
Sep
-17
Jan
-18
May
-18
Sep
-18
Quarterly Report July - September 2018 5
In light of a greater divergence in the observed and expected performance of the main advanced economies,interest rates in the U.S. increased and the U.S. dollar strengthened. However, recently there has been areduction in the pace of tightening of global financial conditions.
2-year 10-yearUnited States: Dollar Index (DXY) 1/
Index
Source: Bloomberg. Source: Bloomberg. 1/Refers to the DXY index estimated by the Intercontinental Exchange (ICE) based onthe weighted average of the value of the dollar relative to a basket of six currencies:EUR: 57.6%, JPY: 13.6%, GBP: 11.9%, CAD: 9.1%, SEK: 4.2%, and CHF: 3.6%.Source: Bloomberg.
United Kingdom
U.S.
Eurozone
November
Japan
Appreciation
November November
Advanced Economies: Government Bonds Interest Rates%
United Kingdom
U.S.
Japan
Eurozone

-1.0
-0.5
0.0
0.5
1.0
1.5
2.0
2.5
3.0
3.5
Dec
-14
Jun
-15
Dec
-15
Jun
-16
Dec
-16
Jun
-17
Dec
-17
Jun
-18
Dec
-18
Jun
-19
Dec
-19
Quarterly Report July - September 2018 6
Although the main central banks are anticipated to continue approaching a more neutral monetary policystance, the normalization rate of monetary policy, above all in the U.S., could slow down.
Expected Monetary Policy Rates Implicit in OIS Curve 1/
%Prospective Distribution of the Reference Rate at the end
of 2019 Implicit in Options 3/
Density
1/ OIS: Fixed-for-floating swap where the fixed interest rate is the reference rate. 2/ Data for the observed federal funds rate corresponds to the average between the lower and upper bounds of the range (2.00% - 2.25%). 3/ The implicitdistribution of the reference rate is obtained by the changes in interest rates implicit in options over the 3-month rates futures (LIBOR in the U.S. and United Kingdom, EURIBOR in the Eurozone and bankers acceptance in Canada). Thespread between the reference rate and the 3-month rate is assumed to remain constant. For the implicit distribution in options, the Breeden-Litzenberger method is used. Source: Bloomberg.
End of2019
End of2018
Implied target rate in OIS curve November 22
-1.0% -0.5% 0.0% 0.5% 1.0% 1.5% 2.0% 2.5% 3.0% 3.5% 4.0% 4.5%
-1.0% -0.5% 0.0% 0.5% 1.0% 1.5% 2.0% 2.5% 3.0% 3.5% 4.0% 4.5%
2.125%(Nov-18)
-1.0% -0.5% 0.0% 0.5% 1.0% 1.5% 2.0% 2.5% 3.0% 3.5% 4.0% 4.5%
1.75%(Nov-18)
United States
-1.0% -0.5% 0.0% 0.5% 1.0% 1.5% 2.0% 2.5% 3.0% 3.5% 4.0% 4.5%
0.00%(Nov-18)
ModeMar 30, 2018: 2.46%Jun 18, 2018: 2.80%Nov 22, 2018: 2.98%
ModeMar 30, 2018: 2.07%Jun 18, 2018: 2.14%Nov 22, 2018: 2.34%
Canada
ModeMar 30, 2018: 0.96%Jun 18, 2018: 0.93%Nov 22, 2018: 1.07%
United Kingdom0.75%
(Nov-18)
ModeMar 30, 2018: -0.18%Jun 18, 2018: -0.23%Nov 13, 2018: -0.29%
Eurozone
Federal Reserve 2/
Bank of Japan
European Central Bank
Bank of England

80
85
90
95
100
105
110
115
120
125
130
0
20
40
60
80
100
120
140
160
180
200
Jan
-16
Ap
r-1
6
Jul-
16
Oct
-16
Jan
-17
Ap
r-1
7
Jul-
17
Oct
-17
Jan
-18
Ap
r-1
8
Jul-
18
Oct
-18
Quarterly Report July - September 2018 7
The intensification of certain risks for the global economy such as trade tensions, financial difficulties in someemerging economies and contagion risk, contributed to bouts of volatility in financial markets.
VIX Index 3/
Index 01-Jan-2016=100Stock Markets
Index 01-Jan-2016=100
3/ VIX index is a weighted indicator that measures the implied volatility inthe options market for the S&P 500. The SKEW index is an index thatreflects the probability of extreme events in the S&P 500.Source: Bloomberg.
1/ Based on ETF iShares MSCI World quoted in U.S. dollars. It includes stock markets of 11 advancedeconomies: Canada, the U.S., Japan, France, Germany, Australia, Hong Kong, the Netherlands,Spain, Switzerland and the U.K. 2/ Based on ETF iShares MSCI Emerging Markets quotes in U.S.dollars. It includes the stock markets of 15 emerging economies: Brazil, Chile, Mexico, Poland,Qatar, Russia, South Africa, China, India, Indonesia, Korea, Malaysia, the Philippines, Taiwan andThailand. Source: Bloomberg.
November
80
90
100
110
120
130
140
150
160
170
Jan
-16
Ap
r-1
6
Jul-
16
Oct
-16
Jan
-17
Ap
r-1
7
Jul-
17
Oct
-17
Jan
-18
Ap
r-1
8
Jul-
18
Oct
-18
Emerging economies 2/
Advanced economies 1/
November
Risk Appetite IndexIndex
-8
-4
0
4
8
12
20
12
20
13
20
14
20
15
20
16
20
17
20
18
Greater risk appetite
Euphoria
PanicGlobal risk
appetiteNovember
Source: Credit Suisse.

8
In the context described, emerging economies’ asset prices performed negatively, and their capital inflowsdeclined, albeit with differences according to their macroeconomic fundamentals and idiosyncratic factors.
-90
-70
-50
-30
-10
10
30
50
70
90
110
130
150
170
1 4 7
10
13
16
19
22
25
28
31
34
37
40
43
46
49
52
Weeks
2008
2009
2012
2013
2015
2016
2017
2018
Accumulated capital flows (Debt and equity) 1/
Billions of dollars
Nominal exchange rate against USD Index 01-Jan-2017 = 100
1/ The sample covers funds used for the buying-selling of stocks and bonds from emerging countries, recorded in advancedcountries. Flows exclude portfolio performance and exchange rate fluctuations.Source: Emerging Portfolio Fund Research.
Source: Bloomberg.
Quarterly Report July - September 2018
Emerging Economies
November 21
Depreciation
ChileColombia
Brazil
Mexico
November50
80
110
140
170
200
80
90
100
110
120
130
140
Jan
-17
Mar
-17
May
-17
Jul-
17
Sep
-17
No
v-1
7
Jan
-18
Mar
-18
May
-18
Jul-
18
Sep
-18
No
v-1
8
Turkey

Quarterly Report July - September 2018 9
Risks to the World Economic Outlook
The world economic outlook is subject to uncertainty both in the short term and, to agreater degree, in the medium term.
Risks to global economic activity and to financial market stability have increased, inparticular:• A change in the economic and trade integration model.
• A faster-than-anticipated deceleration of the U.S. economy.
• A greater-than-expected slowdown of the Chinese economy.
• A greater tightening in international financial conditions, given an unanticipated upturn in inflation, especiallyin the U.S.
• A further deterioration of macroeconomic balances in certain emerging economies.
• An escalation of political and geopolitical conflicts, which could affect economic agents’ confidence.

Quarterly Report July - September 2018 10
Outline
External conditions1
Current situation of the Mexican economy2
Forecasts and final remarks5
Inflation3
Monetary policy4

0.6
0.9
0.6
0.8
0.3
-0.7
1.0
0.5
0.6
1.3
0.4
1.1
0.5
1.1
1.3
-0.1
0.6
0.5
1.2
0.9
0.4 0.5
-0.2
0.8
1.1
-0.1
0.8
-1
0
1
2
20
12
20
13
20
14
20
15
20
16
20
17
20
18
11
Domestically, economic activity rebounded in Q3 2018, after having contracted in Q2 2018.
90
95
100
105
110
115
120
80
90
100
110
120
130
140
20
12
20
13
20
14
20
15
20
16
20
17
20
18
70
75
80
85
90
95
100
105
110
115
120
20
12
20
13
20
14
20
15
20
16
20
17
20
18
Gross Domestic Product Quarterly % change, s. a.
Global Indicator of Economic ActivityIndex 2013=100, s. a.
Industrial Activity Index 2013=100, s. a.
s. a. / Seasonally adjusted data.Source: Mexico’s National Accounts System (SCNM), INEGI.
s. a. / Seasonally adjusted data.Source: Mexico’s National Accounts System (SCNM), INEGI.
s. a. / Seasonally adjusted data.Source: Monthly Industrial Activity Indicator, Mexico’s National AccountsSystem (SCNM), INEGI.
Quarterly Report July - September 2018
Services
Total
Industrial
Agricultural
Q3 2018
Mining, quarrying, and oil and gas extraction
Manufacturing
Construction
Utilities
SeptemberSeptember

Quarterly Report July - September 2018
85
90
95
100
105
110
115
120
125
20
12
20
13
20
14
20
15
20
16
20
17
20
18
Non-residential
Residential
12
Investment is anticipated to have contracted once more during the quarter. The weakness shown by thisindicator thus seems to be aggravating.
Investment and its Components Index 2013=100, s. a.
Investment in Residential andNon-residential Construction
Index 2013=100, s. a.
Real Value of Production by Contracting Institutional Sector 1/
Index Jan-2012=100, s. a.
s. a. / Seasonally adjusted data.Source: Mexico’s National Accounts System (SCNM), INEGI.
s. a. / Seasonally adjusted data.Source: Mexico’s National Accounts System (SCNM), INEGI.
s. a. / Seasonally adjusted and trend data.1/ Seasonally adjusted by Banco de México, except for the seriesregarding total production. Source: Prepared by Banco de México withdata from ENEC, INEGI.
90
95
100
105
110
115
120
125
130
135
140
20
12
20
13
20
14
20
15
20
16
20
17
20
18
August
Construction
Imported machineryand equipment
Total
Domestic machineryand equipment
August September
50
75
100
125
150
175
200
20
12
20
13
20
14
20
15
20
16
20
17
20
18
Private construction excluding housing
Private construction
Total
Public constructionPrivate housing projects

85
90
95
100
105
110
115
120
125
130
20
12
20
13
20
14
20
15
20
16
20
17
20
18
Quarterly Report July - September 2018 13
25
33
41
49
57
65
1.2
1.6
2.0
2.4
2.8
3.2
20
12
20
13
20
14
20
15
20
16
20
17
20
18
90
95
100
105
110
115
65
70
75
80
85
90
95
100
105
110
115
20
12
20
13
20
14
20
15
20
16
20
17
20
18
Monthly Indicator of Private Consumption and its Components Index 2013=100, s. a.
Workers’ Remittances Billion USD and constant pesos, s. a.
Consumer Confidence Index and Total Real Wage Bill
Index 2013 =100, s. a.
s. a. / Seasonally adjusted data.Source: Mexico’s National Accounts System (SCNM), INEGI.
s. a. / Seasonally adjusted data.1/ Prices as of the second half of July 2018.Source: Banco de México and INEGI.
s. a. / Seasonally adjusted data.Source: Prepared by Banco de México with data from the NationalEmployment Survey (ENOE), INEGI and National Consumer ConfidenceSurvey (ENCO), INEGI and Banco de México.
U.S. dollars
Mexican pesos 1/
September
Private consumption continued to show a positive trend.
Q3 2018
Real wage bill
Consumer confidence index
OctoberAugust
Imported goods
Total
Domestic services
Domestic goods

Quarterly Report July - September 2018 14
Manufacturing exports grew at a higher rate vis-à-vis the loss of dynamism exhibited in Q2 2018.
Manufacturing Exports Index 2013 = 100, s. a.
Trade BalanceUSD millions
Current Account Balance% of GDP
s. a. / Seasonally adjusted data.Source: Banco de México with data from SAT, SE, Banco de México, INEGI.Merchandise Trade Balance. SNIEG. Information of National Interest.
Source: SAT, SE, Banco de México, INEGI. Merchandise Trade Balance.SNIEG. Information of National Interest.
Source: Banco de México.
Total
Automotive
Other
October-10,000
-8,000
-6,000
-4,000
-2,000
0
2,000
4,000
6,000
8,000
20
07
20
08
20
09
20
10
20
11
20
12
20
13
20
14
20
15
20
16
20
17
20
18
Q3 2018
Non-oil
Oil
Q3 2018
Total
Moving average (4 quarters)
Current account balance
-5
-4
-3
-2
-1
0
1
20
12
20
13
20
14
20
15
20
16
20
17
20
18
80
90
100
110
120
130
140
150
160
170
20
12
20
13
20
14
20
15
20
16
20
17
20
18

-6
-4
-2
0
2
4
6
20
07
20
08
20
09
20
10
20
11
20
12
20
13
20
14
20
15
20
16
20
17
20
18
3
4
5
6
7
8
9
10
11
12
13
14
15
16
17
18
19
20
21
22
23
-12
-10
-8
-6
-4
-2
0
2
4
6
8
20
07
20
08
20
09
20
10
20
11
20
12
20
13
20
14
20
15
20
16
20
17
20
18
15
In Q3 2018, slack conditions are estimated to have tightened slightly as compared to Q2 2018, although theyremain at levels that are less tight than those exhibited at the beginning of the year.
Output Gap 1/
% of potential output, s. a.Monthly Slack Index 3/
%
s. a. / Estimated with seasonally adjusted data.1/ Estimated using the Hodrick-Prescott (HP) filter with tail correction; see Banco de México Inflation Report, April- June2009, p.69.2/ Excludes oil and gas extraction, services related to mining, quarrying, and oil and gas extraction, and the manufactureof oil and coal products.Note: Confidence interval of the output gap calculated with an unobserved components method. The dotted line refers tothe confidence interval for the gap calculated without the oil sector while the blue area is the interval corresponding tothe total GDP.Source: Estimated by Banco de México with data from INEGI and Banco de México.
3/ Index constructed based on the Model Confidence Set (MCS) methodology; see Banco de México Inflation Report, October– December 2017. Monthly slack index is based on the first principal component of a set that includes 11 indicators. The firstcomponent represents 51% of joint variation of the monthly indicator. Gray lines correspond to individual slack indicatorsused in the analysis of Principal Components.Source: Own elaboration with data from INEGI and Banco de México.
GDP
AugustQ3 2018
Quarterly Report July - September 2018
GDP excluding theoil sector 2/

-4
-3
-2
-1
0
1
2
3
4
20
04
20
06
20
08
20
10
20
12
20
14
20
16
20
18
-4
-3
-2
-1
0
1
2
3
4
5
6
7
20
12
20
13
20
14
20
15
20
16
20
17
20
18
Quarterly Report July - September 2018 16
In particular, slack conditions in the labor market remained narrow. Going forward, wage adjustments shouldbe consistent with productivity gains and institutional arrangements that generate greater persistence ofinflation, should be avoided. (Box: Considerations on Wage Indexation and its Effects on the Economy)
Unemployment rate Unemployment rate andinformal wage workers
Average wage of salaried workers according to the National Employment Survey (ENOE) 2/
Annual % change
s. a. / Seasonally adjusted data.1/ Shadows represent confidence bands. The interval corresponds to two average standard deviations among all estimates.Source: Banco de México with data from INEGI (ENOE).
2/ To calculate average nominal wages, the bottom 1 percent and the top 1 percentin the wage distribution were excluded. Individuals with zero reported income orthose who did not report it are excluded.Source: Calculated by Banco de México with data from INEGI (ENOE).
Labor Market Gap 1/
Percentage points, s. a.
October September Q3 2018
Nominal
Real
-2.0
-1.5
-1.0
-0.5
0.0
0.5
1.0
1.5
2.0
2.5
20
04
20
06
20
08
20
10
20
12
20
14
20
16
20
18

-9
-6
-3
0
3
6
9
12
15
Mar
-13
Sep
-13
Mar
-14
Sep
-14
Mar
-15
Sep
-15
Mar
-16
Sep
-16
Mar
-17
Sep
-17
Mar
-18
Sep
-18
Quarterly Report July - September 2018 17
Since 2015, the Mexican economy has been subject to a strong reduction of external financing, which has beenpartially offset by an increase in domestic financing and a lower absorption of resources by the public sector.
Total
Sources and Uses of Financial ResourcesAnnual flows as % of GDP
Note: Figures expressed in percent of the nominal average annual GDP. Data adjusted due to exchange rate variations and asset prices.1/ Corresponds to the domestic financial assets aggregate F1, composed by monetary and non-monetary domestic sources.2/ Includes monetary instruments held by non-residents (equivalent to the difference between M4 and M3) and other non-monetary external sources(the external debt of the Federal Government, the external debt of public agencies and companies, the external liabilities of commercial banks, externalfinancing to the non-financial private sector, capital raising agencies, among others).3/Includes credit granted by the financial intermediaries, of the National Housing Fund (Infonavit) and Fovissste, the issuance of domestic debt andexternal financing of firms.4/ It includes international reserves, capital accounts, and results and other assets and liabilities of commercial and development banks, non-bankfinancial intermediaries, of the National Housing Fund (Infonavit) and Banco de México –including securities issued by Banco de México for monetaryregulation purposes, especially those related to sterilizing the monetary impact stemming from the operational surplus–. Similarly, it includes non-monetary liabilities from the Institute for the Protection of Bank Savings (IPAB), as well as the effect of the change in the valuation of public debtinstruments, among other concepts.Source: Banco de México.
Total
ExternalDomestic 5/
0
5
10
15
20
Mar
-13
Sep
-13
Mar
-14
Sep
-14
Mar
-15
Sep
-15
Mar
-16
Sep
-16
Mar
-17
Sep
-17
Mar
-18
Sep
-18
Firms 6/
Housing
Consumption
September
Domestic 5/
Note: Total and external financing data for Q3 2018 are preliminary.5/ Data adjusted due to the withdrawal from and the incorporation of some financial intermediaries to the credit statistics.Includes credit from commercial and development banks, as well as other non-bank financial intermediaries. 6/ Dataadjusted due to exchange rate variations.Source: Banco de México.
Financing to the Non-financial Private SectorReal annual % change
Q3 2018Sources
Uses
5.7 5.6 4.6 5.5 6.5 5.3
4.2 4.1
1.21.9
1.30.8
10.0 9.7
5.87.4 7.9
6.1
0
3
6
9
12
2013 2014 2015 2016 2017 Q3 2018
4.22.5 3.1 3.0 3.9 2.8
4.14.7 4.1 2.9 1.1 2.6
1.7 2.4
-1.4
1.5 2.80.7
10.0 9.7
5.8 7.4 7.96.1
-3
0
3
6
9
12
2013 2014 2015 2016 2017 Q3 2018
Domestic 1/
External 2/
Other concepts 4/
Private sector financing 3/
Public sector financing
Total
Total

10.6
-7.6-10
-5
0
5
10
15
20
20
13
20
14
20
15
20
16
20
17
20
18
18
Box: Monetary Policy and Demand for Broad Money
Long-term monetary instruments (M2-M1)Real annual % change
Components of Monetary Aggregate M2 by HolderMonetary aggregate M1
Real annual % change
Source: Banco de México.
Box 3 presents the analysis of the effect ofmonetary policy actions on the demand forbroad money.
Specifically, the analysis suggests that increases inthe reference rate have favored greater financialsaving by the private sector in long-terminstruments and have discouraged holdings ofliquid instruments.
This has been mainly perceived in greater financialsaving by households.
Thus, by encouraging domestic financial saving, atighter monetary policy stance has contributedto mitigate the effects of the tighter externalfinancing faced by the Mexican economy.
5.2
-1.4
-10
-5
0
5
10
15
20
20
13
20
14
20
15
20
16
20
17
20
18
Quarterly Report July - September 2018
September
Households
Households
Businesses
Businesses
September

19Quarterly Report July - September 2018
Outline
External conditions1
Current situation of the Mexican economy2
Forecasts and final remarks5
Inflation3
Monetary policy4

0
1
2
3
4
5
6
7
8
20
11
20
12
20
13
20
14
20
15
20
16
20
17
20
18
20
During 2018, as a reflection of both the increase in non-core inflation and the resistance to continuedeclining displayed by the core component, annual headline inflation increased. However, it declined inOctober and in the first half of November, which is largely accounted for by the decrease in annual non-coreinflation.
Quarterly Report July - September 2018
National Consumer Price Index
0
1
2
3
4
5
6
7
8
9
10
11
12
13
20
10
20
11
20
12
20
13
20
14
20
15
20
16
20
17
20
18
Source: Banco de México and INEGI.
Variability interval
1H-November
7.46
4.56
3.63
Incidences in percentage points1H-November
CoreNon-core
Headline
Annual % change
Source: Banco de México and INEGI.
4.56Headline
Core
Non-core

21
Non-core Price IndexAnnual % change
Energy Price Index Incidences in percentage points
Source: Banco de México and INEGI. Source: Banco de México and INEGI.
Quarterly Report July - September 2018
-12
-8
-4
0
4
8
12
16
20
20
10
20
11
20
12
20
13
20
14
20
15
20
16
20
17
20
18
1H-November
Non-core
Agriculture
Energy and government authorized prices
-5
0
5
10
15
20
25
20
15
20
16
20
17
20
18
1H-November
The increase in non-core inflation in Q3 2018 was due to the higher growth rates of energy prices, inparticular, to increments in the prices of gasoline, LP gas and electricity fares as compared to the sameperiod of 2017.
Energy
Electricity
Natural gas
L.P. gas
Gasoline

Quarterly Report July - September 2018 22
Merchandise Services
Source: Banco de México and INEGI. Source: Banco de México and INEGI.
-3
-1
1
3
5
7
9
20
10
20
11
20
12
20
13
20
14
20
15
20
16
20
17
20
18
-1
0
1
2
3
4
5
6
7
20
10
20
11
20
12
20
13
20
14
20
15
20
16
20
17
20
18
Services
Other services
Core Price IndexAnnual % change
Core inflation showed resistance to decline. In part, this is due to the indirect effects of higher energy prices,and to the upward trend followed by the component of services other than housing and education. (Box:Indirect Effects of Higher Energy Prices on Core Inflation)
1H-November1H-November
Core Inflation and FundamentalCore Inflation
Annual % change
0
1
2
3
4
5
6
7
8
20
07
20
08
20
09
20
10
20
11
20
12
20
13
20
14
20
15
20
16
20
17
20
18
Source: Banco de México and INEGI.
1H-November
Core
Fundamental core
Merchandise
Food, beverages and tobacco
Non-food merchandise

23Quarterly Report July - September 2018
Outline
External conditions1
Current situation of the Mexican economy2
Forecasts and final remarks5
Inflation3
Monetary policy4

Quarterly Report July - September 2018 24
Monetary Policy Conduct The Governing Board noted a certain easing in slack conditions relative to those
exhibited in Q1 2018, highlighting the transitory nature of the shocks that affectedinflation and expectations of lower core inflation.
August and October 2018:
Rate unchanged at 7.75%
Non-core inflation remains at high levels and the core component displays aresistance to decline.
Inflation faces considerable challenges associated to a possible adoption of policiesthat may affect the price formation process in a structural sense.
The balance of risks for inflation remains biased upwards and it has deterioratedsignificantly, in both the short and medium terms.
November 2018: 25 bps
increase to 8.00%
The Board stressed the risks and the uncertainty related to such scenario.
The Governing Board noted that, considering the challenges that have been faced to consolidate a low and stable inflation, itwill take the necessary actions, specifically, maintaining or possibly strengthening the current monetary policy stance, so thatheadline inflation converges to Banco de México’s target within monetary policy’s period of influence.

Quarterly Report July - September 2018
-2
-1
0
1
2
3
4
5
20
09
20
10
20
11
20
12
20
13
20
14
20
15
20
16
20
17
20
18
Monetary Policy Rate and Consumer Price Index % and annual % change
Short-term Ex-ante Real Rate and Estimated Range for the Short-term Neutral Real Rate in the Long Term 1/
%
Source: Banco de México and INEGI. 1/ The short-term ex-ante real rate is constructed using the Target for the Overnight Interbank Interest Rate and 12-monthinflation expectations from Banco de México Survey. The dotted line corresponds to the midpoint of the range.Source: Banco de México.
2
3
4
5
6
7
8
9
20
09
20
10
20
11
20
12
20
13
20
14
20
15
20
16
20
17
20
18
Target for the overnightinterbank interest rate
November
Headline inflation
Core inflation
1H November
Headline inflation target
November
25
Thus, the target for the overnight interbank interest rate is currently at 8.00%. Based on the monetary policyactions described above, and considering the evolution of 12-month inflation expectations, the ex-ante realinterest rate increased to 4.2%.
Short-term ex-ante real rate
Short-term neutral real raterange in the long term

Quarterly Report July - September 2018
2.0
2.5
3.0
3.5
4.0
4.5
5.0
5.5
6.0
6.5
7.0
20
05
20
08
20
11
20
14
20
17
1.5
2.0
2.5
3.0
3.5
4.0
4.5
Jan
-14
Jul-
14
Jan
-15
Jul-
15
Jan
-16
Jul-
16
Jan
-17
Jul-
17
Jan
-18
Jul-
18
2.5
3.0
3.5
4.0
4.5
5.0
Jan
-16
Ap
r-1
6
Jul-
16
Oct
-16
Jan
-17
Ap
r-1
7
Jul-
17
Oct
-17
Jan
-18
Ap
r-1
8
Jul-
18
Oct
-18
Headline and Core Long term
Source: Banco de México Survey (monthly periodicity).
2018
2019
Next 5-8 years
Next 4 years
Market instruments 1/
Inflation target
Citibanamex next 3-8 years
Inflation ExpectationsMedian, %
October October
26
Inflation expectations for 2018 were adjusted upwards in the period June-October 2018, given that the observedinflation was higher than anticipated by analysts, while expectations for 2019 increased to a lesser degree. Thebreakeven inflation rate increased considerably.
1/ For a description of the estimation of long-term inflation expectations, see Box“Decomposition of Break-even Inflation” in Banco de México’s Quarterly Report,October –December 2013. For this report, the estimate was updated using data upto November 2017. Source: Banco de México Survey (monthly periodicity) andCitibanamex Survey (biweekly periodicity).
Source: Estimated by Banco de México with data from Valmer and Bloomberg.
Breakeven Inflation RateImplicit in Bonds
%HeadlineCore
20-day moving average
10-year bond breakeveninflation rate
NovemberNovember
Quarterly Report July - September 2018 27
16
17
18
19
20
21
22
23
24
Jan
-17
Mar
-17
May
-17
Jul-
17
Sep
-17
No
v-1
7
Jan
-18
Mar
-18
May
-18
Jul-
18
Sep
-18
No
v-1
8
Nominal Exchange Rate 1/
Pesos per USD
8
10
12
14
16
18
20
22
24
Jan
-17
Mar
-17
May
-17
Jul-
17
Sep
-17
No
v-1
7
Jan
-18
Mar
-18
May
-18
Jul-
18
Sep
-18
No
v-1
8
Implied Volatility in FX Options%
1/ Observed exchange rate refers to the daily FIX exchange rate. Figures next to analysts’ expectationscorrespond to the averages drawn from the Banco de México survey for October and Citibanamex surveyfor November 20, 2018.Source: Banco de México.
Source: Bloomberg.
Exchange rate (as of November 23) 20.39
Analysts’ expectations 2018 Banxico 19.10
Depreciation
November November
Analysts’ expectations 2019 Citibanamex 19.95
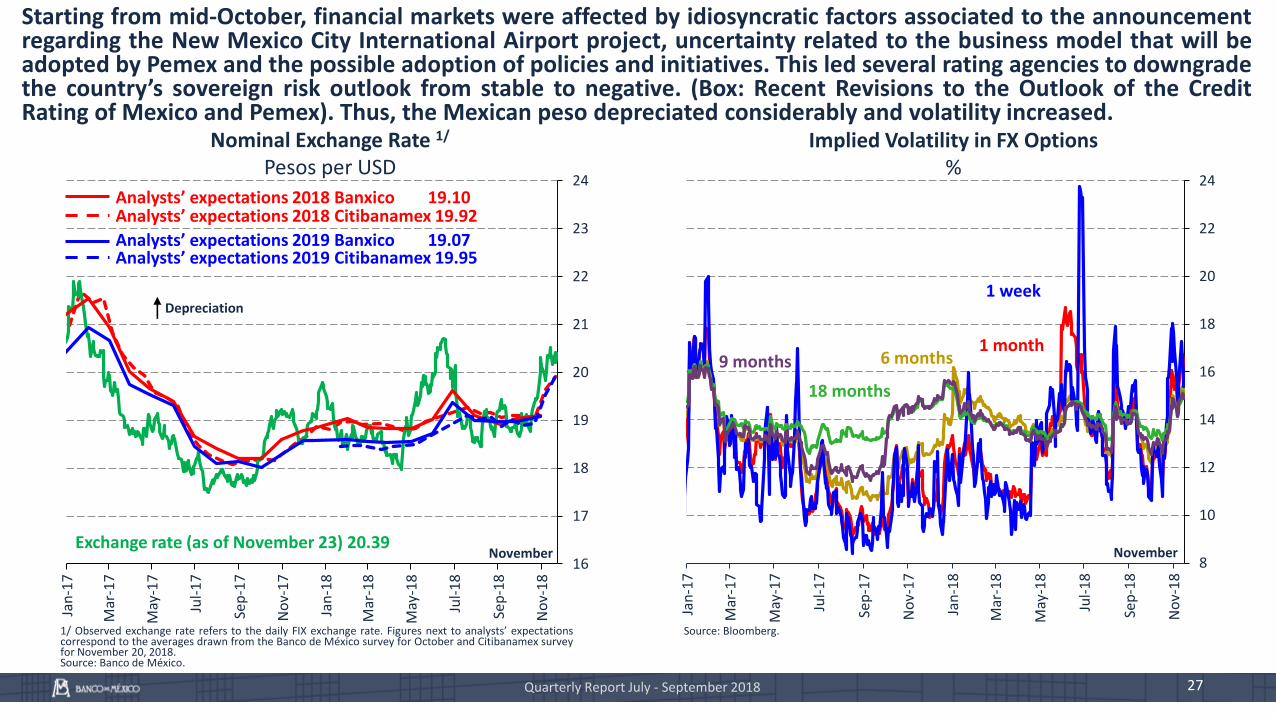
Starting from mid-October, financial markets were affected by idiosyncratic factors associated to the announcementregarding the New Mexico City International Airport project, uncertainty related to the business model that will beadopted by Pemex and the possible adoption of policies and initiatives. This led several rating agencies to downgradethe country’s sovereign risk outlook from stable to negative. (Box: Recent Revisions to the Outlook of the CreditRating of Mexico and Pemex). Thus, the Mexican peso depreciated considerably and volatility increased.
1 month
1 week
Analysts’ expectations 2018 Citibanamex 19.92
Analysts’ expectations 2019 Banxico 19.07
18 months
9 months 6 months

Quarterly Report July - September 2018 28
2
3
4
5
6
7
8
9
10
20
15
20
16
20
17
20
18
Interest Rates %
Source: Proveedor Integral de Precios (PiP).
November
Source: Proveedor Integral de Precios (PiP).
1 day
3 month
2 year
1 year
10 year
Yield Curve%
Interest rates registered widespread and sizeable increases, especially medium- and long-term ones. As aresult, the slope of the yield curve steepened considerably. Monetary policy actions have contributed toincrease short-term U.S. spreads, and to prevent long-term spreads from widening further.
30 year
6 month
Term Premium in Mexico 1/
Basis points
1/ The term premia is obtained as the difference between 10-year zero couponbond rate less the average expectation of the short-term interest rate in along-term horizon (10-years) measured as a basis of the continuouslycompounded interest. Source: Estimated by Banco de México with data fromValmer, Proveedor Integral de Precios (PiP) and Bloomberg.
November0
50
100
150
200
250
300
20
12
20
13
20
14
20
15
20
16
20
17
20
18 2
3
4
5
6
7
8
1 1 3 6 1 2 3 5 10 20 30
Dec 29, 2017
Nov 27, 2018
Jun 29, 2018
Mar 28, 2018
Dec 01, 2015
Months YearsDay

Spreads between Mexican and U.S. Interest Rates 1/
%
Volatility-adjusted 3-month Interest Rate Spread for Selected Emerging Countries 3/
Index
Sovereign Credit Default Swaps (5-Year CDS) Basis points
2/ For the U.S. target rate, the average of the interval considered by the FederalReserve is used.Source: Proveedor Integral de Precios (PiP) and U.S. Department of the Treasury.
Source: Bloomberg.1/ For the U.S. target rate, the average of the interval considered by the Federal Reserve isused.Source: Proveedor Integral de Precios (PiP) and U.S. Department of the Treasury.
It is notable, however, that the spreads between Mexican and U.S. interest rates have increased recently,reflecting the large increase in the different risk premia that investors demand for holding domestic assets.Meanwhile, market indicators that measure Mexico’s sovereign credit risk, along with risk premia, increasedconsiderably.
Quarterly Report July - September 2018 29
-0.2
-0.1
0.0
0.1
0.2
0.3
0.4
0.5
0.6
0.7
0.8
0.9
1.0
1.1
20
15
20
16
20
17
20
18
Range
Emerging economy average
Mexico
November
November
1 day
3 month
2 year
1 year
10 year
30 year
6 month Mexico
Colombia
Chile
2
3
4
5
6
7
8
9
20
08
20
09
20
10
20
11
20
12
20
13
20
14
20
15
20
16
20
17
20
18
November-100
0
100
200
300
400
500
600
0
50
100
150
200
250
300
350
400
450
20
14
20
15
20
16
20
17
20
18
Turkey
Brazil

Quarterly Report July - September 2018 30
The Governing Board has closely followed the development of inflation vis-à-vis itsanticipated trajectory, taking into account the monetary policy stance adopted and the timeframe in which monetary policy operates, as well as available information on all inflationdeterminants and on medium- and long-term inflation expectations, including the balanceof risks to such factors.
Monetary policy must respond prudently if for any reason the uncertainty faced by theMexican economy increases considerably.
Under the current environment of uncertainty, the Governing Board will follow closely:
The potential pass-through of exchange rate fluctuations to prices.
The monetary policy stance relative to that of the U.S. under an adverse externalenvironment.
The development of slack conditions in the Mexican economy.
Monetary Policy Conduct

31
Monetary Policy Conduct
Banco de México acknowledges that monetary policy has been conducted in an environmentof high uncertainty, which has become more complex.
In addition to the risks to inflation that have been described in detail in severalcommunication channels of Banco de México, other risks of a structural nature have emerged.
Among them is the possibility of actions that could contribute to a greater persistence ofinflation, by affecting the price formation process, associated to changes in the determinationof wages and other inputs.
In this context, if the complex environment faced by inflation persists or even worsens, higherinterest rates would need to be maintained throughout the business cycle.
Quarterly Report July - September 2018

32
Box: Monetary Policy and Economic Activity
Mexico: Economic Growth and Inflation, 1950-2017%
Source: IMF statistics, Banco de México and INEGI.
When conducting monetary policy, Banco deMéxico considers at all times its scope andlimitations.
As shown by economic analysis and empiricalevidence, it is impossible for monetary policy toaffect economic activity permanently.
Systematic expansionary policies only result inincreasingly higher inflation without affecting theeconomy’s potential GDP.
Given the costs of high inflation, the best way thecentral bank can contribute to foster productiveactivities is by focusing on procuring pricestability.
Quarterly Report July - September 2018
-8
-4
0
4
8
12
16
0
20
40
60
80
100
120
140
160
180
Ec
on
om
ic g
row
th
Inflation

33Quarterly Report July - September 2018
Outline
External conditions1
Current situation of the Mexican economy2
Forecasts and final remarks5
Inflation3
Monetary policy4

-1
0
1
2
3
4
5
6
-1
0
1
2
3
4
5
6
Q2 Q4 Q2 Q4 Q2 Q4 Q2 Q4 Q2 Q4 Q2 Q4 Q2 Q4 Q2 Q4
Observed
Central scenario previous report
Central scenario current report
Quarterly Report July - September 2018 34
Fan Chart: GDP GrowthAnnual %, s. a.
s. a. / Seasonally adjusted data.Source: INEGI and Banco de México.
Economic Activity Outlook
2013 2014 2015 2016 2017 2018 2019 2020
Increase in the number of IMSS-insured jobs
(Thousands)
Report Apr-Jun 2018 Jul-Sep 2018
2018 670 – 770 670 – 740
2019 670 – 770 670 – 770
2020 -- 690 – 790
GDP growth
(%)
Report Apr-Jun 2018 Jul-Sep 2018
2018 2.0 – 2.6 2.0 – 2.4
2019 1.8 – 2.8 1.7 – 2.7
2020 -- 2.0 – 3.0
Current account deficit
(% of GDP)
Report Apr-Jun 2018 Jul-Sep 2018
2018 1.9 1.9
2019 2.1 2.3
2020 -- 2.3
2018Q4
2019Q4
2020Q4

35Quarterly Report July - September 2018
Risks to Growth OutlookThe balance of risks for Mexico’s economic growth from a cyclical perspective remains biased to the
downside and is considered to have deteriorated at the margin.
That the recent announcements of the trade agreement with the USA and Canada lead to a notable recovery ininvestment.
That the greater-than-anticipated dynamism of U.S. industrial production favors Mexican exports.
That a greater-than-expected public spending is registered.
Upward:
Mo
net
ary
po
licy
fore
cast
ho
rizo
n That the environment of uncertainty that has been affecting investment persists, or even deteriorates.
That the ratification and implementation of the trade treaty with the USA and Canada is delayed.
That the escalation of protectionist measures at the global level affects world growth, investment and tradenegatively, to the detriment of economic activity in Mexico.
That bouts of volatility in international financial markets are observed.
That the execution of public spending is delayed given the challenges to implement the public policy agendaassociated with the start of the incoming administration.
Downward:

36Quarterly Report July - September 2018
Risks to GrowthThe Mexican economy faces different risks that could not only affect its cyclical growth, but also negatively
impact its growth potential in the medium and long terms.
That public policy decisions generate concern in the markets, along with a loss of confidence in Mexico as an investment destination.
That the structural measures aimed to boost Mexico’s productivity are weakened or fail to be implemented.
That the adopted protectionist measures, or the implementation of new ones, impact global value chains negatively.
That the competitiveness of the Mexican economy is affected by a number of external and domestic factors, such as corporate tax cuts in the U.S.
That public safety issues, corruption, impunity and the lack of rule of law intensify.
Downward:
Me
diu
m a
nd
lon
g te
rms

-3
-2
-1
0
1
2
3
-3
-2
-1
0
1
2
3
Q22013
Q4Q22014
Q4Q22015
Q4Q22016
Q4Q22017
Q4Q22018
Q4Q22019
Q4Q22020
Q4
Central scenariocurrent report
Central scenarioprevious report
-6
-5
-4
-3
-2
-1
0
1
2
3
4
5
6
-6
-5
-4
-3
-2
-1
0
1
2
3
4
5
6
Q2Q4Q2Q4Q2Q4Q2Q4Q2Q4Q2Q4Q2Q4Q2Q4
Observed
Central scenario previous report
Central scenario current report
-6
-5
-4
-3
-2
-1
0
1
2
3
4
5
6
-6
-5
-4
-3
-2
-1
0
1
2
3
4
5
6
Q2Q4Q2Q4Q2Q4Q2Q4Q2Q4Q2Q4Q2Q4Q2Q4
Observed
Central scenario previous report
Central scenario current report
Quarterly Report July - September 2018 37
With respect to the cyclical position of the economy, slack conditions are anticipated to remain somewhatloose in the forecast horizon.
Output Gap Estimate% of potential output, s. a.
s. a. / Elaborated with seasonally adjusted data.Source: Banco de México.
Note: The dynamics expected for this indicator is consistent with the forecastsfor the output that excludes the oil sector. It is not feasible to calculate a fanchart because of the nature of the forecast construction.Source: Banco de México.
2018Q2
Output Gap Estimate Excluding the Oil Sector% of potential output, s. a.
Quarterly Slack Index
2013 2014 2015 2016 2017 2018 2019 2020s. a. / Elaborated with seasonally adjusted data.Source: Banco de México.
Fan Charts
2018Q4
2019Q4
2020Q4
2018Q4
2019Q4
2020Q4
2013 2014 2015 2016 2017 2018 2019 2020
Forecast

0.0
0.5
1.0
1.5
2.0
2.5
3.0
3.5
4.0
4.5
5.0
5.5
6.0
6.5
7.0
7.5
8.0
0.0
0.5
1.0
1.5
2.0
2.5
3.0
3.5
4.0
4.5
5.0
5.5
6.0
6.5
7.0
7.5
8.0
Q2 Q4 Q2 Q4 Q2 Q4 Q2 Q4 Q2 Q4 Q2 Q4 Q2 Q4 Q2
Observed inflation
Central scenario previous report
Central scenario current report
Headline inflation target
0.0
0.5
1.0
1.5
2.0
2.5
3.0
3.5
4.0
4.5
5.0
5.5
6.0
6.5
7.0
7.5
8.0
0.0
0.5
1.0
1.5
2.0
2.5
3.0
3.5
4.0
4.5
5.0
5.5
6.0
6.5
7.0
7.5
8.0
Q2 Q4 Q2 Q4 Q2 Q4 Q2 Q4 Q2 Q4 Q2 Q4 Q2 Q4 Q2
Observed inflation
Central scenario previous report
Central scenario current report
Headline inflation target
Quarterly Report July - September 2018 38
1/ Quarterly average of annual inflation. The next four and six quarters are indicated as of the fourth quarter of 2018, that is, the fourth and second quarter of 2019 and 2020 respectively, periods in which themonetary policy transmission channels fully operate. */ Observed.Source: Banco de México and INEGI.
Headline inflation is forecast to come close to the 3% target in 2019, and to be around this target in 1H 2020.The trajectory of core inflation has also been adjusted upwards for the next months, although, considering theimplemented monetary policy actions, it is anticipated to reach the same level as that mentioned in theprevious Report in 1H 2020.
4QR
6QR
Next
2013 2014 2015 2016 2017 2018 2019 2020
Annual Headline Inflation 1/
%Annual Core Inflation 1/
%
Fan Charts
4QR
6QR
Next
2013 2014 2015 2016 2017 2018 2019 2020
Q3 Q4 Q1 Q2 Q3 Q4 Q1 Q2 Q3
Current 4.9* 4.7 4.4 4.4 3.8 3.4 3.3 3.1 3.0
Previous 4.8 4.2 3.8 3.6 3.2 3.3 3.2 3.1
2018 2019 2020
Q3 Q4 Q1 Q2 Q3 Q4 Q1 Q2 Q3
Current 3.6* 3.7 3.6 3.6 3.4 3.1 3.0 2.9 2.7
Previous 3.6 3.5 3.3 3.2 3.0 2.9 3.0 2.9

Upward
Risks to Inflation OutlookThe balance of risks vis-à-vis the anticipated inflation trajectory has deteriorated and displays a significant
upward bias. In addition, the economy faces structural risks stemming from policies that could generate major changes in the economy.
Quarterly Report July - September 2018 39
Mo
net
ary
po
licy
fore
cast
ho
rizo
nSt
ruct
ura
l
That the potential growth of the economy declines.
That a structural weakness of public finances is observed.
That medium- and long-term inflation expectations are revised upwards.
That conditions of access to external financing are affected to a larger degree.
That the real exchange rate shows an increasing tendency to depreciate.
That the Mexican peso exchange rate continues to be subject to pressures stemming from higher externalinterest rates, and other external and domestic factors.
That pressures on energy prices persist or agricultural product prices increase.
That an escalation of protectionist and compensatory measures is registered worldwide.
That a deterioration of public finances is observed.
Given the observed shocks and the inflation levels, there is the risk of second-round effects on the priceformation process.
That wage negotiations are not consistent with productivity gains.

Quarterly Report July - September 2018 40
Final Remarks
It is essential to preserve and strengthen a solid macroeconomic framework that prioritizes fiscaldiscipline and price stability, enhancing the transparency and accountability of public policies.
In addition, structural and institutional problems should be dealt with, as they discourageinvestment and hinder productivity growth, while keeping in mind that the only way to generatebetter-paid jobs is by increasing productivity. (Box: Economic Growth and Productivity)
Conditions of increased competition should be fostered across the different sectors of economic activity,and incentives should be generated to favor value creation rather than rent extraction. Similarly, it isnecessary to invest in the infrastructure, which allows the country to strengthen its domestic market andto further exploit the country's export vocation.
Furthermore, adequate policies should be adopted across the different sectors of the economy toimprove public safety and to fight corruption, and as well as to guarantee full respect for privateproperty and to foster an environment of certainty for investment and for the rule of law toprevail. (Box: Weakness of the Rule of Law and Insecurity as Obstacles for Economic Growth inMexico)