Presentación de PowerPoint - Vidrala
35
COMPANY PRESENTATION APRIL 2021
Transcript of Presentación de PowerPoint - Vidrala
COMPANY
PRESENTATIONAPRIL 2021
DISCLAIMER
This presentation includes or may include representations or estimations concerning the
future about intentions, expectations or forecasts of VIDRALA or its management. which
may refer to the evolution of its business performance and its results. These forward-looking
statements refer to our intentions, opinions and future expectations, and include, without
limitation, statements concerning our future business development and economic
performance. While these forward-looking statements represent our judgment and future
expectations concerning the development of our business, a number of risks, uncertainties
and other important factors could cause actual developments and results to differ
materially from our expectations. These factors include, but are not limited to, (1) general
market, macro-economic, governmental and regulatory trends, (2) movements in local
and international securities markets, currency exchange rates and interest rates as well as
commodities, (3) competitive pressures, (4) technological developments, (5) changes in
the financial position or credit worthiness of our customers, obligors and counterparties.
The risk factors and other key factors that we have indicated in our past and future filings
and reports, including those with the regulatory and supervisory authorities (including the
Spanish Securities Market Authority – Comisión Nacional del Mercado de Valores - CNMV),
could adversely affect our business and financial performance. VIDRALA expressly
declines any obligation or commitment to provide any update or revision of the
information herein contained, any change in expectations or modification of the facts,
conditions and circumstances upon which such estimations concerning the future have
been based, even if those lead to a change in the strategy or the intentions shown herein.
This presentation can be used by those entities that may have to adopt decisions or
proceed to carry out opinions related to securities issued by VIDRALA and, in particular, by
analysts. It is expressly warned that this document may contain not audited or summarised
information. It is expressly advised to the readers of this document to consult the public
information registered by VIDRALA with the regulatory authorities, in particular, the
periodical information and prospectuses registered with the Spanish Securities Market
Authority – Comisión Nacional del Mercado de Valores (CNMV).
3
INDEX
1. GENERAL OVERVIEW
2. BUSINESS FUNDAMENTALS
3. FINANCIALS
4. TARGETS
5. ANNEXES
4
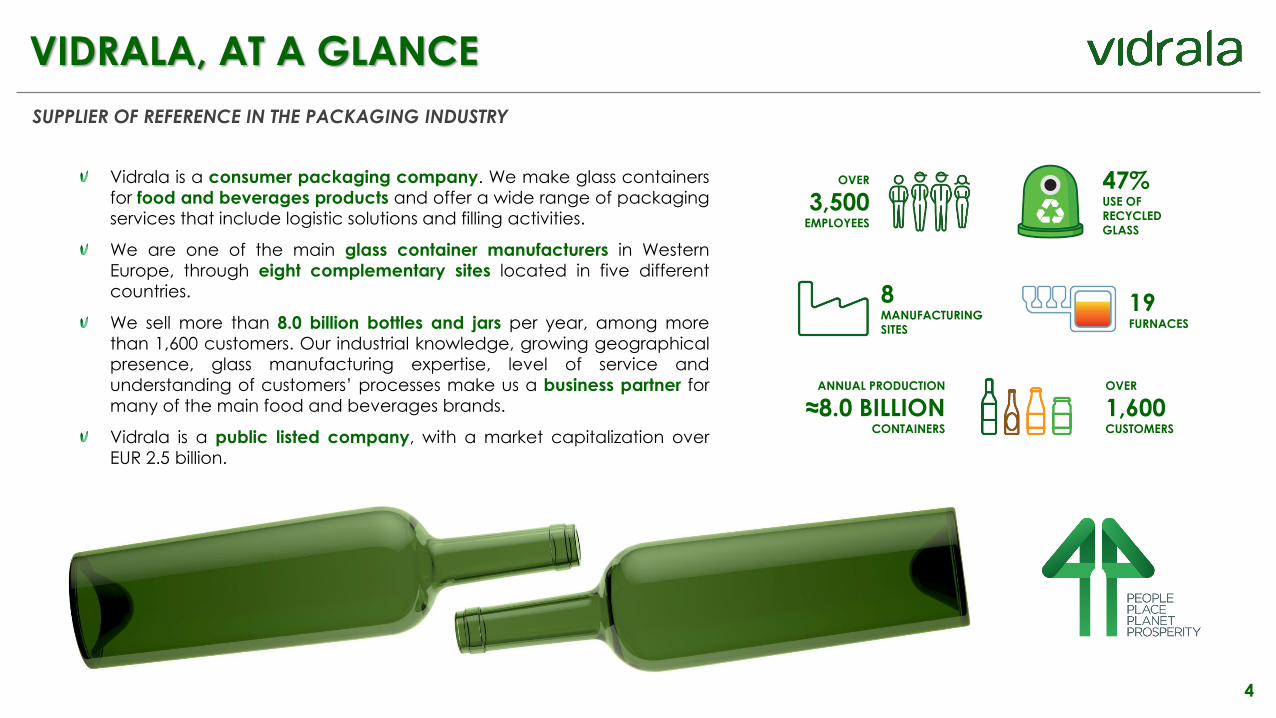
VIDRALA, AT A GLANCE
SUPPLIER OF REFERENCE IN THE PACKAGING INDUSTRY
Vidrala is a consumer packaging company. We make glass containers
for food and beverages products and offer a wide range of packaging
services that include logistic solutions and filling activities.
We are one of the main glass container manufacturers in Western
Europe, through eight complementary sites located in five different
countries.
We sell more than 8.0 billion bottles and jars per year, among more
than 1,600 customers. Our industrial knowledge, growing geographical
presence, glass manufacturing expertise, level of service and
understanding of customers’ processes make us a business partner for
many of the main food and beverages brands.
Vidrala is a public listed company, with a market capitalization over
EUR 2.5 billion.
8MANUFACTURING
SITES
19FURNACES
OVER
1,600CUSTOMERS
ANNUAL PRODUCTION
≈8.0 BILLIONCONTAINERS
OVER
3,500EMPLOYEES
47%USE OF
RECYCLED
GLASS
5
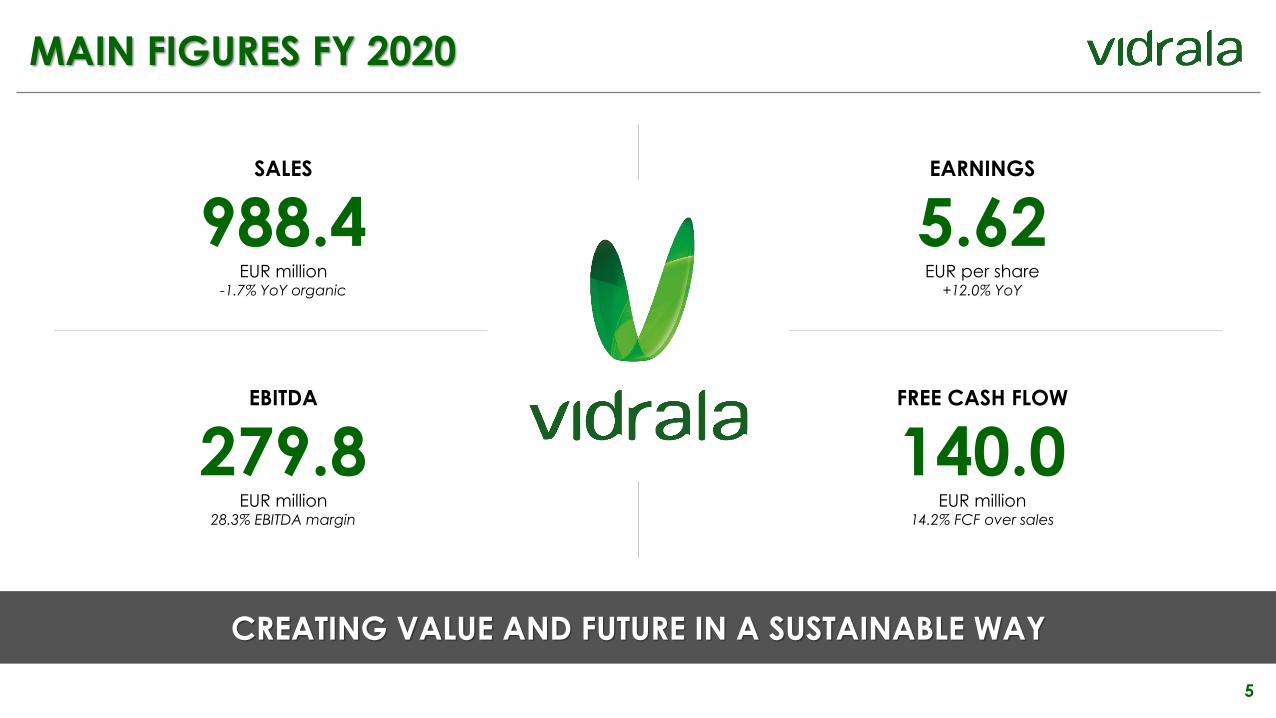
MAIN FIGURES FY 2020
CREATING VALUE AND FUTURE IN A SUSTAINABLE WAY
SALES
988.4EUR million
-1.7% YoY organic
EBITDA
279.8EUR million
28.3% EBITDA margin
EARNINGS
5.62EUR per share
+12.0% YoY
FREE CASH FLOW
140.0EUR million
14.2% FCF over sales
6
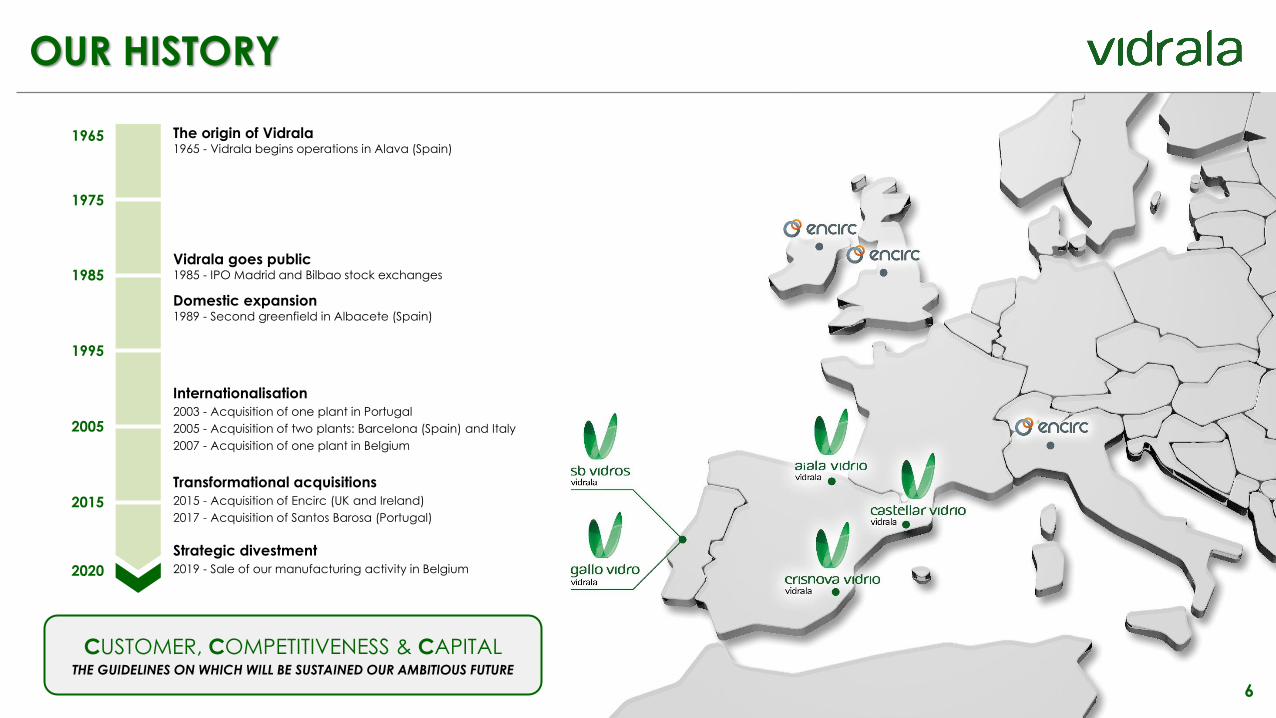
OUR HISTORY
1965
1975
1985
1995
2005
2015
2020
The origin of Vidrala1965 - Vidrala begins operations in Alava (Spain)
Vidrala goes public1985 - IPO Madrid and Bilbao stock exchanges
Domestic expansion1989 - Second greenfield in Albacete (Spain)
Internationalisation
2003 - Acquisition of one plant in Portugal
2005 - Acquisition of two plants: Barcelona (Spain) and Italy
2007 - Acquisition of one plant in Belgium
Transformational acquisitions
2015 - Acquisition of Encirc (UK and Ireland)
2017 - Acquisition of Santos Barosa (Portugal)
Strategic divestment
2019 - Sale of our manufacturing activity in Belgium
CUSTOMER, COMPETITIVENESS & CAPITALTHE GUIDELINES ON WHICH WILL BE SUSTAINED OUR AMBITIOUS FUTURE
7
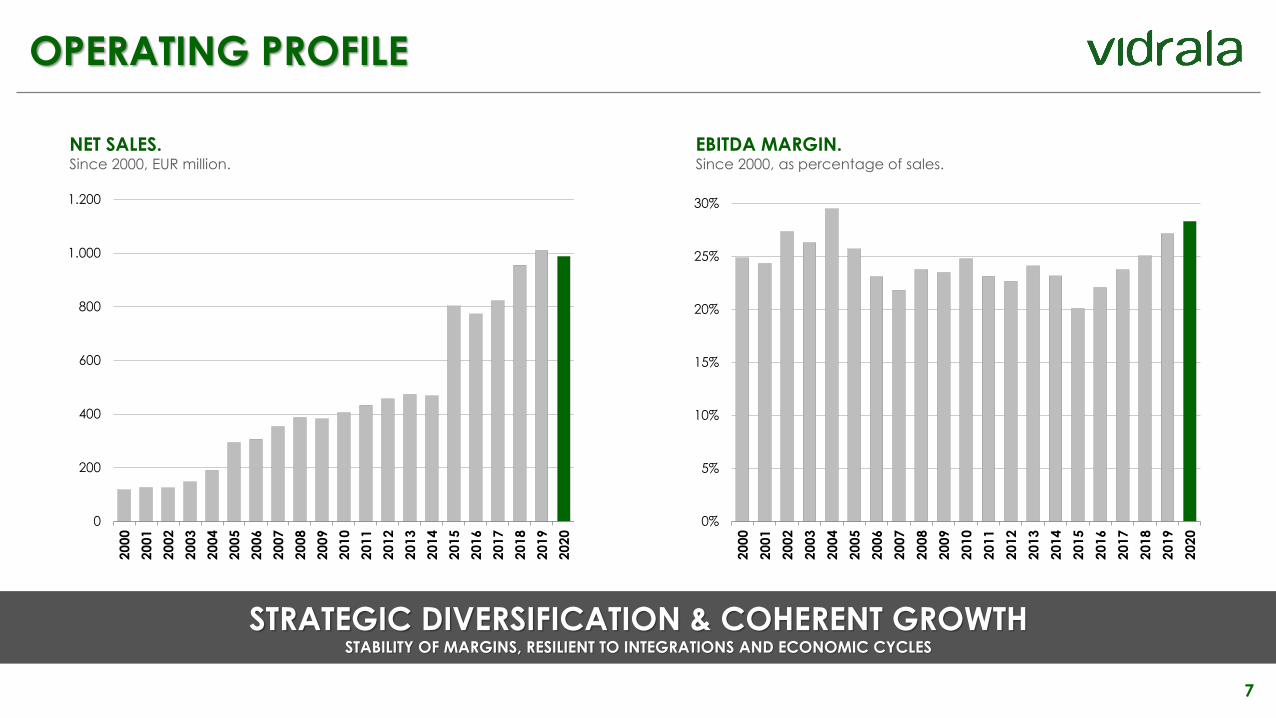
OPERATING PROFILE
STRATEGIC DIVERSIFICATION & COHERENT GROWTHSTABILITY OF MARGINS, RESILIENT TO INTEGRATIONS AND ECONOMIC CYCLES
NET SALES.Since 2000, EUR million.
EBITDA MARGIN.Since 2000, as percentage of sales.
0%
5%
10%
15%
20%
25%
30%
20
00
20
01
20
02
20
03
20
04
20
05
20
06
20
07
20
08
20
09
20
10
20
11
20
12
20
13
20
14
20
15
20
16
20
17
20
18
20
19
20
20
0
200
400
600
800
1.000
1.200
20
00
20
01
20
02
20
03
20
04
20
05
20
06
20
07
20
08
20
09
20
10
20
11
20
12
20
13
20
14
20
15
20
16
20
17
20
18
20
19
20
20
8
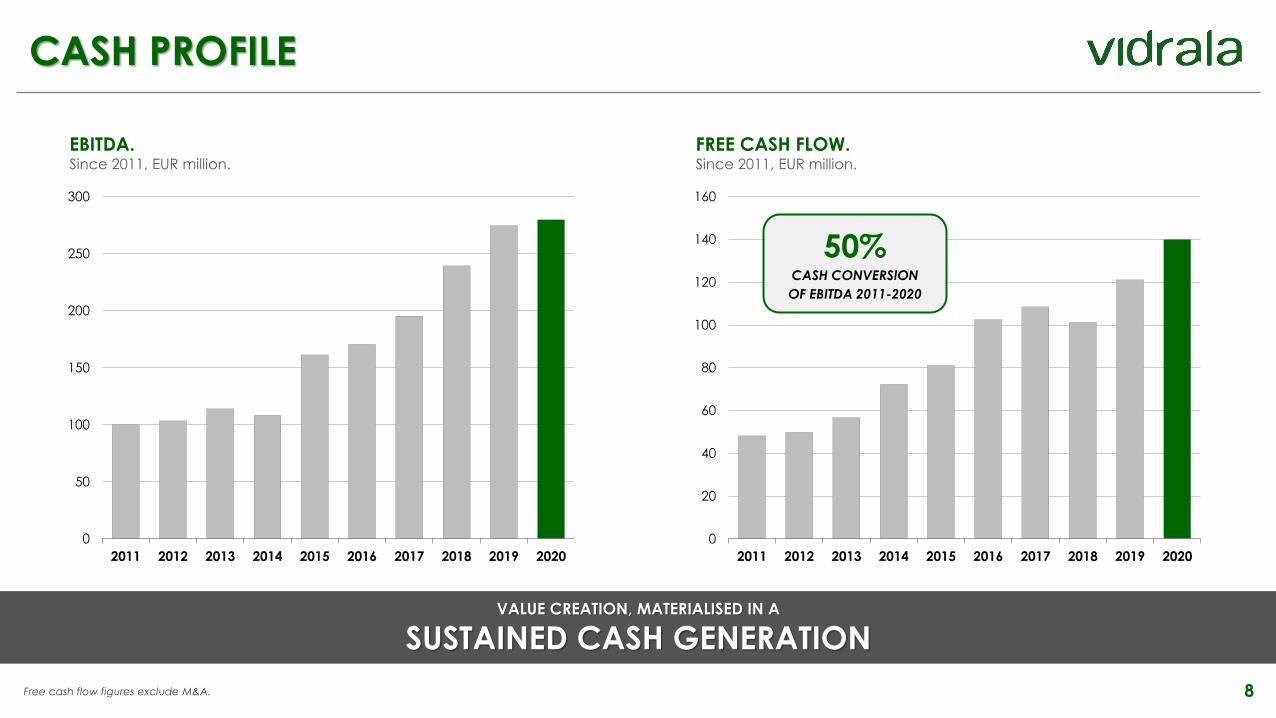
CASH PROFILE
VALUE CREATION, MATERIALISED IN A
SUSTAINED CASH GENERATION
EBITDA.Since 2011, EUR million.
FREE CASH FLOW.Since 2011, EUR million.
0
50
100
150
200
250
300
2011 2012 2013 2014 2015 2016 2017 2018 2019 2020
0
20
40
60
80
100
120
140
160
2011 2012 2013 2014 2015 2016 2017 2018 2019 2020
Free cash flow figures exclude M&A.
50%CASH CONVERSION
OF EBITDA 2011-2020
9
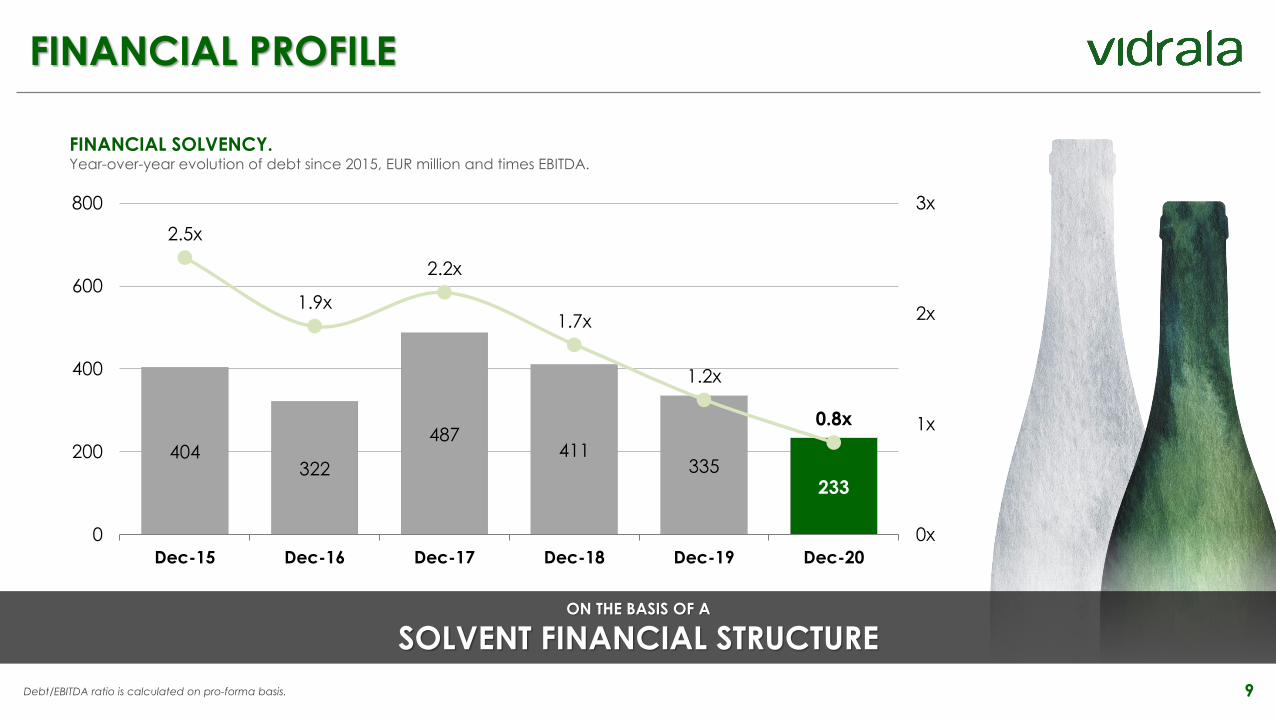
FINANCIAL PROFILE
ON THE BASIS OF A
SOLVENT FINANCIAL STRUCTURE
Debt/EBITDA ratio is calculated on pro-forma basis.
FINANCIAL SOLVENCY.Year-over-year evolution of debt since 2015, EUR million and times EBITDA.
404322
487411
335233
2.5x
1.9x
2.2x
1.7x
1.2x
0.8x
0x
1x
2x
3x
0
200
400
600
800
Dec-15 Dec-16 Dec-17 Dec-18 Dec-19 Dec-20
10
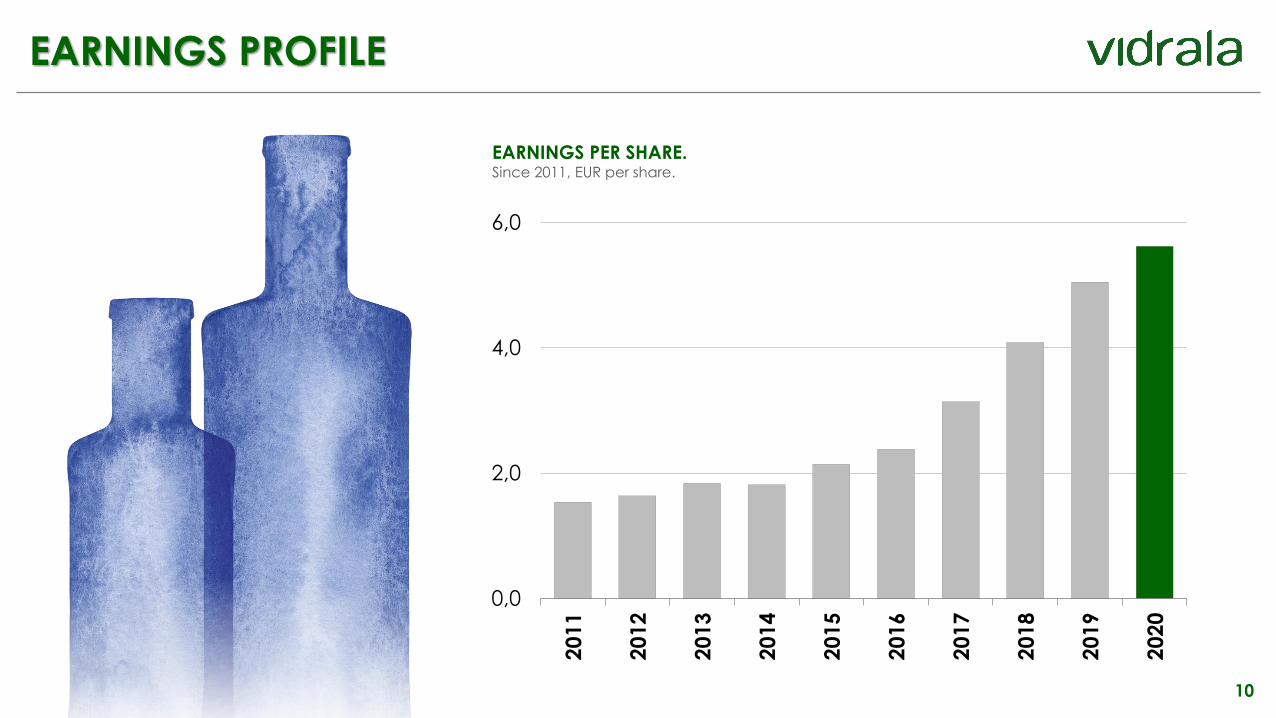
EARNINGS PROFILE
EARNINGS PER SHARE.Since 2011, EUR per share.
0,0
2,0
4,0
6,0
20
11
20
12
20
13
20
14
20
15
20
16
20
17
20
18
20
19
20
20
11
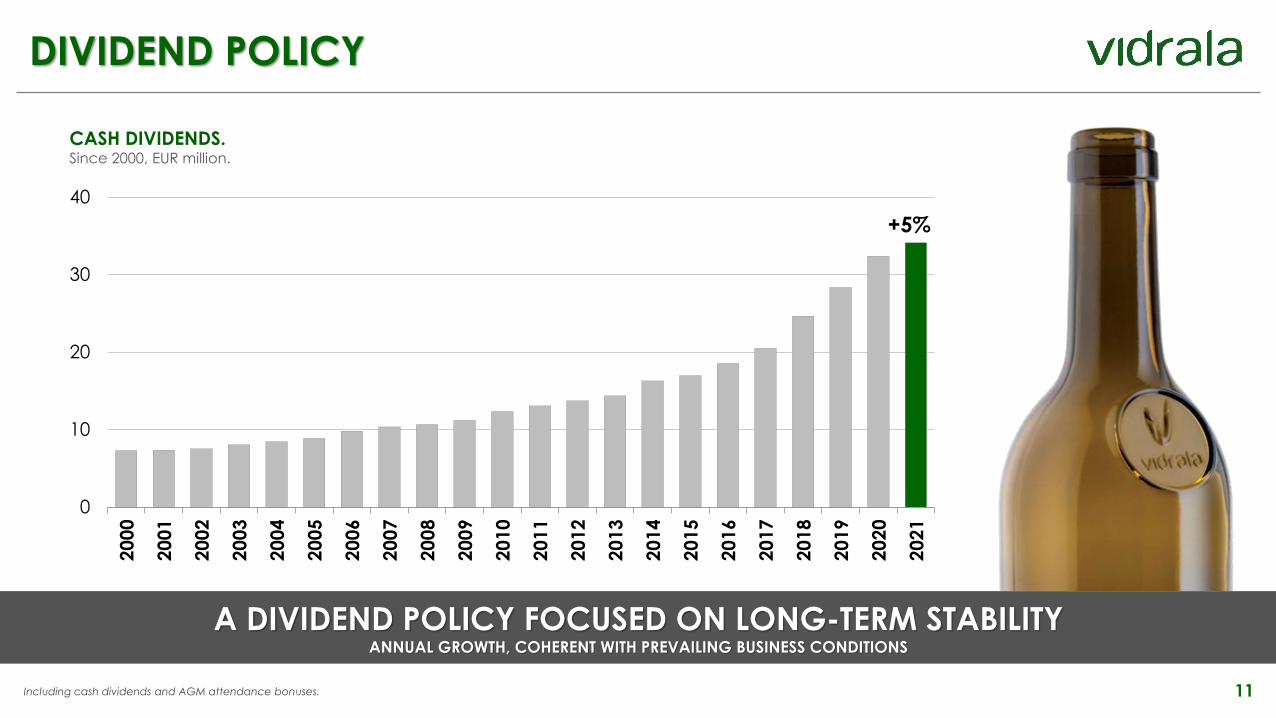
DIVIDEND POLICY
A DIVIDEND POLICY FOCUSED ON LONG-TERM STABILITYANNUAL GROWTH, COHERENT WITH PREVAILING BUSINESS CONDITIONS
+5%
0
10
20
30
40
2000
2001
2002
2003
2004
2005
2006
2007
2008
2009
2010
2011
2012
2013
2014
2015
2016
2017
2018
2019
2020
2021
CASH DIVIDENDS.Since 2000, EUR million.
Including cash dividends and AGM attendance bonuses.
12
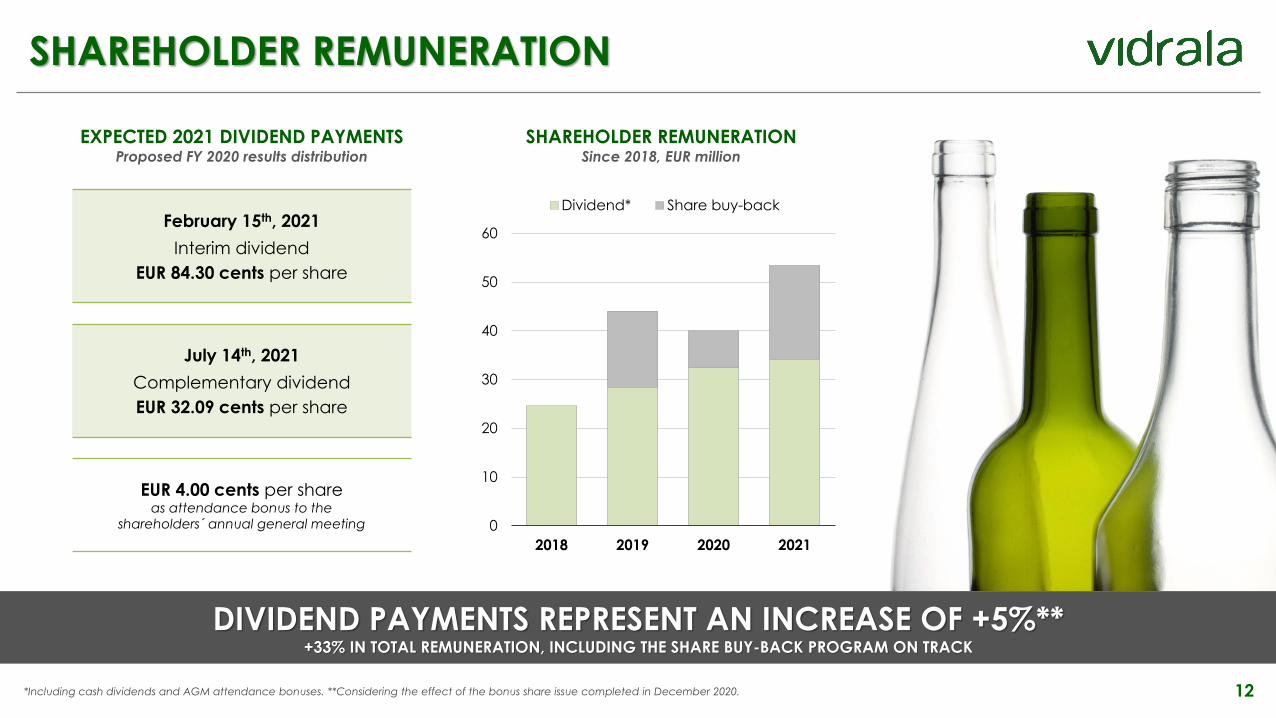
SHAREHOLDER REMUNERATION
DIVIDEND PAYMENTS REPRESENT AN INCREASE OF +5%**+33% IN TOTAL REMUNERATION, INCLUDING THE SHARE BUY-BACK PROGRAM ON TRACK
*Including cash dividends and AGM attendance bonuses. **Considering the effect of the bonus share issue completed in December 2020.
February 15th, 2021
Interim dividend
EUR 84.30 cents per share
EUR 4.00 cents per shareas attendance bonus to the
shareholders´ annual general meeting
EXPECTED 2021 DIVIDEND PAYMENTSProposed FY 2020 results distribution
July 14th, 2021
Complementary dividend
EUR 32.09 cents per share
SHAREHOLDER REMUNERATIONSince 2018, EUR million
0
10
20
30
40
50
60
2018 2019 2020 2021
Dividend* Share buy-back
13
BUSINESS FUNDAMENTALSUnderstanding the european glass packaging industry
14
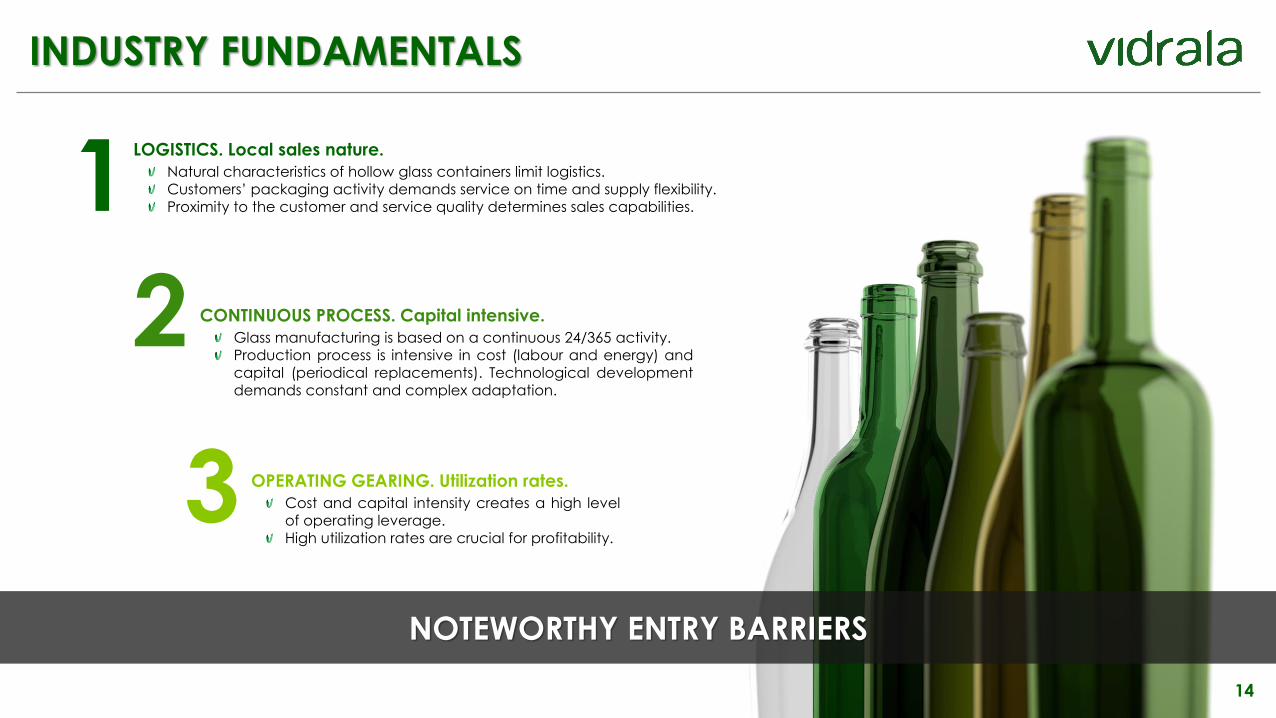
INDUSTRY FUNDAMENTALS
NOTEWORTHY ENTRY BARRIERS
1LOGISTICS. Local sales nature.
Natural characteristics of hollow glass containers limit logistics.
Customers’ packaging activity demands service on time and supply flexibility.
Proximity to the customer and service quality determines sales capabilities.
2 CONTINUOUS PROCESS. Capital intensive.
Glass manufacturing is based on a continuous 24/365 activity.
Production process is intensive in cost (labour and energy) and
capital (periodical replacements). Technological development
demands constant and complex adaptation.
3 OPERATING GEARING. Utilization rates.
Cost and capital intensity creates a high level
of operating leverage.
High utilization rates are crucial for profitability.
15
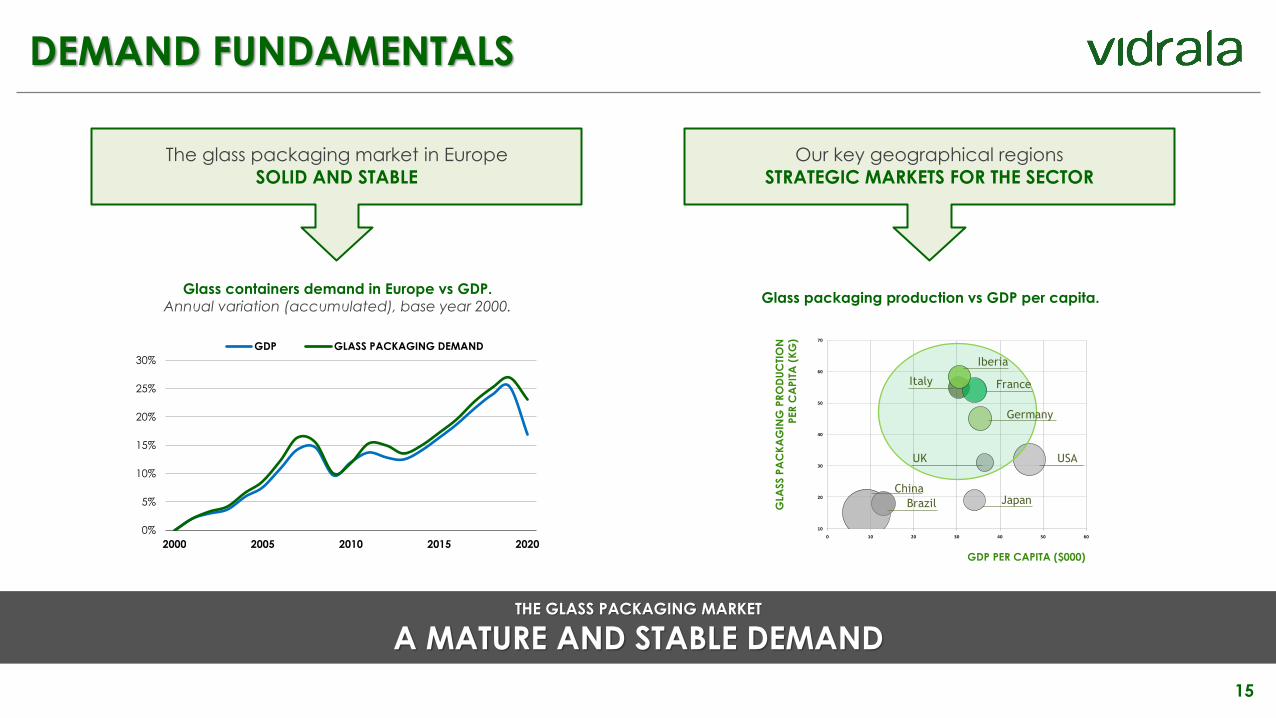
DEMAND FUNDAMENTALS
THE GLASS PACKAGING MARKET
A MATURE AND STABLE DEMAND
The glass packaging market in Europe
SOLID AND STABLE
Our key geographical regions
STRATEGIC MARKETS FOR THE SECTOR
Glass containers demand in Europe vs GDP.Annual variation (accumulated), base year 2000.
Glass packaging production vs GDP per capita.
10
20
30
40
50
60
70
0 10 20 30 40 50 60
Iberia
FranceItaly
Germany
USAUK
JapanBrazil
China
GDP PER CAPITA ($000)
GLA
SS P
AC
KA
GIN
G P
RO
DU
CTI
ON
PER
CA
PIT
A (
KG
)
0%
5%
10%
15%
20%
25%
30%
2000 2005 2010 2015 2020
GDP GLASS PACKAGING DEMAND
16
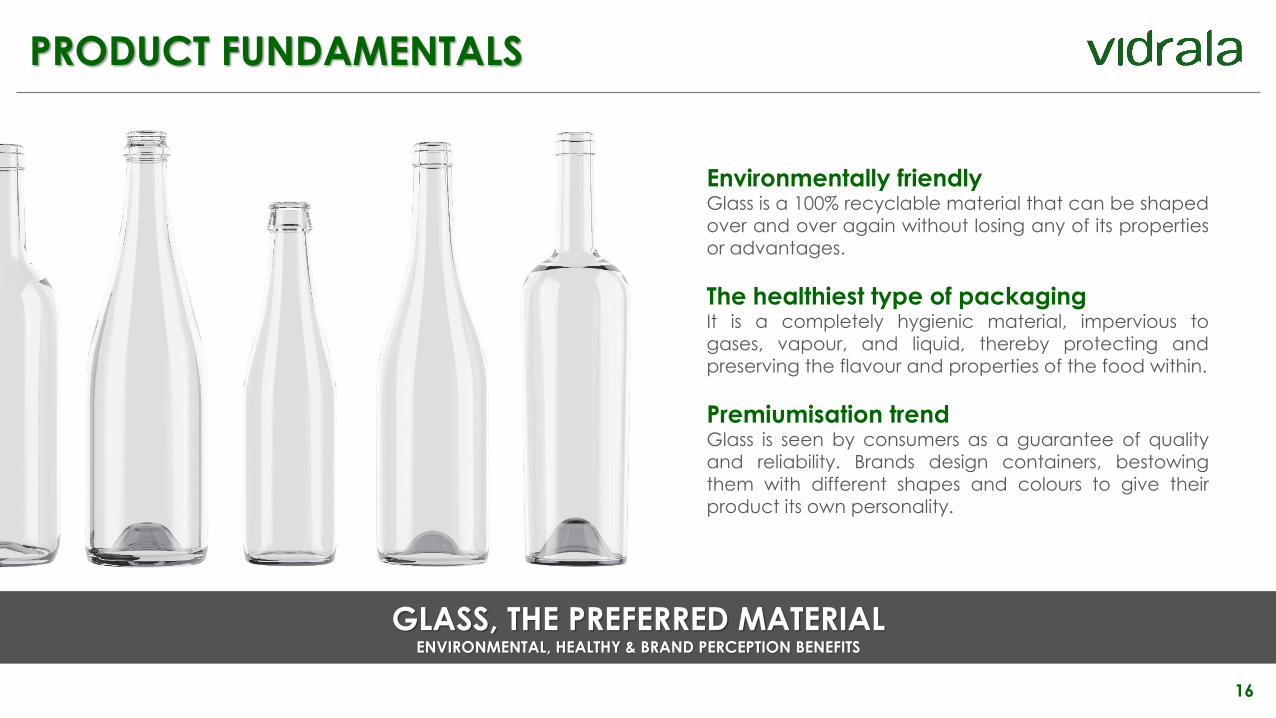
PRODUCT FUNDAMENTALS
GLASS, THE PREFERRED MATERIALENVIRONMENTAL, HEALTHY & BRAND PERCEPTION BENEFITS
Environmentally friendlyGlass is a 100% recyclable material that can be shaped
over and over again without losing any of its properties
or advantages.
The healthiest type of packagingIt is a completely hygienic material, impervious to
gases, vapour, and liquid, thereby protecting and
preserving the flavour and properties of the food within.
Premiumisation trendGlass is seen by consumers as a guarantee of quality
and reliability. Brands design containers, bestowing
them with different shapes and colours to give their
product its own personality.
17
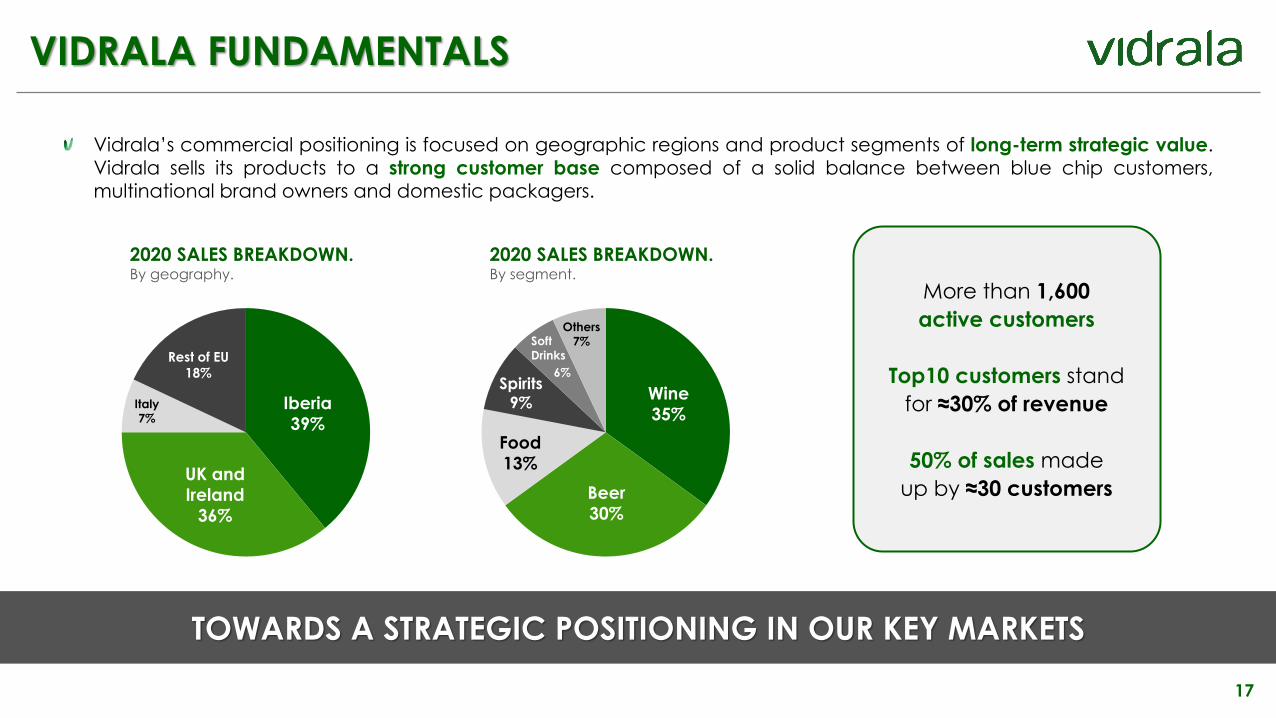
VIDRALA FUNDAMENTALS
TOWARDS A STRATEGIC POSITIONING IN OUR KEY MARKETS
Vidrala’s commercial positioning is focused on geographic regions and product segments of long-term strategic value.
Vidrala sells its products to a strong customer base composed of a solid balance between blue chip customers,multinational brand owners and domestic packagers.
2020 SALES BREAKDOWN.By geography.
2020 SALES BREAKDOWN.By segment.
More than 1,600
active customers
Top10 customers stand
for ≈30% of revenue
50% of sales made
up by ≈30 customers
Iberia
39%
UK and
Ireland
36%
Rest of EU
18%
Italy
7%
Wine
35%
Beer
30%
Food
13%
Spirits
9%
Others
7%Soft
Drinks
6%
18
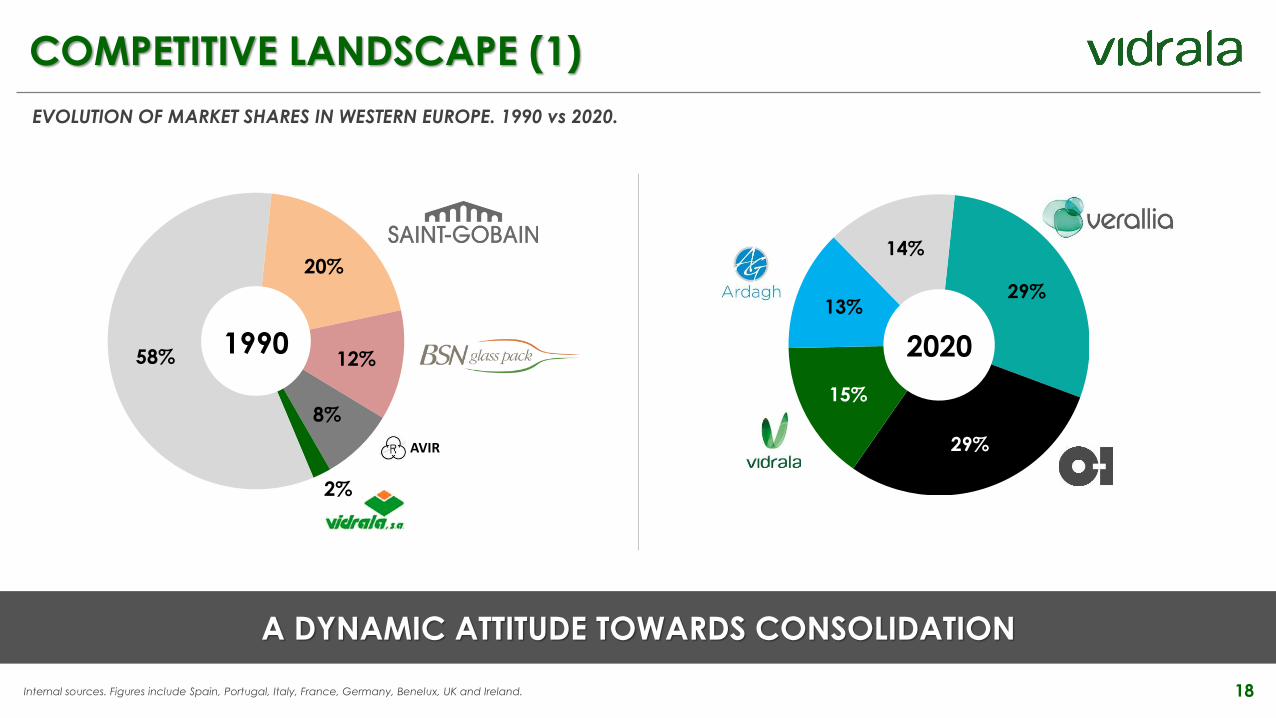
COMPETITIVE LANDSCAPE (1)
A DYNAMIC ATTITUDE TOWARDS CONSOLIDATION
Internal sources. Figures include Spain, Portugal, Italy, France, Germany, Benelux, UK and Ireland.
EVOLUTION OF MARKET SHARES IN WESTERN EUROPE. 1990 vs 2020.
29,1%
28,6%13,3%
11,5%
20,0%
12,0%
8,0%
1,8%
TOP 4 PLAYERS 1990
AVIR
TOP 4 PLAYERS 2014
TOP 4 PLAYERS: 41,8% TOP 4 PLAYERS: 82,6%
20%
12%
8%
2%
58%
29%
29%
15%
13%
14%
1990 2020
19
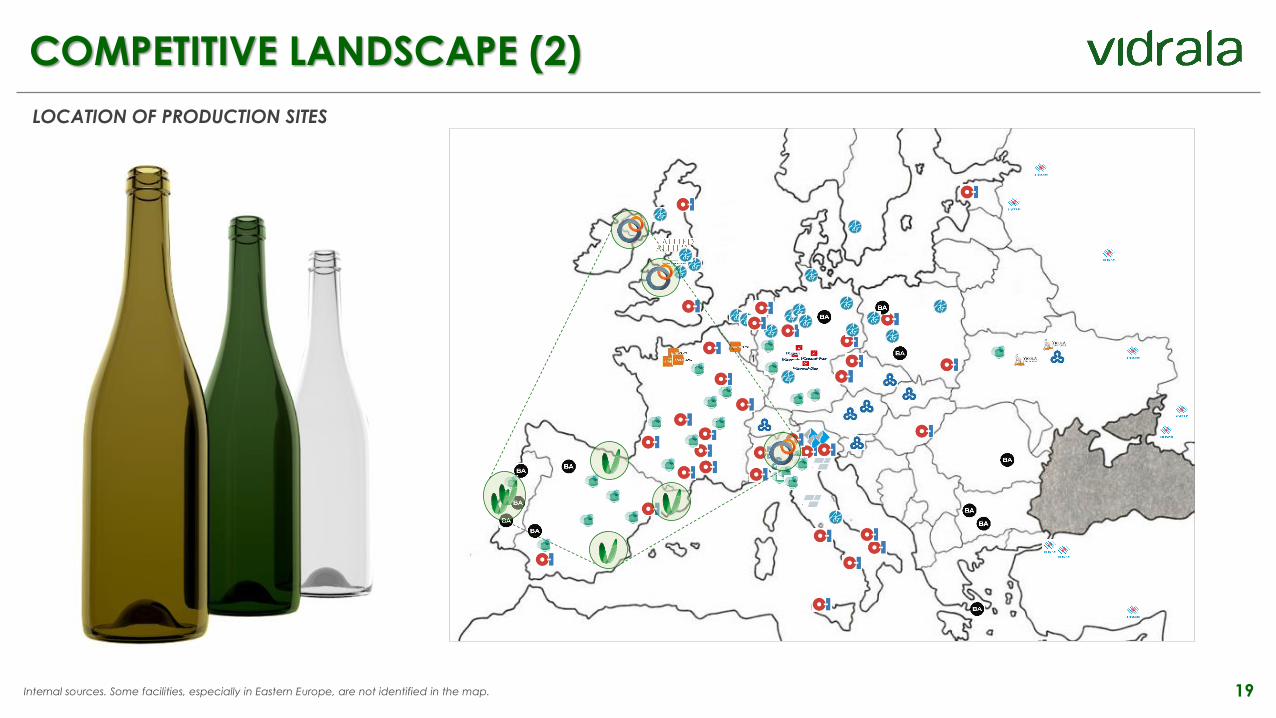
COMPETITIVE LANDSCAPE (2)
LOCATION OF PRODUCTION SITES
Internal sources. Some facilities, especially in Eastern Europe, are not identified in the map.

20
FINANCIALSLatest earnings release
21
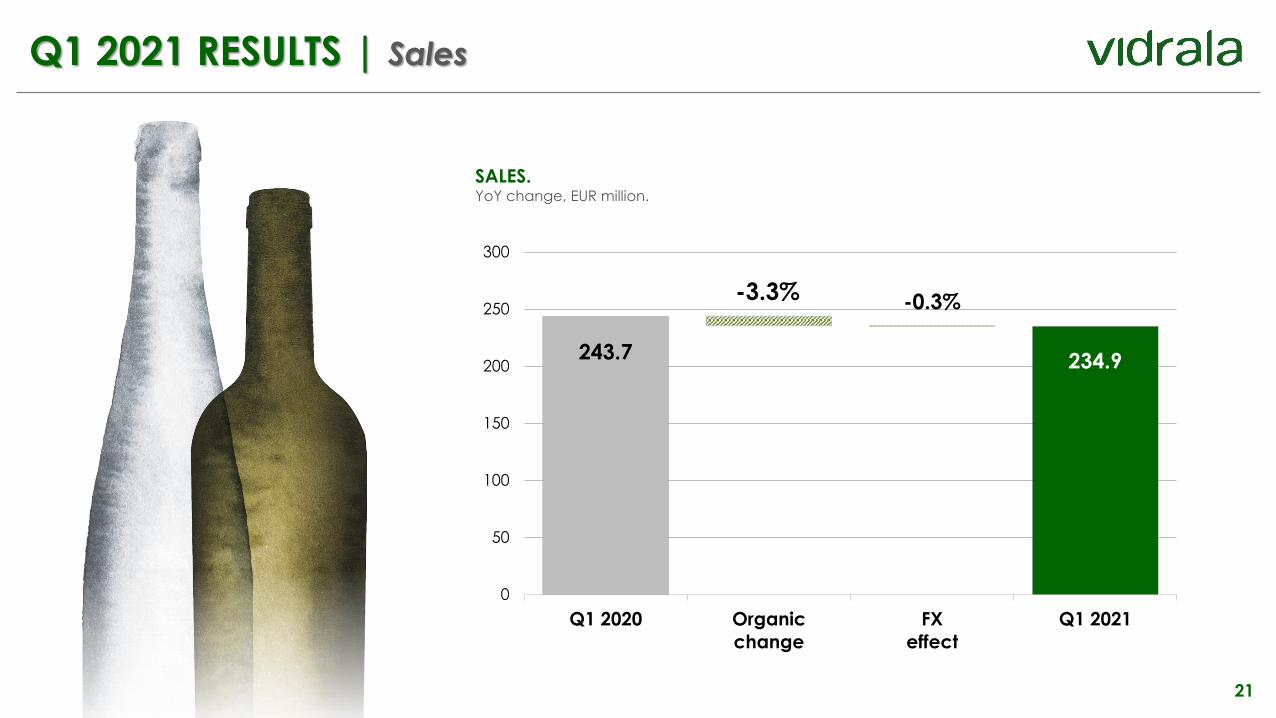
Q1 2021 RESULTS | Sales
SALES.YoY change, EUR million.
243.7 234.9
-3.3% -0.3%
0
50
100
150
200
250
300
Q1 2020 Organic
change
FX
effect
Q1 2021
22
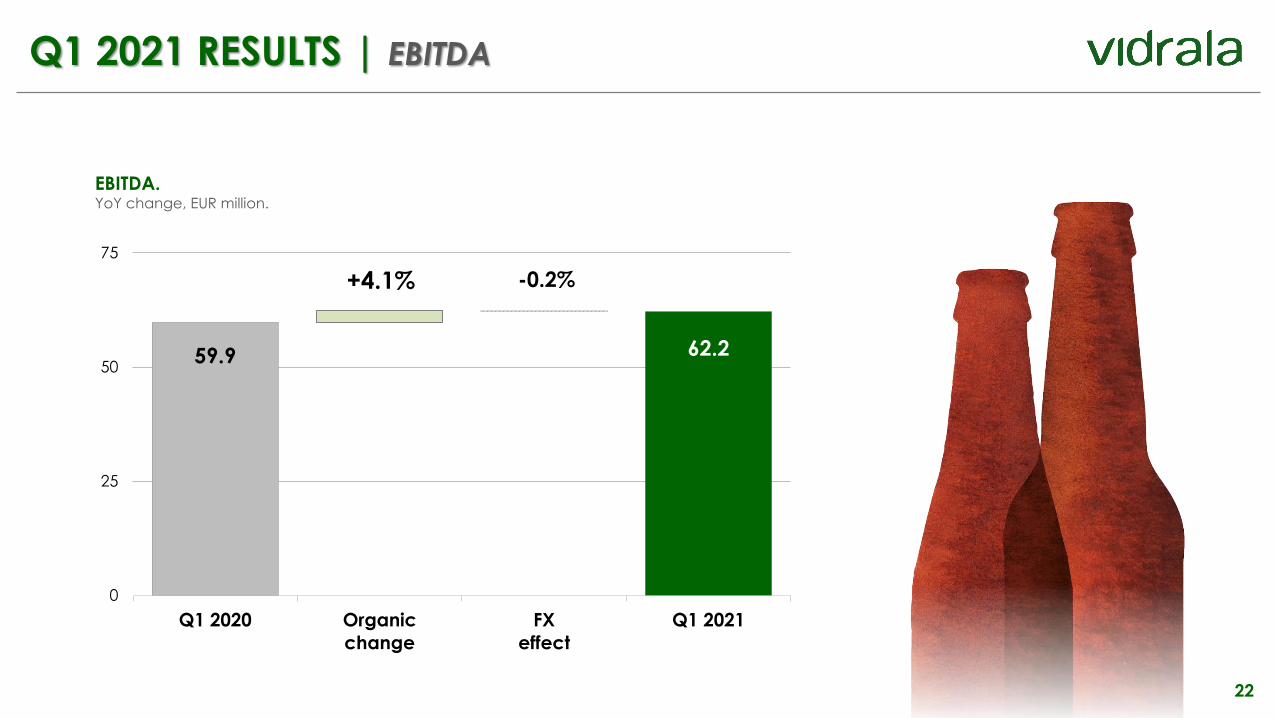
Q1 2021 RESULTS | EBITDA
EBITDA.YoY change, EUR million.
59.9 62.2
+4.1% -0.2%
0
25
50
75
Q1 2020 Organic
change
FX
effect
Q1 2021
23
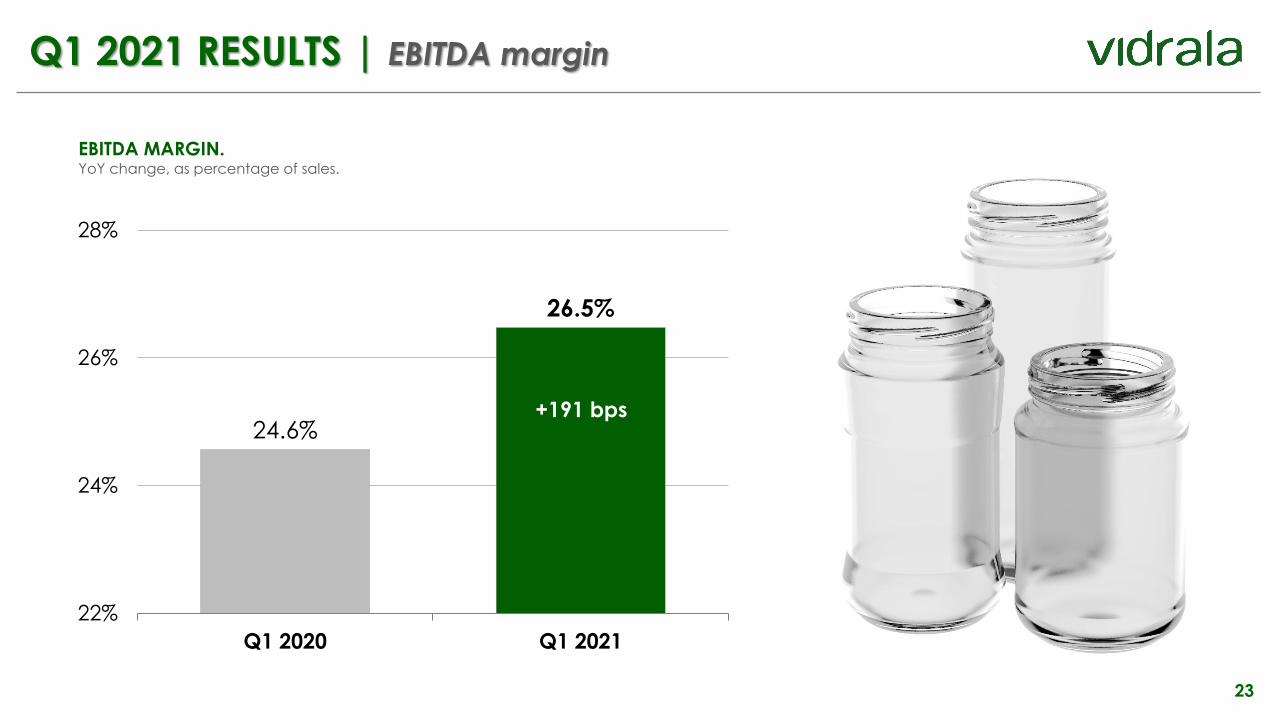
Q1 2021 RESULTS | EBITDA margin
EBITDA MARGIN.YoY change, as percentage of sales.
24.6%
26.5%
22%
24%
26%
28%
Q1 2020 Q1 2021
+191 bps
24
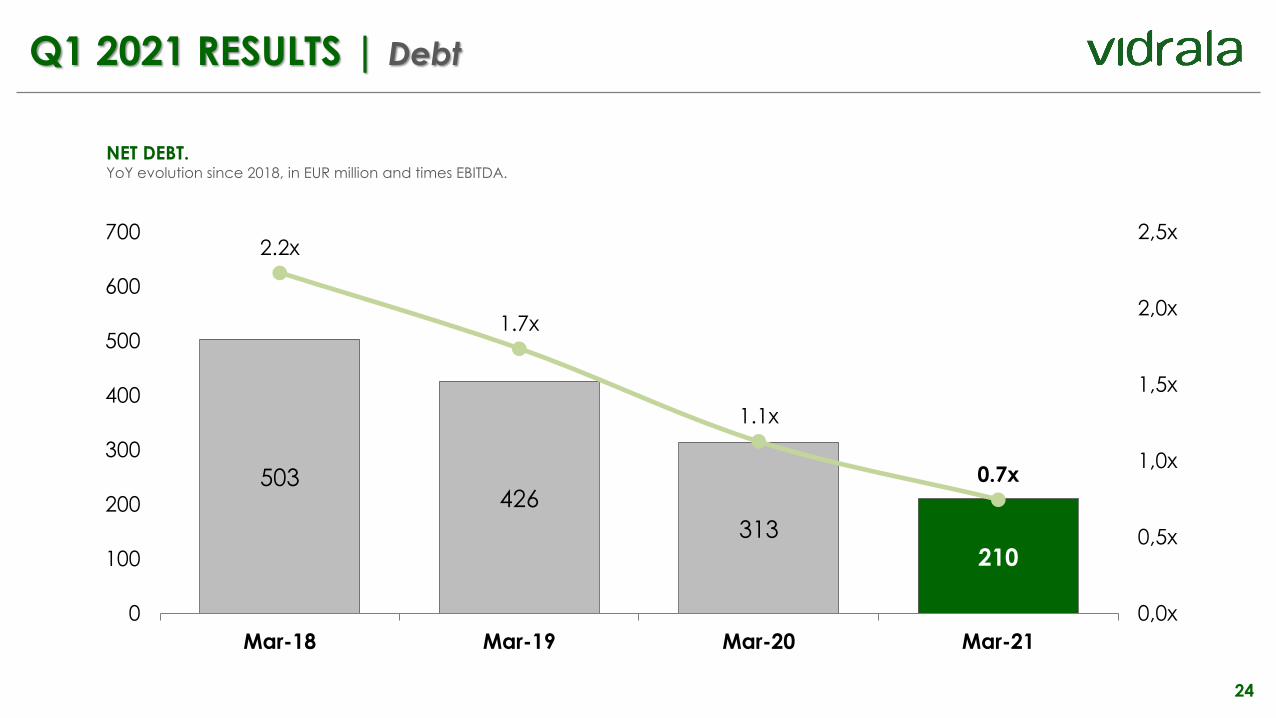
Q1 2021 RESULTS | Debt
NET DEBT.YoY evolution since 2018, in EUR million and times EBITDA.
503426
313210
2.2x
1.7x
1.1x
0.7x
0,0x
0,5x
1,0x
1,5x
2,0x
2,5x
0
100
200
300
400
500
600
700
Mar-18 Mar-19 Mar-20 Mar-21
26
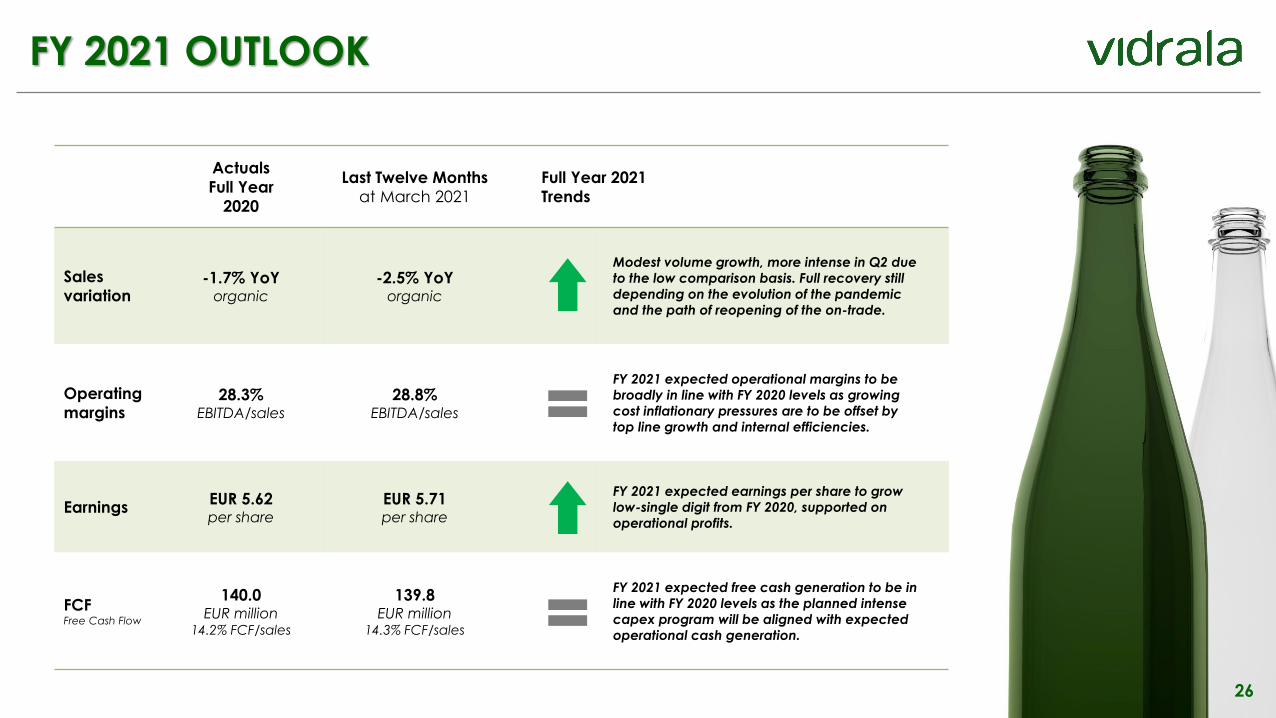
FY 2021 OUTLOOK
Actuals
Full Year
2020
Last Twelve Months
at March 2021
Full Year 2021
Trends
Sales
variation-1.7% YoY
organic
-2.5% YoYorganic
Modest volume growth, more intense in Q2 due
to the low comparison basis. Full recovery still
depending on the evolution of the pandemic
and the path of reopening of the on-trade.
Operating
margins28.3%
EBITDA/sales
28.8% EBITDA/sales
FY 2021 expected operational margins to be
broadly in line with FY 2020 levels as growing
cost inflationary pressures are to be offset by
top line growth and internal efficiencies.
EarningsEUR 5.62per share
EUR 5.71per share
FY 2021 expected earnings per share to grow
low-single digit from FY 2020, supported on
operational profits.
FCFFree Cash Flow
140.0EUR million
14.2% FCF/sales
139.8EUR million
14.3% FCF/sales
FY 2021 expected free cash generation to be in
line with FY 2020 levels as the planned intense
capex program will be aligned with expected
operational cash generation.
27
TARGETSBusiness profitability and cash generation
28
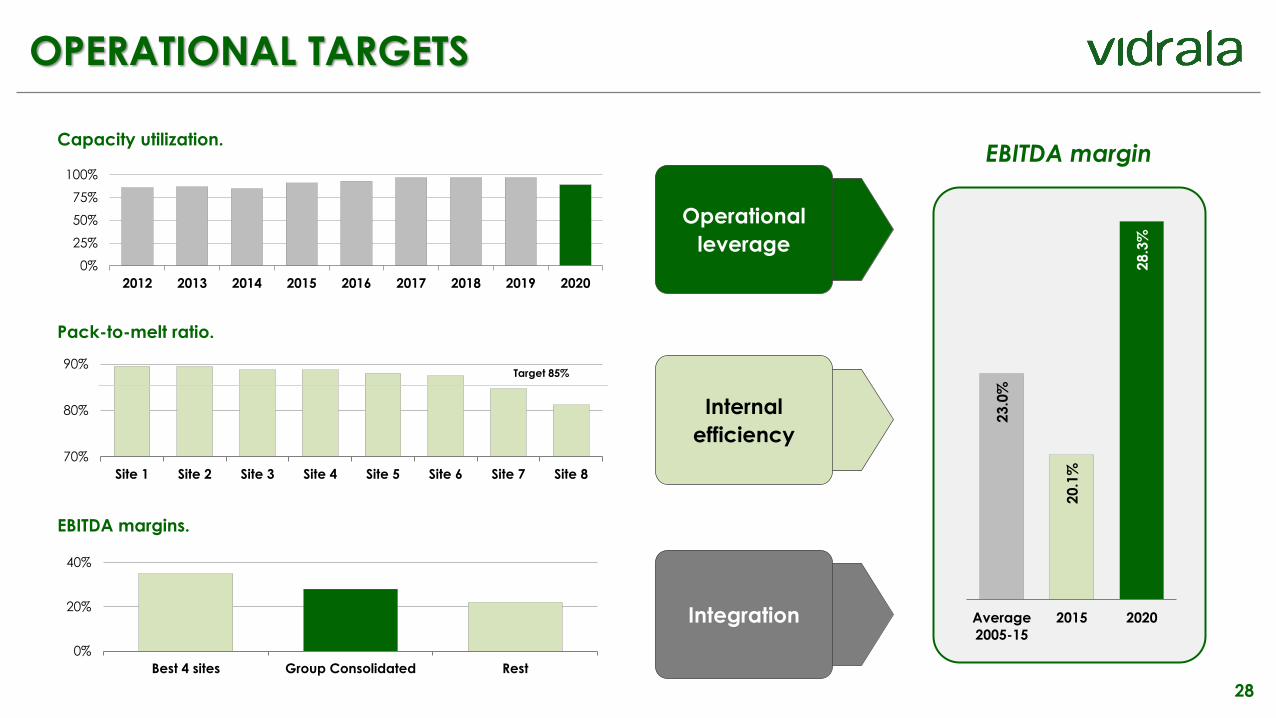
OPERATIONAL TARGETS
Capacity utilization.
Pack-to-melt ratio.
EBITDA margins.
0%
25%
50%
75%
100%
2012 2013 2014 2015 2016 2017 2018 2019 2020
70%
80%
90%
Site 1 Site 2 Site 3 Site 4 Site 5 Site 6 Site 7 Site 8
Target 85%
0%
20%
40%
Best 4 sites Group Consolidated Rest
EBITDA margin
23.0
%
20.1
%
28.3
%
Average
2005-15
2015 2020
Operational
leverage
Internal
efficiency
Integration
29
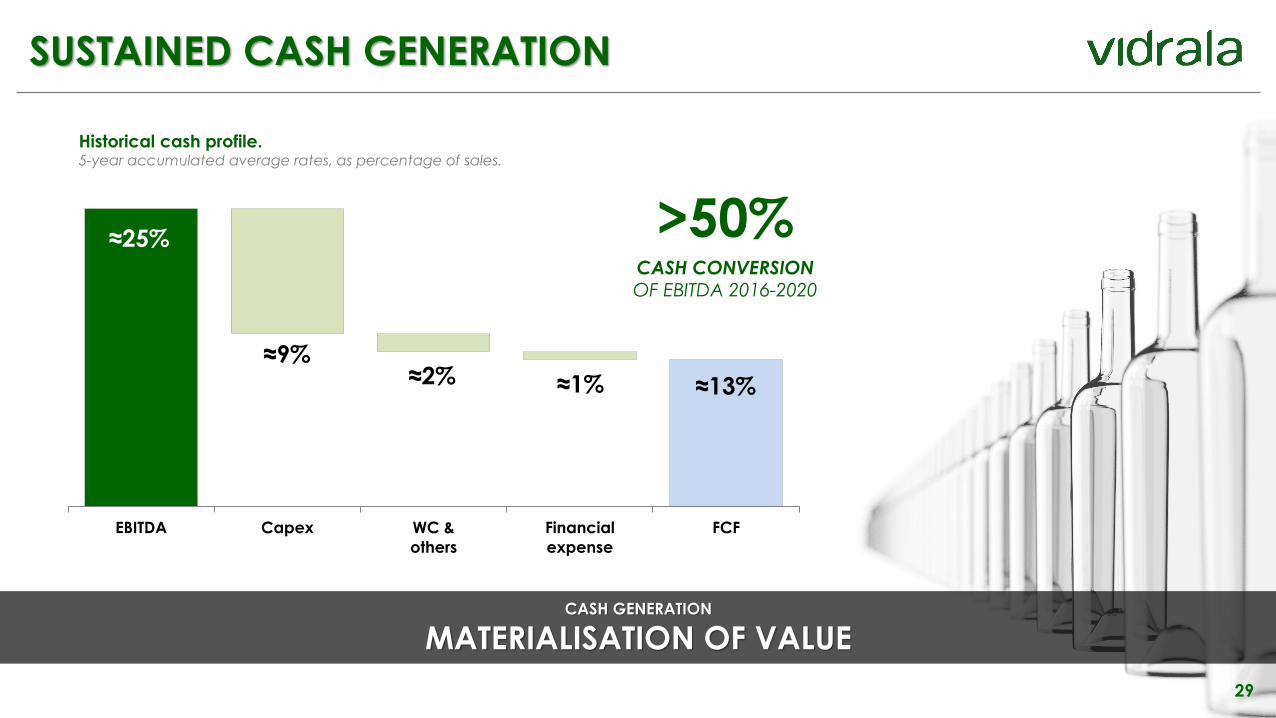
SUSTAINED CASH GENERATION
CASH GENERATION
MATERIALISATION OF VALUE
EBITDA Capex WC &
others
Financial
expense
FCF
≈25%
≈9%≈2% ≈1% ≈13%
Historical cash profile.5-year accumulated average rates, as percentage of sales.
CASH CONVERSIONOF EBITDA 2016-2020
>50%
30
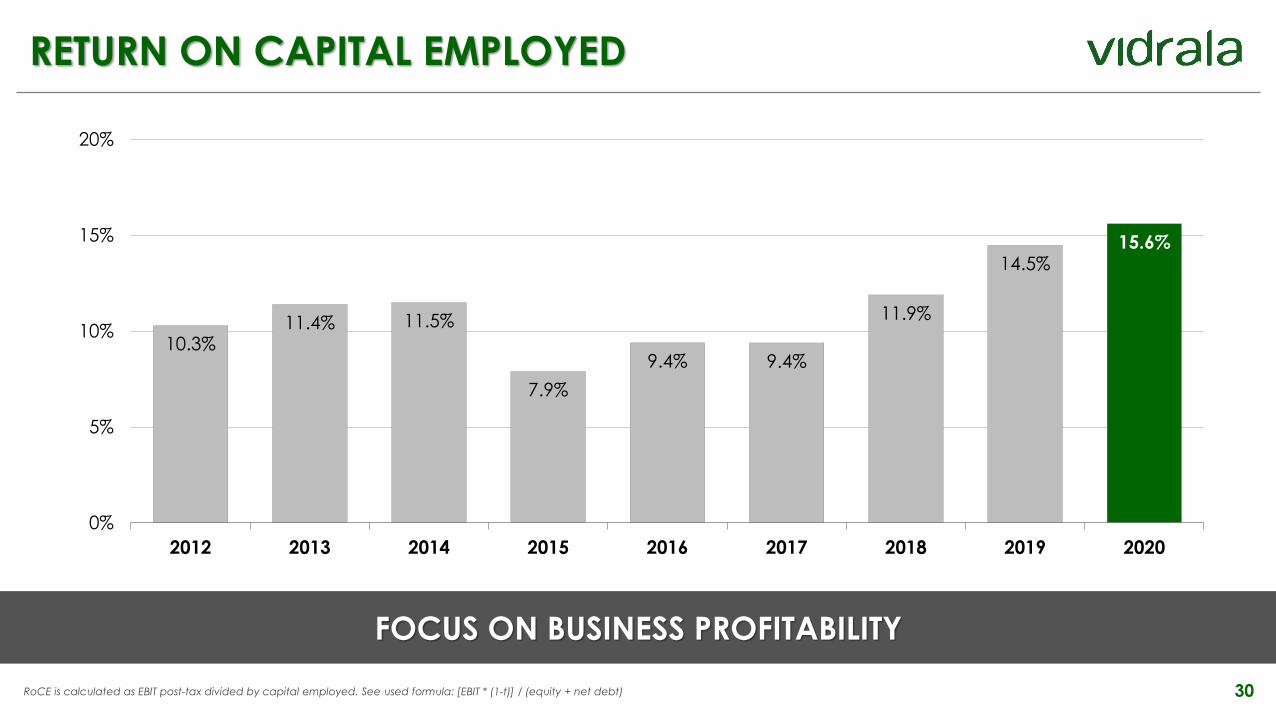
RETURN ON CAPITAL EMPLOYED
FOCUS ON BUSINESS PROFITABILITY
RoCE is calculated as EBIT post-tax divided by capital employed. See used formula: [EBIT * (1-t)] / (equity + net debt)
10.3%11.4% 11.5%
7.9%
9.4% 9.4%
11.9%
14.5%15.6%
0%
5%
10%
15%
20%
2012 2013 2014 2015 2016 2017 2018 2019 2020
31
ANNEXESA general overview of the most recent acquisitions
32
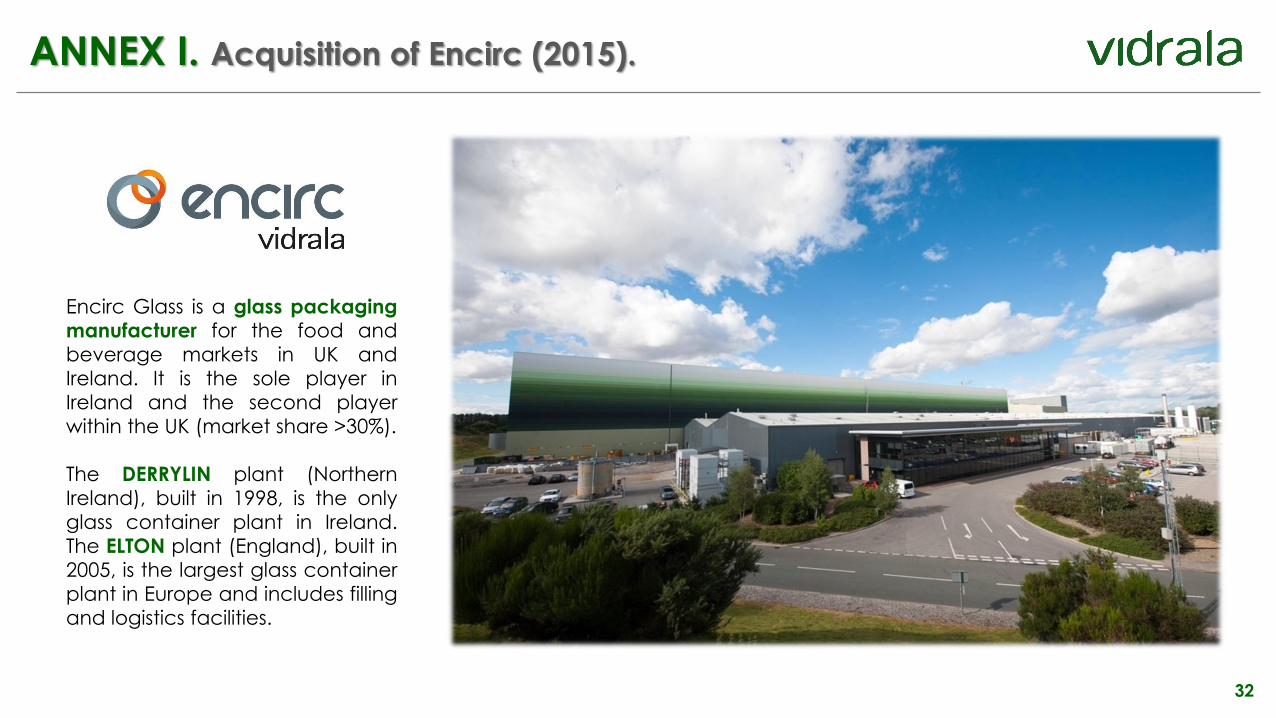
ANNEX I. Acquisition of Encirc (2015).
Encirc Glass is a glass packaging
manufacturer for the food and
beverage markets in UK and
Ireland. It is the sole player in
Ireland and the second player
within the UK (market share >30%).
The DERRYLIN plant (Northern
Ireland), built in 1998, is the only
glass container plant in Ireland.
The ELTON plant (England), built in
2005, is the largest glass container
plant in Europe and includes filling
and logistics facilities.
33
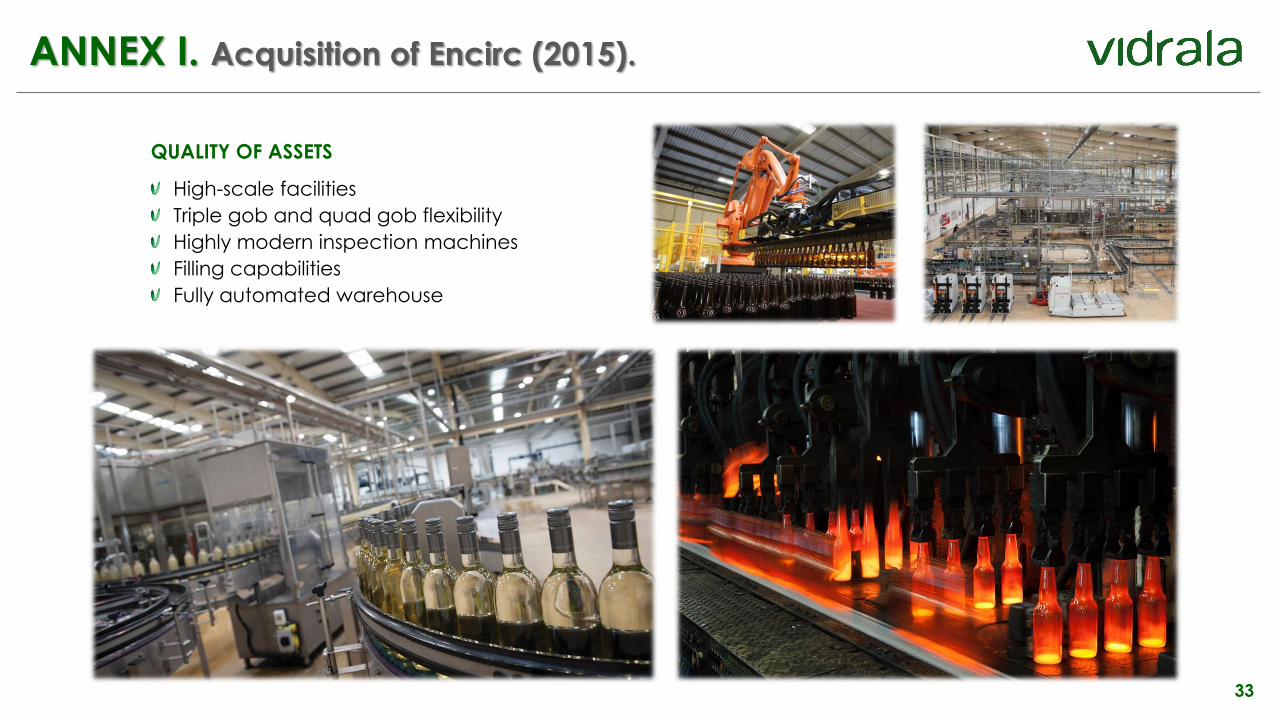
ANNEX I. Acquisition of Encirc (2015).
QUALITY OF ASSETS
High-scale facilities
Triple gob and quad gob flexibility
Highly modern inspection machines
Filling capabilities
Fully automated warehouse
34
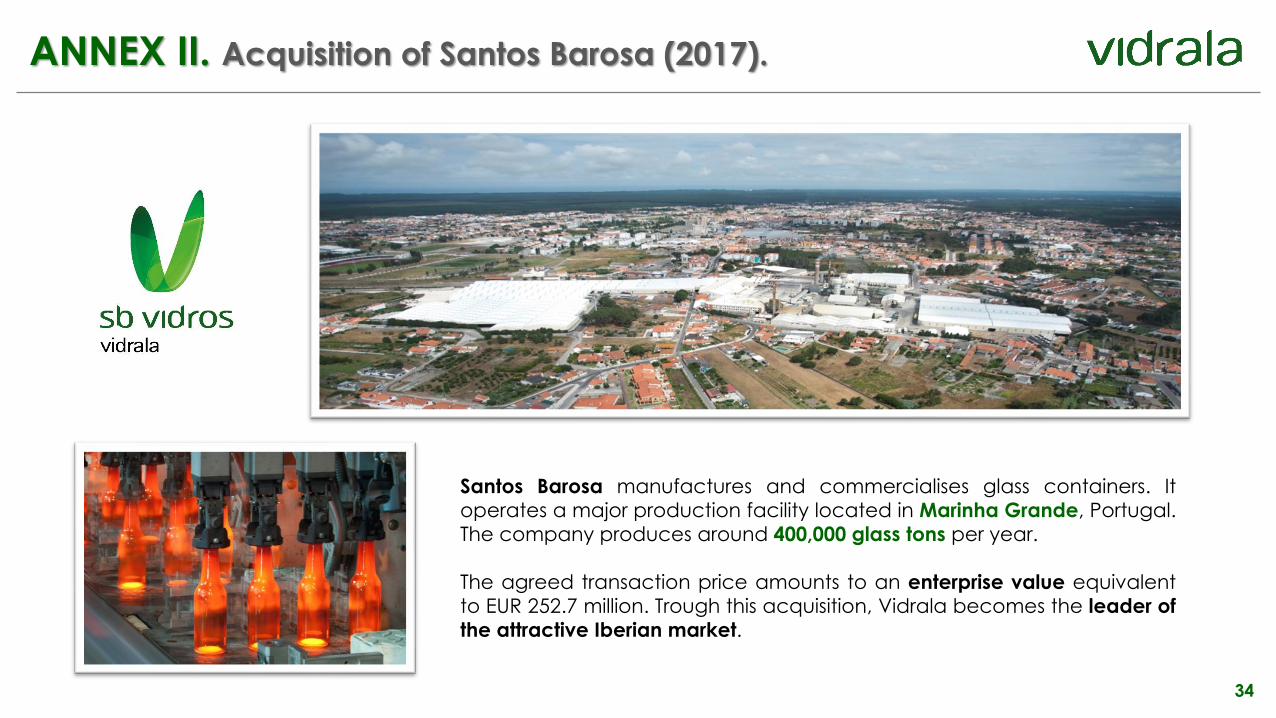
ANNEX II. Acquisition of Santos Barosa (2017).
Santos Barosa manufactures and commercialises glass containers. It
operates a major production facility located in Marinha Grande, Portugal.
The company produces around 400,000 glass tons per year.
The agreed transaction price amounts to an enterprise value equivalent
to EUR 252.7 million. Trough this acquisition, Vidrala becomes the leader of
the attractive Iberian market.
35
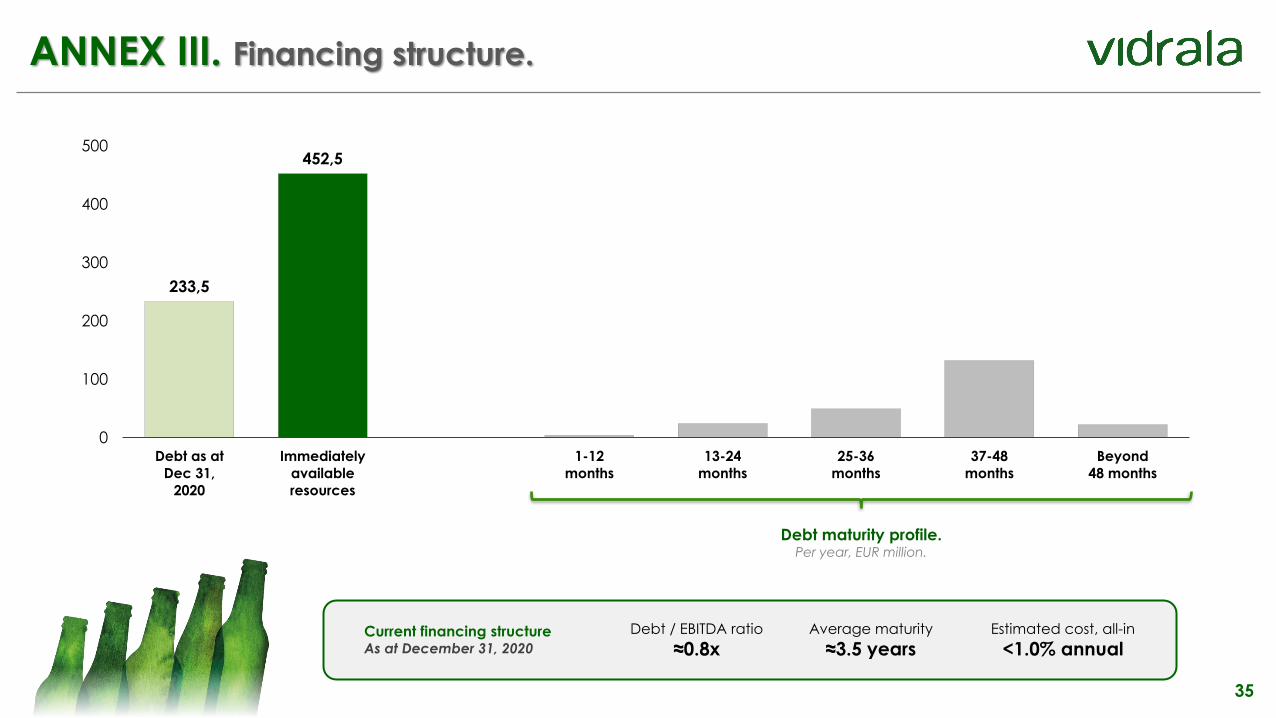
ANNEX III. Financing structure.
233,5
452,5
0
100
200
300
400
500
Debt as at
Dec 31,
2020
Immediately
available
resources
1-12
months
13-24
months
25-36
months
37-48
months
Beyond
48 months
Debt maturity profile.Per year, EUR million.
Current financing structureAs at December 31, 2020
Average maturity
≈3.5 yearsEstimated cost, all-in
<1.0% annualDebt / EBITDA ratio
≈0.8x
VIDRALA, S.A.
Investor Relations
Tel: +34 94 671 97 50
www.vidrala.com