Prescription Drug Cost Sharing
25
Prescription Drug Cost Sharing
-
Upload
kaiserfamilyfoundation -
Category
Health & Medicine
-
view
6.661 -
download
0
Transcript of Prescription Drug Cost Sharing
Prescription Drug Cost Sharing

SOURCE: Kaiser Family Foundation analysis of Marketplace plans in the 37 states with Federally Facilitated or Partnership exchanges in 2015 (including New Mexico, Oregon, and Nevada). Data are from Healthcare.gov Health plan information for individuals and families available here: https://www.healthcare.gov/health-plan-information/
Share of Plans by Type of Cost Sharing for Generic Prescriptions Plans with Combined Medical and Prescription Drug Deductible
5% 1%
21%
46% 48%
38% 28% 25%
34%
12% 18%
22% 28%
0%
10%
20%
30%
40%
50%
60%
70%
80%
90%
100%
Bronze Silver Gold Platinum
Copayment & Coinsurance
Coinsurance
Copayment
No Charge after Deductible
SOURCE: Kaiser Family Foundation analysis of Marketplace plans in the 37 states with Federally Facilitated or Partnership exchanges in 2015 (including New Mexico, Oregon, and Nevada). Data are from Healthcare.gov Health plan information for individuals and families available here: https://www.healthcare.gov/health-plan-information/
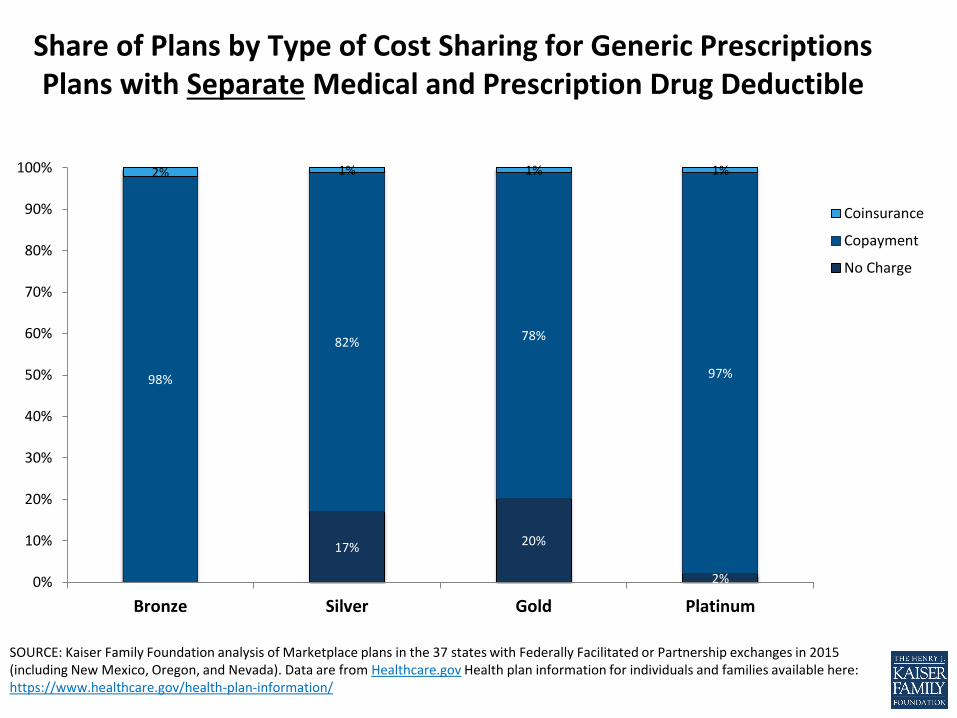
Share of Plans by Type of Cost Sharing for Generic Prescriptions Plans with Separate Medical and Prescription Drug Deductible
17% 20%
2%
98%
82% 78%
97%
2% 1% 1% 1%
0%
10%
20%
30%
40%
50%
60%
70%
80%
90%
100%
Bronze Silver Gold Platinum
Coinsurance
Copayment
No Charge
SOURCE: Kaiser Family Foundation analysis of Marketplace plans in the 37 states with Federally Facilitated or Partnership exchanges in 2015 (including New Mexico, Oregon, and Nevada). Data are from Healthcare.gov Health plan information for individuals and families available here: https://www.healthcare.gov/health-plan-information/
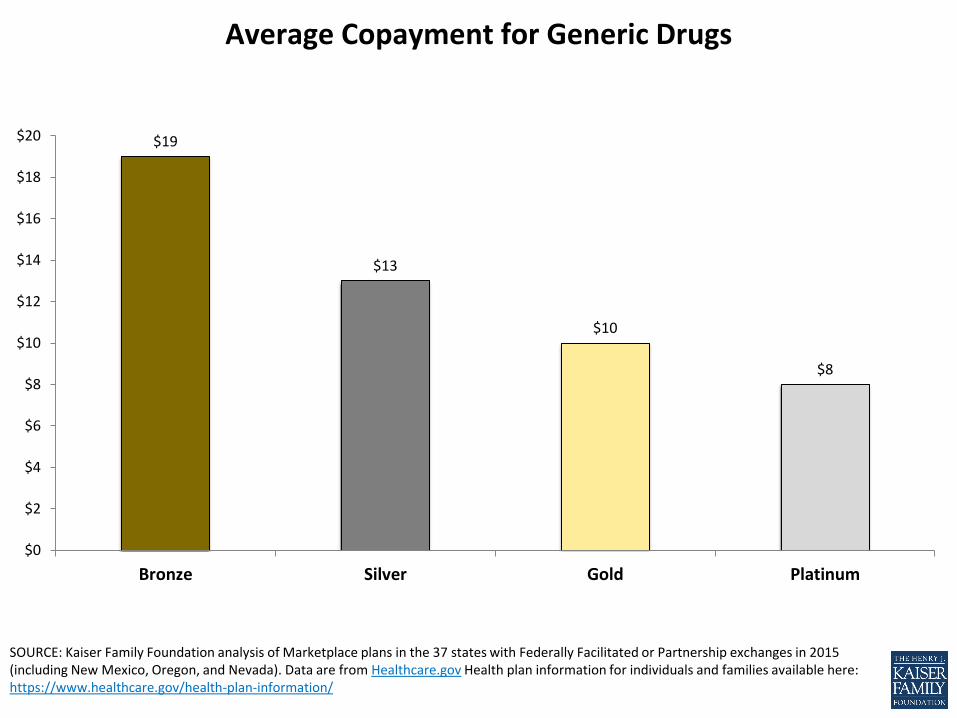
Average Copayment for Generic Drugs
$19
$13
$10
$8
$0
$2
$4
$6
$8
$10
$12
$14
$16
$18
$20
Bronze Silver Gold Platinum
SOURCE: Kaiser Family Foundation analysis of Marketplace plans in the 37 states with Federally Facilitated or Partnership exchanges in 2015 (including New Mexico, Oregon, and Nevada). Data are from Healthcare.gov Health plan information for individuals and families available here: https://www.healthcare.gov/health-plan-information/
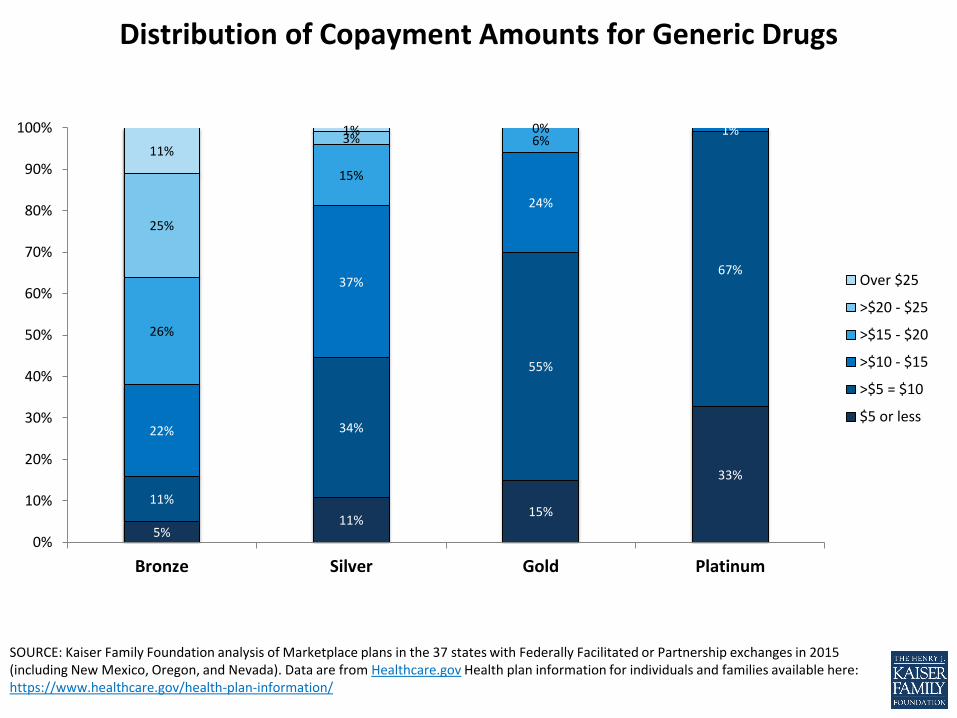
Distribution of Copayment Amounts for Generic Drugs
5% 11%
15%
33%
11%
34%
55%
67%
22%
37%
24%
1%
26%
15%
6%
25%
3% 0%
11%
1%
0%
10%
20%
30%
40%
50%
60%
70%
80%
90%
100%
Bronze Silver Gold Platinum
Over $25
>$20 - $25
>$15 - $20
>$10 - $15
>$5 = $10
$5 or less
SOURCE: Kaiser Family Foundation analysis of Marketplace plans in the 37 states with Federally Facilitated or Partnership exchanges in 2015 (including New Mexico, Oregon, and Nevada). Data are from Healthcare.gov Health plan information for individuals and families available here: https://www.healthcare.gov/health-plan-information/
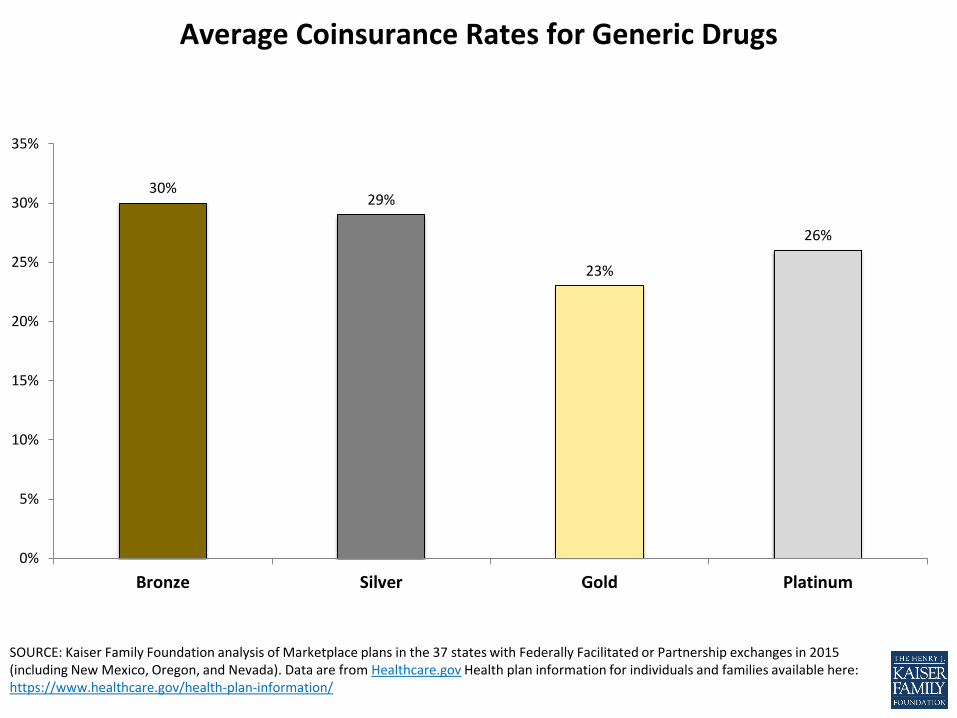
Average Coinsurance Rates for Generic Drugs
30% 29%
23%
26%
0%
5%
10%
15%
20%
25%
30%
35%
Bronze Silver Gold Platinum
SOURCE: Kaiser Family Foundation analysis of Marketplace plans in the 37 states with Federally Facilitated or Partnership exchanges in 2015 (including New Mexico, Oregon, and Nevada). Data are from Healthcare.gov Health plan information for individuals and families available here: https://www.healthcare.gov/health-plan-information/
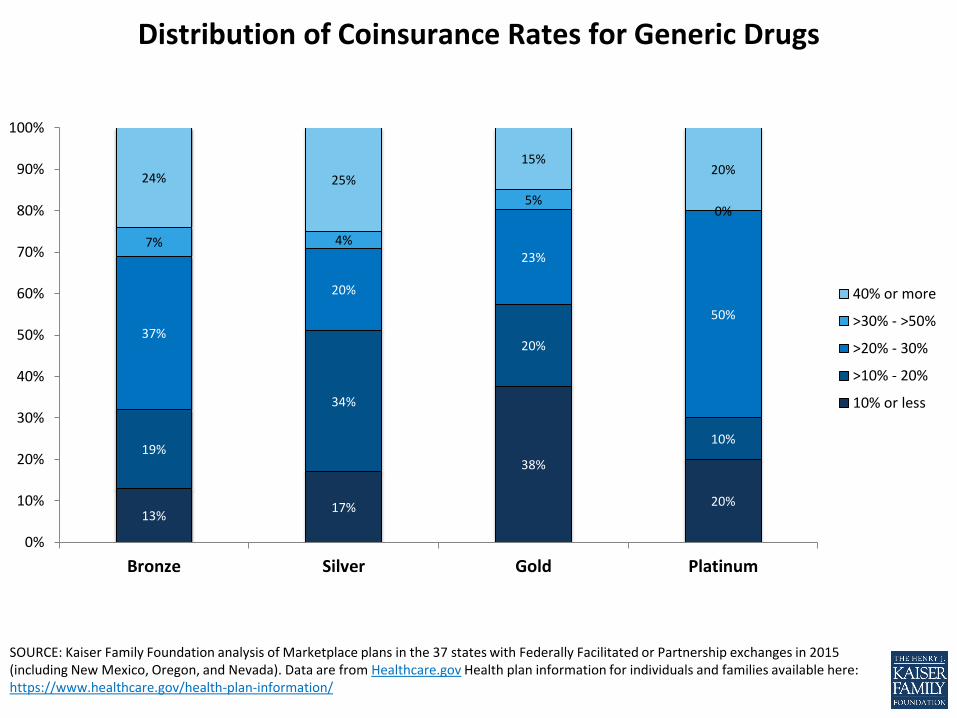
Distribution of Coinsurance Rates for Generic Drugs
13% 17%
38%
20%
19%
34%
20%
10%
37%
20%
23%
50%
7% 4%
5% 0%
24% 25%
15% 20%
0%
10%
20%
30%
40%
50%
60%
70%
80%
90%
100%
Bronze Silver Gold Platinum
40% or more
>30% - >50%
>20% - 30%
>10% - 20%
10% or less
SOURCE: Kaiser Family Foundation analysis of Marketplace plans in the 37 states with Federally Facilitated or Partnership exchanges in 2015 (including New Mexico, Oregon, and Nevada). Data are from Healthcare.gov Health plan information for individuals and families available here: https://www.healthcare.gov/health-plan-information/
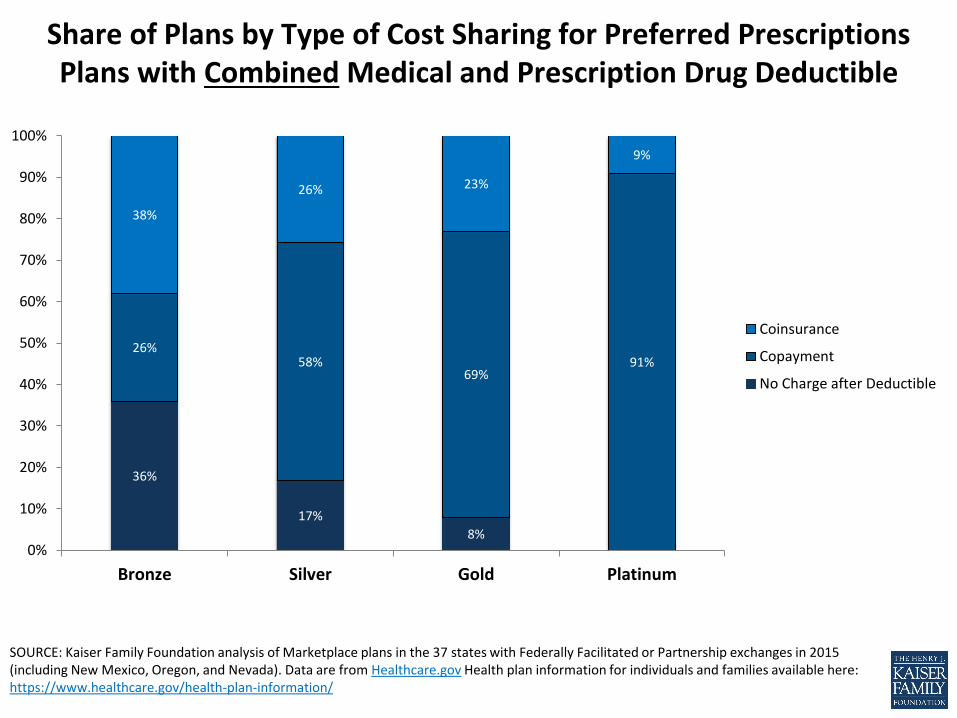
Share of Plans by Type of Cost Sharing for Preferred Prescriptions Plans with Combined Medical and Prescription Drug Deductible
36%
17%
8%
26% 58%
69% 91%
38%
26% 23%
9%
0%
10%
20%
30%
40%
50%
60%
70%
80%
90%
100%
Bronze Silver Gold Platinum
Coinsurance
Copayment
No Charge after Deductible
SOURCE: Kaiser Family Foundation analysis of Marketplace plans in the 37 states with Federally Facilitated or Partnership exchanges in 2015 (including New Mexico, Oregon, and Nevada). Data are from Healthcare.gov Health plan information for individuals and families available here: https://www.healthcare.gov/health-plan-information/
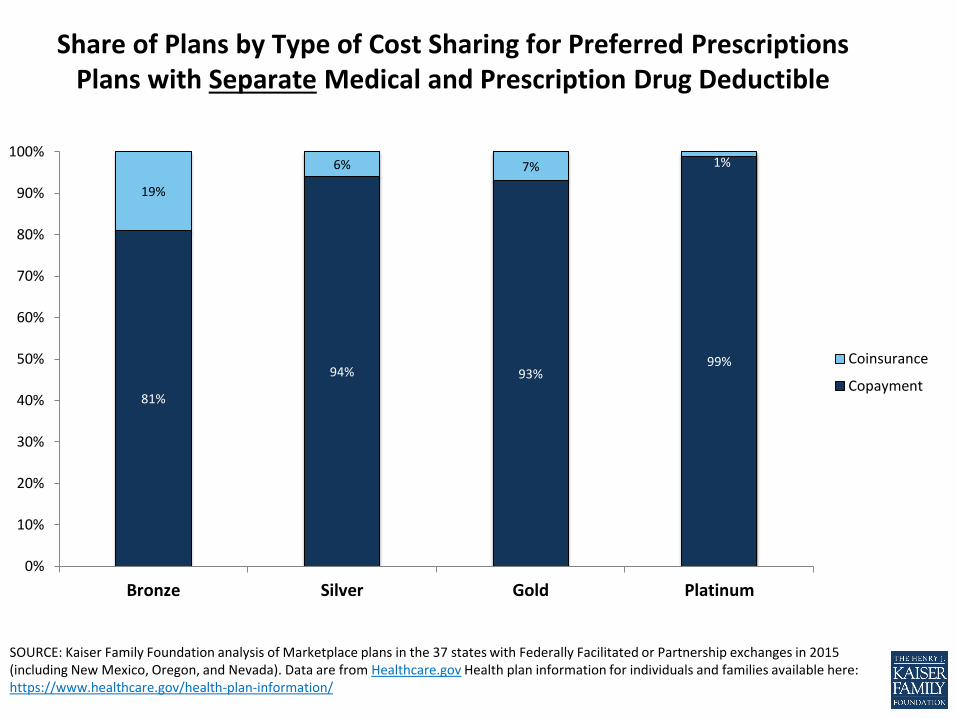
Share of Plans by Type of Cost Sharing for Preferred Prescriptions Plans with Separate Medical and Prescription Drug Deductible
81%
94% 93% 99%
19%
6% 7% 1%
0%
10%
20%
30%
40%
50%
60%
70%
80%
90%
100%
Bronze Silver Gold Platinum
Coinsurance
Copayment
SOURCE: Kaiser Family Foundation analysis of Marketplace plans in the 37 states with Federally Facilitated or Partnership exchanges in 2015 (including New Mexico, Oregon, and Nevada). Data are from Healthcare.gov Health plan information for individuals and families available here: https://www.healthcare.gov/health-plan-information/
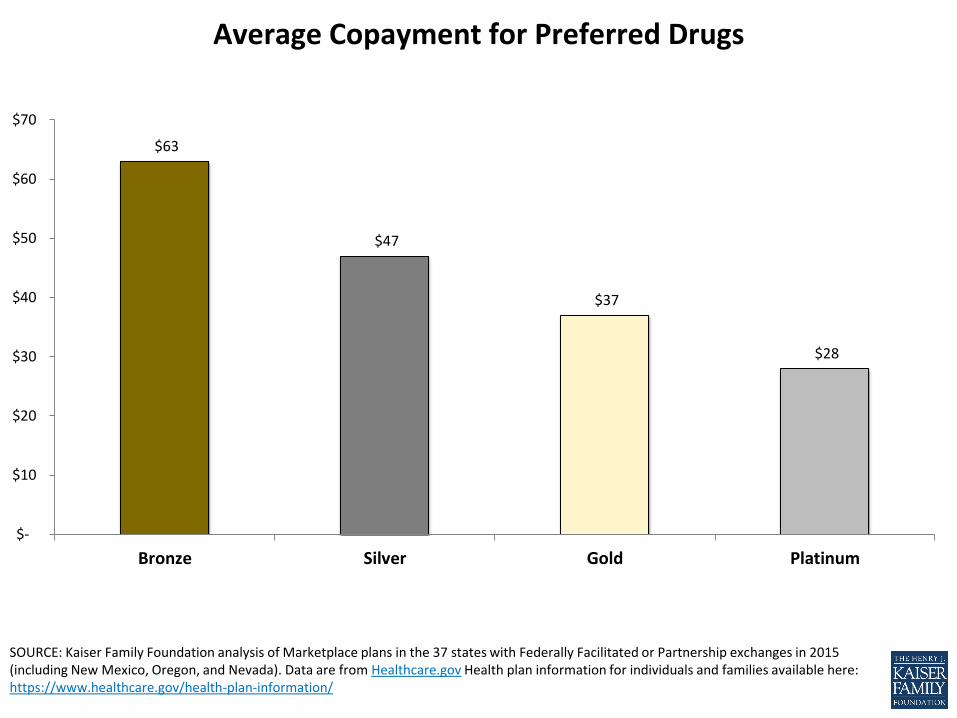
Average Copayment for Preferred Drugs
$63
$47
$37
$28
$-
$10
$20
$30
$40
$50
$60
$70
Bronze Silver Gold Platinum
SOURCE: Kaiser Family Foundation analysis of Marketplace plans in the 37 states with Federally Facilitated or Partnership exchanges in 2015 (including New Mexico, Oregon, and Nevada). Data are from Healthcare.gov Health plan information for individuals and families available here: https://www.healthcare.gov/health-plan-information/
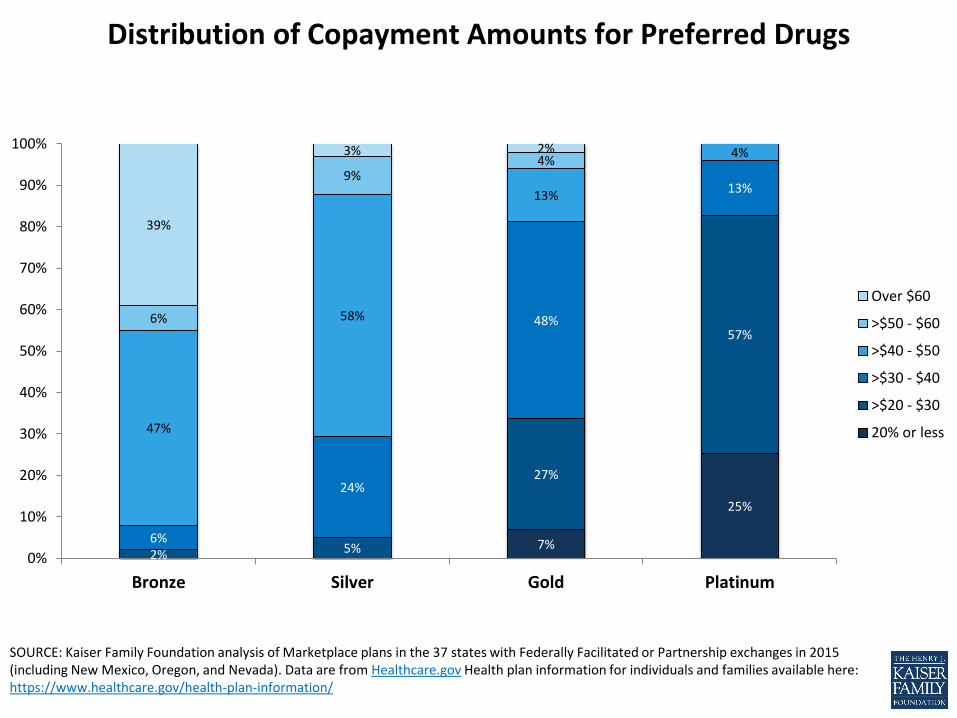
Distribution of Copayment Amounts for Preferred Drugs
7%
25%
2% 5%
27%
57%
6%
24%
48%
13%
47%
58%
13%
4%
6%
9% 4%
39%
3% 2%
0%
10%
20%
30%
40%
50%
60%
70%
80%
90%
100%
Bronze Silver Gold Platinum
Over $60
>$50 - $60
>$40 - $50
>$30 - $40
>$20 - $30
20% or less
SOURCE: Kaiser Family Foundation analysis of Marketplace plans in the 37 states with Federally Facilitated or Partnership exchanges in 2015 (including New Mexico, Oregon, and Nevada). Data are from Healthcare.gov Health plan information for individuals and families available here: https://www.healthcare.gov/health-plan-information/
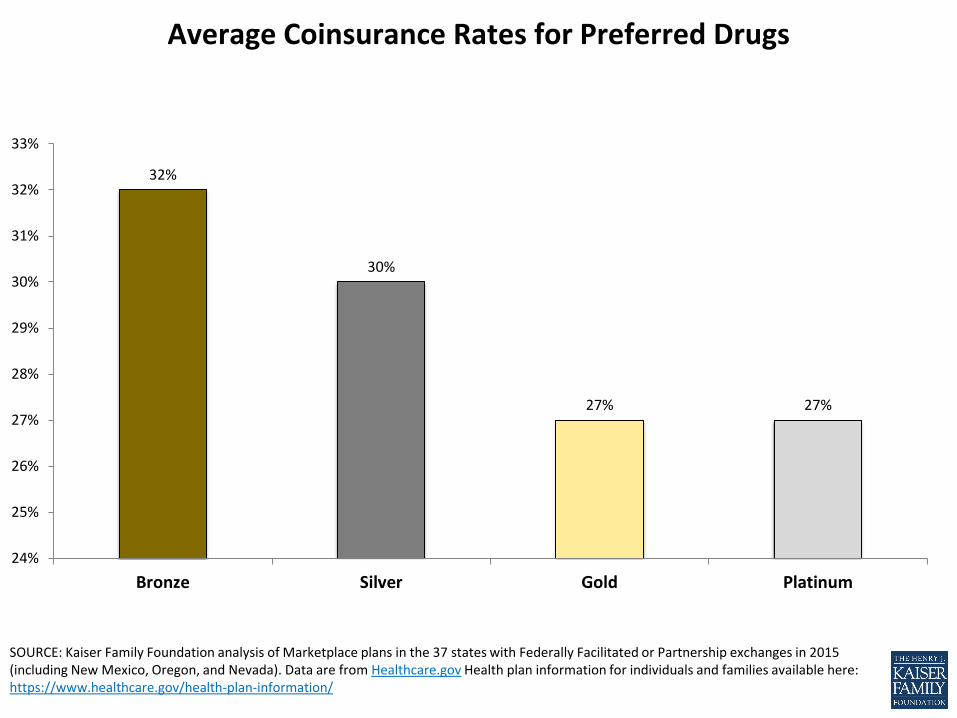
Average Coinsurance Rates for Preferred Drugs
32%
30%
27% 27%
24%
25%
26%
27%
28%
29%
30%
31%
32%
33%
Bronze Silver Gold Platinum
SOURCE: Kaiser Family Foundation analysis of Marketplace plans in the 37 states with Federally Facilitated or Partnership exchanges in 2015 (including New Mexico, Oregon, and Nevada). Data are from Healthcare.gov Health plan information for individuals and families available here: https://www.healthcare.gov/health-plan-information/
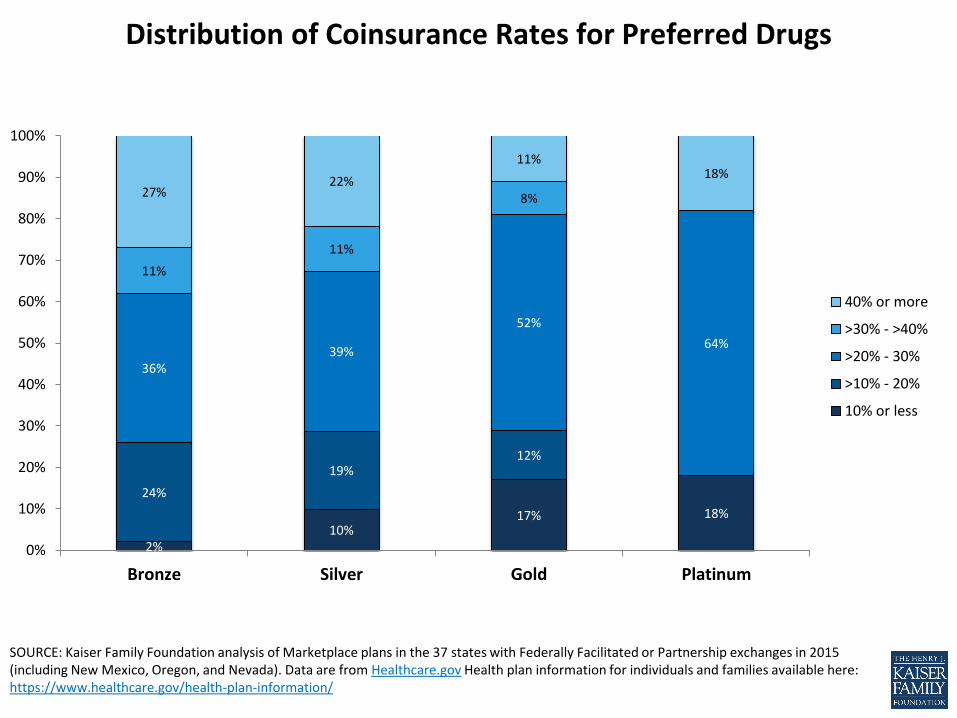
Distribution of Coinsurance Rates for Preferred Drugs
2% 10%
17% 18%
24%
19% 12%
36% 39%
52%
64%
11%
11%
8% 27% 22%
11% 18%
0%
10%
20%
30%
40%
50%
60%
70%
80%
90%
100%
Bronze Silver Gold Platinum
40% or more
>30% - >40%
>20% - 30%
>10% - 20%
10% or less
SOURCE: Kaiser Family Foundation analysis of Marketplace plans in the 37 states with Federally Facilitated or Partnership exchanges in 2015 (including New Mexico, Oregon, and Nevada). Data are from Healthcare.gov Health plan information for individuals and families available here: https://www.healthcare.gov/health-plan-information/
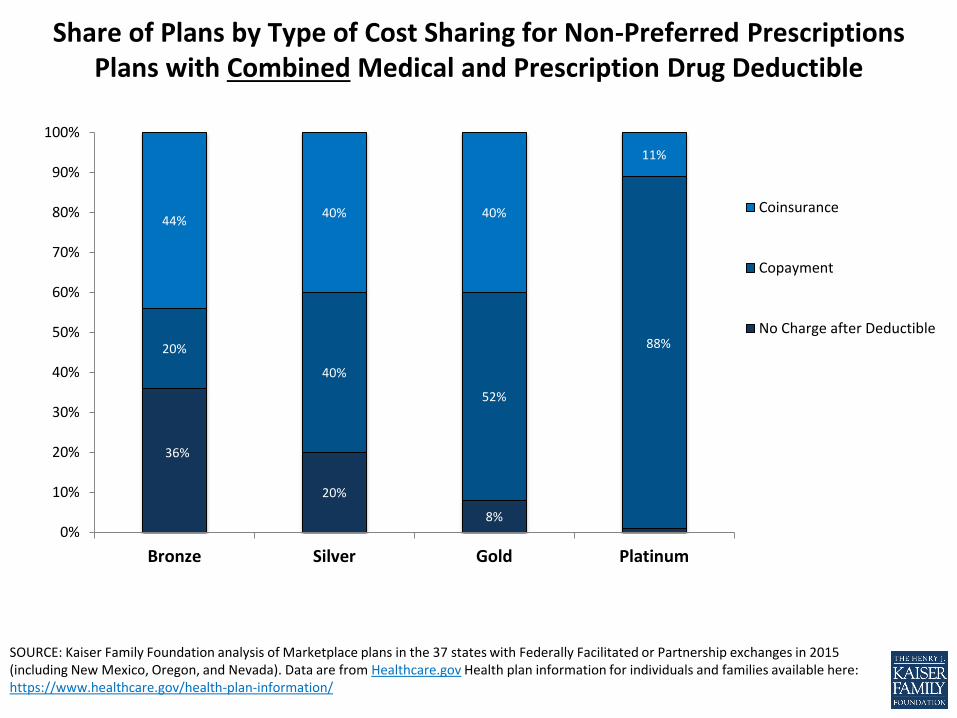
Share of Plans by Type of Cost Sharing for Non-Preferred Prescriptions Plans with Combined Medical and Prescription Drug Deductible
36%
20%
8%
20%
40%
52%
88%
44% 40% 40%
11%
0%
10%
20%
30%
40%
50%
60%
70%
80%
90%
100%
Bronze Silver Gold Platinum
Coinsurance
Copayment
No Charge after Deductible
SOURCE: Kaiser Family Foundation analysis of Marketplace plans in the 37 states with Federally Facilitated or Partnership exchanges in 2015 (including New Mexico, Oregon, and Nevada). Data are from Healthcare.gov Health plan information for individuals and families available here: https://www.healthcare.gov/health-plan-information/
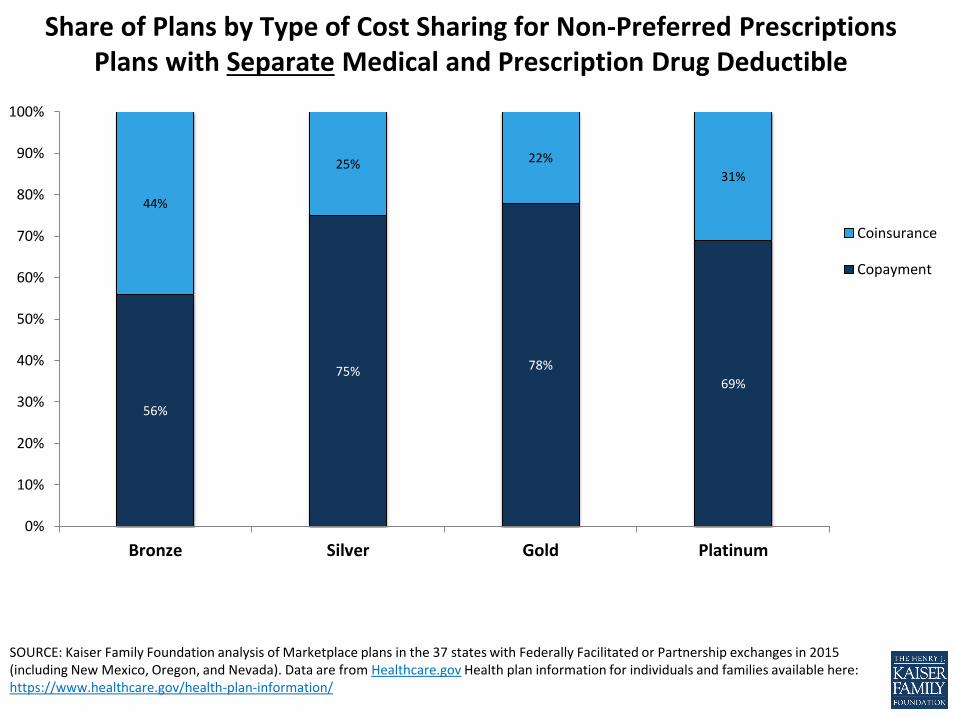
Share of Plans by Type of Cost Sharing for Non-Preferred Prescriptions Plans with Separate Medical and Prescription Drug Deductible
56%
75% 78%
69%
44%
25% 22%
31%
0%
10%
20%
30%
40%
50%
60%
70%
80%
90%
100%
Bronze Silver Gold Platinum
Coinsurance
Copayment
SOURCE: Kaiser Family Foundation analysis of Marketplace plans in the 37 states with Federally Facilitated or Partnership exchanges in 2015 (including New Mexico, Oregon, and Nevada). Data are from Healthcare.gov Health plan information for individuals and families available here: https://www.healthcare.gov/health-plan-information/
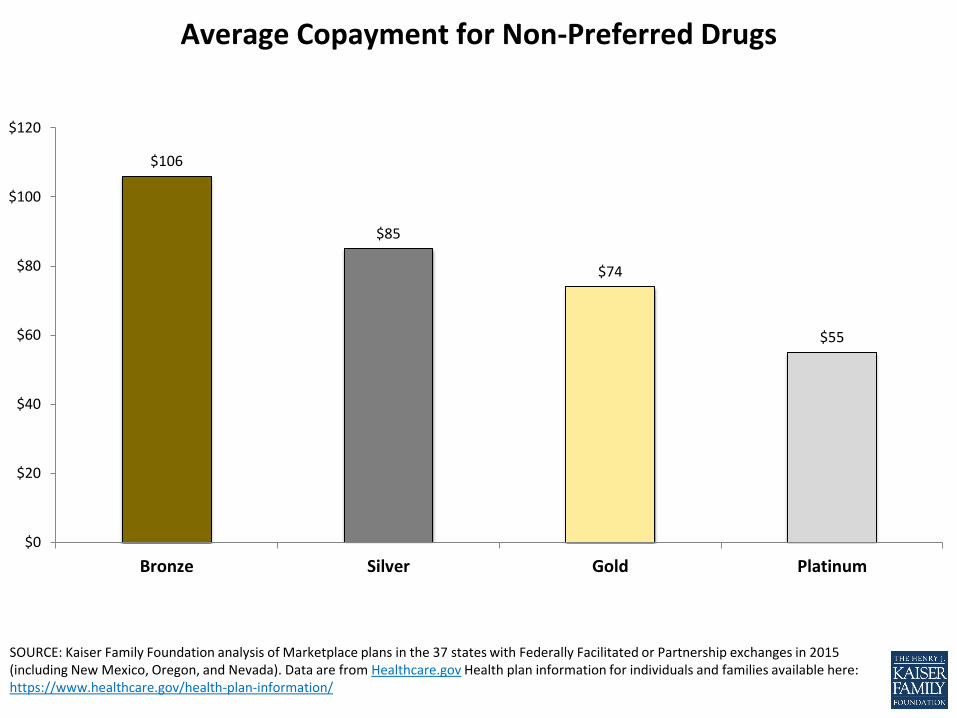
Average Copayment for Non-Preferred Drugs
$106
$85
$74
$55
$0
$20
$40
$60
$80
$100
$120
Bronze Silver Gold Platinum
SOURCE: Kaiser Family Foundation analysis of Marketplace plans in the 37 states with Federally Facilitated or Partnership exchanges in 2015 (including New Mexico, Oregon, and Nevada). Data are from Healthcare.gov Health plan information for individuals and families available here: https://www.healthcare.gov/health-plan-information/
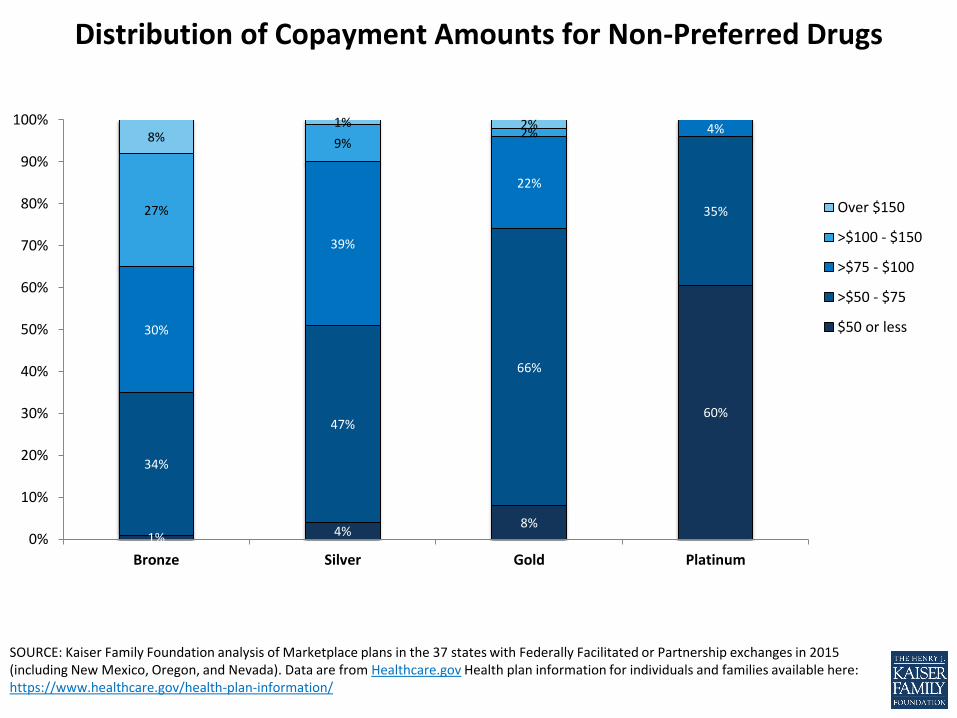
Distribution of Copayment Amounts for Non-Preferred Drugs
1% 4% 8%
60%
34%
47%
66%
35%
30%
39%
22%
4%
27%
9% 2% 8%
1% 2%
0%
10%
20%
30%
40%
50%
60%
70%
80%
90%
100%
Bronze Silver Gold Platinum
Over $150
>$100 - $150
>$75 - $100
>$50 - $75
$50 or less
SOURCE: Kaiser Family Foundation analysis of Marketplace plans in the 37 states with Federally Facilitated or Partnership exchanges in 2015 (including New Mexico, Oregon, and Nevada). Data are from Healthcare.gov Health plan information for individuals and families available here: https://www.healthcare.gov/health-plan-information/
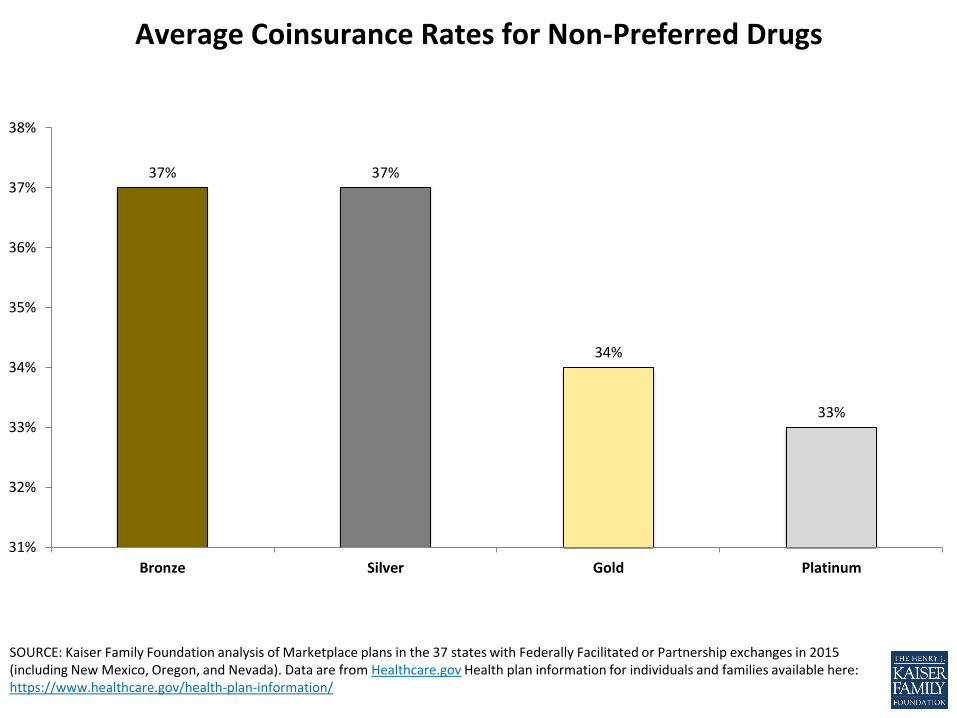
Average Coinsurance Rates for Non-Preferred Drugs
37% 37%
34%
33%
31%
32%
33%
34%
35%
36%
37%
38%
Bronze Silver Gold Platinum
SOURCE: Kaiser Family Foundation analysis of Marketplace plans in the 37 states with Federally Facilitated or Partnership exchanges in 2015 (including New Mexico, Oregon, and Nevada). Data are from Healthcare.gov Health plan information for individuals and families available here: https://www.healthcare.gov/health-plan-information/
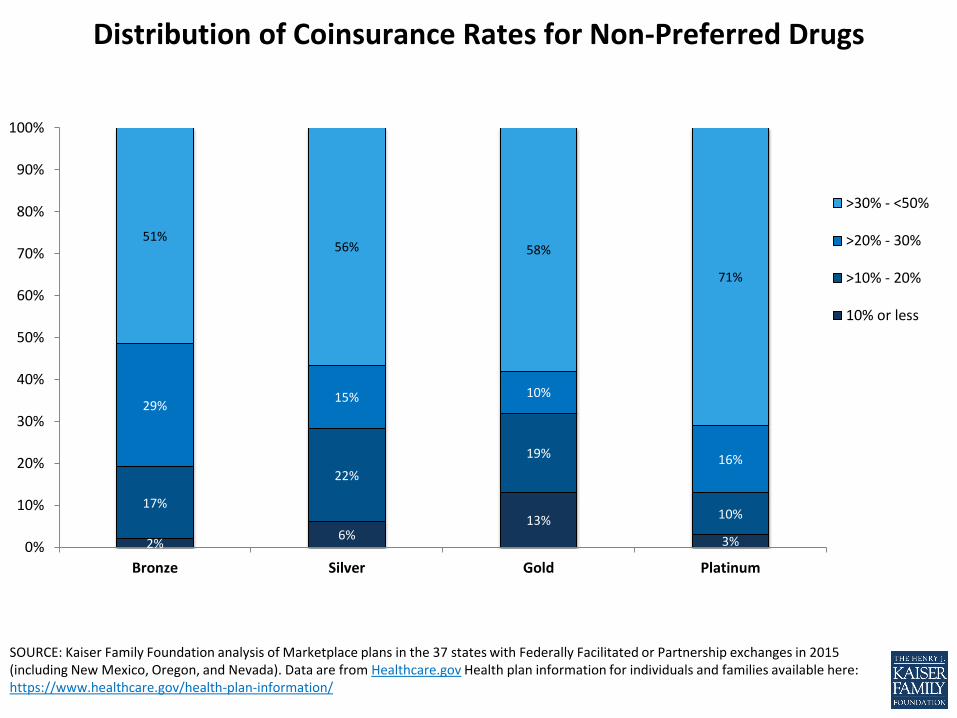
Distribution of Coinsurance Rates for Non-Preferred Drugs
2% 6%
13%
3%
17%
22%
19%
10%
29% 15% 10%
16%
51% 56% 58%
71%
0%
10%
20%
30%
40%
50%
60%
70%
80%
90%
100%
Bronze Silver Gold Platinum
>30% - <50%
>20% - 30%
>10% - 20%
10% or less
SOURCE: Kaiser Family Foundation analysis of Marketplace plans in the 37 states with Federally Facilitated or Partnership exchanges in 2015 (including New Mexico, Oregon, and Nevada). Data are from Healthcare.gov Health plan information for individuals and families available here: https://www.healthcare.gov/health-plan-information/
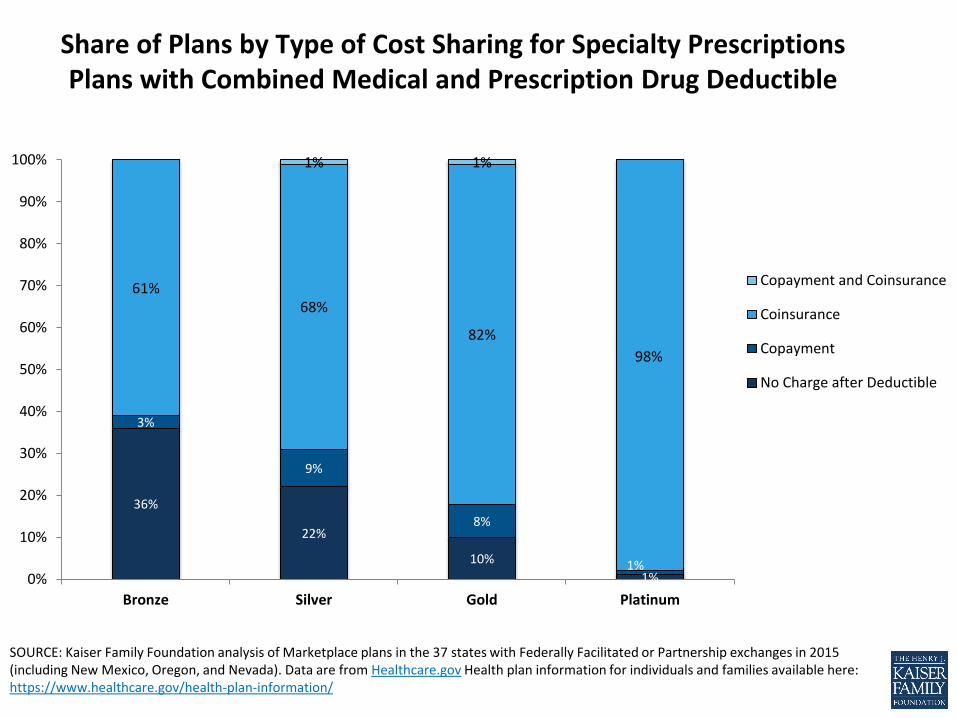
Share of Plans by Type of Cost Sharing for Specialty Prescriptions Plans with Combined Medical and Prescription Drug Deductible
36%
22%
10%
1%
3%
9%
8%
1%
61% 68%
82%
98%
1% 1%
0%
10%
20%
30%
40%
50%
60%
70%
80%
90%
100%
Bronze Silver Gold Platinum
Copayment and Coinsurance
Coinsurance
Copayment
No Charge after Deductible
SOURCE: Kaiser Family Foundation analysis of Marketplace plans in the 37 states with Federally Facilitated or Partnership exchanges in 2015 (including New Mexico, Oregon, and Nevada). Data are from Healthcare.gov Health plan information for individuals and families available here: https://www.healthcare.gov/health-plan-information/
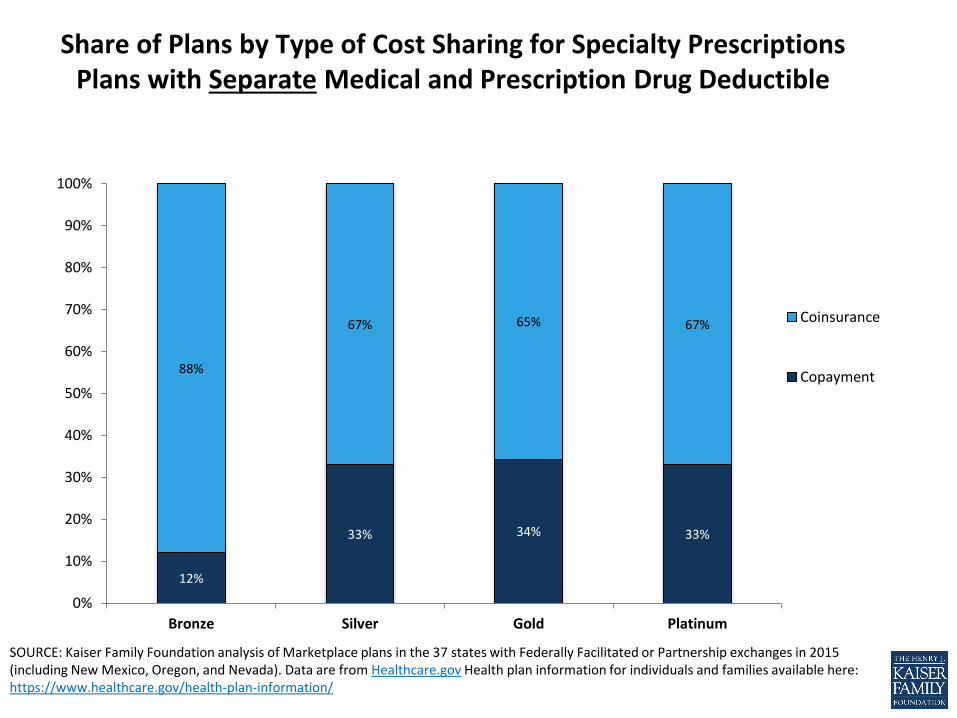
Share of Plans by Type of Cost Sharing for Specialty Prescriptions Plans with Separate Medical and Prescription Drug Deductible
12%
33% 34% 33%
88%
67% 65% 67%
0%
10%
20%
30%
40%
50%
60%
70%
80%
90%
100%
Bronze Silver Gold Platinum
Coinsurance
Copayment
SOURCE: Kaiser Family Foundation analysis of Marketplace plans in the 37 states with Federally Facilitated or Partnership exchanges in 2015 (including New Mexico, Oregon, and Nevada). Data are from Healthcare.gov Health plan information for individuals and families available here: https://www.healthcare.gov/health-plan-information/
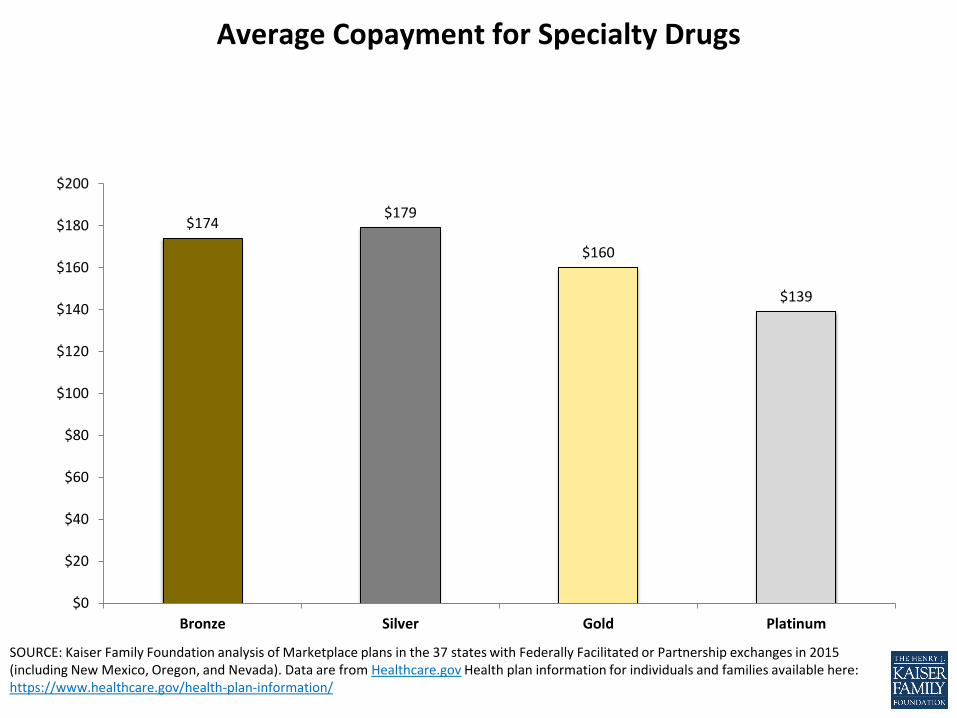
Average Copayment for Specialty Drugs
$174 $179
$160
$139
$0
$20
$40
$60
$80
$100
$120
$140
$160
$180
$200
Bronze Silver Gold Platinum
SOURCE: Kaiser Family Foundation analysis of Marketplace plans in the 37 states with Federally Facilitated or Partnership exchanges in 2015 (including New Mexico, Oregon, and Nevada). Data are from Healthcare.gov Health plan information for individuals and families available here: https://www.healthcare.gov/health-plan-information/
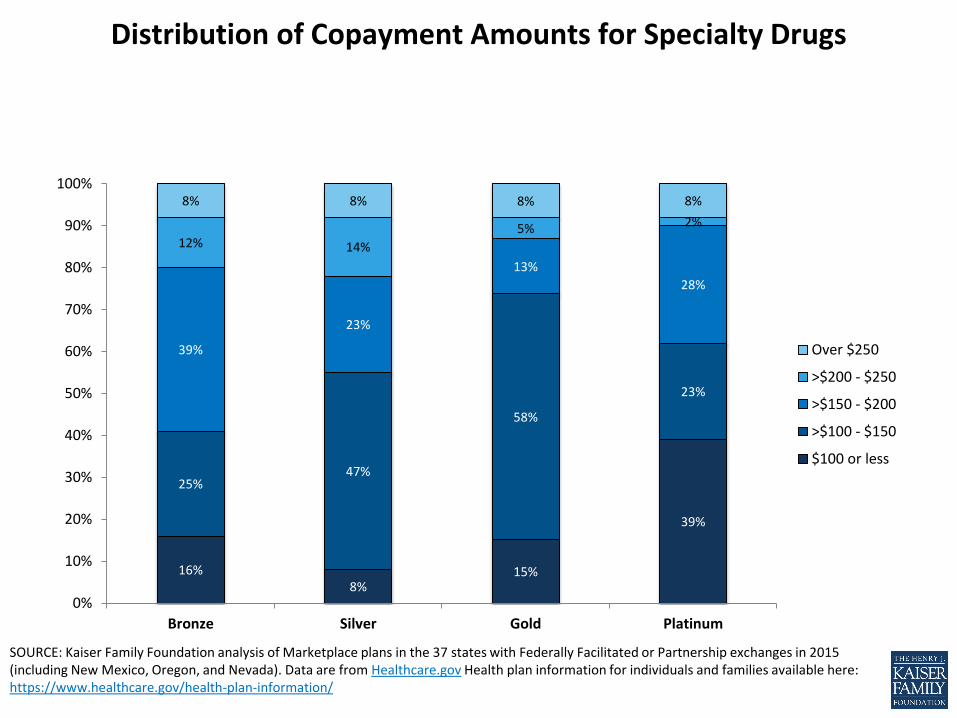
Distribution of Copayment Amounts for Specialty Drugs
16% 8%
15%
39%
25% 47%
58%
23%
39%
23%
13%
28%
12% 14%
5% 2%
8% 8% 8% 8%
0%
10%
20%
30%
40%
50%
60%
70%
80%
90%
100%
Bronze Silver Gold Platinum
Over $250
>$200 - $250
>$150 - $200
>$100 - $150
$100 or less
SOURCE: Kaiser Family Foundation analysis of Marketplace plans in the 37 states with Federally Facilitated or Partnership exchanges in 2015 (including New Mexico, Oregon, and Nevada). Data are from Healthcare.gov Health plan information for individuals and families available here: https://www.healthcare.gov/health-plan-information/
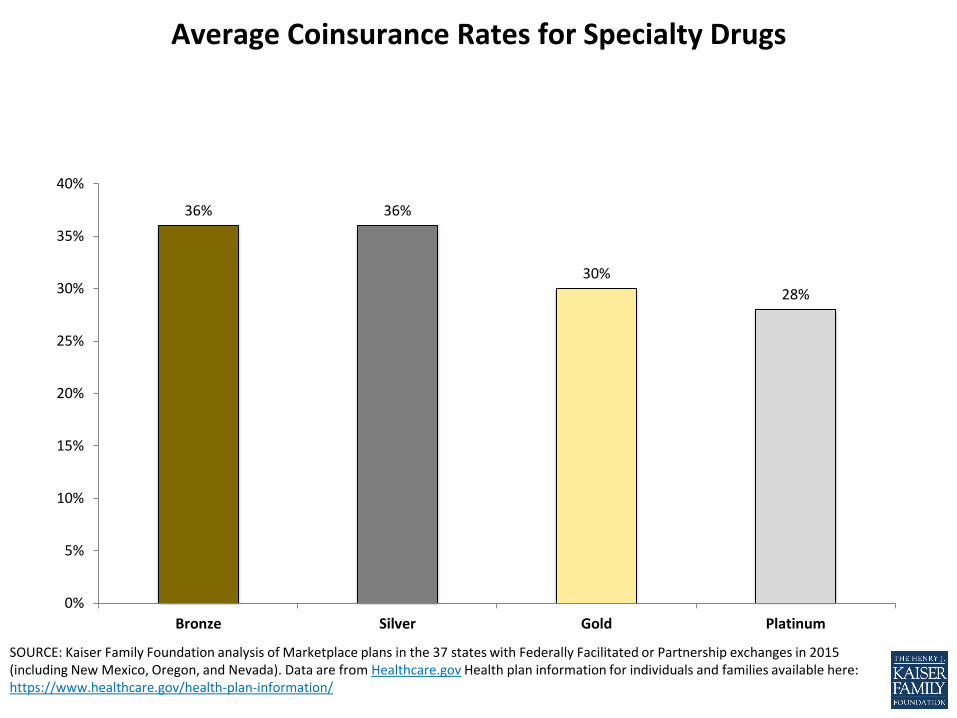
Average Coinsurance Rates for Specialty Drugs
36% 36%
30%
28%
0%
5%
10%
15%
20%
25%
30%
35%
40%
Bronze Silver Gold Platinum
SOURCE: Kaiser Family Foundation analysis of Marketplace plans in the 37 states with Federally Facilitated or Partnership exchanges in 2015 (including New Mexico, Oregon, and Nevada). Data are from Healthcare.gov Health plan information for individuals and families available here: https://www.healthcare.gov/health-plan-information/
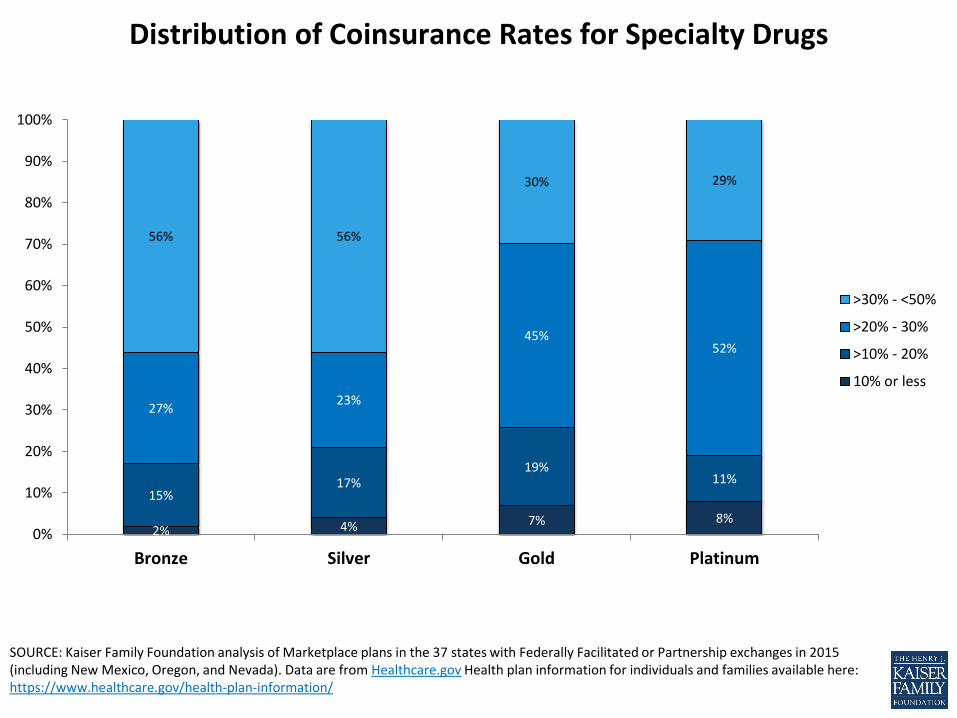
Distribution of Coinsurance Rates for Specialty Drugs
2% 4% 7% 8%
15% 17%
19% 11%
27% 23%
45% 52%
56% 56%
30% 29%
0%
10%
20%
30%
40%
50%
60%
70%
80%
90%
100%
Bronze Silver Gold Platinum
>30% - <50%
>20% - 30%
>10% - 20%
10% or less