Prescription and Synthetic Drug Use and Abuse: A ...
26
Prescription and Synthetic Drug Use and Abuse: A Collaborative Analysis to the Magnitude of the Problem in Grand Forks County, North Dakota and Polk County, Minnesota Laura M. Ahmed MPH candidate University of North Dakota
Transcript of Prescription and Synthetic Drug Use and Abuse: A ...

Prescription and Synthetic Drug Use and Abuse: A Collaborative Analysis to the Magnitude of the Problem in
Grand Forks County, North Dakota and Polk County, Minnesota
Laura M. Ahmed
MPH candidate
University of North Dakota
rtallman
Rectangle
rtallman
Text Box
APPENDIX E

TABLE OF CONTENTS
INTRODUCTION ... . .. . ........................ . ... . .. . ......... . ....... . ... . ............ . ............. p.2
BACKGROUND .............. . ...................... . ........................ .. ............ . .. . .. . . .. ... p.2 Grand Forks and Polk County Sociodemographics ... p.2 A Review of Prescription and Synthetic Drugs .. . p.4 Prescription and Synthetic Drugs in Grand Forks and Polk County ... p. 6
METHODS ............. . ..................... . ........ . ............. . . . .. .................................. p.6
RESULTS ...................... . . . . .. ... .. .................................. . ............................ . p.7 Grand Forks Police Department (GFPD) ... p. 7 Grand Forks County Task Force ND BC! ... p. 7 Grand Forks County States Attorney .. . p. 9 Altru Health System, Emergency Department .. . p.11 University of North Dakota .. . p.12 State Social Services Report ... p. 13 North Dakota Department of Human Services: FRAME Data ... p.14 Polk County Public Health: Youth Profile ... p.15 Grand Forks County Coroner ... p.16 Northeast Human Service Center ... p. 16
LIMITATIONS ..................................................... . ............................ . .... ... p.18
DISCUSSION & RECOMMENDATIONS ... ............................................. . ........ p.18
CONCLUSION .............................. . ................................................... . ....... p.21
THANKS & ACKNOWLEDGEMENTS ...................... . . . ...................... .. ........... p.22
REFERENCES . . . .... . . . . ........... . .................................................................... p.23
APPENDIX A .. .. ... . . . . . .... .. . . . ........... . ................ . ....................... . ...... . .. . ......... p.24
(
(
(
1
rtallman
Rectangle

INTRODUCTION
The issue of prescription and synthetic drug abuse is a growing public health problem in the United States ([SAMHSA], 2014). Drug-related deaths are now the leading cause of death in the United States, surpassing traffic accidents (Dart et al., 2015). Abuse of these substances has widespread negative impacts that do not discriminate across age, gender, race or ethnicity ([SAMHSA], 2014). Communities in North Dakota initially experienced the threat of these drugs in 2012. Although it is clear that the issue of prescription and synthetic drug abuse is becoming more prevalent, the magnitude of this problem has not yet been determined.
Altru Health System Prescription and Synthetic Drug Abuse Committee was formed in May, 2015 in response to initial meetings conducted by the law enforcement community in response to several high profile overdose deaths in the community. Efforts were aimed at addressing prescription and synthetic drug abuse in Grand Forks County (GFC), ND. In August 2015, Altru's Task Force created the data collection sub-committee, responsible for gathering and synthesizing data on prescription and synthetic drug abuse in northeastern North Dakota. Data collection committee efforts were led by Grand Forks Public Health Director, Debbie Swanson, and involved several community members representing important entities contributing data to this report, including: the North Dakota Department of Human Services, Polk County Public Health, the Crookston Police Department, the Drug Task Force North Dakota Bureau of Criminal Investigation (Drug Task Force ND BCI), the Grand Forks County States Attorney's Office, Altru Health Systems, the Grand Forks Police Department, the Grand Forks County Coroner, the Grand Forks Sheriffs Office, the University of North Dakota, Grand Forks Public Schools, and Grand Forks County Social Services.
This report aims to establish the magnitude of the problem in order to inform future efforts, such as policies and community interventions that may mitigate the effects of prescription and synthetic drug abuse in North Dakota communities. This work synthesizes data from multiple sources, mentioned above, and identifies significant trends and major issues relating to prescription and synthetic drug abuse in the northeast region of North Dakota. Meaningful legislation and community efforts combating this problem are also suggested.
BACKGROUND
Grand Forks and Polk County Sociodemographics
A comprehensive analysis of Grand Forks-Polk County sociodemographics and health characteristics was undertaken to provide a context for the problem. Data sources searched included: the U.S. Department of Agriculture (USDA); the U.S. Census Bureau; the Office of Management and Budget (OMB); Community Health Resources (CHR); the National Center for Health Statistics; the Behavioral Risk Factor Surveillance System (BRFSS); the American Community Survey; the National Center for Chronic Disease Prevention and Health Promotion, Division of Diabetes Translation; County Health Rankings; the National Center for Education Statistics; County Business Partners; the Area Health Resource File; the USDA Food Environment Atlas; the Henry J. Kaiser Family Foundation; the Centers for Disease Control and Prevention (CDC); the Economic Research Service; and, the Dartmouth Atlas of Health Care. This component of the report serves as a foundation to inform future work, such as community interventions and policy efforts.
2
rtallman
Rectangle

Population Characteristics
Currently, North Dakota is experiencing a sharp upward trend in population growth with an alltime high of 739,482 people based on 2014 estimates (Bureau, 2014). This state trend is reflected in Grand Forks County, whose population has grown almost 5% since 2010 and, as of July 2014, includes approximately 70,138 residents (Bureau, 2014). Alternatively, Polk County, located in Minnesota, has a population less than half the size of Grand For ks County: 31,600 residents (Bureau, 2014). Polk County has not experience significant population growth: 0.3% growth from 2010 to 2014 (Bureau, 2014).
In North Dakota, the percent of persons under age 18 is 22.8%, and the percent aged 65 and older is 14.2% (Bureau, 2014). Grand Forks County has a significantly younger populace, compared to its surrounding North Dakota Counties: approximately 20% of Grand Forks County residents are under 18 years old, and just 11.2% are aged 65 and older (Bureau, 2014). Similarly, 23.4% of Polk County residents are under age 18, and 17.1 % are aged 65 and older (Bureau, 2014).
The race and ethnicity of North Dakota residents, in general, differs substantially from that of the United States. According to 2014 estimates, the United States' population is 77.4% White, 13 .2% Black or African American, 5 .4% Asian, 17.4% Hispanic or Latino, and 1.2% Native or Alaskan American (Bureau, 2014). North Dakota is far more racially and ethnically homogeneous: 89.1%White,2.1% Black or African American, 1.3% Asian, 3.2% Hispanic or Latino, and 5.4% Native or Alaskan American (Bureau, 2014). Grand Forks County is slightly more diverse than North Dakota, as a whole, although, race and ethnicity characteristics are comparable: 88.8% White, 3.5% Black or African American, 2.3% Asian, 3.8% Hispanic or Latino, and 2.8% Native or Alaskan American (Bureau, 2014). Polk County is also comparable: 93.7% White, 1.4% Black or African American, 1.1% Asian, 5.9% Hispanic or Latino, and 1.7% Native or Alaskan American (Bureau, 2014).
Socioeconomic Status
North Dakota's median household income is slightly higher than the national average: $55,579 versus $53,482 (Bureau, 2014). Alternatively, the median household income in Grand Forks County and Polk County are lower than state and national averages: $46,745 and $50,695, respectively (Bureau, 2014). In addition, Grand Forks County and Polk County have a relatively high percentage of persons living in poverty compared to North Dakota percentages: 15.1 % and 13.3%, respectively, compared to 11.5% (Bureau, 2014).
Health Status Despite below-average socioeconomic status scores, in both Grand Forks and Polk counties, just 11 % of residents rate their health as fair to poor (U. o. W. P.H. Institute, 2014). In addition, Grand Forks and Polk County residents report an average of less than 3 physically and mentally unhealthy days per month (U. o. W. P.H. Institute, 2014). Grand Forks County also has a relatively low disability rate, compared to the United States: 6.8% versus 8.5% (Bureau, 2014).
Although Grand Forks and Polk County residents score well on self-reported health status indicators, other indicators suggest poor health. That is, in both Grand Forks and Polk County, 30% of adult residents report a BMI greater than or equal to 30, indicating obesity (U. o. W. P. H. Institute, 2014). In addition, 23% of Grand Forks residents aged 20 and older, and 27% of
3
rtallman
Rectangle
Polk County residents aged 20 and older, report no leisure time activity (U. o. W. P.H. Institute, 2014). With this, more than 1;5th of Grand Forks and Polk County adult residents report binge drinking and heavy drinking, and more than llih smoke (U. o. W. P.H. Institute, 2014).
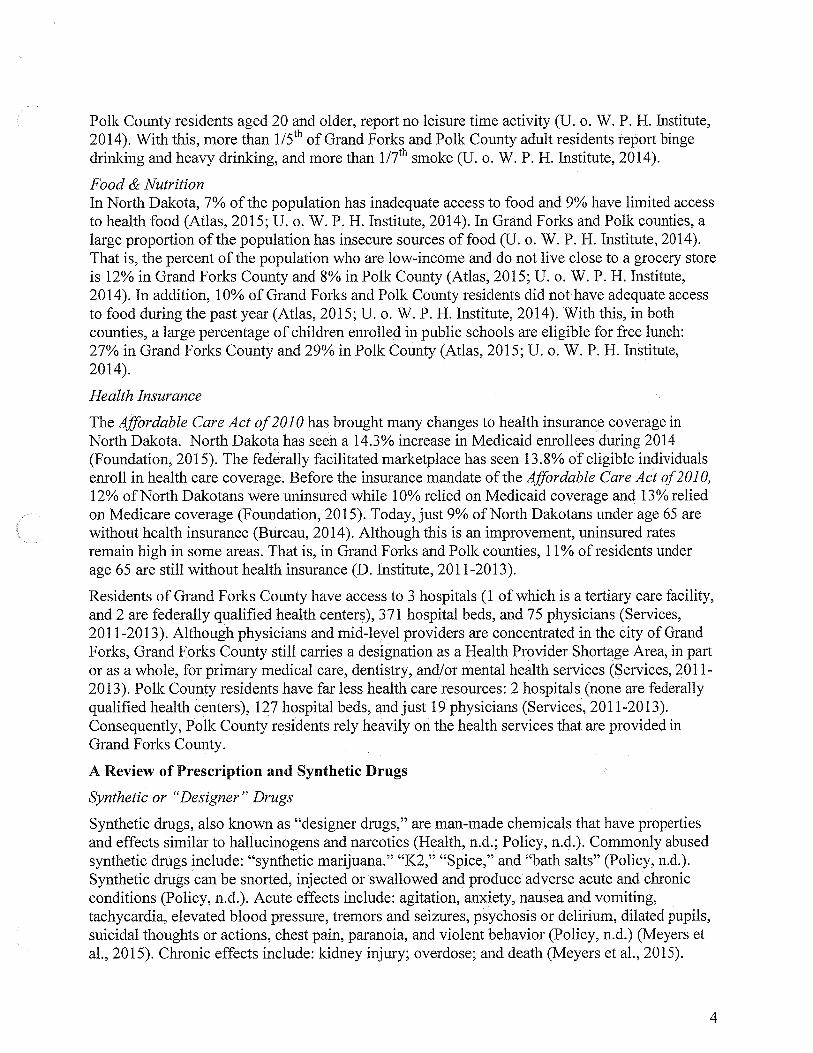
Food & Nutrition In North Dakota, 7% of the population has inadequate access to food and 9% have limited access to health food (Atlas, 2015; U. o. W. P.H. Institute, 2014). In Grand Forks and Polk counties, a large proportion of the population has insecure sources of food (U. o. W. P.H. Institute, 2014). That is, the percent of the population who are low-income and do not live close to a grocery store is 12% in Grand Forks County and 8% in Polk County (Atlas, 2015; U. o. W. P.H. Institute, 2014). In addition, 10% of Grand Forks and Polk County residents did not have adequate access to food during the past year (Atlas, 2015; U. o. W. P.H. Institute, 2014). With this, in both counties, a large percentage of children enrolled in public schools are eligible for free lunch: 27% in Grand Forks County and 29% in Polk County (Atlas, 2015; U. o. W. P.H. Institute, 2014).
Health Insurance
The Affordable Care Act of 2010 has brought many changes to health insurance coverage in North Dakota. North Dakota has seen a 14.3% increase in Medicaid enrollees during 2014 (Foundation, 2015). The federally facilitated marketplace has seen 13.8% of eligible individuals enroll in health care coverage. Before the insurance mandate of the Affordable Care Act of 2010, 12% of North Dakotans were uninsured while 10% relied on Medicaid coverage and 13% relied on Medicare coverage (Foundation, 2015). Today, just 9% of North Dakotans under age 65 are without health insurance (Bureau, 2014). Although this is an improvement, uninsured rates remain high in some areas. That is, in Grand Forks and Polk counties, 11 % of residents under age 65 are still without health insurance (D. Institute, 2011-2013).
Residents of Grand Forks County have access to 3 hospitals (1 of which is a tertiary care facility, and 2 are federally qualified health centers), 371 hospital beds, and 75 physicians (Services, 2011-2013). Although physicians and mid-level providers are concentrated in the city of Grand Forks, Grand Forks County still carries a designation as a Health Provider Shortage Area, in part or as a whole, for primary medical care, dentistry, and/or mental health services (Services, 2011-2013). Polk County residents have far less health care resources: 2 hospitals (none are federally qualified health centers), 127 hospital beds, and just 19 physicians (Services, 2011-2013). Consequently, Polk County residents rely heavily on the health services that are provided in Grand For ks County.
A Review of Prescription and Synthetic Drugs
Synthetic or "Designer" Drugs
Synthetic drugs, also known as "designer drugs," are man-made chemicals that have properties and effects similar to hallucinogens and narcotics (Health, n.d.; Policy, n.d.). Commonly abused synthetic drugs include: "synthetic marijuana." "K2," "Spice," and "bath salts" (Policy, n.d.). Synthetic drugs can be snorted, injected or swallowed and produce adverse acute and chronic conditions (Policy, n.d.). Acute effects include: agitation, anxiety, nausea and vomiting, tachycardia, elevated blood pressure, tremors and seizures, psychosis or delirium, dilated pupils, suicidal thoughts or actions, chest pain, paranoia, and violent behavior (Policy, n.d.) (Meyers et al., 2015). Chronic effects include: kidney injury; overdose; and death (Meyers et al., 2015).
4
rtallman
Rectangle

Synthetic drugs are designed to evade regulations against illicit substances and are marketed as "a legal high" (Health, n.d.; Policy, n.d.). That is, the chemical composition of synthetic drugs is continuously altered in order to avoid government regulations-in 2012, the total number of synthetic substances identified was 158 (Policy, n.d.). In addition, synthetics on the market are labeled "not for human consumption" to disguise their true purpose and avoid Food and Drug Administration (FDA) regulation (Health, n.d.; Policy, n.d.).
Here, it is important to note that Emergency Departments (EDs) are typically the first responders to drug poisonings (Dart et al., 2015). Despite familiarity with poisonings, ED health professionals are constantly challenged by the emergence of new synthetic drugs (i.e. frequent chemical composition changes) that often require new diagnosis and treatment approaches (Dart et al., 2015).
The easy access to, and legal complications associated with, synthetic drugs have fueled the growth of this problem. The Internet has recently emerged as a major player for the marketing and distribution of illicit designer and prescription drugs (Meyers et al., 2015; Orsolini, Francesconi, Papanti, Giorgetti, & Schifano, 2015). Designer drugs are readily available for purchase on more than 30 online websites, 45% of which are hosted in the U.S. (Meyers et al., 2015). Online webpages use sophisticated marketing strategies to bolster sales, such as recognizable security, easy payment methods, and expedited or free shipping (Meyers et al., 2015; Orsolini et al., 2015).
Synthetic drug use is becoming especially high among youth. Synthetic drugs are now the second most commonly used illegal drug among li11 graders, second only to marijuana (Health, n.d.; Policy, n.d.). In 2012, the Monitoring the Future Survey of Youth Drug-use Trends showed that more than 10% of 12th graders used synthetic drugs in the past year (Health, n.d.; Policy, n.d.).
Prescription Drugs
Prescription drug abuse includes any misuse of prescription medication not intended for its purpose (McHugh, Nielsen, & Weiss, 2015). Commonly abused prescription drugs include: opioids, for pain (e.g. morphine, codeine, fentanyl, hydrocodone, oxycodone); central nervous system depressants, for anxiety and sleep disorders (e.g. pentobarbital sodium, diazepam, alprazolam); and stimulants, for ADHD and narcolepsy (e.g. methylphenidate, amphetamines) ([SAMHSA], 2014; Abuse, 2015). Signs, symptoms and effects of prescription drug abuse depend on the drug abused (Clinic, 2015). Acute opioid effects include: constipation, nausea, slowed breathing, and drowsiness and confusion (Clinic, 2015). Acute depressant effects include: drowsiness, confusion lack of coordination, slurred speech, poor concentration, and memory problems (Clinic, 2015). Acute effects of stimulants include: reduce appetite, agitation, anxiety and paranoia, insomnia, and irregular heartbeat (Clinic, 2015).
Abuse of prescription drugs is a growing problem paralleled with increased prescription of these drugs (McHugh et al., 2015). Over the past 20 years, prescription drug abuse has increased by 250% (McHugh et al., 2015). According to the National Survey on Drug Use and Health, in 2012, almost 17 million people age 12 or older abused prescription drugs (McHugh et al., 2015). With this, treatment admissions for prescriptions opioid substance abuse increased five-fold from 2000 to 2010 (McHugh et al., 2015).
5
rtallman
Rectangle

Prescription and Synthetic Drugs in Grand Forks and Polk County
Drug "System" Collaborations
Multiple entities in Grand Forks County respond to drug abusers, each offering unique services. These entities are highly fragmented in their efforts. Fragmentation occurs in several areas, including: response efforts; alert systems (e.g. referrals); and data collection. The lack of supportive systems (e.g. no detox facility in Grand Forks County and no medication assisted treatment programs) and other gaps preventing collaborative activities contribute to fragmentation and, consequently, prevention efforts have been largely ineffective.
State Prescription Drug Monitoring Programs
"Doctor shopping" is a practice in which prescription-addicted persons obtain prescriptions from multiple providers (Kolodny et al., 2015). North Dakota and Minnesota use prescription drug monitoring programs (PDMPs) to identify doctor shoppers and prompt prevention efforts, such as modifying prescribing practices or coordinating care with other providers (Kolodny et al., 2015). Minnesota's and North Dakota's PDMPs are compatible systems that allow for exchanging of data. By coordinating care activities using compatible PD MPs, providers are able to prevent prescription abuse (i.e. doctor shopping), which could be easily done in Grand Forks and Polk County (Pharmacy, 2016).
North Dakota and Minnesota's PDMPs have other important capabilities that protect the public from drug diversion and misuse through local, state, and federal collaborations. These capabilities include: sharing patient profiles between healthcare providers; sharing data with law enforcement to aid their activities; inspiring the development of advisory committees and programs that reduce controlled substance abuse and misuse; and educating the public (i.e. some data is publicly available) (Pharmacy, 2016). The PDMP is an online database that tracks controlled substances dispensed in North Dakota.
PDMPs are useful tools that allow providers to identify prescription-addicted, doctor shopping patients. There are, however, certain drawbacks associated with PDMP use. First, patients identified as doctor shoppers are frequently turned away without any addiction treatment assistance (Kolodny et al., 2015). Hospital staff attending to drug-seeking patients should attempt to link these patients with addition treatment services (Kolodny et al., 2015). Second, PD MPs can only be effective if providers are utilizing them. Unfortunately, these databases are frequently underutilized (Kolodny et al., 2015).
METHODS
The Community Prescription and Synthetic Drug Abuse Committee formed the data collection sub-committee responsible for this report. Data collection committee efforts were led by Grand Forks Public Health Director, Debbie Swanson, and involved several Grand Forks and Polk County residents representing important entities that have collected data on prescription and synthetic drug abuse: the North Dakota Department of Human Services, Polk County Public Health, Crookston Police Department, Drug Task Force North Dakota Bureau of Criminal Investigation (Drug Task Force ND BCI), the Grand Forks County States Attorney's Office, Altru Hospital Systems, the Grand Forks Police Department, the Grand Forks County Coroner, the Grand Forks Sheriffs Office, the University of North Dakota, Grand Forks Public Schools, and Grand Forks Social Services. Separate analyses were performed for each dataset. Data were
6
rtallman
Rectangle
synthesized to establish longitudinal trends, identify issues and non-issues related to prescription and synthetic drug abuse, and establish the magnitude of the problem. A secondary analysis from existing public sources was also conducted. This specifically involved a review of demographic, social, economic, and health characteristics for Grand Forks and Polk County.
RESULTS
Grand Forks Police Department (GFPD)
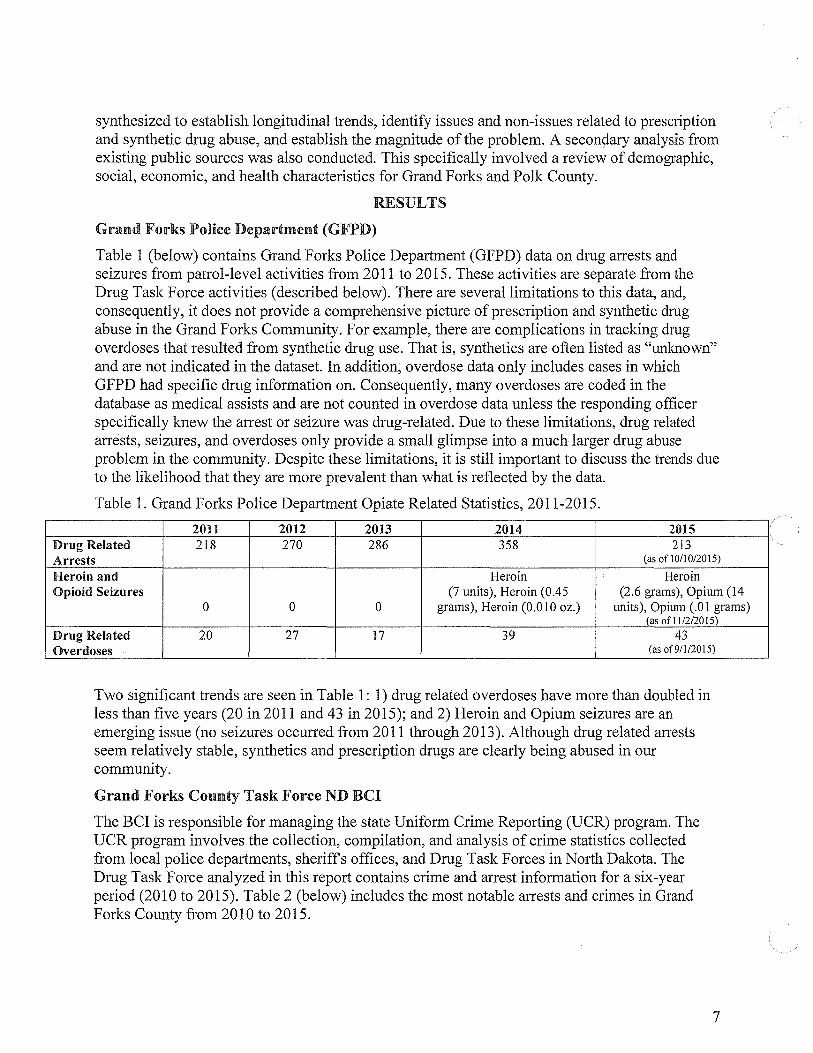
Table 1 (below) contains Grand Forks Police Department (GFPD) data on drug arrests and seizures from patrol-level activities from 2011to2015. These activities are separate from the Drug Task Force activities (described below). There are several limitations to this data, and, consequently, it does not provide a comprehensive picture of prescription and synthetic drug abuse in the Grand Forks Community. For example, there are complications in tracking drug overdoses that resulted from synthetic drug use. That is, synthetics are often listed as "unknown" and are not indicated in the dataset. In addition, overdose data only includes cases in which GFPD had specific drug information on. Consequently, many overdoses are coded in the database as medical assists and are not counted in overdose data unless the responding officer specifically knew the arrest or seizure was drug-related. Due to these limitations, drug related arrests, seizures, and overdoses only provide a small glimpse into a much larger drug abuse problem in the community. Despite these limitations, it is still important to discuss the trends due to the likelihood that they are more prevalent than what is reflected by the data.
Table 1. Grand Forks Police Department Opiate Related Statistics, 2011-2015.
2011 2012 2013 2014 2015 Drug Related 218 270 286 358 213 Arrests (as of 10/10/2015)
Heroin and Heroin Heroin Opioid Seizures (7 units), Heroin (0.45 (2.6 grams), Opium (14
0 0 0 grams), Heroin (O.oIO oz.) units), Opium (.01 grams) (as of I 1/2/20 I 5)
Drug Related 20 27 17 39 43 Overdoses (as of9/I/2015)
Two significant trends are seen in Table 1: 1) drug related overdoses have more than doubled in less than five years (20 in 2011 and 43 in 2015); and 2) Heroin and Opium seizures are an emerging issue (no seizures occurred from 2011 through 2013). Although drug related arrests seem relatively stable, synthetics and prescription drugs are clearly being abused in our community.
Grand Forks County Task Force ND BCI
The BCI is responsible for managing the state Uniform Crime Reporting (UCR) program. The UCR program involves the collection, compilation, and analysis of crime statistics collected from local police departments, sheriffs offices, and Drug Task Forces in North Dakota. The Drug Task Force analyzed in this report contains crime and arrest information for a six-year period (2010 to 2015). Table 2 (below) includes the most notable arrests and crimes in Grand Forks County from 2010 to 2015.
7
rtallman
Rectangle
rtallman
Rectangle
rtallman
Rectangle
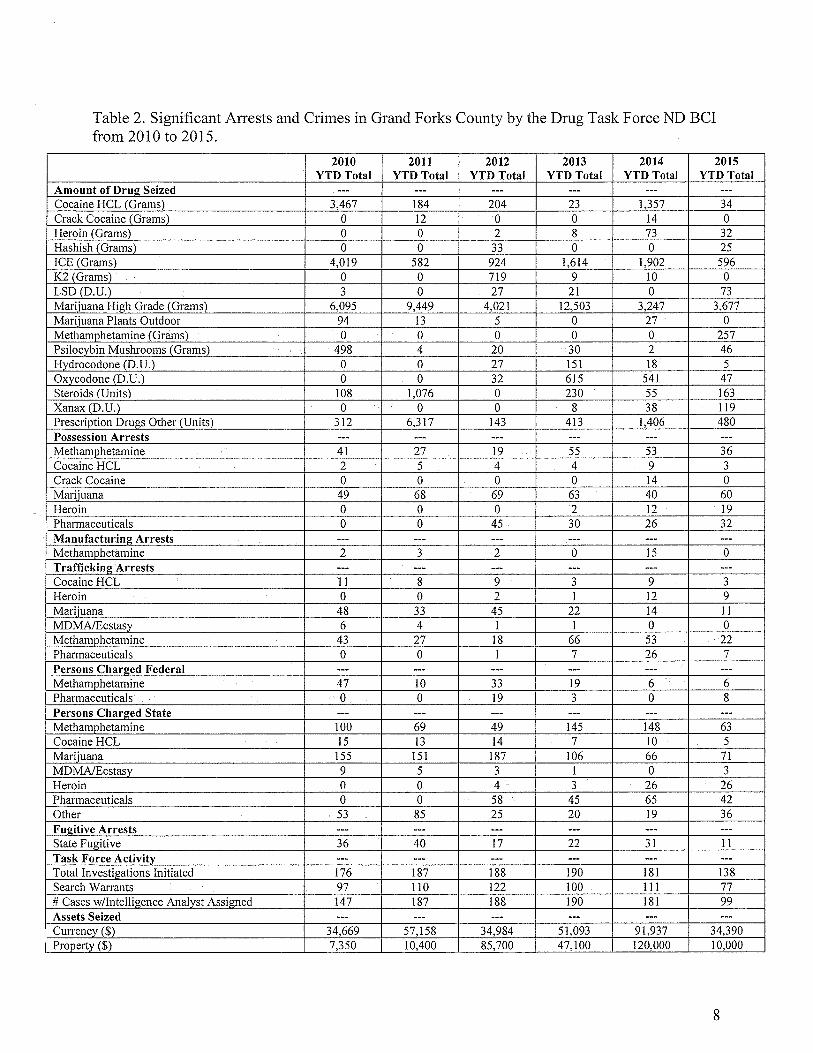
Table 2. Significant Arrests and Crimes in Grand Forks County by the Drug Task Force ND BCI from 2010 to 2015.
2010 2011 2012 2013 2014 2015 YTDTotal YTD Total YTD Total YTD Total YTD Total YTD Total
Amount of Drug Seized --- --- --- --- --- ---Cocaine HCL (Grams) 3,467 184 204 23 1,357 34 Crack Cocaine (Grams) 0 12 0 0 14 0 Heroin (Grams) 0 0 2 8 73 32 Hashish (Grams) 0 0 33 0 0 25 ICE (Grams) 4,019 582 924 1,614 1,902 596 K2 (Grams) 0 0 719 9 10 0 LSD (D.U.) 3 0 27 21 0 73 Marijuana High Grade (Grams) 6,095 9,449 4,021 12,503 3,247 3,677 Marijuana Plants Outdoor 94 13 5 0 27 0 Methamohetamine (Grams) 0 0 0 0 0 257 Psilocybin Mushrooms (Grams) 498 4 20 30 2 46 Hydrocodone (D.U.) 0 0 27 151 18 5 Oxycodone (D.U.) 0 0 32 615 541 47 Steroids (Units) 108 1,076 0 230 55 163 Xanax (D.U.) 0 0 0 8 38 119 Prescription Drugs Other (Units) 312 6,317 143 413 1,406 480 Possession Arrests --- --- --- --- --- ---Methamohetamine 41 27 19 55 53 36 Cocaine HCL 2 5 4 4 9 3 Crack Cocaine 0 0 0 0 14 0 Marijuana 49 68 69 63 40 60 Heroin 0 0 0 2 12 19 Pharmaceuticals 0 0 45 30 26 32 Manufacturing Arrests --- --- --- --- --- ---Methamphetamine 2 3 2 0 15 0 Traffickim~ Arrests --- --- --- --- --- ---Cocaine HCL 11 8 9 3 9 3 Heroin 0 0 2 I 12 9 Marijuana 48 33 45 22 14 11 MD MA/Ecstasy 6 4 1 1 0 0 Methamphetamine 43 27 18 66 53 22 Pharmaceuticals 0 0 1 7 26 7 Persons Charged Federal --- --- --- --- --- ---Methamohetamine 47 10 33 19 6 6 Pharmaceuticals 0 0 19 3 0 8 Persons Charged State --- --- --- --- --- ---Methamohetamine 100 69 49 145 148 63 Cocaine HCL 15 13 14 7 10 5 Marijuana 155 151 187 106 66 71 MD MA/Ecstasy 9 5 3 1 0 3 Heroin 0 0 4 3 26 26 Pharmaceuticals 0 0
= 58 45 65 42
Other 53 85 25 20 19 36 Fm!itive Arrests --- --- --- --- --- ---State Fugitive 36 40 17 22 31 11 Task Force Activity --- --- --- --- --- ---Total Investigations Initiated 176 187 188 190 181 138 Search Warrants 97 110 122 100 111 77 # Cases w/Intelligence Analyst Assigned 147 187 188 190 181 99 Assets Seized --- --- --- --- --- ---Currency ($) 34,669 57,158 34,984 51,093 91,937 34,390
I Prooertv ($) 7,350 10,400 85,700 47,100 120,000 10,000
8
rtallman
Rectangle

Table 2 reveals several important trends. Based on six-year trends of amount of drugs seized, the following drugs were identified as issues in Grand Forks County: Heroin, Hashish, LSD, Methamphetamine, and Xanax. Drugs that may be on the rise include: Steroids, Psilocybin Mushrooms, and outdoor Marijuana plants. Drugs that may be of decreased concern include: Cocaine HCL, Crack Cocaine, ICE, Hydrocodone, and Oxycodone. Drug seizures that do not reveal a trend include: prescription drugs and high-grade Marijuana.
Possession arrests for certain drugs that have remained relatively consistent from 2010 to 2015 include: Methamphetamine (mean=38.5; range=l 9-55), Cocaine HCL (mean=4.5; range=2-9), and Marijuana (mean=58.2; range=40-69). Based on possession arrests, Crack Cocaine appeared to be a non-issue from 2010 to 2013, having no possession arrest. However, in 2014, 14 persons were arrested. Interestingly no arrests for Crack Cocaine possession occurred in 2015. At this point, it is unclear whether Crack Cocaine is a problem in Grand Forks County. Similar to Crack Cocaine, pharmaceuticals did not appear to be a significant problem until 2012. Pharmaceutical possession arrests remained consistent from 2012 to 2015, with no arrests prior (mean=33.25; range=26-45). One drug that appears to be a steadily increasing problem is Heroin. Heroin possession arrests are steadily increasing, with no possession arrests occurring from 2010 to 2012, to 2 in 2013, 12 in 2014, and 19 in 2015.
Manufacturing arrests were miniscule for most drugs. Methamphetamine manufacturing arrests were exceptionally high and appear to be on the rise. Interestingly, federal charges for Methamphetamine appear to be decreasing over time and state charges fluctuate substantially (range=49-148). Pharmaceutical federal charges seem to be on the rise, although state charges do not reveal any significant trends at this time. Cocaine HCL state charges are decreasing over1ime and may be a resolving issue. Marijuana state charges decreased from 2010 to 2014 but rapidly increased in 2015, indicating this issue is still at large. MDMA/Ecstasy and Heroin state charges steadily declined from 2010 to 2014 but sharply increased in 2015. State fugitive arrests also seem to be decreasing over time but no significant trends can be established based solely on this data.
Regarding drug trafficking arrests, there does not appear to be a trend for Cocaine HCL. Trafficking arrests for Heroin may be increasing. Trafficking arrests are decreasing for Marijuana from 48 in 2010 to 11 in 2013. Trafficking arrests are decreasing for MDMA/Ecstasy from 6 in 2010 to 0 in 2015. Trafficking arrests for Methamphetamine tend to increase every three years.
This data also contains important information regarding drug arrests and crimes that do not appear to be an issue in Grand Forks County. These non-issues include: money laundering; firearm seizures; indoor grow operations; clandestine laboratory seizures; persons diverting prescription drugs; illegal pain management clinics; and, physicians dispersing prescriptions in an unethical/illegal manner. (Consider adding a paragraph here about the impact of the high profile Fentanyl cases that were prosecuted and convicted.)
Grand Forks County States Attorney
Public record reports from 2011 to September 15, 2015 relating to drug cases handled by the Grand Forks County State's Attorney's Office were provided for analysis. Table 3 (below) includes the total counts of persons accused for the most common charges.
9
rtallman
Rectangle

Table 3. Grand Forks County States Attorney's Office Reports on Drug Cases, 2011-September 15, 2015.
2011 2012 2013 2014 2015 Total Total Total Total Total
Counts Counts Counts Counts Counts Acquire Controlled Substance by Deception 11 2 3 3 I In2estin2 a Controlled Substance 66 93 91 106 35 Controlled Substance - Possession Schedule II 3 8 11 12 3 Controlled Substance - Schedule I, II, III n/a n/a n/a 13 2 Possess with Intent Controlled Substance - Possession Schedule n/a n/a I 4 3 IV Asset Forfeiture 22 31 34 38 15 Endan2erment of Child or Vulnerable Adult 4 9 6 14 2 Inhalation of Vapors 6 3 14 18 3 Drug Paraphernalia - Felony 8 7 15 30 8 Dru2 Paraphernalia - Misdemeanor 8 4 30 18 14 Drug Paraphernalia - Heroin n/a 2 n/a 8 14 Dru2 Paraphernalia - Marijuana 176 423 212 311 150 Drug Paraphernalia -Methamphetamine 29 45 75 92 34 Dru2 Paraphernalia - Oxvcodone 1 6 3 1 2 Drug Paraphernalia -Schedule I, II, II 3 7 8 3 4 Alprazolam - Possess 2 1 6 28 4 Amphetamine -Possess 6 13 n/a 2 3 Clonazepam -Possess " 5 5 15 6 .)
Cocaine -Possess 9 3 2 n/a 2 Heroin - Possess n/a 2 I 10 10 Hvdrocodone- Possess 21 22 n/a 19 6 Mari_juana - Possess > l oz 7 14 8 16 10 Marijuana -Possess >1/2oz 5 18 2 8 2 Marijuana -Possess <1/2oz 69 141 99 129 54 Methamphetamine - Possess 14 21 31 55 27 Oxycodone - Possess n/a 8 10 2 4 Synthetic Cannabinoids - Possess I 17 4 3 n/a Heroin - Possess with Intent n/a n/a n/a " 3 .)
Marijuana - Possess with Intent 7 14 3 10 4 Methamphetamine -Possess with Intent 2 5 14 11 4 Marijuana - Possess by Driver 31 105 57 88 57 Mari_juana - Deliver 2 14 1 I I Methamphetamine - Deliver 13 5 17 7 1
Note: A single person can be charged with multiple counts.
Most upward trends are evident from 2011to2014, as 2015 data is not complete (i.e. data for 2015 only included counts through September 15). Upward trends for the following charges are evident from 2011 to 2014: ingesting a controlled substance; possession of a controlled substance, schedule II; possession of a controlled substance with intent, schedule I, II, and III; possession of a controlled substance, schedule IV; asset forfeiture; endangerment of child or vulnerable adult; inhalation of vapors; drug paraphernalia, felony; drug paraphernalia, heroin; drug paraphernalia, methamphetamine; possession of alprazolam; possession of clonazepam; possession of heroin; possession of methamphetamine; and, possession of heroin with intent.
10
rtallman
Rectangle

Sharp upward trends that occurred from 2013 to 2014 included: controlled substance possession with intent, schedule I, II, III (0 to 13); controlled substance possession, schedule IV (1 to 4); endangerment of a child or vulnerable adult (6 to 14); drug paraphernalia, felony (15 to 30); drug paraphernalia, heroin (0 to 8); drug paraphernalia, methamphetamine (75 to 92); alprazolam possession (6 to 28); clonazepam possession (5 to 15); hydrocodone possession (0 to 19); methamphetamine possession (31 to 55); heroin, possession with intent (0 to 3); marijuana, possession with intent (3 to 10). Controlled substance possessions, as well as heroin possessions with intent, were non-issues prior to 2013. With this, offenses that occurred in schools were minimal prior to 2015.
Problems that seem to be decreasing, evident by declining count totals, include the following charges: acquire controlled substance by deception; drug paraphernalia, oxycodone; amphetamine possession; hydrocodone possession; cocaine possession; and marijuana, deliver. It is important to note that five-year trends cannot be fully established due to incomplete data for 2015.
Altru Health System, Emergency Department
Altru Health System provided raw data on total drug overdoses, intentional and unintentional, from 2010 to 2015 (see Table 4. Total Drug Overdoses, Intentional and Unintentional, 2010 to 2015). Additional data on intentional and unintentional overdoses was provided for 2015 (see Table 5. Intentional and Unintentional Drug Overdoses by Age and Gender, 2015).
In 2015, 226 total overdose patients were admitted to Altru Health System in Grand Forks, ND. The total number of overdose patients admitted to Altru has almost doubled since 2010: 126 overdoses in 2010. A sharp increase in the number of overdoses is evident from 2011to2012: 180 overdoses in 2011, 232 overdoses in 2012. This corresponds with the increase presence of marijuana possession, ingestion of controlled substances, GFPD drug-related arrests (documented in GFPD, GFC states attorney, ND BCI data)
Table 4. Total Drug Overdoses, Intentional and Unintentional, 2010 to 2015 2010 2011 2012 2013 2014 2015
Total overdoses, intentional and unintentional 126 180 232 227 230 226
In Table 5, a comparison of age groups by gender of overdoses occurring in 2015 reveals important trends that will inform future prevention efforts. Males aged 25 years and younger and aged 36 to 45 years overdosed more frequently than females of the same age. Conversely, females aged 26 to 35 years and 46 years and older overdosed more frequently than males of the same age. This suggests that males under 26 years of age and females over 45 years of are more likely to overdose than their respective counterparts. Table 5 also shows that, in 2015, females aged 26 to 35 were almost twice as likely to overdose as males of the same age: 22 overdoses versus 6 overdoses, respectively. This age group also represents the biggest gender gap in term of number of overdoses. In addition, alcohol emerged as a contributing factor to overdose deaths in this age group (i.e. alcohol did not contribute to overdose deaths until patients were in their 30's). Another notable trend seen in Table 5 is evident among the oldest age group. All 17 of the overdoses that occurred among persons aged 56 and older resulted from anti-depressants, and most overdoses were unintentional.
11
rtallman
Rectangle

From Table 5 healthcare providers and allied professionals can also ascertain important information related to the kinds of drugs abused in certain age groups. According to Table 5, drugs that resulted in overdoses were in greatest variety for persons aged 19 to 35 years. Just 9 different drugs and drug combinations resulted in 27 deaths among persons aged 18 years and younger, whereas 34 different drugs and drug combinations resulted in 58 overdoses among persons aged 19 to 35 years. This indicates that drug experimentation seems to occur predominantly among teenagers and young adults.
Table 5. Intentional and Unintentional Drug Overdoses by Age, Gender, and Drug, 2015 2015 Drug;
Intentional and Unintentional Overdoses by Age & Gender
152:: Male 15 n/a Female JO
5 16-18
Male 12 Heroin, synthetic marijuana + marijuana, Advil, Zanax, Dextromethorphan, Celexa, Female 7 Propranolol, LSD
5 19-25
Male 30 Cannabinoids + amphetamines + opioids, Xanax powder, Klonopin +heroin, trazodone, Female 19 Benzodiazepine, diphenhydramine, Ativan, gabapentin, oxycodone, ZQuil, Unisom,
II loratadine, heroin, methamphetamine 26-35
Male 28 *Heroin, Benzodiazepines, unknown synthetic drug, ambien, methamphetamine, Female 6 amphetamines, benadryl, trazadone, fentanyl patch, buspar, klonipin, minipress, zyprexa,
22 oxycodone, Tylenol, amitriptyline, Tylenol No. 3, doxycycline, Flagyl, Wellbutrin 36-45
Male 18 ** Ativan, Norco, benzodiazepines, cocaine, marijuana, methamphetamine, Geodon, Female 12 Lexapro, Seroquel, Gabapentin
6 46-55
Male 21 **Ritalin, Valium Female 9
12 56'.S
Male 17 ***Xanxax, tricyclic antidepressant Female 8
9 *For all drugs listed, only a few ingestions were mixed with alcohol ingestion **For all drugs listed, more occurrences of alcohol ingestion with medication ingestion ***Very few of these patients were intentional overdoses, most occurred with alcohol ingestion Note: All overdoses were coded by the ICD 9 CM as intentional, but some were unintentional (e.g. carbon monoxide poisoning).
University of North Dakota (UND)
The University of North Dakota provided self-reported student survey data on non-medical use of prescription drugs and drug use from 2010 to 2014. UND's self-report student data were compared with analyses from the American College Health Association's National College Health Assessment II (ACHA-NCHA) and the Southern Illinois University Carbondale and the CORE Institute's Drug and Alcohol Survey (referred to as the National Reference Group [NRG]). Data on synthetic drugs is from 2014
12
rtallman
Rectangle
rtallman
Rectangle
rtallman
Rectangle
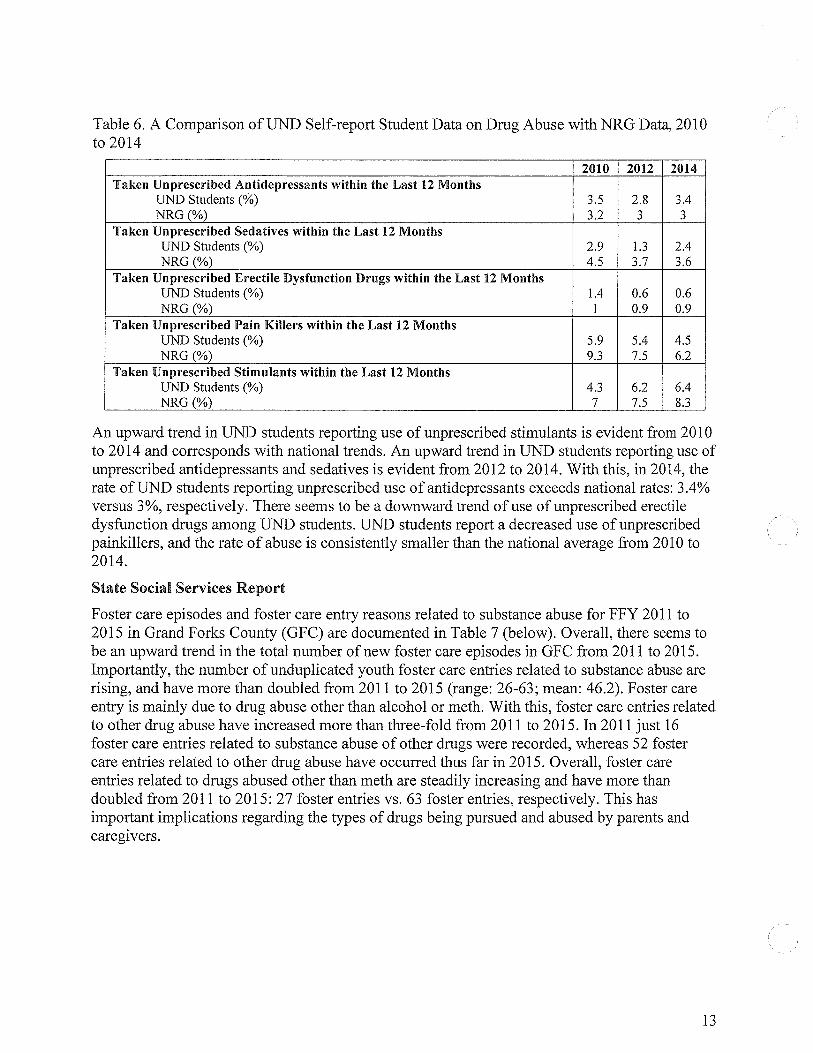
Table 6. A Comparison ofUND Self-report Student Data on Drug Abuse with NRG Data, 2010 to 2014
2010 2012 2014 Taken Unprescribed Antidepressants within the Last 12 Months
UND Students (%) 3.5 2.8 3.4 NRG(%) 3.2 3 ....
.)
Taken Unprescribed Sedatives within the Last 12 Months UND Students (%) 2.9 1.3 2.4 NRG(%) 4.5 3.7 3.6
Taken Unprescribed Erectile Dysfunction Drugs within the Last 12 Months UND Students (%) 1.4 0.6 0.6 NRG(%) 1 0.9 0.9
Taken Unprescribed Pain Killers within the Last 12 Months UND Students (%) 5.9 5.4 4.5 NRG(%) 9.3 7.5 6.2
Taken Unprescribed Stimulants within the Last 12 Months UND Students (%) 4.3 6.2 6.4 NRG(%) 7 7.5 8.3
An upward trend in UND students reporting use of unprescribed stimulants is evident from 2010 to 2014 and corresponds with national trends. An upward trend in UND students reporting use of unprescribed antidepressants and sedatives is evident from 2012 to 2014. With this, in 2014, the rate of UND students reporting unprescribed use of antidepressants exceeds national rates: 3.4% versus 3%, respectively. There seems to be a downward trend of use of unprescribed erectile dysfunction drugs among UND students. UND students report a decreased use of unprescribed painkillers, and the rate of abuse is consistently smaller than the national average from 2010 to 2014.
State Social Services Report
Foster care episodes and foster care entry reasons related to substance abuse for FFY 2011 to 2015 in Grand Forks County (GFC) are documented in Table 7 (below). Overall, there seems to be an upward trend in the total number of new foster care episodes in GFC from 2011to2015. Importantly, the number of unduplicated youth foster care entries related to substance abuse are rising, and have more than doubled from 2011 to 2015 (range: 26-63; mean: 46.2). Foster care entry is mainly due to drug abuse other than alcohol or meth. With this, foster care entries related to other drug abuse have increased more than three-fold from 2011 to 2015. In 2011just16 foster care entries related to substance abuse of other drugs were recorded, whereas 52 foster care entries related to other drug abuse have occurred thus far in 2015. Overall, foster care entries related to drugs abused other than meth are steadily increasing and have more than doubled from 2011 to 2015: 27 foster entries vs. 63 foster entries, respectively. This has important implications regarding the types of drugs being pursued and abused by parents and caregivers.
13
rtallman
Rectangle

Table 7. Foster Care Episodes & Foster Care Entry Reasons Related to Substance Abuse by FFY (October 1 - September 30)
2011 2012 2013 2014 2015 Total Number of New Foster Care Episodes in 90 102 137 135 127 GFCounty
New Episodes with Foster Care Entry Reasons Related to Substance Abuse* 27 32 61 57 63
Unduplicated #of Youth 26 30 55 57 63 Substance Abuse Foster Care Entry Reasons
Alcohol Abuse 11 11 12 8 11 Meth Abuse 0 l 6 12 0 Other Drug Abuse 16 22 47 38 52
Total Substance Abuse Related Foster Care 27 34 65 58 63 Entry Reasons**
*The number of new foster care episodes with foster care entry reasons relating to substance abuse may be larger than the unduplicated count of youth because a single youth may have more than one foster care episode during a FFY year.
**The total number of foster care entry reasons may exceed the total number of new foster care episodes related to substance abuse because a single foster care episode can have more than one foster care entry reason related to substance abuse.
North Dakota Department of Human Services: FRAME Data
In 2009, the North Dakota Department of Human Services launched a new a child welfare database, FRAME. This state database is used for all child welfare programs in North Dakota. The North Dakota Department of Human Services receives an estimated 1,000 child abuse reports each year, some of which include prenatal and child maltreatment relating to substance abuse. FRAME data provided for this report includes counts of drugs abused (excluding meth) by mothers and pregnant women in Grand Forks County from 2011to2015. Table 8 includes suspected maltreatments related to prenatal substance abuse among pregnant women in Grand Forks County. Table 9 includes the services required by Child Protective Services (CPS) for mothers at risk for substance abuse.
Table 8 (below) makes it clear that, despite some fluctuation, the total number of suspected maltreatments related to prenatal substance abuse has significantly increased from 2011to2015: 4 suspected maltreatments versus 20 suspected maltreatments, respectively. The total number of pregnant women assessments is also increasing progressively: 4 assessments in 2011 versus 16 assessments in 2015. Of the suspected maltreatments, prenatal exposure to drugs other than meth is the most common and has increased from 3 cases in 2011 to 12 cases in 2015.
Table 8. Pregnant Women Assessments by FFY (October 1 - September 30) & Suspected Maltreatments, 2011-2015
2011 2012 2013 2014 Total Number of Pre2nant Women Assessments* 4 8 10 6 Suspected Maltreatments
Prenatal exposure to alcohol 1 5 0 3 Prenatal exposure to drugs other than meth 3 6 8 3 Prenatal exposure to meth 0 2 2 0
Total Suspected Maltreatments** 4 13 10 6
2015 16
"' .)
12 5
20 *Eight records were removed from analysis due to suspected maltreatment codes not related to pregnant women assessments. Only suspected maltreatments related to prenatal substance abuse are applicable for a pregnant women assessment. **The total number of suspected maltreatments may exceed the total number of pregnant women CPS assessments because a single assessment may have more than one suspected maltreatment.
14
rtallman
Rectangle

In Table 9 (below), the total number of services required assessments has remained relatively consistent from 2011to2015 (range: 94-127; mean: 110.4). However, the total number of services required assessments with substance abuse risk factors has increased from 55 in 2011 to 78 in 2015. Substance abuse risk factors for mothers include alcohol misuse, meth use, and other drug use. The total number of mothers at risk for one or more of these factors has steadily increased from 2011 to 2015: 88 versus 150, respectively. Of the substance abuse risk factors identified from 2011 to 2015, alcohol misuse has remained fairly consistent (range: 43-67; mean: 51.6), meth use has experience a seven-fold increase (range: 5-36), and other drug use has more than doubled (range: 33-68). This finding has important implications regarding the types of drug use among mothers.
Table 9. Services Required Assessments in Grand Forks County by FFY (October 1 - September 30) & Substance Abuse Related Risk Factors, 2011-2015
2011 2012 2013 2014 2015
Total Number of Services Required Assessments 94 105 113 127 113
Services Required Assessments with Substance 55 57 79 78 78 Abuse Risk Factors
Substance Abuse Risk Factors Identified Alcohol misuse by caregiver Meth use by caregiver 50 43 67 52 46 Other drug use by caregiver 5 19 25 26 36
33 39 41 56 68 Total Substance Risk Factors* 88 92 133 134 150
*The total number of substance abuse nsk factors may exceed the total number of services reqmred CPS assessments with substance abuse nsk factors because a single assessment may have more than one substance abuse risk factor identified.
Polk County Public Health: Youth Profile
Polk County's report on substance abuse among youth and young adults was funded by the Strategic Prevention Framework State Incentive Grant (SPF SIG) and completed in March 2015. The report used multiple data sources to provide a comprehensive perspective on substance abuse among youth and young adults in Polk County. Data sources included: the 2012 Chemical Free Polk County Parent Perception Survey; key informant interviews, conducted in 2012; local law enforcement data; the 2013 Minnesota Student Survey (MMS); the Minnesota Young Adult Alcohol Survey (Y AAS); and, individual interviews with Polk County community members. The 2013 MMS contained data related to prescription and synthetic drug abuse. Significant findings from this report included the following:
"In 2013, 5.5% of 11th graders and 3% of 8th graders reported any past 30 day use of prescription drugs that were not prescribed them" (p. 6).
"In 2013, students were more likely to report (83%) were more likely to report they think people put themselves at "great" or "moderate" risk of harm if they used prescription drugs not prescribed for them compared to if they have five or more drinks of an alcoholic beverage once or twice a week (73%)" (p. 6).
"A decrease in 9th graders reporting any marijuana use in the past 30 days from 12% in 1007 to 6% in 2013" (p. 6).
"75% of Polk County students think that their peers have at least tried marijuana, in reality 88% report never using marijuana" (p. 12).
15
rtallman
Rectangle

Grand Forks County Coroner
Data from the Grand Forks County Coroner includes regional non-natural deaths from 2003 to 2015. Table 10 (see Appendix A) charts and provides count totals of non-natural deaths from UND Forensic Pathology by year from 2003 to 2014. Table 11 (see Appendix A) compares the percentage of non-natural deaths handled by UND Forensic Pathology in 2014 with the cumulative percentage of non-natural deaths handled by UND Forensic Pathology from 2003 to 2013. Table 11 accounts for the increase in cases for the office and the increase in forensic, rather than hospital, cases.
In Table 10, most counts of non-natural death cases have remained consistent, with only small increases that can be accounted for by population growth. However, non-natural death counts for three variables have sharply increased from 2010 to 2014. These variables include: firearms, motor vehicle accidents (MVAs), and drugs. Not only have these variables dramatically increased, they also appear to be increasing in synchrony: firearms, 10 deaths in 2010 vs. 45 deaths in 2014); MVAs, 16 deaths in 2010 vs. 46 deaths in 2014; and drugs, 5 deaths in 2010 vs. 51 deaths in 2014. That is, this trend suggests that MV A, firearm and drug-related non-natural deaths may be correlated.
Table 11 also exhibits this trend. In 2014, 25.25% of non-natural deaths were related to drugs, 22.28% were related to firearms, and 22.77% were related to MVAs. Together, these three variables account for more than 70% of all non-natural deaths occurring in 2014. The historical percentages for firearm, MVA, and drug-related non-natural deaths (i.e. cumulative percentage from 2003 to 2013) are 20.48%, 27.56%, and 14.53%, respectively. In addition, the percentage of firearm and drug-related non-natural deaths was higher in 2014 than it was cumulatively from 2003 to 2013.
In reviewing Table 10 and Table 11, it is clear that drug-related deaths are an increasing problem. In 2014, 51 total cases were attributed to drug-related deaths, which was the highest to date (see Table 10). According to the Grand Forks County Coroner, Dr. Mary Sens, as of September 30, 2015, 50 cases have been attributed to drug-related deaths. The total number of cases attributed to drug-related deaths in 2015 is expected to rise, as only 9 months of data has been recorded and some cases are incomplete and/or pending toxicology results.
Northeast Human Services Treatment Services
Services are provided to residents of Grand Forks, Nelson, Pembina and Walsh County seeking treatment for substance use disorder. Table 12 demonstrates the trends in the primary substance for which clients received treatment services for each calendar year 2010 through 2015. There is an upward trend in alcohol with 178 clients in 2010 and 305 clients in 2015. Alcohol treatment accounts for just over 50% of all treatment services in the five year period. Other substances that have more marked upward trends, but lower number of clients seeking treatment are: marijuana/hashish 73 in 2010 and 164 in 2015; heroin/synthetics 2 in 2010 and 33 in 2015; oxycodone 6 in 2010 and 17 in 2015; and methamphetamines 13 in 2010 and 115 in 2015. The increase in heroin treatment almost doubled from 2014 to 2015 and the increase in all opioids was three fold from 2010 to 2015.
16
rtallman
Rectangle

Table 12 Clients receiving treatment services at Northeast Human Services by Primary Drug Use 1/1/2010 through 12/31/2015
By Calendar Year
EOC Substance 1 (Primary Drug) CY CY CY CY CY CY Total 2010 2011 2012 2013 2014 2015
0201 Alcohol 178 187 197 221 245 305 1,333
0301 Cocaine-Crack 1 1 1 3 - 2 8
0302 Cocaine-Other 4 - 2 - 2 2 10
0401 Marijuana/Hashish 73 74 94 110 148 164 663
0501 Heroin-Synthetics 2 - 1 5 19 33 . 60
0703 Oxycodone 6 10 12 9 16 17 70
0705 Hydromorphone-Dilaudid - 1 3 4 - l 9
0706 Other Opiates or Synthetic l 3 l 2 2
,., 12 .J
0708 Hydrocodone-Vicodin 2 7 - 4 13 7 33
0709 Tramadol-Ultram - - - 2 2
0713 Other Narcotic Analgesics - l 1 1 3
0714 Morphine Sulfate-MSContin - - - 1 2 3
l 001 Methamphetamine 13 11 20 32 83 115 274
1101 Amphetamine 2 2
1103 Methylenedioxymethamphetam - I - - 1
1109 Other Amphetamines I - 1 3 5
1201 Other Stimulants 2 - 1 1 4
1202 Methylphenidate-Ritalin - I I
1301 Alprazolam-Xanax - 1 2 1 4
17
rtallman
Rectangle

1304 Diazepam-Valium I I 2
1306 Lorezepam-Ativan 1 1
1308 Other Benzodiazepines 1 1
1310 Clonazepam-Klonopin,Rivotr - 1 1
1605 Other Sedatives 1 I
1701 Aerosols - I I
1703 Other Inhalants 1 I
1809 Other Over the Counter - - - 1 1
1811 Dextromethorphan(DSM) 1 2 1 4
2002 Other Drug 1 - 1 2
286 298 337 391 541 659 2,512
LIMITATIONS
This report has certain limitations. This report is focused exclusively on assessing the magnitude of the prescription and synthetic drug abuse problem in Grand Forks County and the surrounding community. Findings and recommendations are not generalizable or externally valid. Instead, this work may serve as a template for other communities facing similar problems. Data analyzed in this survey were collected using various methods and have been documented and stored in different systems. This complicates the comparison of datasets. Stronger results could be produced if data were collected using similar methods and stored in a collaborative database.
This study's use of multiple local datasets designed to be representative of the Grand Forks County and surrounding population serves as a major strength. This enhanced internal validity. In addition, most data is longitudinal and represents prescription and synthetic drug-related problems over a period of time. Therefore, temporality and causal inference can be established.
DISCUSSION & RECCOMMENDATIONS
This section introduces new strategies for addressing the epidemic of prescription and synthetic drug abuse, and reviews current remediation strategies. A multifaceted public health approach that utilizes primary, secondary, and tertiary prevention strategies are required to effectively address this problem and build healthier communities. Therefore, policies and interventions focus on prevention, early intervention, and ensuring access to effective treatment.
18
rtallman
Rectangle

Current Remediation Strategies
Grand Forks Public Safety Answering Point
The Grand Forks Public Safety Answering Point (PSAP) reports that calls to their center through 91 lsystems have increased in the past five years. Although data is not available to determine how many calls are prescription drug abuse related, dispatchers report intense calls from bystanders of victims suffering from overdoses. PSAP reports require a complex response from personnel, who must simultaneously dispatch medical assistance and law enforcement while also directing CPR efforts by telephone in the midst of an emotionally charged situation.
Provider Education Legislation
Ensuring that healthcare providers are fully educated about the harms and risks associated with prescribing certain drugs should result in decreased cases of prescription drug abuse and misuse, addiction, and overdose. Several states have passed legislation mandating that providers receive prescriber education (Kolodny et al., 2015). In addition, the U.S. Food and Drug Administration (FDA) requires that manufacturers of certain drugs (i.e. opioids) sponsor educational programs for prescribers (Kolodny et al., 2015). Introducing legislation requiring that all prescribers receive accurate education regarding the risks and harms associated with certain drugs should be considered in the state of North Dakota. Altru Health System has been proactive in this regard providing prescriber education in all primary care settings within the service area and requiring compliance with guidelines for opioid prescribing.
Emergency Department Prescription Guidelines
In 2013, the New York City Department of Health and Mental Hygiene released emergency room prescription guidelines for certain drugs (i.e. opioids ). Their implementation of these guidelines had several positive impacts, such as addiction prevention and improved prescriber education. Introducing guidelines for controlled substances and other prescription drugs that are considered highly addictive should be incorporated in Grand Forks and Polk County's hospital systems. These guidelines may include calls for substitutions, avoiding and/or limiting use of ce11ain drugs, limiting supply of certain drugs for discharged patients. Incorporating these guidelines should produce important benefits, including: addiction prevention, improved prescriber education, and decreased overdose (Kolodny et al., 2015).
Harm-reduction Approaches
Harm-reduction is a tertiary prevention strategy that aims to improve health outcomes and reduce overdose deaths (Kolodny et al., 2015). Harm-reduction strategies, such as safe injection sites, are designed as safe havens for drug abusers where healthcare professionals can work with abusers to identify risk-reduction approaches and negotiate treatment options. Harm-reduction strategies (e.g. safe injection sites) foster an environment of comfort and trust where individuals are free to address addiction on their terms. The establishment of a non-judgment zone is an essential component of harm-reduction programs as it allows for relationship building with staff and gives addicts a taste of dignity that can inspire self-care.
Up to this point, harm-reduction strategies have predominantly been explored with opioid addicts who are injection drug users. An abundance of research has investigated harm-reduction strategies among this subgroup. Contrary to popular belief, these programs have produced undisputable successes. Evidence suggests that harm-reduction strategies offer important benefits for healthcare providers, addicts, and family members of addicts (Kolodny et al., 2015). Some
19
rtallman
Rectangle

benefits of harm-reduction strategies include: reduction of disease spread (i.e. HIV and hepatitis C) among addicts; provision of a safe haven for addicts; treatment intervention opportunities for healthcare providers; education and overdose safety training for addicts and their family members (Kolodny et al., 2015). Harm-reduction strategies have only just begun to demonstrate their capacity to effectively and innovatively approach the "war on drugs." Based on their success, it is suggested that harm-reduction programs be expanded to serve multiple purposes and include a larger target population.
The incorporation of a comprehensive harm-reduction program in Grand Forks and Polk Counties can produce important secondary and tertiary prevention benefits. It is suggests that the development of this program be coupled with the development of a detox facility. A program such as this should be designed to serve multiple purposes for drug addicts and their families. Facility and program components should include the following: a safe injection site; staff healthcare professionals, especially addiction counselors and treatment specialists; provision of naloxone, an opioid overdose antidote, to injection addicts; provision of CPR and first aid training, including naloxone education and training; collaboration with healthcare facilities and treatment centers to develop educational materials and coordinate care for addicts seeking treatment. Housing a harm-reduction facility in the Grand Forks-Polk County area produce numerous benefits, the most important of which would be proactive prevention of overdoses and disease spread that ultimately results in a healthier community.
PDMP Legislation
PDMPs have important capabilities for healthcare providers, law enforcement and the public alike. However, these programs are often underutilized, especially by providers. To increase provider utilization, policy-makers and state legislatures of North Dakota and Minnesota should pass legislation mandating that providers check the PDMP before prescribing controlled substances (e.g. opioids). This legislation will result in increased use of PD MPs, decreased prescription of controlled substances, and reduced prescription drug abuse and doctor shopping.
Initiation of a Community Education Forum
The initiation of a community education forum in the Grand Forks-Polk County area is recommended. This was not feasible until now, as efforts would not have been data driven or evidence based. The Grand Forks and Polk County area is prepared to initiate an educational endeavor that is broader than what is currently available in the school systems. This effort must be highly organized and well planned in order to be effective.
Implementing a comprehensive community education forum may be an optimal prevention tactic. The aims of this work would be three-fold: 1) to increase knowledge and awareness of prescription and synthetic drug abuse through community educational programming; 2) to develop new tactics to educate and assist the target population; and, 3) to reduce prescription and synthetic drug-related problems in the community. To achieve this, it is recommended that two supporting entities be established: 1) a statewide Prescription and Synthetic Drug Abuse Education Advisory Committee, tasked with the development and integration of educational programs on prescription and synthetic drugs for North Dakotans; and, 2) a local Prescription and Synthetic Drug Abuse Education Advisory Committee, tasked with the development of additional, locally relevant prescription and synthetic drug education programs for their communities.
20
rtallman
Rectangle
Both Committees will be required to collaborate with local or state health departments, health care providers, and other relevant community-based entities to develop program materials that accurately communicate prescription and synthetic drug information. Committees will serve as the primary resources for information on prescription and synthetic drug abuse and may be responsible for the following tasks: developing and distributing marketing materials; referring clients to appropriate providers; staying cunent with prescription and synthetic drug legislation; and collecting data on program effectiveness.
Longitudinal Data Collection & Database
In looking at the data in this report, it is clear that prescription and synthetic drug abuse-related problems are continuously evolving. Therefore, it is recommended that data relating to this problem be continuously surveyed. This report may serve as a template for ongoing and future assessment efforts. In addition, it is the hope that this report provides a framework for state-level efforts, specifically pertaining to the establishment of a state drug surveillance database.
The development of a database supporting collaborative activities aimed at addressing the prescription and synthetic drug abuse problem in the area and in the state is recommended. This database tool would streamline work and more efficiently and effectively address drug-related problems.
Medication Assisted Treatment (MAT)
Medication-assisted treatment (MAT), including opioid treatment programs (OTP's), combines behavioral therapy and medications to treat substance use disorders. MAT has been mentioned among committee members as an effective intervention for the treatment of opioid dependence however, few providers of MAT exist in North Dakota and at the time of this report, it is not known if any health care providers offer this in private practice in the four county region of Northeast North Dakota and Polk County. Without MAT available, it is not likely that long term recovery will be possible for some people abusing opioids. The Substance Abuse and Mental Health Services Administration (SAMHSA) has information regarding certification for the programs, training materials, legislation, regulations and guidelines for both MAT and OTP' s.
CONCLUSION
The increased prevalence of prescription and synthetic drug abuse has had widespread, negative impacts on northeastern North Dakota communities and Polk County Minnesota This epidemic will persist unless appropriate, locally relevant policies and interventions are implemented. This report sounds the alarm to prompt efforts for change. State and community responses must be collective and multifaceted to comprehensively address the problem. Enlisting the expertise of healthcare professionals, healthcare insurers, state agencies, law enforcement, and prevention, treatment and educational entities for the development of an action plan is advisable. This collaborative approach should address initiatives in key areas that include: public awareness, healthcare provider education, treatment, and improved data systems for monitoring illicit drug abuse in North Dakota. Through these avenues, we can effectively address the issue of prescription and synthetic drug abuse and continue to build healthier communities.
21
rtallman
Rectangle

THANKS & ACKNOWLEDGEMENTS
Thank you to the following persons for their contributions and service on the data sub-committee and for this report:
Sarah Reese and Sue Thompson, Polk County Public Health
Steve Gilpin, Drug Task Force, North Dakota Bureau of Criminal Investigation
David Jones, Grand Forks County States Attorney
Terri Lynn Graham, Altru Hospital Emergency Department
Cindy Czapiewski, Altru Hospital
Mike Ferguson, Grand Forks Police Department
Mary Ann Sens, Grand Forks County Coroner
BJ Mason, Grand Forks Sheriff's Office
Jane Croeker, University of North Dakota
Sarah Schimek, Grand Forks Public Schools
Deb Davis, Northeast Human Services
Ed Christ, Grand Forks County Social Services
Leanne Johnson, North Dakota Department of Human Services
Debbie Swanson, Grand Forks Public Health Department
22
rtallman
Rectangle

REFERENCES (
[SAMHSA], S. A. a. M. H. S. A. (2014). SAMHSA Opioid Overdose Prevention ToolKit. Retrieved from http://store.samhsa.gov/shin/content//SMA14-4742/0verdose Toolkit.pdf
Abuse, N. I. o. D. (2015). Prescription Drugs & Cold Medicines. The Science of Drug Abuse & Addiction. Retrieved from http://www.drugabuse.gov/drugs-abuse/prescription-drugscold-medicines
Atlas, U. F. E. (2015). Food Access. Retrieved from http://-vvww.ers.usda.gov/dataproducts/food-environment-atlas.aspx
Bureau, U. S. C. (2014). QuickFacts Retrieved from http://quickfacts.census.gov/qfd/index.html. from U.S. Census Bureau http://quickfacts.census.gov/qfd/index.html
Clinic, M. (2015). Prescription Drug Abuse. Disease and Conditions. Retrieved from http ://www.mavoclinic.org/diseases-conditions/prescription-drugabuse/basics/definition/con-200324 71
Dart, R. C., Bronstein, A. C., Spyker, D. A., Cantilena, L. R., Seifert, S. A., Heard, S. E., & Krenzelok, E. P. (2015). Poisoning in the United States: 2012 emergency medicine report of the national poison data system. Ann Emerg Med, 65(4), 416-422. doi: 10.l 016/j.annemergmed.2014.11.001
Foundation, T. H.J. K. F. (2015). State Health Facts. Retrieved from http://kff.org/statedata/ Health, N. Y. S. D. o. (n.d.). Synthetic Drug Frequently Asked Questions. Retrieved from
https://www.health.ny.gov/professionals/narcotic/ docs/synthetic drugs fag .pdf Institute, D. (2011-2013). The Dartmouth Atlas of Health Care. Data by Region. Retrieved from
http://www.dartmouthatlas.org ( Institute, U. o. W. P.H. (2014). County Health Rankings. Retrieved from
http://www.countyhealthrankings.org Kolodny, A., Courtwright, D. T., Hwang, C. S., Kreiner, P., Eadie, J. L., Clark, T. W., &
Alexander, G. C. (2015). The prescription opioid and heroin crisis: a public health approach to an epidemic of addiction. Annu Rev Public Health, 36, 559-574. doi: 1O.l146/annurev-publhealth-031914-122957
McHugh, R. K., Nielsen, S., & Weiss, R. D. (2015). Prescription drug abuse: from epidemiology to public policy. J Subst Abuse Treat, 48(1), 1-7. doi:l0.1016/j.jsat.2014.08.004
Meyers, K., Kaynak, 0., Bresani, E., Curtis, B., McNamara, A., Brownfield, K., & Kirby, K. C. (2015). The availability and depiction of synthetic cathinones (bath salts) on the Internet: Do online suppliers employ features to maximize purchases? Int J Drug Policy, 26(7), 670-674. doi: 10.1016/j .drugpo.2015.01.012
Orsolini, L., Francesconi, G., Papanti, D., Giorgetti, A., & Schifano, F. (2015). Profiling online recreational/prescription drugs' customers and overview of drug vending virtual marketplaces. Hum Psychopharmacol, 30(4), 302-318. doi:l0.1002/hup.2466
Pharmacy, N. D. B. o. (2016). Prescription Drug Monitoring Program:. Prescription Drug Monitoring Program. Retrieved from https: //www.nodakpharmacy.com/PDMP~
description.asp Policy, 0. o. N. D. C. (n.d.). Synthetic Drugs (a.k.a. K2, Spice, Bath Salts, etc.). Retrieved from
https ://www. whi tehouse. gov I ondcp/ ondcp-fact-sheets/ synthetic-drugs-k2-spice-bath-salts Services, U.S. D. o. H. a. H. (2011 -2013). Area Health Resource File. Retrieved from
http://ahrf.hrsa.gov
23
rtallman
Rectangle

APPENDIX A
Table 10. Non-natural Deaths from UND Forensic Pathology by year from 2003 to 2014.
Non-Natural Deaths 60
50
40
30
20
( 10
0 2003 2004 2005 2006 2007 2008 2009
-.-Airp lane 0 0 1 0 0 0 0 1 0 0 0 1
-+-Asphyxia: Mechanical 0 0 0 2 0 0 0 0 1 3 4 7
Asphyxia: Choking/airway 1 0 1 0 1 1 0 0 0 0 0 4
Blunt 0 0 0 0 2 0 1 3 2 1 2 1
-.-co Exposure 0 3 3 2 1 0 0 0 0 1 3 8
-+- Drowning 0 0 0 2 1 1 7 1 1 8 5
-+- Drug 1 0 3 2 6 6 10 5 10 14 21 51
-+-Elect rocution 0 0 0 0 0 0 0 0 1 0 0
-+-Ethanol 0 0 0 3 0 0 1 0 1 1 0 i
-+- Fall 1 l 2 4 2 0 3 2 2 4 7 12
-+- Fire 1 0 0 3 0 5 1 3 2 5 4 1
-.-Firearm 8 3 6 4 9 3 5 10 11 23 28 45
Hanging 3 1 1 4 3 5 2 4 5 6 13 16
Hypothermia 0 0 2 1 3 0 1 0 0 6 3
MVA 6 1.3 10 11 6 11 6 16 12 28 29 46
Other poison 0 , 0 0 1 0 1 1 1 1 0 0 i
-.- sharp force 0 0 0 2 1 0 0 1 0 2 3 1
TBI, Remote 0 1 0 1 0 0 0 1 0 0 2 0
24
rtallman
Rectangle
rtallman
Rectangle

Table 11. A Comparison of the Percentage of Non-natural Deaths in 2014 with the Cumulative Percentage of Non-natural Deaths from 2003 to 2013, Cases Handled by UND Forensic Pathology
NON-NATURAi. CAUSES OF DEATH
• Historic% (2003- ';§2. 0 ~
2013) -::?. iii 0 ;:-.: l.J~
N
• 2014% " ? ::R -::?. l1"l 0
0 ...... N -§1:; t; O N !:;I. N
~ N
0
E-z w u 0:: ';§2. w
~~ 0..
~ t--N
.,]\
~ ';§2. ro .
';§2. I'-::R ~
0
II ::R 0 i:--. _o ';§2. ffe c:.' 0 ~ ';§2.
';§2. ~ ::R ·~ L'l 0 0 t'P- ';§2. ~ ';§2. ::R 0 t& ~ ~
II "1' 0
0 ';§2. '° . ..,;.t"l ~ ~~ 0 (~ 0
0 b' IX?..,., ·.;o;
ll fi 11; .a- (. 0
'Zf:> ~ l"-<-::i ~ '"b ,..,;o ~ ·.-a. C"lfl II
t---1 ....:Y! u~ .... :e ~ '::0
0::) :. 1: '"l,-,
11 .~ ~~
~':t-..i l':) (,:) . c-..i 0 -- ·- - • l.U ..... > I- w (.!) (.!) z ..... ..... LU ~ (.!) CZ: CZ: z LU LU
z CZ: <( z a: z ~ 0 0 ..... a: z - > 0 u I-c:r a: ::2: 0 <( u .. s ~ ~ - a: z u::: - ~ Ill 0:: ..... ..... Ill z I- c:r ... c:r (.!) 0:: 0 ~ c.. z c:r a: cc 0 s 0
~ LU z 0 .....
cC ::c 0:: LU LU Cl: >< < Cl. u c:r :x: c..
:I: 0 I- u::: o. a: c:r u > ........ >< IX
0 LU :c I- a: a: . :c (.!) LU a: 0 LU 0 LU c( -c.. 2 0 I- c.. :I: :I:
cc ::§! Ill - u u > I- Ill
. I-c:r::.:: LU :I: 0
cC 0 ..... ::c: LU
>< u > :I: c.. <I'>
<
(
(
25
rtallman
Rectangle