
PREPA’s integrated resource plan suffers from the...
21
Transcript of PREPA’s integrated resource plan suffers from the...


PREPA’s integrated resource plan suffers from the fundamental flaw that it does not explore the
possibility of a future in which the island is not primarily dependent on imported fuels. The only
futures contemplated are those in which at least half a billion dollars is transferred out of the
island every year to pay for fossil fuels. Certainly, a plan to “do nothing” and stick with the status
quo is not wise, but neither is a plan to invest over a billion dollars in infrastructure to move the
island from reliance on one fossil fuel to another. PREPA’s most recent modeling exercise,
submitted on April 26, 2016, confirms that the benefits of its plan are largely dependent on a
differential in fuel prices between natural gas and fuel oil. When that differential narrows, as it
has recently, the benefit of PREPA’s plan including constructing the Aguirre Offshore Gas Port
largely evaporates. This fact should be extremely concerning to the Commission. We
appreciate the urgency that the parties may feel and the need to “do something”, but
investing huge amounts of money into infrastructure that makes Puerto Rico reliant on natural
gas and from which Puerto Rico cannot extricate itself should that reliance turn out to be a bad
bet is not the solution.
We would like to see the Commission direct PREPA to engage in a stakeholder-based process
with the goal of producing a plan that provides flexibility in the face of uncertainty about key
assumptions such as fuel prices and future demand; takes into account rate impacts; and
leverages cost-effective, less risky resources like renewables, energy efficiency, and demand
response.
Given the absence of such a plan in the current IRP, these comments focus on flaws in the
Company’s current modeling such as risks overlooked and resources inappropriately modeled.
Our comments address what we see as the major deficiencies in PREPA’s IRP modeling,
including
a. a lack of modeling integrated supply and demand-side resources;
b. the failure to consider a lower load forecast sensitivity;
c. the unnecessarily high reserve margin that results in an overbuilding of thermal
generation;
d. capital cost assumptions which favor thermal generation;
e. the failure to adequately consider renewable resources; and
f. the unrealistic assessment of the costs and risks of AOGP.

If PREPA had conducted meaningful IRP modeling, all generation resources – including supply
side and demand side resources – would have been treated on a consistent and integrated
basis as resources that can be used to meet electricity demand. Different resources –
conventional generation, energy efficiency, demand response and renewables – would have
been assigned a cost and a generation expansion model run to find the portfolio of resources
that meets projected demand at the lowest system cost, subject to whatever constraints are
externally imposed on the system (such as constraints of capital availability, for example). This
was not done in this case. Instead, PREPA pre-selected generation expansion plans, layered a
fixed amount of energy efficiency on top of them and then added varying amounts of
renewable energy generation. Even in scenarios in which PREPA included higher amounts of
renewable energy to achieve full compliance with the RPS, these additions were not
accompanied by any reduction in the buildout of central station generation. Thus, there was no
attempt to determine how much renewables, energy efficiency and demand response could
be added, with a reduced amount of central station generation, to meet projected load at the
lowest system cost.
Because of this failure to integrate supply-side and demand-side resources, both PREPA’s
August and Supplemental March IRPs are largely focused on changes or additions to its central
station fleet. More distributed resources including wind, solar, demand response, and energy
efficiency, to the extent they were included, generally have little influence on the treatment of
the central station generators.
This presents a missed opportunity for PREPA. It consigns Puerto Rico to indefinite reliance on
imported fuels and their associated risks simply because the alternative was not considered.
A scenario that relies on fossil fuel-free resource additions rather than investment in central
station generators requires more creativity and effort to model than was required by PREPA’s
methodology, but cannot be dismissed out of hand as unachievable or uneconomic. The high
cost of supplying electricity in Puerto Rico and uncertain economic growth and population
should make PREPA wary of pursuing large-scale capital projects with unguaranteed costs and
benefits. Rather PREPA should be pursuing a portfolio of resources that reduces reliance on
imported fuel, allows flexibility of build-out, and leverages innovative solutions on both the
demand and supply-sides.

PREPA’s IRP understates the risks to ratepayers from its assumed load forecast.
PREPA based its IRP modeling on only one load forecast and did not present any lower load
forecast sensitivity. As shown in the following graph, PREPA’s actual sales declined 15% from
2007 to 2014, a result of the economic crisis and loss of population. Yet PREPA’s projected load
forecast shows load remaining approximately flat from 2016 through 2035.1 The discrepancy
between the clear downward trend in sales over the last decade and the flat sales projection is
not addressed in the IRP.
Figure 1. Actual and Projected Sales by PREPA, 1994 – 2035.
According to PREPA’s “Demand Forecasts Methodology” document, the independent
variables used in the regression analysis to forecast energy consumption for 2015-2019 for
residential, commercial and industrial customers were GDP and GNP, electricity cost,
disposable personal income and prior year’s consumption. The analysis does not include
population as an independent variable, which may account for the counterintuitive results of
the regression analysis. While PREPA acknowledges that population is likely to continue to
decline, the economic variables (GDP, GNP, disposable personal income) are all forecasted to
increase. This despite the fact that, for example, Puerto Rico’s GDP has steadily declined since
2007.2 And the Census Bureau’s most recent estimate of Puerto Rico’s population puts it at
3,474,1823 - close to the 2025 estimate given in PREPA’s August IRP.4
1 The load forecast presented in the figure is the “original” sales forecast (i.e. the sales forecast prior to subtracting energy
efficiency) presented in Table 3-2 of PREPA’s Supplemental IRP. 2 GNP in constant dollars from http://www.gdb-pur.com/economy/statistical-appendix.html, versus Table 1-4 of Volume III of the
August IRP. 3 Annual Estimates of the Resident Population: April 1, 2010 to July 1, 2015
Source: U.S. Census Bureau, Population Division Release Dates: For the United States, regions, divisions, states, and Puerto Rico Commonwealth, December 2015.
4 See Table 1-6 of Volume III.
0
5,000
10,000
15,000
20,000
25,000
199
4
199
6
199
8
200
0
200
2
200
4
200
6
200
8
201
0
201
2
201
4
201
6
201
8
202
0
202
2
202
4
202
6
202
8
203
0
203
2
203
4
Sa
les
(G
Wh
)
Historic Sales PREPA sales forecast

For modeling purposes, the above forecast of energy sales must be converted into a forecast of
electricity to be generated by PREPA’s plants by adding technical and non-technical losses.
PREPA assumes these technical and non-technical losses are constant through the forecast
period, meaning that generation is approximately 20% higher than sales for the entire forecast
period. Non-technical losses are assumed to be constant at 7% of sales, or more than 1,100
GWh per year. We know of no other U.S. utility that experiences that level of “non-technical”
losses; in fact, “unbilled” or “unaccounted for” energy is generally so trivial that it is not
separately estimated. At the April 6, 2016 technical conference, PREPA representatives stated
that they are aggressively trying to reduce non-technical losses. It would have been reasonable
to consider a scenario in which PREPA is successful in reducing its non-technical losses to a lower
level.
The fact that PREPA’s load forecast departs markedly from the last decade of historical data,
relies on a limited set of explanatory variables and does not include any of PREPA’s attempts to
reduce non-technical losses, suggest that a lower load forecast would have been more
realistic.
PREPA argued during the technical conference that it was not necessary to run a sensitivity
analysis with a lower load forecast because the energy efficiency scenario used in its
Supplemental IRP sufficiently models the impacts of lower load. Energy efficiency should not be
seen as a substitute for an accurate load forecast. PREPA should aim to obtain cost-effective
energy efficiency resources in any scenario, regardless of the levels of forecasted loads. If the
load forecast turns out to be lower than PREPA anticipates, that does not mean that PREPA
should not continue to procure cost-effective energy efficiency. In developing an IRP, PREPA
should consider the possibility that the level of energy efficiency considered in the supplemental
IRP could be obtained on top of a lower load forecast.
Thus, PREPA’s IRP does not provide any modeling of the optimum generation buildout, including
cost-effective energy efficiency, to meet a lower load forecast.
By failing to model a lower demand forecast sensitivity, PREPA’s IRP does not fully explore the risk
to ratepayers of overbuilding its system. Under PREPA’s preferred buildout plan, if the load
forecast does not materialize, the costs of underutilized capacity must still be recovered from
ratepayers. PREPA’s preferred plan lacks flexibility because it appears that it must immediately
make financial commitments totaling more than $1.5 billion in order to meet its timeline (Figure 2
below). That figure includes transmission, AOGP, and central station generator costs. PREPA’s
ratepayers are on the hook for this investment even if the load to support it does not materialize
as forecasted.
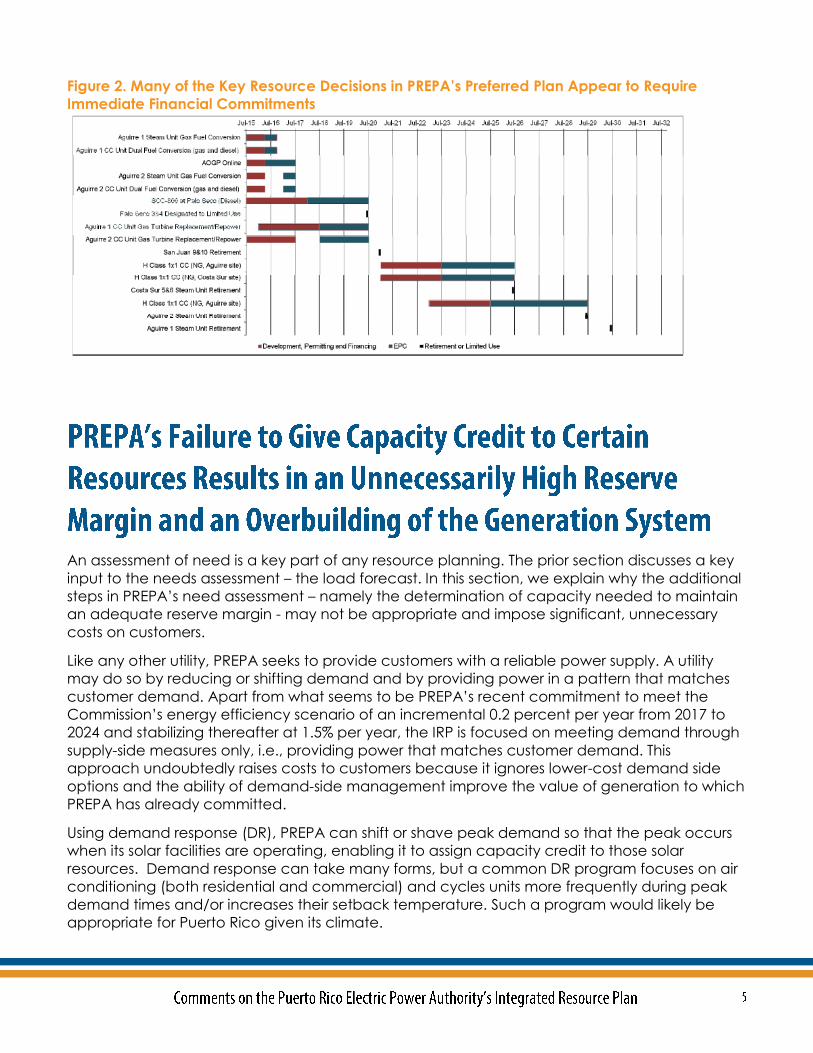
Figure 2. Many of the Key Resource Decisions in PREPA’s Preferred Plan Appear to Require
Immediate Financial Commitments
An assessment of need is a key part of any resource planning. The prior section discusses a key
input to the needs assessment – the load forecast. In this section, we explain why the additional
steps in PREPA’s need assessment – namely the determination of capacity needed to maintain
an adequate reserve margin - may not be appropriate and impose significant, unnecessary
costs on customers.
Like any other utility, PREPA seeks to provide customers with a reliable power supply. A utility
may do so by reducing or shifting demand and by providing power in a pattern that matches
customer demand. Apart from what seems to be PREPA’s recent commitment to meet the
Commission’s energy efficiency scenario of an incremental 0.2 percent per year from 2017 to
2024 and stabilizing thereafter at 1.5% per year, the IRP is focused on meeting demand through
supply-side measures only, i.e., providing power that matches customer demand. This
approach undoubtedly raises costs to customers because it ignores lower-cost demand side
options and the ability of demand-side management improve the value of generation to which
PREPA has already committed.
Using demand response (DR), PREPA can shift or shave peak demand so that the peak occurs
when its solar facilities are operating, enabling it to assign capacity credit to those solar
resources. Demand response can take many forms, but a common DR program focuses on air
conditioning (both residential and commercial) and cycles units more frequently during peak
demand times and/or increases their setback temperature. Such a program would likely be
appropriate for Puerto Rico given its climate.
Demand response can also take the place of “steel in the ground”, a scenario that PREPA
never discusses. In fact, PREPA’s analysis of demand response seems entirely focused on
demand response’s ability to avoid curtailment of renewables. It dismisses demand response
out of hand as uneconomic because, PREPA contends, demand response’s cost would have to
be combined with high cost PV generation, making both more expensive than a combined
cycle unit. However, there is no reason that demand response must be paired with any
resource; instead, it should be evaluated on its own merits for its ability to compete with any
supply or demand side resource.
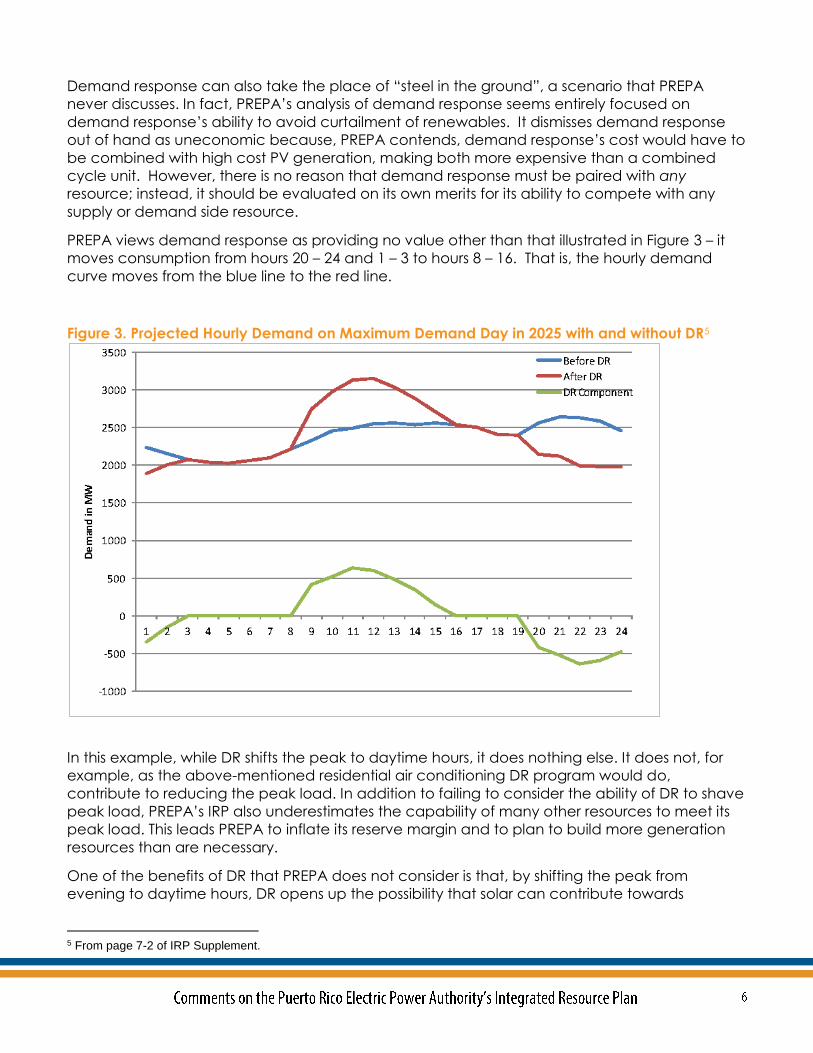
PREPA views demand response as providing no value other than that illustrated in Figure 3 – it
moves consumption from hours 20 – 24 and 1 – 3 to hours 8 – 16. That is, the hourly demand
curve moves from the blue line to the red line.
Figure 3. Projected Hourly Demand on Maximum Demand Day in 2025 with and without DR5
In this example, while DR shifts the peak to daytime hours, it does nothing else. It does not, for
example, as the above-mentioned residential air conditioning DR program would do,
contribute to reducing the peak load. In addition to failing to consider the ability of DR to shave
peak load, PREPA’s IRP also underestimates the capability of many other resources to meet its
peak load. This leads PREPA to inflate its reserve margin and to plan to build more generation
resources than are necessary.
One of the benefits of DR that PREPA does not consider is that, by shifting the peak from
evening to daytime hours, DR opens up the possibility that solar can contribute towards
5 From page 7-2 of IRP Supplement.

meeting the peak system demand. PREPA’s IRP currently does not give any “capacity credit”6
to its solar generators. It also, inexplicably, does not give credit to wind or landfill gas plants. This
leaves new thermal generation as the only resource that can be built to fill any identified
capacity need.
PREPA’s need is also inflated by the assumption that hundreds of megawatts worth of its existing
generators provide no capacity credit despite the fact that they provide energy. And several
of PREPA’s units are accredited at a capacity much lower than their nameplate capacity either
for reasons that are unknown or because of extremely high forced outage rates. Inexplicably,
PREPA never analyzes the possibility of improving its fleet forced outage rates, which could be
much more cost-effective than building new capacity.
While PREPA provides an estimate of reserve margins in its Supplemental IRP, e.g. Figure 8-1, it’s
our understanding that those graphs demonstrate a reserve margin metric that is essentially
meaningless because they are based on the installed capacity of PREPA’s units. Rather,
something PREPA terms “firm capacity” was used as the benchmark to determine whether a
portfolio had sufficient capacity resources to meet a 25 – 30 percent reserve margin
requirement. It is the firm capacity metric that ignores renewables and existing peaking
capacity.
In order to demonstrate how much of a difference alternative assumptions about the capacity
credit of renewables and existing peaking resources and the peak capacity value of demand
response makes, we’ve attempted to rework PREPA’s firm capacity estimates using new
assumptions. Because we do not have access to the same data that PREPA does, our
assumptions cannot be definitive, but rather are indicative of how the firm capacity
contribution of each resource might be more fairly treated. Table 1, below, describes the
assumptions we made with respect to demand response, solar, wind, landfill gas, hydro, and
certain existing thermal generators.
6 Capacity credit is generally assigned to generators in accordance with the probability of their producing energy (in the case of
renewables) or being available to produce energy (in the case of thermal power plants) at the time of system peak demand. In effect, the purpose of evaluating generators from the perspective of their “accredited capacity” rather than installed capacity is to assess how reliably those generators can meet peak needs.

Table 1. Description of Firm Capacity Contribution Assumptions in Figure 4
Resource “Firm” Capacity Contribution Assumption
Demand Response (DR)
About 200 MW of DR is necessary to shift nighttime load such
that the peak is now during the day. Less would be necessary if
DR also “shaved” the peak.
Solar7
If total solar installed capacity remains below 20 percent of
thermal generation capacity then solar’s firm capacity
contribution is 50 percent, otherwise it is 7 percent.
Wind
Wind’s firm capacity contribution is 8 percent of installed
capacity.
Landfill Gas
Landfill gas’ firm capacity contribution is 90 percent of installed
capacity.
Hydro
Hydro’s firm capacity contribution is 90 percent of installed
capacity.
Gas Turbines
Rather than contributing no firm capacity, their outage rate is
assumed to be 50 percent so 50 percent of installed capacity is
considered “firm.”
Cambalache Turbines
Rather than contributing no firm capacity, their capacity
contribution is consistent with the Mayaguez units at 79
percent.
All Other Resources
Consistent with PREPA assumptions.
Under the assumptions outlined in Table 1, PREPA does not need to add as much new thermal
generating capacity as it claims. In fact, with the assumptions in Table 1, the generation
capacity buildout envisioned in PREPA’s preferred scenario, P3MF1M, will result in significantly
overbuilding the generation system.
7 The accredited capacity value of solar is assumed to decrease at high penetration levels, though there is no consensus as to
what constitutes a “high” level. Based on work by the Lawrence Berkeley National Lab and current accredited values in the Midcontinent Independent System Operator (MISO), we picked the values in Table 1.

Figure 4. By Leveraging Existing Resources and Adding in Demand Response, PREPA would
Need Far Fewer New Resources to Meet its Peak Needs.8
As Figure 4 demonstrates, accounting for the ability of existing resources to meet peak needs
implies that PREPA’s preferred plan will result in far more capacity than is necessary. PREPA
could greatly reduce the level of thermal generation necessary to meet the peak. If fewer
thermal generators are built or repowered, then less capital investment is also needed. Figure 4
has some conservatism built into it in that it does not account for all 2,100 MW of potential
renewables, since those renewables are also not part of PREPA’s modeling.9 And it does not
account for the possibility that energy efficiency could also shift peak needs to the daytime or
that demand response could shave as well as shift the peak from the nighttime.
8 The PREPA estimate of firm capacity was developed using a spreadsheet provided in response to the Commission’s 3rd Requirement of Information with modifications for the changes in timing and capacity envisioned under the P3MF1M plan. This was done since the yearly firm capacity estimates were not provided by PREPA in its Supplemental IRP. 9 See Supplemental IRP at 5-5.
0
1000
2000
3000
4000
5000
6000
Cap
ac
ity (
MW
)
Realistic Estimate of Firm Capacity
PREPA Estimate of Firm Capacity
Capacity Needed to Meet Reserve Margin

PREPA’s modeling relies heavily on a buildout of central station thermal generation to meet its
projected load and reserve margin. PREPA appears to have underestimated the cost for these
new generators. Table 2 shows the per kW assumptions made for the new CC and repowering
options.
Table 2. Repower and New CC Options Included in P3MF1M and P3MF2M
Repower & New CC
Configurations Fuel
Unit
Capacity
(MW per
unit)
Heat Rate
(Btu/kWh
HHV)
Capital Costs
($2015/KW)
Aguirre CC 1 & 2 Gas Turbine
Replacement/Repower
Natural Gas 263 7,582 703
Diesel 255 7,368 726
F Class CC (GE S107F.05) (Duct
Fired)
Natural Gas 369 7,310 1,001
Diesel 359 7,065 1,030
H Class CC (Siemens SCC6-
8000H) (Duct Fired)
Natural Gas 393 6,979 1,011
Diesel 342 7,361 1,163
There are few estimates to compare against the Aguirre CC 1 & 2 repowering costs because
project-specific proposals are often trade-secret and they also depend on how much of the
existing infrastructure can be used. Data to compare against new F Class and H Class CCs is
more widely available. For example, Lazard, which produces yearly estimates of the cost of
energy from a variety of resources, estimates a 558 MW combined cycle will cost $1,006 per kW.
This figure is generally consistent with generic CC estimates we’ve seen in other IRPs. PREPA’s
cost estimates then, would seem to ignore the 16 percent premium on construction costs in
Puerto Rico10 and the higher per kilowatt cost associated with building these smaller units. (It is
worth noting that both of these factors – the construction cost premium and the diseconomies
of building smaller units – were included when modeling the cost of renewable energy).
Underestimating central station generator costs biases PREPA’s analysis in favor of its preferred
thermal generation buildout, as opposed to greater reliance on renewables and demand-side
resources.
10 See page 6-3 of the Supplemental IRP.
PREPA’s modeling treats renewables as essentially an afterthought. The modeling runs that
have incorporated higher levels of renewables simply include those renewables on top of the
thermal generators, rather than as a substitute for them. In fact, PREPA claims that full RPS
compliance “requires [the] three new H class 1x1 CCs to be built on an accelerated schedule in
parallel”.11 PREPA ignores the possibility of using demand-side management strategies such as
demand response to incorporate those renewables or energy storage technology including
batteries. Despite this flaw, which tends to artificially increase the cost of higher levels of
renewables, PREPA’s run that includes the greatest amount of renewables (i.e. full compliance
with the RPS), P3MF1M_S5, is still only $251 million or 1 percent more expensive that PREPA’s
preferred scenario.
PREPA’s main argument against renewables is that additional renewable energy would result in
an unacceptable level of curtailment (because PREPA’s system peaks in the evening and,
according to PREPA, there must be enough thermal generation capacity to meet this evening
peak). PREPA does not consider any new additions of wind energy, even though wind is
available during evening hours. And as we just discussed, PREPA writes off demand response as
too expensive and serving no use except to limit curtailment.
PREPA also does not consider any additions of energy storage, even though energy storage will
be built in other, lower cost jurisdictions in mainland12 U.S. PREPA has provided no compelling
evidence demonstrating that the technology cannot be economically deployed in Puerto Rico
as well. In the one instance we are aware of in which PREPA examined battery storage costs,
they relied upon a 2008 paper despite the fact that battery prices have declined significantly in
the last eight years.13 It is worth noting that Kauai Island Utility Cooperative in Hawaii recently
signed a contract for a combined PV (17 MW DC) and battery (13 MW AC) system with a fixed
price of $145 per MWh.14
The technical conference revealed that all the renewables PREPA may be obligated to take
are not included in its modeling. It appears that 1,056 MW of renewables, listed in Table 5-6 of
the Supplemental IRP, are included, but a total of approximately 1600 MW is contracted and a
further 600 MW is governed by master agreements.15 While it is unfortunate, indeed, that these
contracts were signed for at above market prices,16 if they must be taken then they ought to be
included in the modeling so that the uncontracted-for resources can be developed around this
11 Page 2-2 of Supplemental IRP. 12 For example, SCE awarded contracts to 260 MW worth of energy storage projects in a 2014 solicitation for capacity
resources. See https://www.sce.com/wps/portal/home/procurement/solicitation/lcr/!ut/p/b1/hc_BCoJAEAbgZ-nQMXdsw7TbWouORFYG6V5CwzbB3DBLevss7BJlc5vh-4cZIkhIRBHfMhlXmSri_NkLY-fhjOnOaIi-rXNgAZoz7nIIfKMBUQPgRzH4l98S0UWmc6MFuukwFwNAGM8tQHu55tbGouaYtsBygLueD-hsVhSQrmARMEYB3hs6jvSIkLlKXg9HrEioKYko00NapqV2LZvxsarOl0kf-lDXtSaVknmq7dXpW-CoLhUJP9z5FEKGA5Hc694DHo9VOA!!/dl4/d5/L2dBISEvZ0FBIS9nQSEh/
13 See for example: Bellero, Lauren. “Moody’s: Batteries could soon become ‘economically viable’ for energy use.” 25
September 2015, SNL Financial, available at: https://www.snl.com/InteractiveX/article.aspx?ID=33984003&KPLT=4 14 Bandyk, Matthew. “Kauai battery project to deliver solar energy to co-op’s customers after sunset.” 30 March 2016, SNL
Financial. 15 According to page 5-5 of the Supplemental IRP, existing contracts, PPOAs and Master Agreements total 2,1601. MW of
renewable capacity. 16 It’s not clear why this might be the case, although we would note that these contracts do not seem to be the result of a
competitive Request for Proposals (RFP) process since one has not been conducted by PREPA since at least January 1, 2009 (see response to ELAC Request No. 10).
portfolio. It doesn’t make sense to pretend they don’t exist and develop a thermal generator
portfolio that ignores them. These additional renewables make it even more critical that more
creative methods for integrating renewables, apart from gas CCs, be seriously explored and
considered; otherwise curtailment charges across all portfolios will be underestimated.
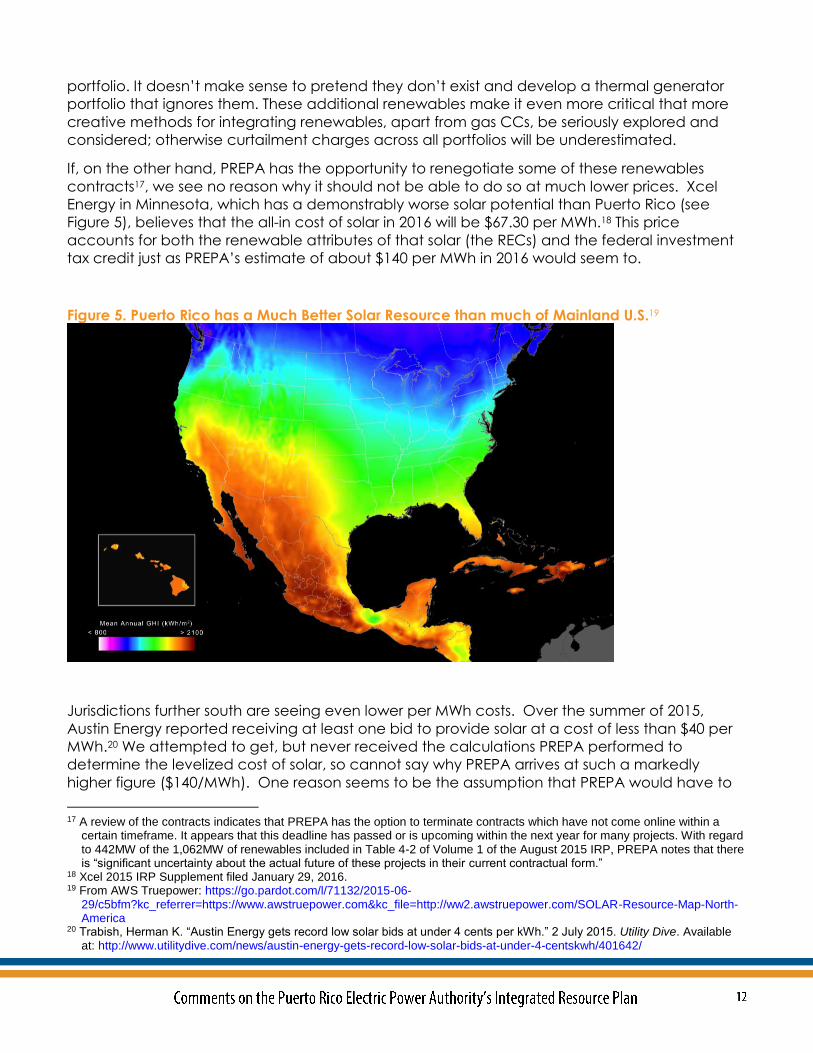
If, on the other hand, PREPA has the opportunity to renegotiate some of these renewables
contracts17, we see no reason why it should not be able to do so at much lower prices. Xcel
Energy in Minnesota, which has a demonstrably worse solar potential than Puerto Rico (see
Figure 5), believes that the all-in cost of solar in 2016 will be $67.30 per MWh.18 This price
accounts for both the renewable attributes of that solar (the RECs) and the federal investment
tax credit just as PREPA’s estimate of about $140 per MWh in 2016 would seem to.
Figure 5. Puerto Rico has a Much Better Solar Resource than much of Mainland U.S.19
Jurisdictions further south are seeing even lower per MWh costs. Over the summer of 2015,
Austin Energy reported receiving at least one bid to provide solar at a cost of less than $40 per
MWh.20 We attempted to get, but never received the calculations PREPA performed to
determine the levelized cost of solar, so cannot say why PREPA arrives at such a markedly
higher figure ($140/MWh). One reason seems to be the assumption that PREPA would have to
17 A review of the contracts indicates that PREPA has the option to terminate contracts which have not come online within a
certain timeframe. It appears that this deadline has passed or is upcoming within the next year for many projects. With regard to 442MW of the 1,062MW of renewables included in Table 4-2 of Volume 1 of the August 2015 IRP, PREPA notes that there is “significant uncertainty about the actual future of these projects in their current contractual form.”
18 Xcel 2015 IRP Supplement filed January 29, 2016. 19 From AWS Truepower: https://go.pardot.com/l/71132/2015-06-
29/c5bfm?kc_referrer=https://www.awstruepower.com&kc_file=http://ww2.awstruepower.com/SOLAR-Resource-Map-North-America
20 Trabish, Herman K. “Austin Energy gets record low solar bids at under 4 cents per kWh.” 2 July 2015. Utility Dive. Available at: http://www.utilitydive.com/news/austin-energy-gets-record-low-solar-bids-at-under-4-centskwh/401642/

pay an additional $30 per MWh in order to also receive the renewable attributes of the solar.
Perhaps if it purchased RECs alone rather than in combination with energy, this might be the
case, but an additional charge at that level ($30 per MWh) is not consistent with the experience
of other U.S. utilities of which we are aware. We know many, perhaps all, of PREPA’s recently
executed renewables contracts include a provision to pay for RECs at a cost of $30 per MWh,
but again, this is not typical for utility-scale renewables contracts executed with other utilities of
which we are aware.
It is also possible that PREPA’s capital cost figures for solar are already out of date. While the
NREL report PREPA references was published in September 2015, the prices are linked to systems
installed in the first quarter of 2015 that presumably would have locked in equipment prices in
2014 or even earlier.
Renewables have the added benefit of having no fuel price volatility risk. Whether PREPA
continues to burn large quantities of natural or diesel fuel, it cannot guarantee that its
customers would not have to bear further rate increases due to higher fuel costs. Because
renewables are “fuel-free” this risk is entirely removed.
In summary, a build-out strategy centered around renewables provides an enormous risk
reduction benefit to PREPA and its ratepayers. There is great uncertainty around Puerto Rico’s
economic future and its population and thus great uncertainty in PREPA’s load forecast. Once
PREPA’s thermal fleet is built, those costs will have to be borne by customers regardless of
whether population continues to decline. The fewer customers, the higher the charge that will
be assessed on its remaining customers. While the same would be true of any renewables that
are built, their smaller MW size compared to the proposed thermal fleet greatly reduces the
resulting rate shock compared to a thermal generator. Additionally, the smaller size of
renewable units means that there is more flexibility in building out the generation system in an
incremental manner, and fewer renewables can be built if load does not materialize as
forecast.
As discussed previously, most of PREPA’s modeling for its August 2015 IRP is focused on different
combinations of central station generators. The Company’s preferred plan in the August 2015
IRP is known as “P3F1” and includes construction of the Aguirre Offshore Gas Port (AOGP) by
mid-2017, allowing a transition of much of PREPA’s fleet to natural gas. A similar, but alternative
plan, “P3F2” does not include AOGP.21 Generally, the generator replacement and repowering
options included in this plan rely on light diesel as the fuel source. In its August 2015 modeling,
PREPA estimated the present value of total system cost22 of P3F1 at $26.842 billion and P3F2 at
$29.301 billion, a difference of 9 percent. These totals are calculated over a “planning period”
21 PREPA presented modified versions of these plans, P3MF1M and P3MF2M in its Supplemental IRP, but we did not have
access to the annual cost data for these plans to perform a similar analysis though we would expect similar magnitudes of differences, if not the same absolute difference between plans.
22 Present value is a measure of cost that takes into account the “time value of money.” Future expenditures are discounted in PREPA’s model by its chosen “discount rate” – 6.86%.

of 2016 – 2035. However, as shown in Figure 6, below, the benefit of P3F1 does not immediately
accumulate to ratepayers and is weighted towards the latter half of the planning period.
Figure 6. Most of the “Benefit” of PREPA’s Preferred Plan including AOGP (P3F1) Over a Similar
Plan without AOGP (P3F2) Occurs Late in the Planning Period23
Because events further in the future are more difficult to predict, there is a risk that these
assumed future benefits of P3F1 relative to P3F2 will not materialize.
The main projected benefit of P3F1 seems to be a reduction in fuel cost as shown in Figure 7.
23 Based on worksheet provided in response to the Commission’s 3rd Request to PREPA.
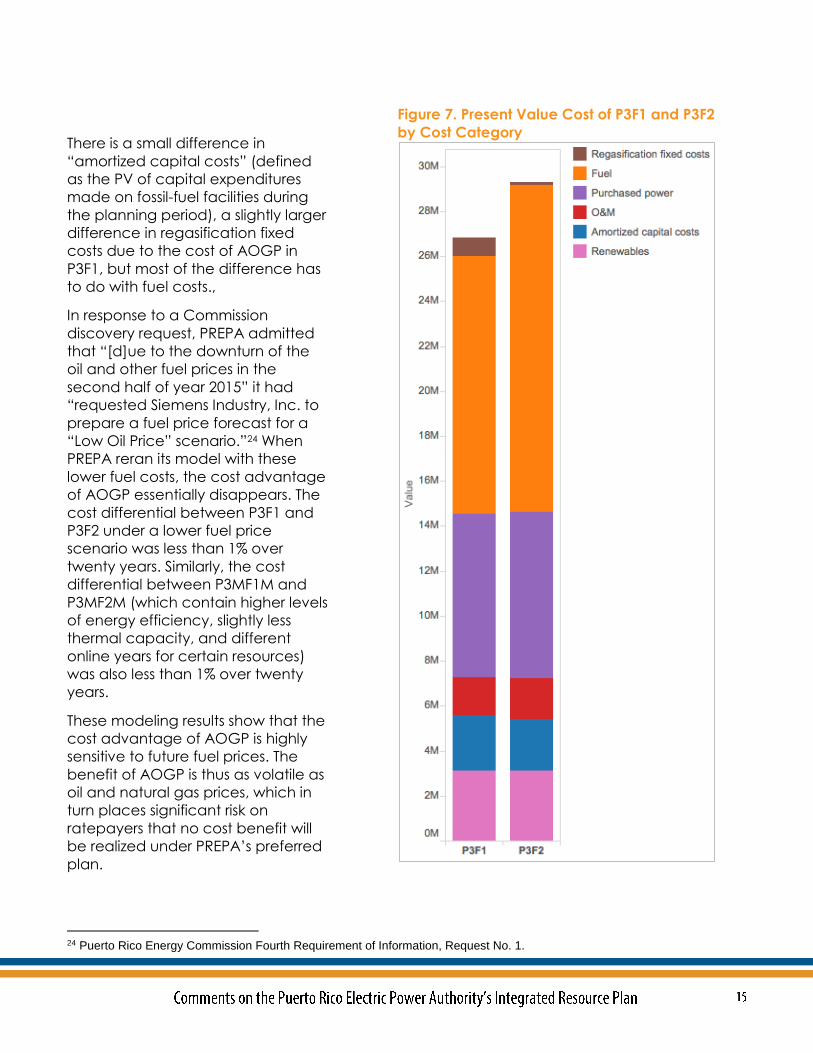
There is a small difference in
“amortized capital costs” (defined
as the PV of capital expenditures
made on fossil-fuel facilities during
the planning period), a slightly larger
difference in regasification fixed
costs due to the cost of AOGP in
P3F1, but most of the difference has
to do with fuel costs.,
In response to a Commission
discovery request, PREPA admitted
that “[d]ue to the downturn of the
oil and other fuel prices in the
second half of year 2015” it had
“requested Siemens Industry, Inc. to
prepare a fuel price forecast for a
“Low Oil Price” scenario.”24 When
PREPA reran its model with these
lower fuel costs, the cost advantage
of AOGP essentially disappears. The
cost differential between P3F1 and
P3F2 under a lower fuel price
scenario was less than 1% over
twenty years. Similarly, the cost
differential between P3MF1M and
P3MF2M (which contain higher levels
of energy efficiency, slightly less
thermal capacity, and different
online years for certain resources)
was also less than 1% over twenty
years.
These modeling results show that the
cost advantage of AOGP is highly
sensitive to future fuel prices. The
benefit of AOGP is thus as volatile as
oil and natural gas prices, which in
turn places significant risk on
ratepayers that no cost benefit will
be realized under PREPA’s preferred
plan.
24 Puerto Rico Energy Commission Fourth Requirement of Information, Request No. 1.
Figure 7. Present Value Cost of P3F1 and P3F2
by Cost Category

During the technical conference held on April 6, 2016, PREPA seemed to express a belief that
AOGP was cost-effective for ratepayers regardless of what the future might hold. This is at odds
with the fact that its own modeling identified a specific, not infinite, cost differential between
portfolios with and without AOGP and ignores the uncertainty of that benefit due to fuel price
uncertainty.
PREPA’s attitude that AOGP will be cost-effective no matter what the cost suggests that PREPA
will fall victim to many of the problems that cause large infrastructure projects to be overtime
and over budget. As described by Flyberg et al in a 2009 paper, large infrastructure projects
often start late, come in over budget, and perform below expectations:25
There are some phenomena that have no cultural bounds such as maternal love and a
healthy fear of large predators. We can add to this list the fact that, across the globe,
large infrastructure projects almost invariably arrive late, over-budget, and fail to perform
up to expectations. Cost overruns and benefit shortfalls of 50 percent are common; cost
overruns above 100 percent are not uncommon. For example, in one study of major
projects in 20 countries, nine out of ten projects had cost overruns. Similarly, a study of 44
urban rail projects—in North America, Europe, and developing nations, including
London’s Tube and the metros in Washington, D.C., and Mexico City—found that the
average construction cost overrun in constant prices was 45 percent; for a quarter of the
projects, cost overruns were at least 60 percent. In addition, passenger ridership was, on
average, 50 percent lower than forecast. Furthermore, for a quarter of the projects,
ridership was at least 70 percent lower than estimated. An appropriate slogan seems to
be “over budget, over time, over and over again.” As comforting as it is to know that we
are not alone in our folly, it would be even better to minimize the gap between
expectations and performance for projects that consume such a large share of the
private and, especially, public purse.
Executives typically attribute project underperformance to numerous uncertainties such
as project complexity, technological uncertainty, demand uncertainty, lack of scope
clarity, unexpected geological features, and negative plurality (i.e., opposing
stakeholder voices). No doubt, all of these factors at one time or another contribute to
cost overruns, benefit shortfalls, and time delays. The goal of this article, however, is not
to explain, for example, how to implement complex projects more efficiently by over-
coming these uncertainties. Rather, we explain why costs, benefits, and time forecasts for
more complex projects are systematically over-optimistic in the planning phase in
comparison to less-complex projects. In other words, “why do project planners, on
average, fail to anticipate the greater costs of complex projects or those based on new
technologies?”
The underlying reasons for all forecasting errors can usefully be grouped into three
categories: delusions or honest mistakes; deceptions or strategic manipulation of
information or processes; or bad luck. Bad luck or the unfortunate resolution of one of the
major project uncertainties is the attribution typically given by management for a poor
25 Flyvbjerg, Bent and Garbuio, Massimo and Lovallo, Dan, Delusion and Deception in Large Infrastructure Projects: Two
Models for Explaining and Preventing Executive Disaster (February 2009). California Management Review, vol. 51, no. 2, pp. 170-193. Available at SSRN: http://ssrn.com/abstract=2229781

outcome. While not denying such a salient explanation, this article explores the
underlying psychological and governance reasons for mis-estimation rather than
proximate engineering causes.
Deliberately or not, risks of scope changes, high complexity, and unexpected geological
features are systematically underestimated during project preparation. Both delusion
and deception see the high failure rates for ventures as a consequence of flawed
decision making. According to the first explanation—delusion—the flaw consists in
executives falling victim to what psychologists call the planning fallacy. In its grip,
managers make decisions based on delusional optimism rather than on a rational
weighting of gains, losses, and probabilities. They overestimate benefits and
underestimate costs and time. They involuntarily spin scenarios of success and overlook
the potential for mistakes and miscalculations. As a result, managers pursue initiatives
that are unlikely to come in on budget or on time, or to ever deliver the expected
returns. These biases are often the result of the inside view in forecasting: decision makers
have a strong tendency to consider problems as unique and thus focus on the
particulars of the case at hand when generating solutions. Adopting an outside view of
the problem has been shown to mitigate delusion. It is applied by ignoring the specific
details of the project at hand and uses a broad reference class of similar projects to
forecast outcomes for the current project.
According to the second explanation—deception—decision making is flawed by
strategic misrepresentation or the presence of what economists refer to as principal-
agent problems. Whereas the first explanation is psychological, the second is due to the
different preferences and incentives of the actors in the system. In this situation,
politicians, planners, or project champions deliberately and strategically overestimate
benefits and underestimate costs in order to increase the likelihood that their projects,
and not their competition’s, gain approval and funding. These actors purposely spin
scenarios of success and gloss over the potential for failure. This results in managers
promoting ventures that are unlikely to come in on budget or on time, or to deliver the
promised benefits. However, this misrepresentation and failure can be moderated by
measures that enhance transparency, provide accountability, and align incentives.
[More specifically], those measures are: private financiers should participate, without a
sovereign guarantee, for at least one third of the total capital needs; financial and non-
financial rewards for planners who proposed realistic estimates; strict forecasts audit;
criminal penalties for purposely misleading forecasts; place financial responsibility with
bidders [i.e. the EPC contractor for Aguirre]; and place financial responsibility with
contractors for delays and scope increases.
PREPA performed no sensitivity analysis in which AOGP came online at a later date and/or with
a higher cost. This despite the fact that it only has 14 months in which to construct and bring
online the project in order to meet its July 2017 date – which is itself another delay from the mid-
2014 in-service date projected in 2013.26 And in 2014, PREPA estimated AOGP would have $66
million in fixed operating expenses. It now says the cost will be $77 million a year.
The $385 million capital cost estimate is exclusive of financing costs, other than those incurred
during construction, which also poses risk in that it is not clear at what terms AOGP could be
26 See http://www.platts.com/im.platts.content/productsservices/conferenceandevents/2013/pc302/presentations/mike_trammel.pdf

financed. PREPA’s discount rate, equal to its weighted average cost of capital, is assumed to
be 6.86 percent and is based on the assumption that “PREPA is able to resolve its current
financial issues, and can borrow the capital required to finance cost-effective capacity at 9
percent nominal rate.” A December 2015 agreement with Assured Guaranty is presumably the
mechanism by which “PREPA is able to resolve its current financial issues” and borrow capital at
reasonable rates, meaning that the assumed 6.86 percent rate is also in limbo. Part of the
agreement required PREPA to file a petition to create a customer fee that would help repay
PREPA’s debt, and approval of that petition is pending before the Commission.

PREPA’s preferred generation portfolio imposes significant risks on PREPA ratepayers:
The risk to ratepayers of paying for stranded, underutilized generation capacity. The
combination of PREPA’s optimistic load forecast and PREPA’s unnecessarily high reserve
margin mean that the generation system will almost certainly be overbuilt under PREPA’s
preferred plan.
The risk that the cost savings from switching to natural gas will not justify the high capital
costs of the AOGP project.
The risk that the AOGP project will be delayed and come in significantly over budget.
By failing to treat renewable energy, energy efficiency and demand response on a consistent
and integrated basis with conventional generation, both in terms of modeling and in terms of
capital cost assumptions, PREPA has underestimated the benefits to ratepayers of greater
reliance on renewable and demand-side resources. Specifically, PREPA’s IRP does not consider:
The enhanced flexibility of relying on these resources in a situation of highly uncertain
future load.
The reduced volatility of fossil fuel prices to be passed through to ratepayers and
reduced risk of rate shock.
The economic development benefits for the island of greatly reducing the at least half a
billion dollars a year that would be spent outside the island to pay for imported fuel.
We recommend that the Commission reject PREPA’s IRP and ask it to initiate a stakeholder
based process27 that would develop a vision and a plan for electricity supply in the
Commonwealth that is more robust, flexible, sensitive to rates, and less risky.
27 The Department of Energy’s Energy Transition Initiative provides one possible framework, the Islands Playbook, under which
such a plan could be developed. See http://www.eere.energy.gov/islandsplaybook/ for more detail. The framework has been used successfully on other Caribbean islands such as the U.S. Virgin Islands.

The Institute for Energy Economics and Financial Analysis (IEEFA) conducts research and
analyses on financial and economic issues related to energy and the environment. The
Institute’s mission is to accelerate the transition to a diverse, sustainable and profitable energy
economy and to reduce dependence on coal and other non-renewable energy resources.
More can be found at www.ieefa.org.
. For over ten years, she has provided
technical assistance and expert witness testimony to clients working on a variety of electric
utility issues. Her recent work has focused on utility resource planning, power plant in-service
requirements, and energy efficiency planning.
Ms. Sommer holds a BS in Economics and Environmental Studies from Tufts University and an MS
in Energy and Resources from UC Berkeley.
is an independent West Virginia-based consultant focusing on
energy efficiency and utility regulation. She has testified on multiple occasions before the West
Virginia Public Service Commission for the nonprofit coalition Energy Efficient West Virginia. She
has done graduate work for the Energy and Resources Group at the University of California-
Berkeley and is a former senior research associate at Lawrence Berkeley National Laboratory.
Kunkel has an undergraduate degree in physics from Princeton University and graduate degree
in physics from Cambridge University.