Prepared under NREL Task #VTP2.6407 NREL FY14 … Agreement: # 22252 Office of Vehicle Technologies...
65
NREL is a national laboratory of the U.S. Department of Energy, Office of Energy Efficiency and Renewable Energy, operated by the Alliance for Sustainable Energy, LLC. FY14 Milestone: Simulated Impacts of Life-Like Fast Charging on BEV Batteries Prepared under NREL Task #VTP2.6407 NREL FY14 Vehicle Technologies AOP WBS: 1.1.2.400 DOE Agreement: #22252 Office of Vehicle Technologies U.S. Department of Energy Jeremy Neubauer, Eric Wood, Evan Burton, Kandler Smith, and Ahmad Pesaran Transportation and Hydrogen Systems Center National Renewable Energy Laboratory September 2014 NREL/MP-5400-63386
Transcript of Prepared under NREL Task #VTP2.6407 NREL FY14 … Agreement: # 22252 Office of Vehicle Technologies...
NREL is a national laboratory of the U.S. Department of Energy, Office of Energy Efficiency and Renewable Energy, operated by the Alliance for Sustainable Energy, LLC.
FY14 Milestone: Simulated Impacts of Life-Like Fast Charging on BEV Batteries
Prepared under NREL Task #VTP2.6407 NREL FY14 Vehicle Technologies AOP
WBS: 1.1.2.400 DOE Agreement: #22252
Office of Vehicle Technologies U.S. Department of Energy
Jeremy Neubauer, Eric Wood, Evan Burton, Kandler Smith, and Ahmad Pesaran Transportation and Hydrogen Systems Center National Renewable Energy Laboratory September 2014
NREL/MP-5400-63386
2
Motivation & Objective
• Motivation: Deployment of fast charging networks could significantly improve the utility of BEVs, but the impact of fast charging on batteries is not well understood under real-world conditions.
• Objective: Assess the impact of realistic fast charging scenarios on battery response, including thermal and degradation effects.

3
Outline
• Capabilities Added in FY14 o Cell-level evaluation of electrical, thermal, and life models o Rerouting travel data to include stops at fast charge stations
• Baseline Simulations
o Vehicle Specs, drive profile and infrastructure availability assumptions o Compare simulated fast charger utilization with real-world data
• Fast Charge Impact Analysis
o Evaluate impact of fast charging on battery packs under three thermal management scenarios
o Consider cell heterogeneity in hot climate subject to fast charging o A closer look at how fast charging impacts max battery temperatures
• Summary

Capabilities added in FY14 Cell-level evaluation of battery electrical, thermal, and life models
5
Multi-cell pack modeling
• Motivation: Availability of fast chargers can result in much longer sequences of back-to-back drive-charge-drive events. This is expected to create greater heat generation, thermal gradients, and peak temperatures within the pack. Thermal gradients can lead to heterogeneous degradation of cells within a pack, and thereby lower available capacity and battery lifetime.
• Objective: Add the ability to simulate individual cells within the BLAST-V software package, creating a more accurate depiction of peak battery temperatures and degradation under aggressive fast charge conditions than would otherwise be possible.
• Approach: o Divide previously “lumped” battery mode into flexible electrical and thermal subsets o Include ability to randomize initial conditions of SOC, capacity and resistance values o Simulate temperature, voltage, and SOC for each individual cell o Calculate degradation for each individual cell
• March 2014 Milestone: Complete addition of multi-cell code

6
BLAST-V • Battery Lifetime Analysis and Simulation Tool for Vehicles • Objective: Perform accurate techno-economic assessments of HEV, PHEV,
and BEV technologies and operational strategies to optimize consumer cost-benefit ratios, petroleum use reductions, and emissions savings
7
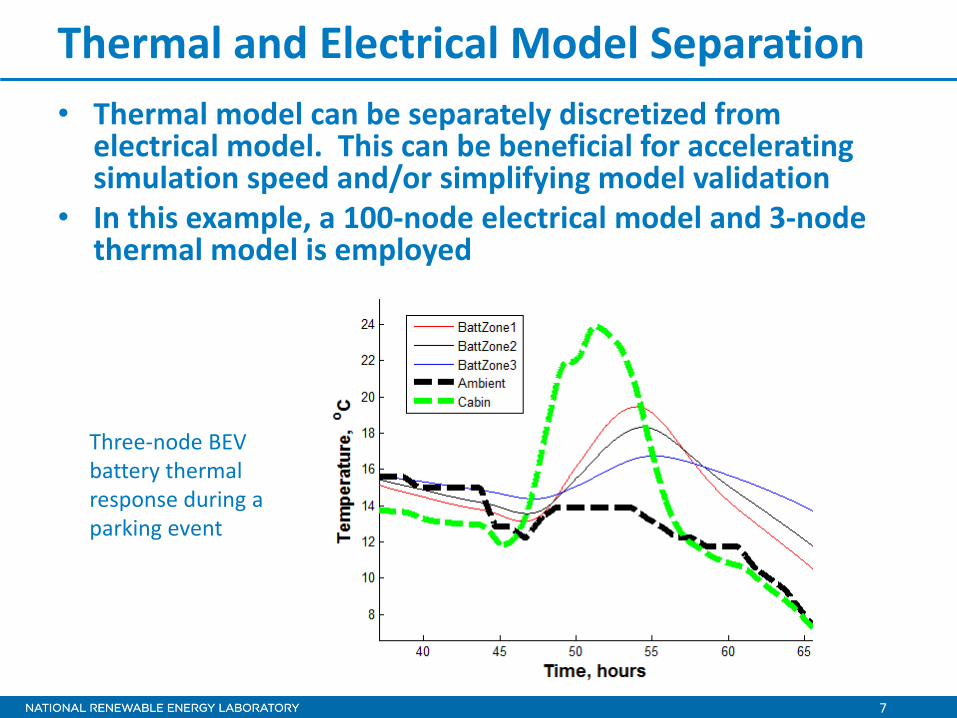
Thermal and Electrical Model Separation • Thermal model can be separately discretized from
electrical model. This can be beneficial for accelerating simulation speed and/or simplifying model validation
• In this example, a 100-node electrical model and 3-node thermal model is employed
Three-node BEV battery thermal response during a parking event
8
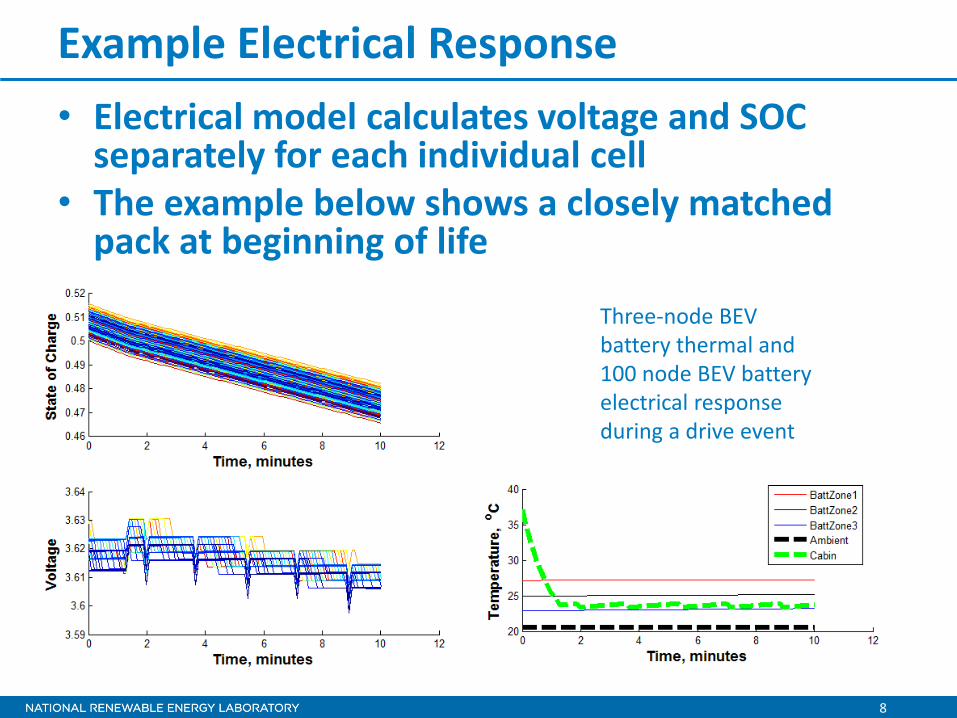
Example Electrical Response • Electrical model calculates voltage and SOC
separately for each individual cell • The example below shows a closely matched
pack at beginning of life
Three-node BEV battery thermal and 100 node BEV battery electrical response during a drive event
9
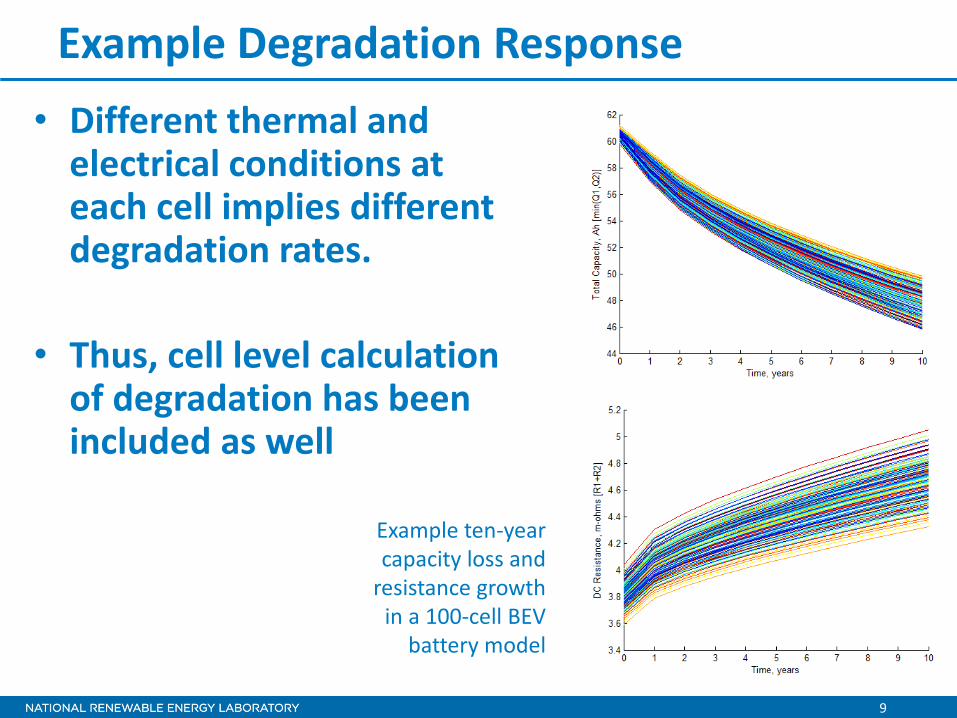
Example Degradation Response • Different thermal and
electrical conditions at each cell implies different degradation rates.
• Thus, cell level calculation of degradation has been included as well
Example ten-year capacity loss and
resistance growth in a 100-cell BEV
battery model

10
Example Fast Charge (50kW)
• Simulated pack electrical and thermal response to FC event at beginning of life o Good charge acceptance behavior
with taper not occurring until ~90% SOC
o Significant heat generation with thermal model predicting 13°C increase over 16-minute charge
Single Cell Model

11
Example Fast Charge (50kW) • Single and multi-cell models contrasted
o Multi-cell pack power capability limited by weakest cell o Power tapering occurs slightly earlier in fast charge event o Predicted max temperature is notably higher
Single Cell Model Multi Cell Model

12
Example Fast Charge
100-cell electrical model
3-node lumped thermal model
Capabilities added in FY14 Rerouting travel data to include stops at fast charge stations

14
Tour Planning in BLAST
BLAST estimates BEV utility by making a go/no-go decision before each tour (sequence of trips beginning and ending at home) A reduced-order electrical model of the battery is used to estimate SOC at the end of each trip in the proposed tour based on initial state of the vehicle, anticipated road and cabin loads, and available charging infrastructure If estimated SOC is determined to dip below a pre-defined driver tolerance at any point during the tour, the driver elects not to take their BEV on said tour If estimated SOC stays above tolerance, driver elects to take BEV and high-resolution simulation of battery electrical, thermal, and life behavior is conducted
15
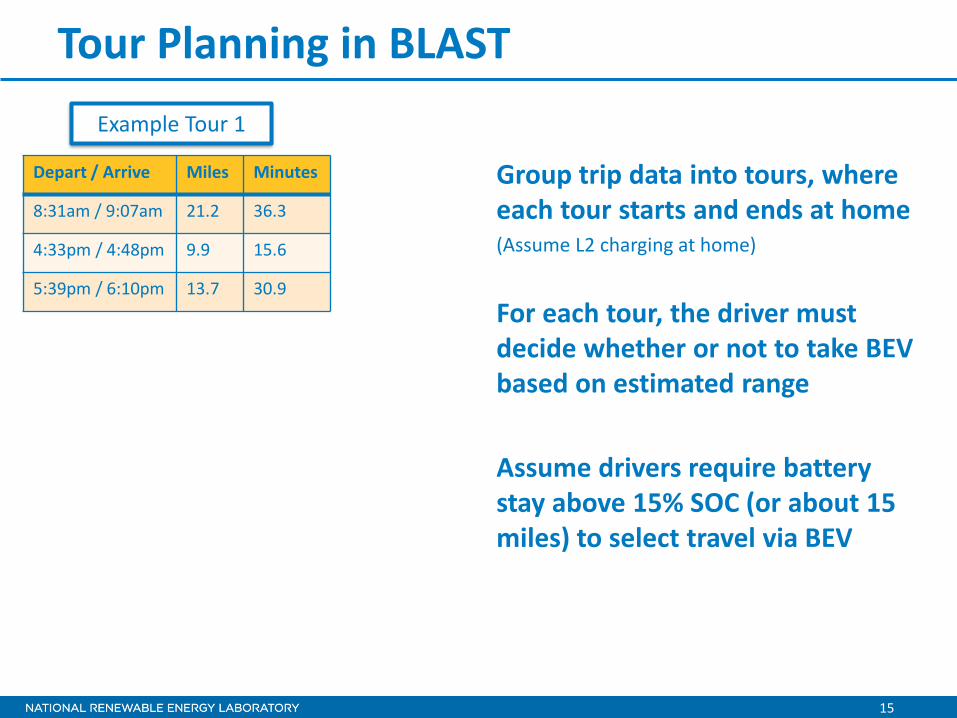
Tour Planning in BLAST
Group trip data into tours, where each tour starts and ends at home (Assume L2 charging at home)
For each tour, the driver must decide whether or not to take BEV based on estimated range Assume drivers require battery stay above 15% SOC (or about 15 miles) to select travel via BEV
Depart / Arrive Miles Minutes
8:31am / 9:07am 21.2 36.3
4:33pm / 4:48pm 9.9 15.6
5:39pm / 6:10pm 13.7 30.9
Example Tour 1
16
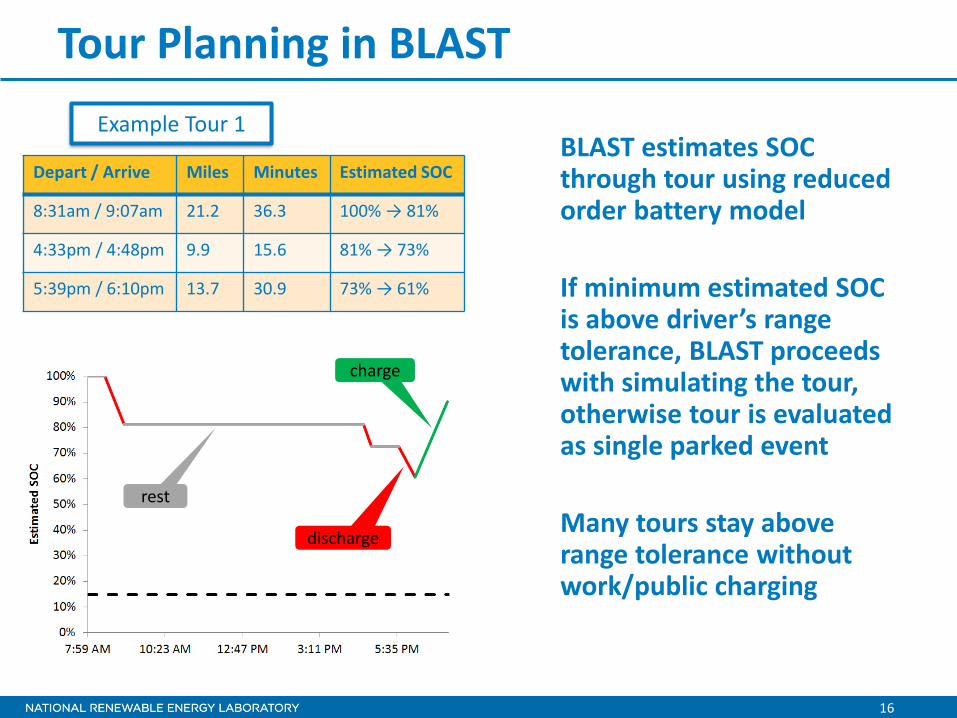
Tour Planning in BLAST
BLAST estimates SOC through tour using reduced order battery model If minimum estimated SOC is above driver’s range tolerance, BLAST proceeds with simulating the tour, otherwise tour is evaluated as single parked event Many tours stay above range tolerance without work/public charging
Depart / Arrive Miles Minutes Estimated SOC
8:31am / 9:07am 21.2 36.3 100% → 81%
4:33pm / 4:48pm 9.9 15.6 81% → 73%
5:39pm / 6:10pm 13.7 30.9 73% → 61%
charge
discharge
rest
Example Tour 1

17
Tour Planning in BLAST
Consider a different example tour from the BLAST travel data If minimum estimated SOC drops below range tolerance, BLAST has the option of rerouting select trips to include stops at fast charge stations
Depart / Arrive Miles Minutes Estimated SOC
8:14am / 8:40am 20.0 26.3 100% → 79%
12:34pm / 1:11pm 35.0 37.0 79% → 42%
3:55pm / 4:36pm 37.3 41.2 42% → 3%
5:49pm / 6:07pm 13.6 19.0 3% → 0%
charge discharge
rest
Example Tour 2
All fast charge stations assumed 50kW in this analysis
18
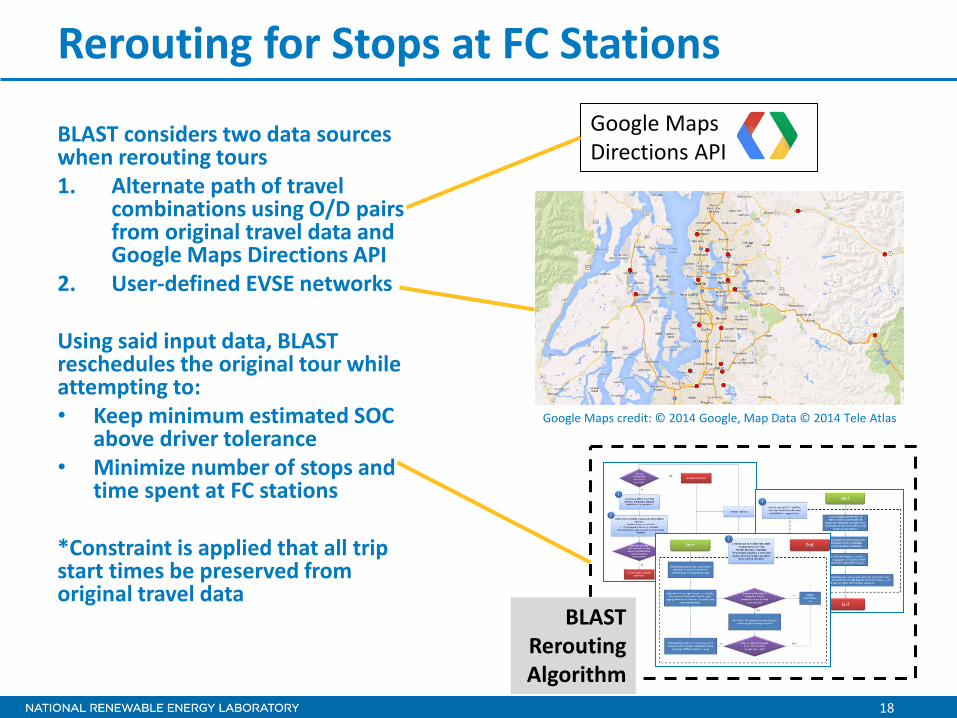
Rerouting for Stops at FC Stations
BLAST considers two data sources when rerouting tours 1. Alternate path of travel
combinations using O/D pairs from original travel data and Google Maps Directions API
2. User-defined EVSE networks Using said input data, BLAST reschedules the original tour while attempting to: • Keep minimum estimated SOC
above driver tolerance • Minimize number of stops and
time spent at FC stations
*Constraint is applied that all trip start times be preserved from original travel data
Google Maps Directions API
BLAST Rerouting Algorithm
Google Maps credit: © 2014 Google, Map Data © 2014 Tele Atlas

19
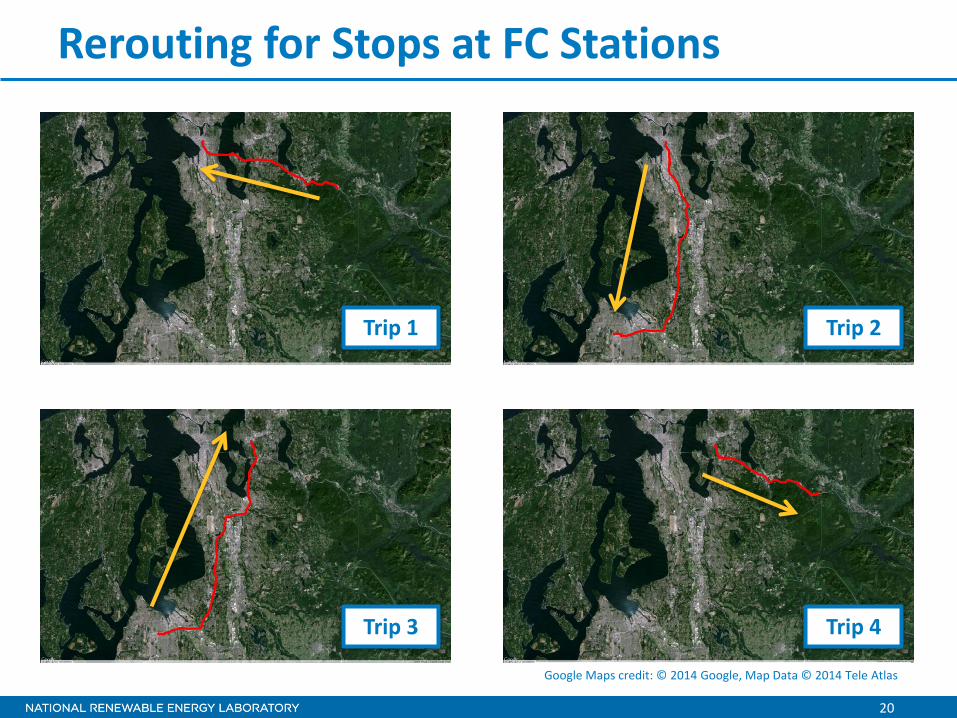
Rerouting for Stops at FC Stations
*Map does not reflect actual travel data; trip coordinates have been synthesized for illustrative purposes.
Rerouted path of travel from Google API (Example Tour 2)
Google Maps credit: © 2014 Google, Map Data © 2014 Tele Atlas
20
Rerouting for Stops at FC Stations
Trip 1
Trip 3 Trip 4
Trip 2
Google Maps credit: © 2014 Google, Map Data © 2014 Tele Atlas

21
Rerouting for Stops at FC Stations Need to identify candidate FC stations for current tour
given predefined EVSE network for entire area
Fast Charge Stations available in simulation Fast Charge Stations
available in simulation Fast Charge Stations
available in simulation
Google Maps credit: © 2014 Google, Map Data © 2014 Tele Atlas

22
Rerouting for Stops at FC Stations
Create one mile buffer around path of travel;
retain stations inside buffer for further consideration
Google Maps credit: © 2014 Google, Map Data © 2014 Tele Atlas
23
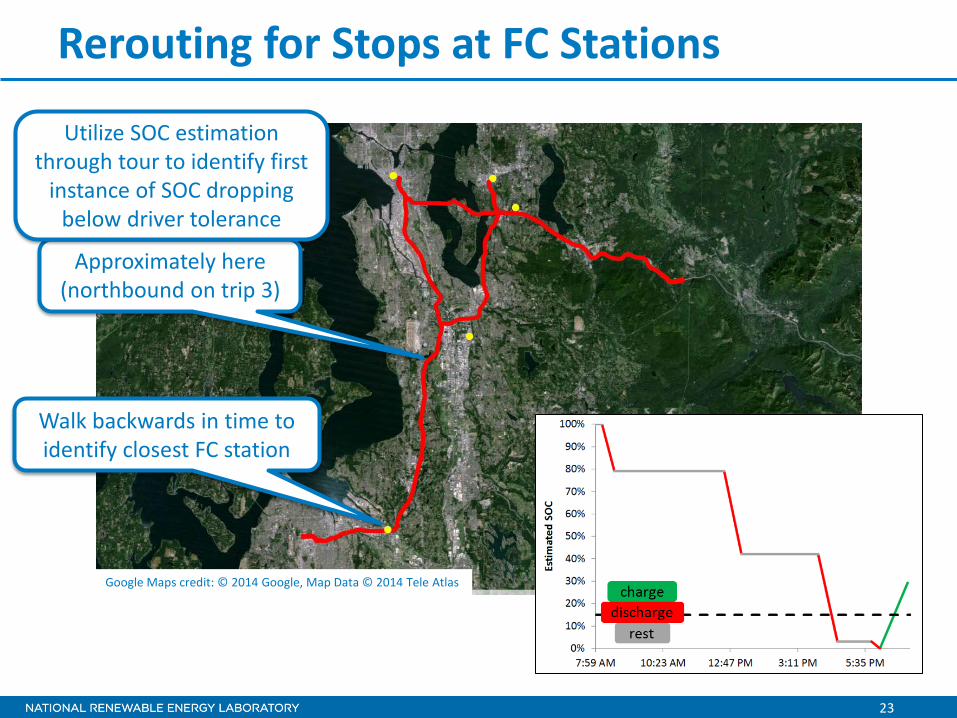
Rerouting for Stops at FC Stations
Approximately here (northbound on trip 3)
Utilize SOC estimation through tour to identify first
instance of SOC dropping below driver tolerance
Walk backwards in time to identify closest FC station
Google Maps credit: © 2014 Google, Map Data © 2014 Tele Atlas
24
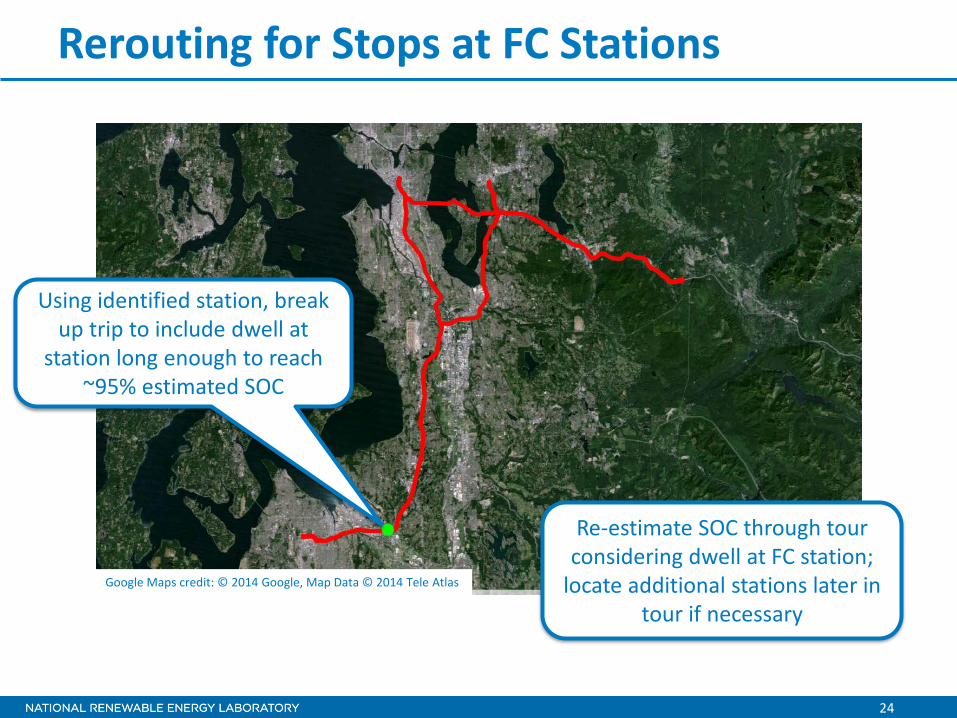
Rerouting for Stops at FC Stations
Using identified station, break up trip to include dwell at
station long enough to reach ~95% estimated SOC
Re-estimate SOC through tour considering dwell at FC station;
locate additional stations later in tour if necessary
Google Maps credit: © 2014 Google, Map Data © 2014 Tele Atlas
25
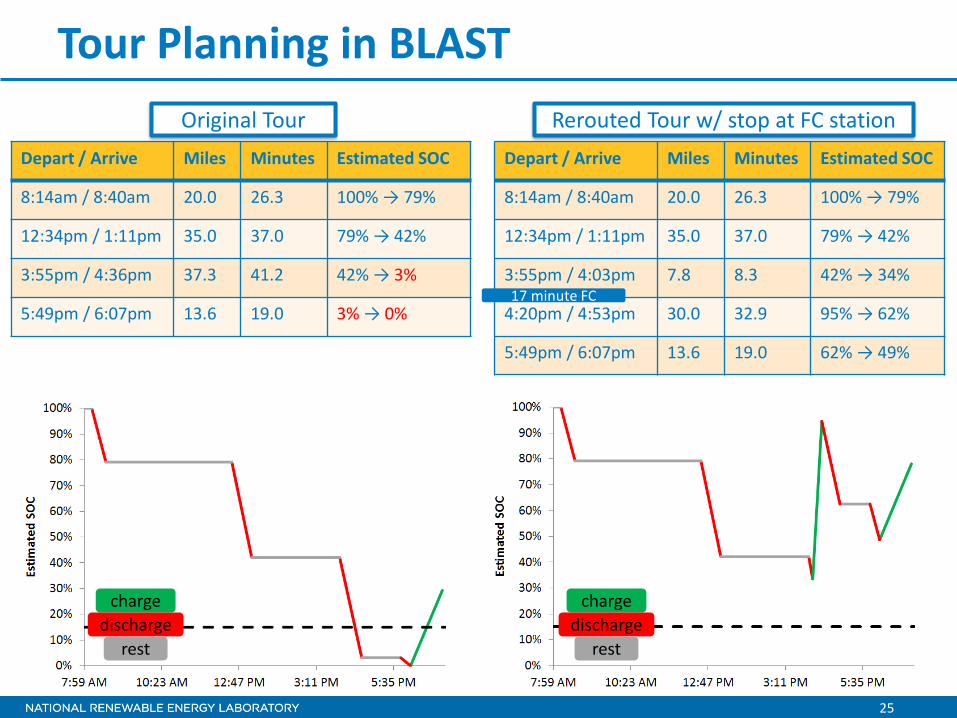
Tour Planning in BLAST
Depart / Arrive Miles Minutes Estimated SOC
8:14am / 8:40am 20.0 26.3 100% → 79%
12:34pm / 1:11pm 35.0 37.0 79% → 42%
3:55pm / 4:03pm 7.8 8.3 42% → 34%
4:20pm / 4:53pm 30.0 32.9 95% → 62%
5:49pm / 6:07pm 13.6 19.0 62% → 49%
Depart / Arrive Miles Minutes Estimated SOC
8:14am / 8:40am 20.0 26.3 100% → 79%
12:34pm / 1:11pm 35.0 37.0 79% → 42%
3:55pm / 4:36pm 37.3 41.2 42% → 3%
5:49pm / 6:07pm 13.6 19.0 3% → 0%
charge discharge
rest
charge discharge
rest
Original Tour Rerouted Tour w/ stop at FC station
17 minute FC

26
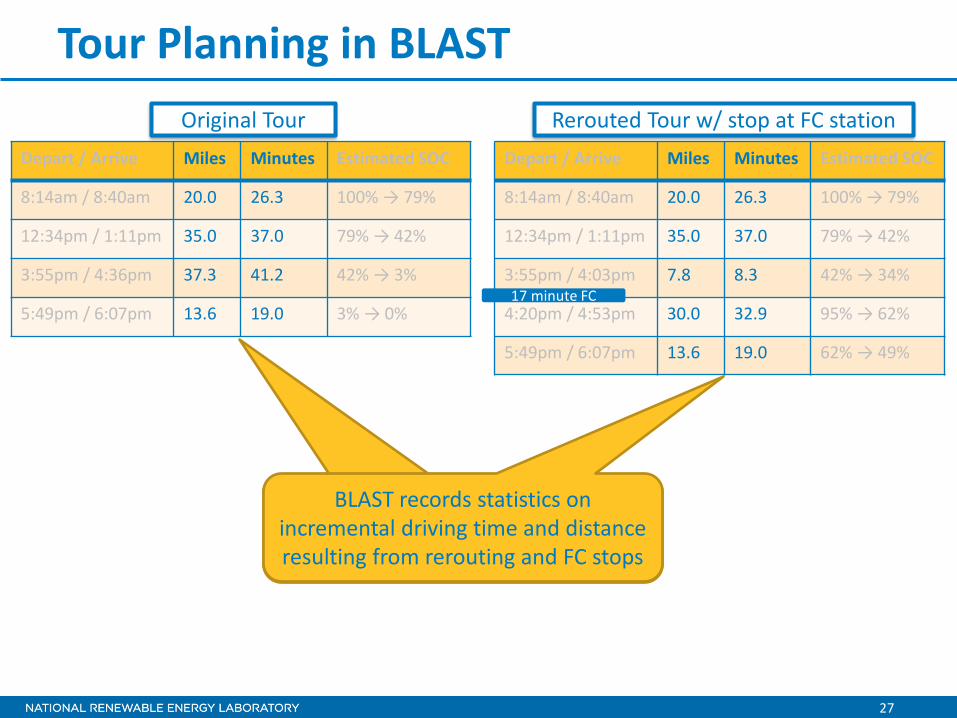
Tour Planning in BLAST
Depart / Arrive Miles Minutes Estimated SOC
8:14am / 8:40am 20.0 26.3 100% → 79%
12:34pm / 1:11pm 35.0 37.0 79% → 42%
3:55pm / 4:03pm 7.8 8.3 42% → 34%
4:20pm / 4:53pm 30.0 32.9 95% → 62%
5:49pm / 6:07pm 13.6 19.0 62% → 49%
All trips in rerouted tour start on time (based on original data)
Depart / Arrive Miles Minutes Estimated SOC
8:14am / 8:40am 20.0 26.3 100% → 79%
12:34pm / 1:11pm 35.0 37.0 79% → 42%
3:55pm / 4:36pm 37.3 41.2 42% → 3%
5:49pm / 6:07pm 13.6 19.0 3% → 0%
Original Tour
All trips in rerouted tour start on time (per original data)
Rerouted Tour w/ stop at FC station
17 minute FC
27
Tour Planning in BLAST
Depart / Arrive Miles Minutes Estimated SOC
8:14am / 8:40am 20.0 26.3 100% → 79%
12:34pm / 1:11pm 35.0 37.0 79% → 42%
3:55pm / 4:03pm 7.8 8.3 42% → 34%
4:20pm / 4:53pm 30.0 32.9 95% → 62%
5:49pm / 6:07pm 13.6 19.0 62% → 49%
Depart / Arrive Miles Minutes Estimated SOC
8:14am / 8:40am 20.0 26.3 100% → 79%
12:34pm / 1:11pm 35.0 37.0 79% → 42%
3:55pm / 4:36pm 37.3 41.2 42% → 3%
5:49pm / 6:07pm 13.6 19.0 3% → 0%
Original Tour
Statistics recorded on incremental driving time and distance resulting
from rerouting
BLAST records statistics on incremental driving time and distance resulting from rerouting and FC stops
Rerouted Tour w/ stop at FC station
17 minute FC
28
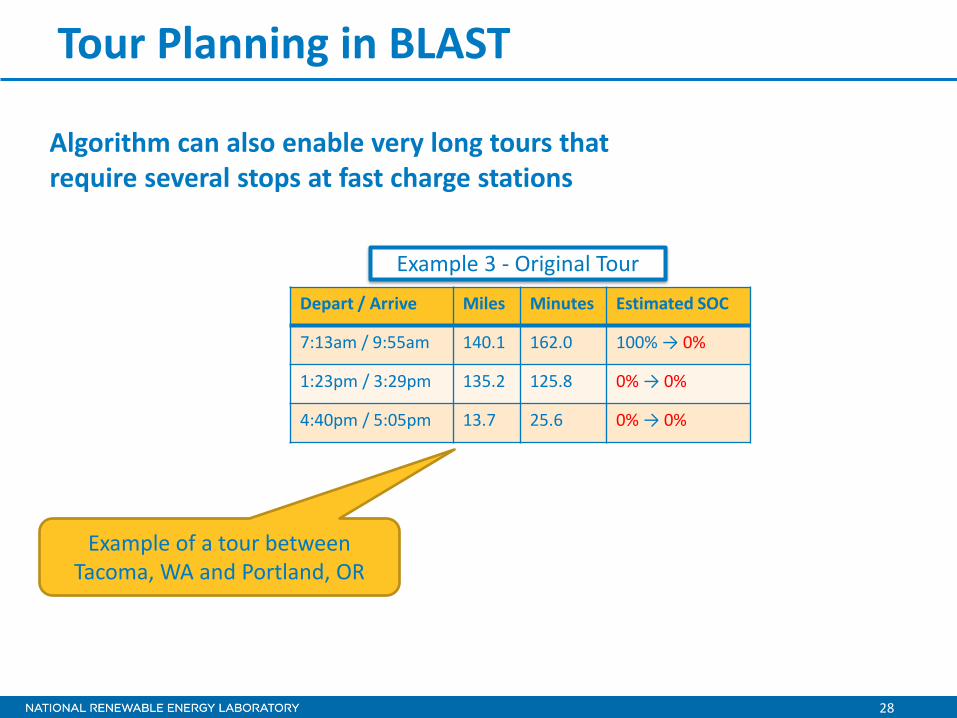
Tour Planning in BLAST
Depart / Arrive Miles Minutes Estimated SOC
7:13am / 9:55am 140.1 162.0 100% → 0%
1:23pm / 3:29pm 135.2 125.8 0% → 0%
4:40pm / 5:05pm 13.7 25.6 0% → 0%
Example 3 - Original Tour
Algorithm can also enable very long tours that require several stops at fast charge stations
Example of a tour between Tacoma, WA and Portland, OR

29
Tour Planning in BLAST
Depart / Arrive Miles Minutes Estimated SOC
7:13am / 7:52am 39.7 39.1 100% → 53%
8:04am / 8:59am 55.9 54.7 95% → 30%
9:17am / 9:49am 33.4 31.8 94% → 55%
10:00am / 10:17am 18.7 17.3 93% → 71%
1:23pm / 1:37pm 14.3 13.4 71% → 54%
1:48pm / 2:40pm 53.9 52.3 93% → 30%
2:58pm / 4:02pm 66.0 63.3 94% → 18%
4:23pm / 4:24pm 1.5 0.6 94% → 92%
4:40pm / 4:59pm 13.7 19.0 92% → 78%
charge discharge
rest
Rerouted Tour w/ stops at FC stations
While such tours are deemed feasible during tour planning, BLAST will additionally evaluate the thermal and life impacts of such an aggressive cycling profile
18 minute FC
11 minute FC
12 minute FC
11 minute FC
18 minute FC
21 minute FC

30
Tour Planning in BLAST
FC Stop 1
6
5
2
3,4
*Map does not reflect actual travel data; trip coordinates have been synthesized for illustrative purposes.
Path of travel
Utilized FC
Available FC
Google Maps credit: © 2014 Google, Map Data © 2014 Tele Atlas

Baseline Simulations Vehicle Specs, Driving Profiles, & Infrastructure Availability Assumptions
32
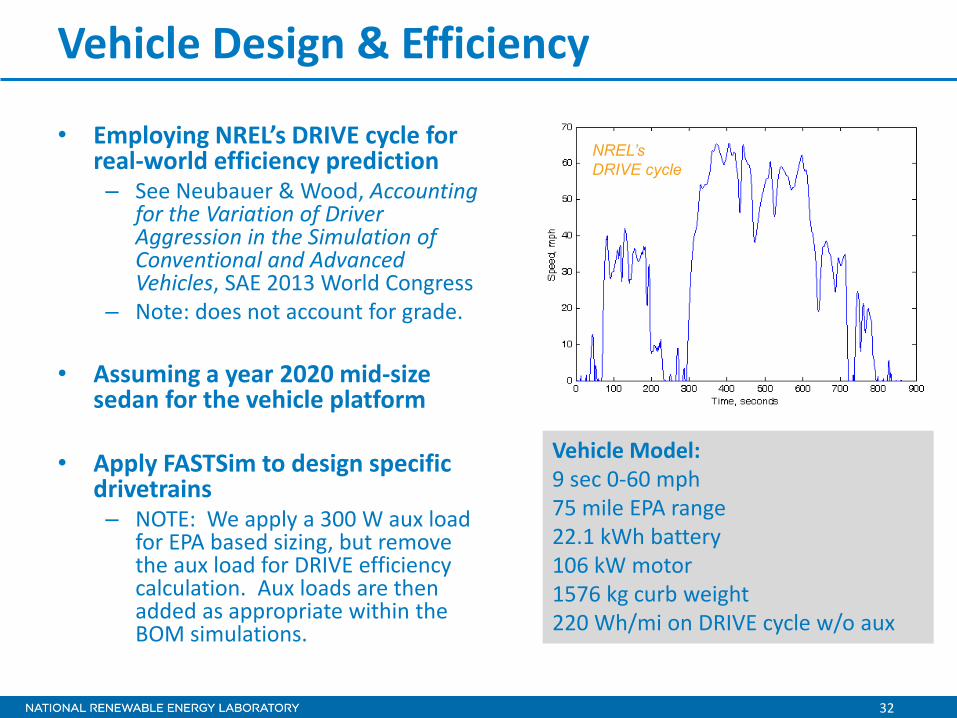
Vehicle Design & Efficiency
• Employing NREL’s DRIVE cycle for real-world efficiency prediction – See Neubauer & Wood, Accounting
for the Variation of Driver Aggression in the Simulation of Conventional and Advanced Vehicles, SAE 2013 World Congress
– Note: does not account for grade.
• Assuming a year 2020 mid-size sedan for the vehicle platform
• Apply FASTSim to design specific drivetrains – NOTE: We apply a 300 W aux load
for EPA based sizing, but remove the aux load for DRIVE efficiency calculation. Aux loads are then added as appropriate within the BOM simulations.
Vehicle Model: 9 sec 0-60 mph 75 mile EPA range 22.1 kWh battery 106 kW motor 1576 kg curb weight 220 Wh/mi on DRIVE cycle w/o aux
NREL’s DRIVE cycle
33
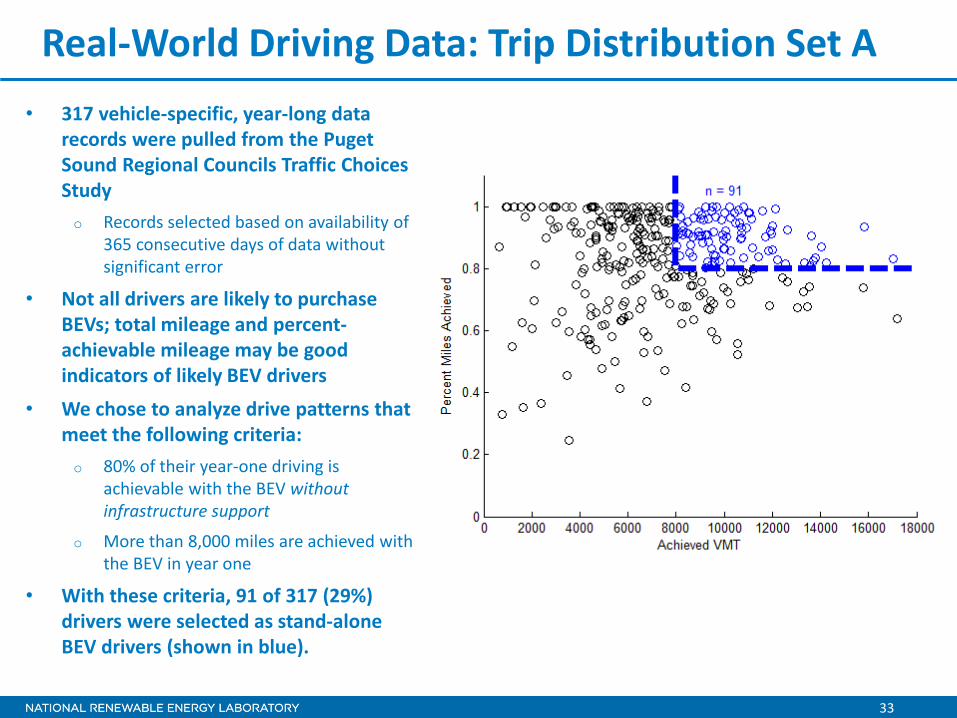
Real-World Driving Data: Trip Distribution Set A • 317 vehicle-specific, year-long data
records were pulled from the Puget Sound Regional Councils Traffic Choices Study o Records selected based on availability of
365 consecutive days of data without significant error
• Not all drivers are likely to purchase BEVs; total mileage and percent-achievable mileage may be good indicators of likely BEV drivers
• We chose to analyze drive patterns that meet the following criteria: o 80% of their year-one driving is
achievable with the BEV without infrastructure support
o More than 8,000 miles are achieved with the BEV in year one
• With these criteria, 91 of 317 (29%) drivers were selected as stand-alone BEV drivers (shown in blue).

34
Real-World Driving Data: Trip Distribution Set B
• The previous 80% utility factor counts out some high mileage drivers that could benefit from infrastructure
• We therefore created and added a second set of drive patterns that met the following criteria: o Not included in Set A o More than 8,000 miles per year are
driven with a CV
• With these criteria, an additional 89
of 317 (28%) drivers were selected (shown in red).
35
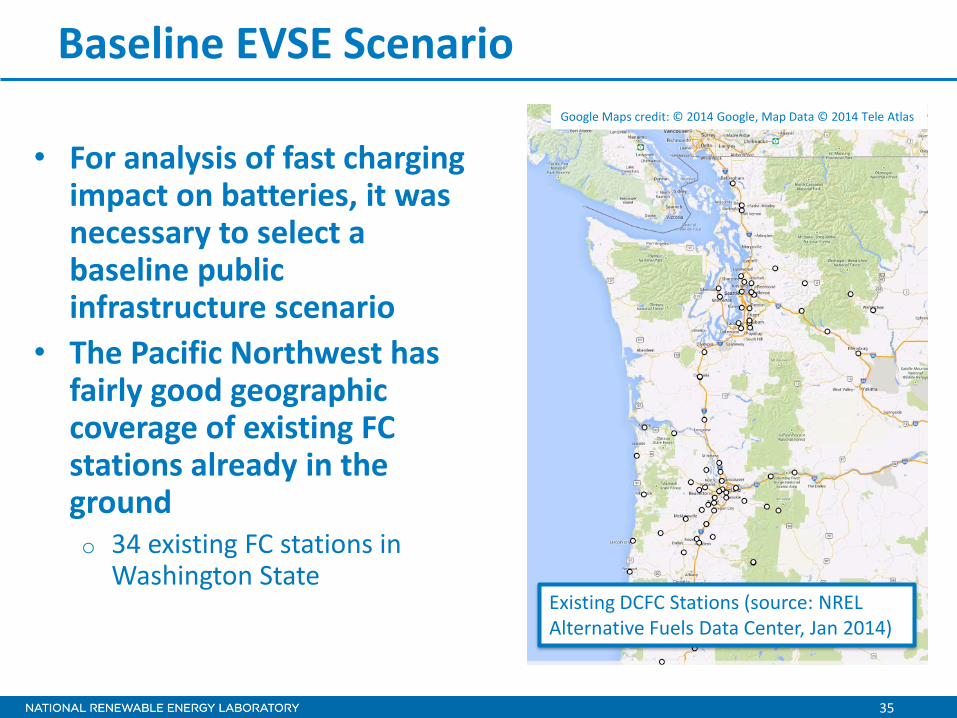
Baseline EVSE Scenario
• For analysis of fast charging impact on batteries, it was necessary to select a baseline public infrastructure scenario
• The Pacific Northwest has fairly good geographic coverage of existing FC stations already in the ground o 34 existing FC stations in
Washington State Existing DCFC Stations (source: NREL Alternative Fuels Data Center, Jan 2014)
Google Maps credit: © 2014 Google, Map Data © 2014 Tele Atlas
36
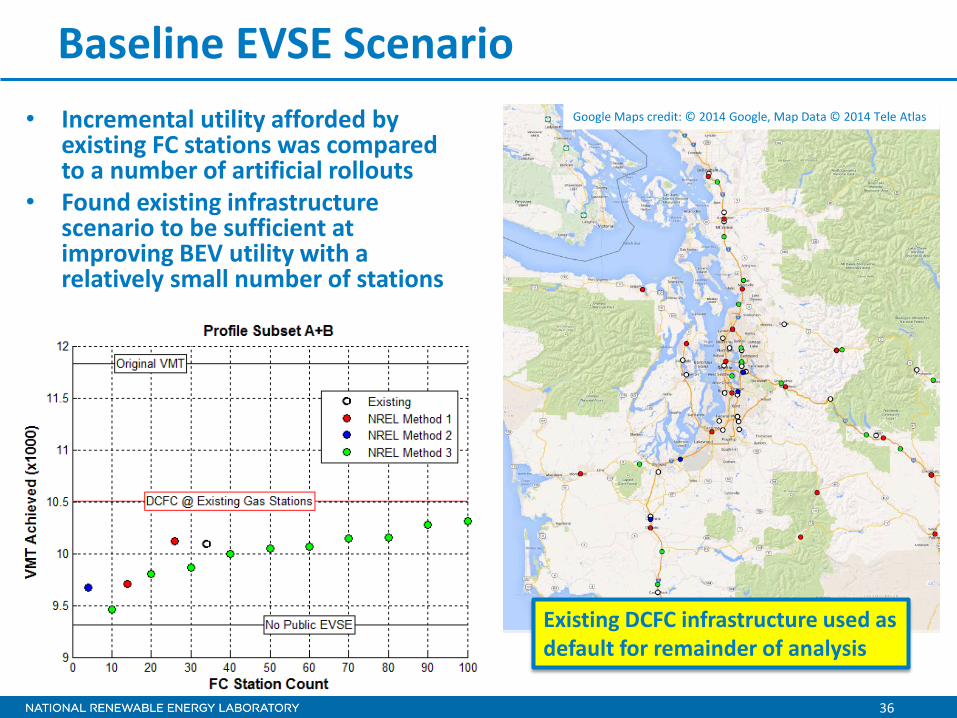
Baseline EVSE Scenario • Incremental utility afforded by
existing FC stations was compared to a number of artificial rollouts
• Found existing infrastructure scenario to be sufficient at improving BEV utility with a relatively small number of stations
Existing DCFC infrastructure used as default for remainder of analysis
Google Maps credit: © 2014 Google, Map Data © 2014 Tele Atlas

Baseline Simulations Compare Simulated Fast Charger Utilization to Real-World Data

38
FC Utilization & Validation
• Average driver utilized FC 10 times in first year of life o Extreme case driver utilized
FC at an average rate of 8 times a month
• FC utilization correlates well with incremental VMT
• Some drivers complete 100% of travel w/o need for FC
39
FC Utilization & Validation
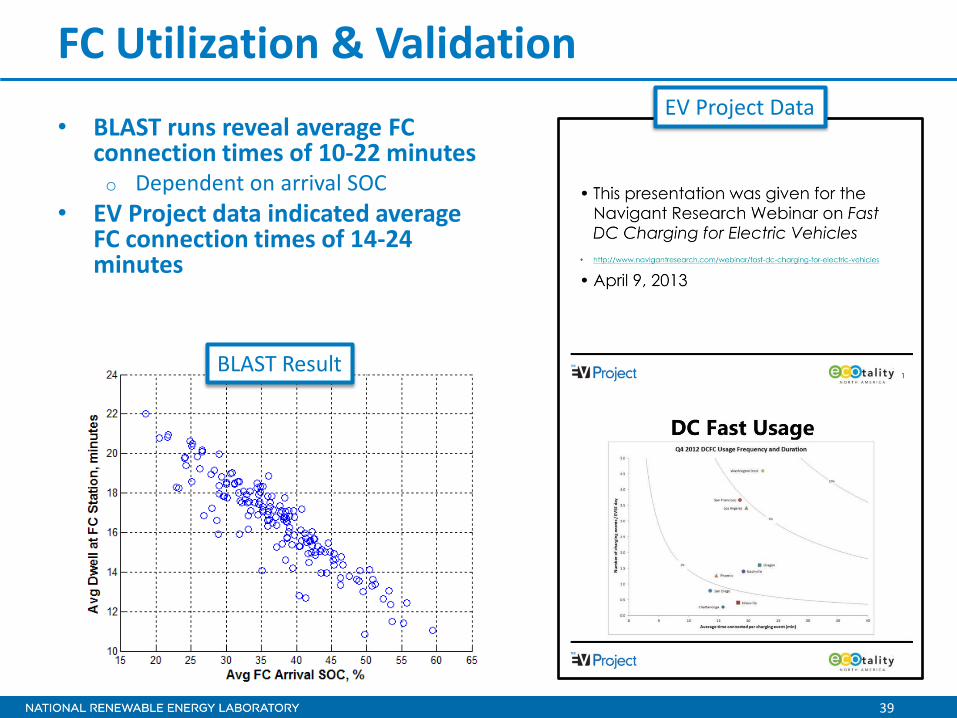
• BLAST runs reveal average FC connection times of 10-22 minutes o Dependent on arrival SOC
• EV Project data indicated average FC connection times of 14-24 minutes
EV Project Data
BLAST Result
40
FC Utilization & Validation
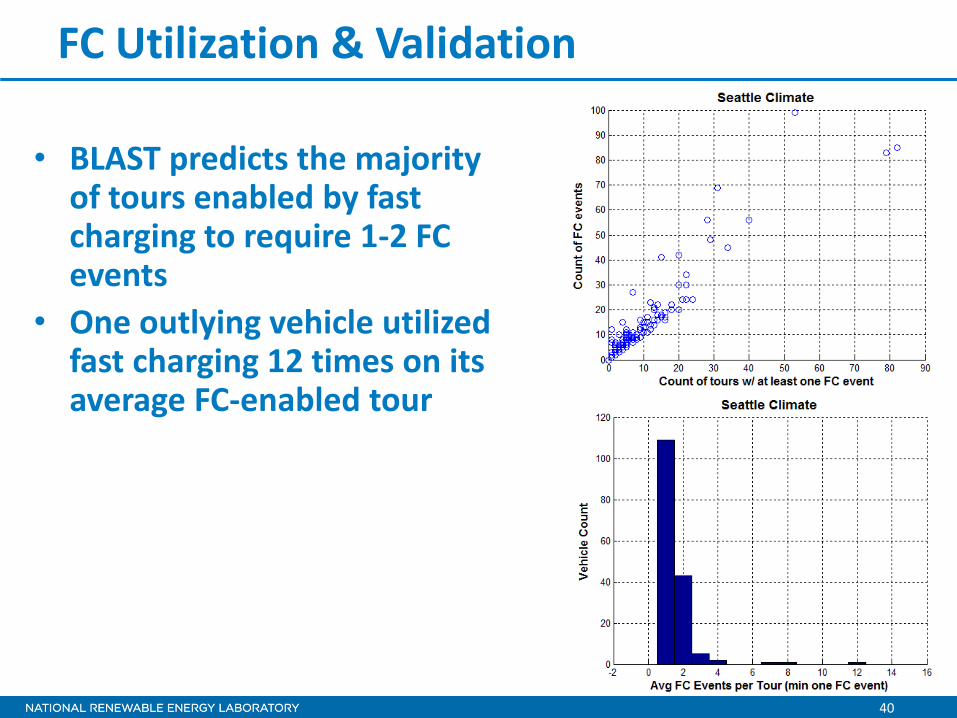
• BLAST predicts the majority of tours enabled by fast charging to require 1-2 FC events
• One outlying vehicle utilized fast charging 12 times on its average FC-enabled tour

41
FC Utilization & Validation • BLAST aggregates charge energy by location • Group all FC locations together and average driver
receives 7.6% of energy from fast charging o Max: 41.5% o Min 0.0%
• EV Project reports fast charges accounting for 1-21% of all charge events for Nissan Leaf’s under study that frequently used fast chargers o Where a cost for fast charging was present, 8% of
charging energy came from fast charging for Nissan Leaf’s under study
EV Project Data
BLAST Result
Fast charge impact analysis Evaluate impact of fast charging on battery packs under three thermal management scenarios
43
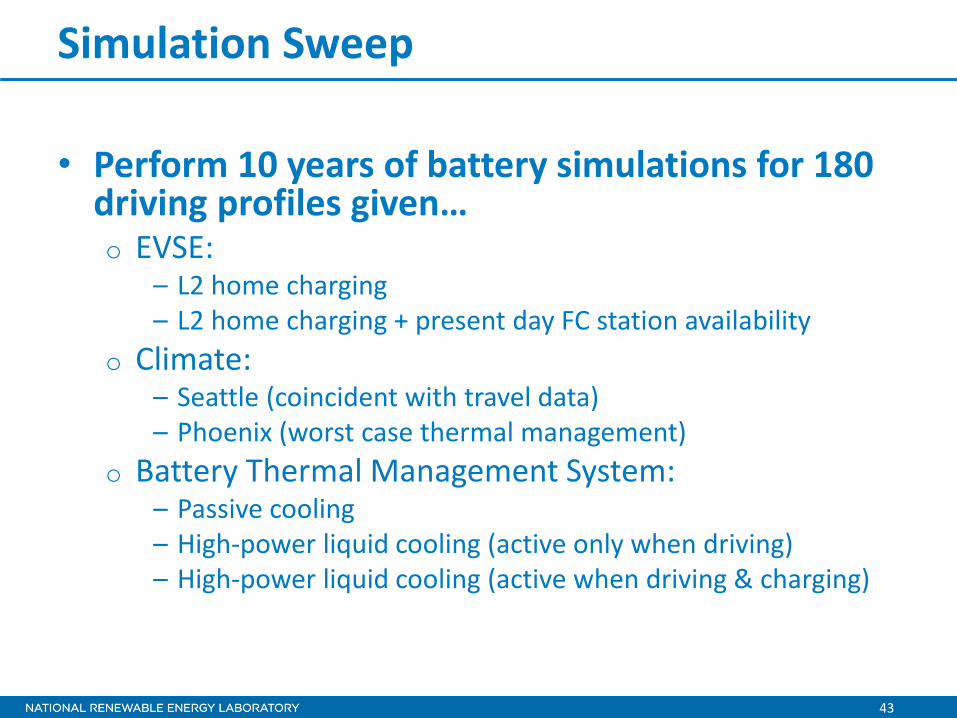
Simulation Sweep
• Perform 10 years of battery simulations for 180 driving profiles given… o EVSE:
– L2 home charging – L2 home charging + present day FC station availability
o Climate: – Seattle (coincident with travel data) – Phoenix (worst case thermal management)
o Battery Thermal Management System: – Passive cooling – High-power liquid cooling (active only when driving) – High-power liquid cooling (active when driving & charging)
44
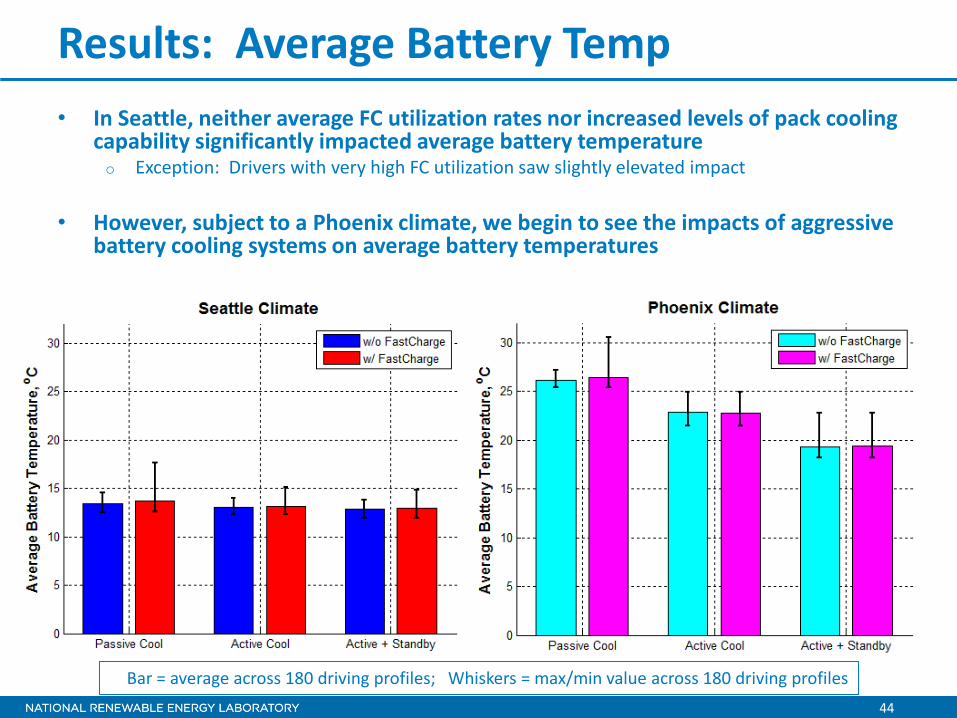
Results: Average Battery Temp • In Seattle, neither average FC utilization rates nor increased levels of pack cooling
capability significantly impacted average battery temperature o Exception: Drivers with very high FC utilization saw slightly elevated impact
• However, subject to a Phoenix climate, we begin to see the impacts of aggressive
battery cooling systems on average battery temperatures
Bar = average across 180 driving profiles; Whiskers = max/min value across 180 driving profiles
45
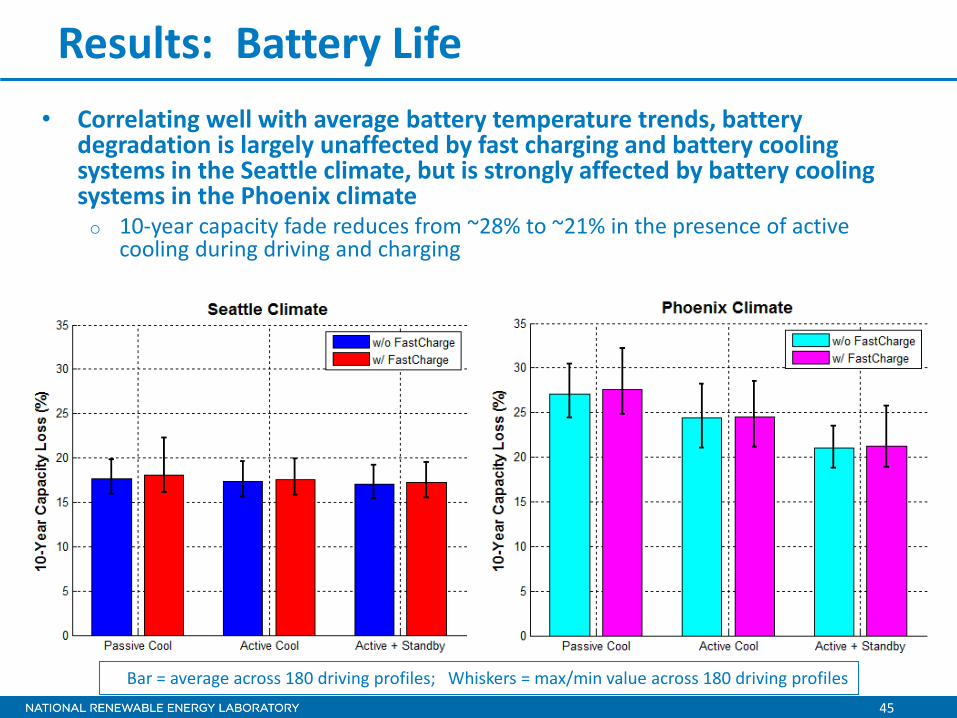
Results: Battery Life • Correlating well with average battery temperature trends, battery
degradation is largely unaffected by fast charging and battery cooling systems in the Seattle climate, but is strongly affected by battery cooling systems in the Phoenix climate o 10-year capacity fade reduces from ~28% to ~21% in the presence of active
cooling during driving and charging
Bar = average across 180 driving profiles; Whiskers = max/min value across 180 driving profiles
46
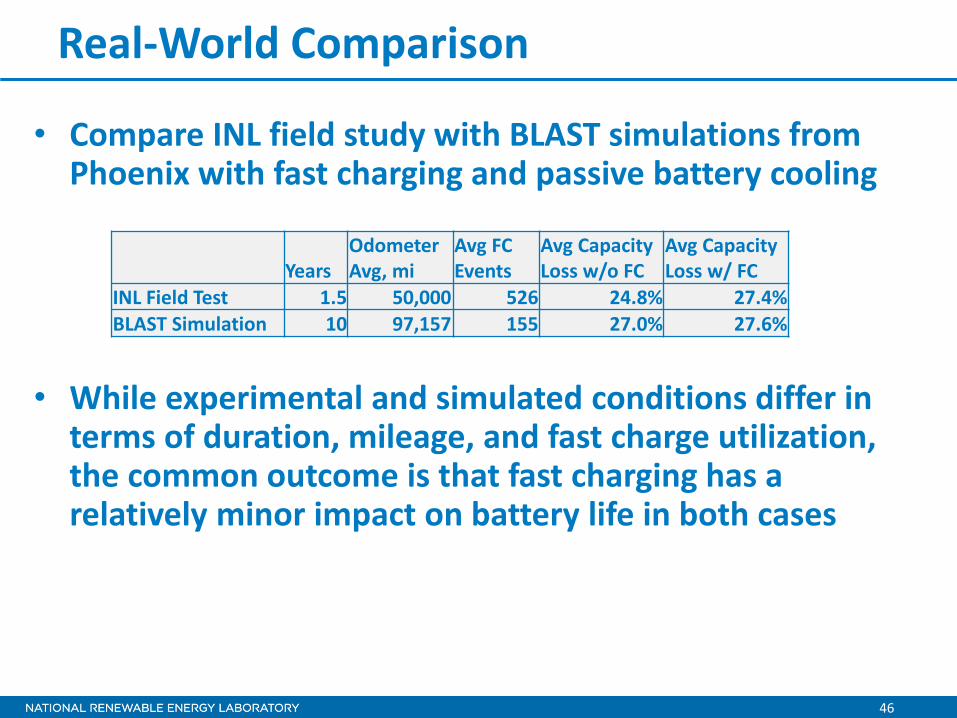
Real-World Comparison
Years Odometer Avg, mi
Avg FC Events
Avg Capacity Loss w/o FC
Avg Capacity Loss w/ FC
INL Field Test 1.5 50,000 526 24.8% 27.4% BLAST Simulation 10 97,157 155 27.0% 27.6%
• While experimental and simulated conditions differ in terms of duration, mileage, and fast charge utilization, the common outcome is that fast charging has a relatively minor impact on battery life in both cases
• Compare INL field study with BLAST simulations from Phoenix with fast charging and passive battery cooling

47
Results: Battery Max Temp
• Impact of FC was most observable in maximum pack temperatures from passively cooled packs o Back-to-back sequencing of
drive-FC-drive produces significant heat generation resulting in dangerous thermal conditions
• Simulated packs with
aggressive cooling systems were able to mitigate heat generation on FC tours and maintain safe thermal conditions
Bar = average across 180 driving profiles Whiskers = max/min value across 180 driving profiles
Fast charge impact analysis Consider cell heterogeneity in a hot climate subject to fast charging
49
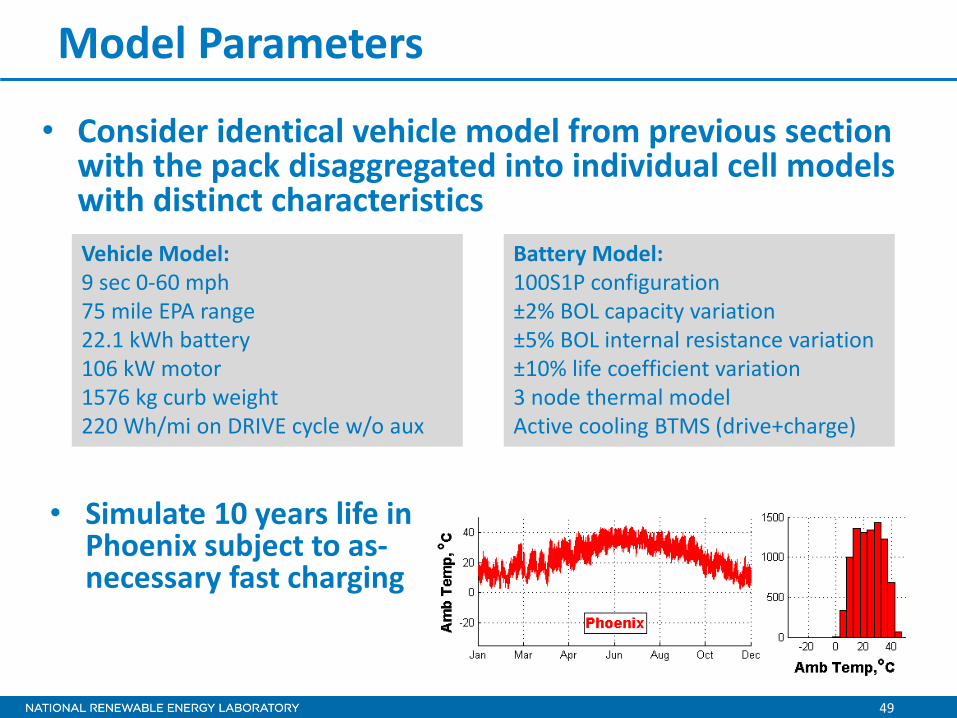
Model Parameters
Vehicle Model: 9 sec 0-60 mph 75 mile EPA range 22.1 kWh battery 106 kW motor 1576 kg curb weight 220 Wh/mi on DRIVE cycle w/o aux
Battery Model: 100S1P configuration ±2% BOL capacity variation ±5% BOL internal resistance variation ±10% life coefficient variation 3 node thermal model Active cooling BTMS (drive+charge)
• Simulate 10 years life in Phoenix subject to as-necessary fast charging
• Consider identical vehicle model from previous section with the pack disaggregated into individual cell models with distinct characteristics

50
Pack Thermal Gradients
• BLAST simulations resulted in maximum cell-to-cell temperature variation of 11°C on average
• Modeled behavior compares favorably with small field dataset collected by BMW on the Mini E platform
BLAST Model
BMW Mini E Field Data

51
Value of Multi-cell Thermal Model
• Multi-cell modeling predicts peak temperatures 1.5°C to 4°C warmer than single-cell model

52
Capacity Loss Results • Average cells lost 19% to 24% of BOL capacity
o Best case vehicle/cell combination lost 17% BOL capacity o Worst case vehicle/cell combination lost 27% BOL capacity
• Difference in capacity across cells in a pack is typically ~5% • Capturing minimum cell capacity is important, as this is what will
limit range and vehicle utility without advanced balancing
Distribution across cells in pack

53
Resistance Growth Results • Average cells saw 17% to 48% resistance growth
o Best case vehicle/cell combination saw 15% resistance growth o Worst case vehicle/cell combination saw 54% resistance growth
• Difference in resistance across cells in a pack is typically ~6% • Capturing maximum cell resistance is important, as this is what will limit
power (in combination with thermal gradient) without advanced balancing
Distribution across cells in pack

Fast charge impact analysis A closer look at how fast charging impacts max battery temperatures

55
Example Vehicle: Full Year Passive Battery Cooling
Pack temperatures climb to dangerous levels on long tours with multiple back-to-back
fast charge events
Thermal history of battery w/ passive cooling and fast charging
Pack temperatures climb to dangerous levels on long tours with multiple back-to-back
fast charge events
On multiple occasions, pack temperatures climb to dangerously high levels, and not
just in the summer.
56
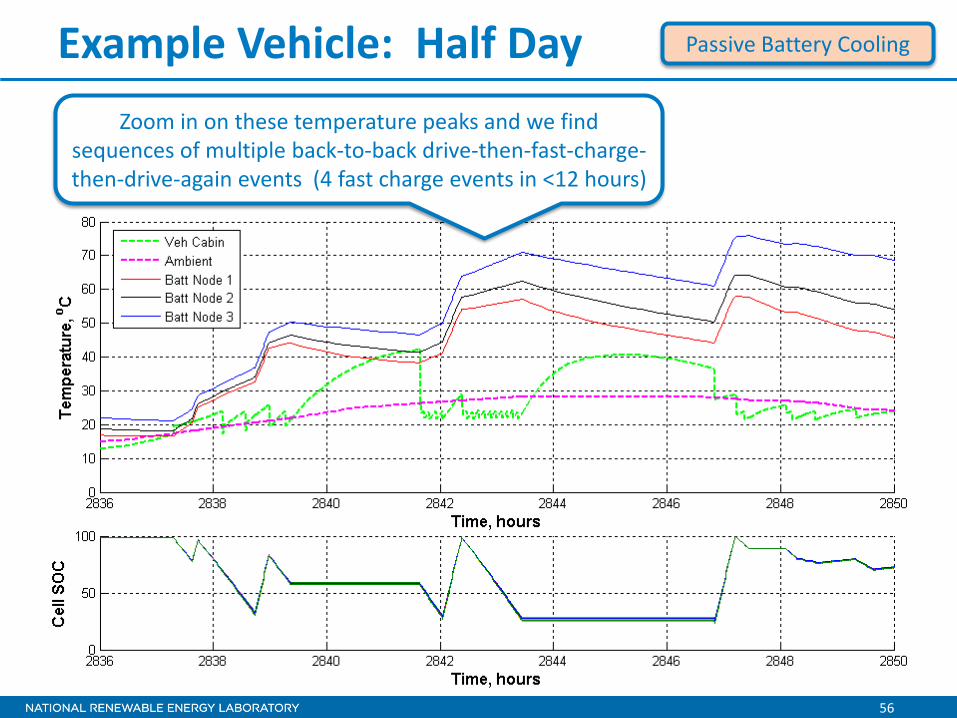
Example Vehicle: Half Day Zoom in on these temperature peaks and we find
sequences of multiple back-to-back drive-then-fast-charge-then-drive-again events (4 fast charge events in <12 hours)
Passive Battery Cooling

57
Example Vehicle: Half Day
Large amount of battery internal heat generation during fast charge events
Passive Battery Cooling

58
Example Vehicle: Half Day
Heat generation during driving also plays a big role. These are “fast charge enabled” miles
Passive Battery Cooling
59
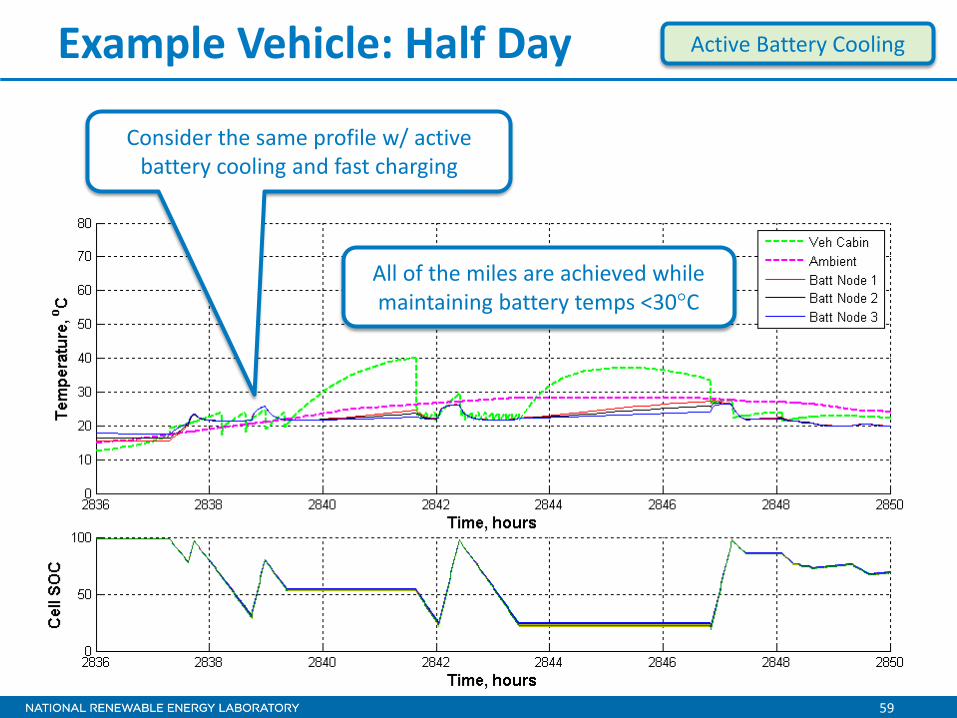
Example Vehicle: Half Day
Consider the same profile w/ active battery cooling and fast charging
All of the miles are achieved while maintaining battery temps <30°C
Active Battery Cooling

Summary
61
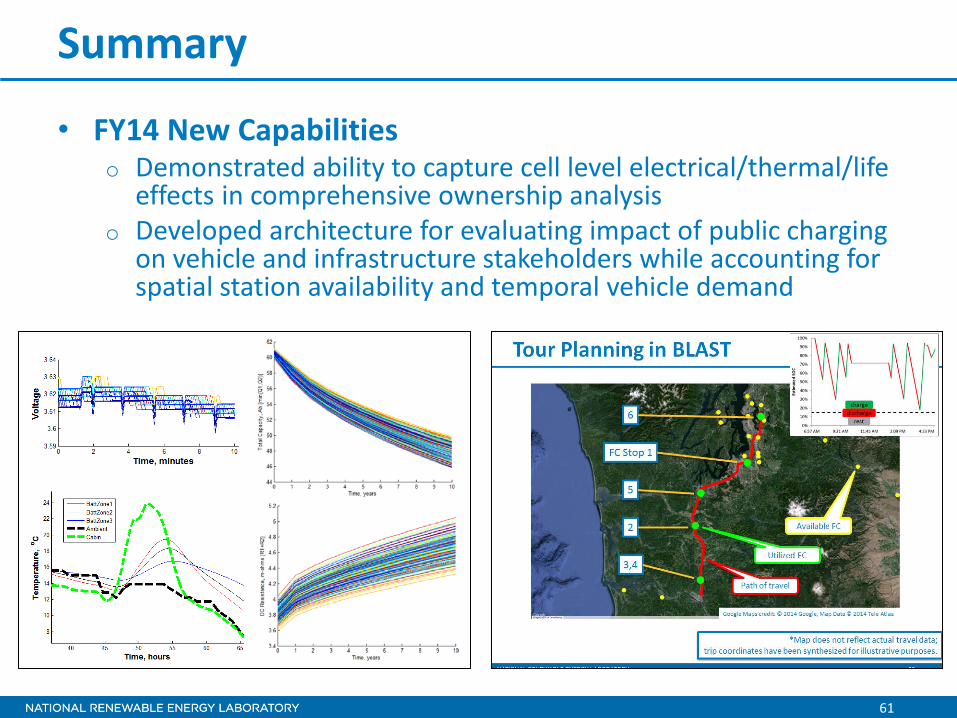
Summary
• FY14 New Capabilities o Demonstrated ability to capture cell level electrical/thermal/life
effects in comprehensive ownership analysis o Developed architecture for evaluating impact of public charging
on vehicle and infrastructure stakeholders while accounting for spatial station availability and temporal vehicle demand

62
Summary: Correlation with Real World Data
• Our new-for-FY14 routing logic produces fast charge usage statistics – particularly time at stations and energy from stations – that agree well with EV Project data
• Our degradation data agrees well with INL’s fast charge degradation tests, in that the difference in degradation between cases with and without fast charging is small
• BLAST-V simulations predict much higher maximum battery temperatures than INL’s BEV fast charging experiments, but these experiments have multi-hour rests in between fast charging and subsequent driving events

63
Summary: Analysis Results
• Aggressive active battery cooling is important for constraining maximum battery temperatures, particularly for long fast-charge-enabled tours in hot climates o Such conditions could pose a safety risk without aggressive
active cooling, though it is more likely that the BMS will intervene to reduce available charging and driving power
• Active battery cooling can also positively impact battery
lifetime in hot climates when utilized while parked at a charger in addition to while driving
• Use of multi-cell thermal and electrical models provide additional insight into battery thermal and degradation responses

64
Moving Forward
• We’ve completed simulation of multiple cases (multiple drivers, climates, vehicle range, etc.) that can be used to assess the additional utility of fast charging
• Analysis thereof will be conducted in the remaining 2014 calendar year to provide additional information on the overall benefits of fast charging and our expectations for its importance in electrifying the vehicle fleet
• These results and those described herein will be compiled into papers and presentation for the 2015 SAE World Congress
65
Acknowledgments
• This activity is funded by the DOE Vehicle Technologies Office, Energy Storage Technology
• We appreciate the support provided by our DOE program managers o David Howell o Brian Cunningham
• Special thanks to NREL’s Vehicle
Systems Analysis team for supporting this effort with FASTSim
• Technical questions regarding this work should be directed to Jeremy Neubauer at 303-275-3084 or [email protected].