Prepared Remarks
39
1 2017 third quarter results Prepared remarks August 8, 2017 © 2017 Nuance Communications, Inc. All rights reserved. Prepared Remarks Nuance Third Quarter Fiscal 2017 Nuance is providing these prepared remarks, in combination with its press release, to allow shareholders and analysts additional time and detail for analyzing our results in advance of our quarterly conference call. These prepared remarks will not be read on the call. The conference call will begin at 5:00 p.m. ET today and will include only brief opening comments followed by questions and answers. To access the live broadcast, please visit the Investor Relations section of Nuance’s website at http://investors.nuance.com. The call can also be heard by dialing 800-230-1092 or 612-234-9959 at least five minutes prior to the call and referencing code 426362. A replay will be available within 24 hours of the announcement by dialing 800-475-6701 or 320-365-3844 and using the access code 426362. Please see the section, “Discussion of Non-GAAP Financial Measures,” later in this document for more details on our non-GAAP financial measures. Summary of Business and Financial Trends We saw strong execution across our divisions in the third quarter, absent the June 27, 2017 malware incident, driven by net new bookings, recurring revenue, and cash flow from operations. This performance was led by continued strength in our Enterprise omni-channel offerings, Dragon Medical cloud solution, voice biometrics solutions, and our automotive business. We remain confident that the positive trends of the past four quarters will provide the foundation for sustainable long-term organic growth in fiscal 2018 after the majority of the malware incident effects are behind us. As Reported Q3 17 Results We reported GAAP revenue of $486.2 million for the third quarter, compared to $477.9 million a year ago. Third quarter non-GAAP revenue was $495.6 million, which includes revenue lost to accounting treatment in conjunction with acquisitions, compared to $484.9 million in the third quarter of fiscal 2016. Total recurring revenue for the third quarter represented 73% of total GAAP revenue. On a non-GAAP basis, total recurring revenue represented 73% of total non-GAAP revenue, compared to 71% a year ago. We reported net new bookings for the third quarter of $438.5 million, up 21% from $362.9 million a year ago. We reported GAAP net loss of $(27.8) million for the third quarter, or $(0.10) per share, compared to GAAP net loss of $(11.8) million, or $(0.04) per share, in the third quarter of fiscal 2016. Non-GAAP net income was $79.2 million, or $0.27 per diluted share, down from non-GAAP net income of $83.3 million, or $0.30 per diluted share, in the third quarter of fiscal 2016. Our GAAP operating margin for the quarter was 2.9%, down from 6.0% in the third quarter of fiscal 2016. Third quarter non-GAAP operating margin was 27.0%, down from 27.2% in the third quarter of fiscal 2016. Cash flow from operations was $132.0 million in the third quarter of fiscal 2017, up from $125.9 million in the third quarter of fiscal 2016.
Transcript of Prepared Remarks

1 2017 third quarter results Prepared remarks
August 8, 2017
© 2017 Nuance Communications, Inc. All rights reserved.
Prepared Remarks
Nuance Third Quarter Fiscal 2017 Nuance is providing these prepared remarks, in combination with its press release, to allow shareholders and
analysts additional time and detail for analyzing our results in advance of our quarterly conference call.
These prepared remarks will not be read on the call.
The conference call will begin at 5:00 p.m. ET today and will include only brief opening comments followed by
questions and answers. To access the live broadcast, please visit the Investor Relations section of Nuance’s
website at http://investors.nuance.com. The call can also be heard by dialing 800-230-1092 or 612-234-9959
at least five minutes prior to the call and referencing code 426362. A replay will be available within 24 hours
of the announcement by dialing 800-475-6701 or 320-365-3844 and using the access code 426362.
Please see the section, “Discussion of Non-GAAP Financial Measures,” later in this document for more
details on our non-GAAP financial measures.
Summary of Business and Financial Trends We saw strong execution across our divisions in the third quarter, absent the June 27, 2017 malware incident,
driven by net new bookings, recurring revenue, and cash flow from operations. This performance was led by
continued strength in our Enterprise omni-channel offerings, Dragon Medical cloud solution, voice biometrics
solutions, and our automotive business. We remain confident that the positive trends of the past four quarters
will provide the foundation for sustainable long-term organic growth in fiscal 2018 after the majority of the
malware incident effects are behind us.
As Reported Q3 17 Results We reported GAAP revenue of $486.2 million for the third quarter, compared to $477.9 million a year ago.
Third quarter non-GAAP revenue was $495.6 million, which includes revenue lost to accounting treatment in
conjunction with acquisitions, compared to $484.9 million in the third quarter of fiscal 2016. Total recurring
revenue for the third quarter represented 73% of total GAAP revenue. On a non-GAAP basis, total recurring
revenue represented 73% of total non-GAAP revenue, compared to 71% a year ago. We reported net new
bookings for the third quarter of $438.5 million, up 21% from $362.9 million a year ago.
We reported GAAP net loss of $(27.8) million for the third quarter, or $(0.10) per share, compared to GAAP
net loss of $(11.8) million, or $(0.04) per share, in the third quarter of fiscal 2016. Non-GAAP net income was
$79.2 million, or $0.27 per diluted share, down from non-GAAP net income of $83.3 million, or $0.30 per
diluted share, in the third quarter of fiscal 2016. Our GAAP operating margin for the quarter was 2.9%, down
from 6.0% in the third quarter of fiscal 2016. Third quarter non-GAAP operating margin was 27.0%, down
from 27.2% in the third quarter of fiscal 2016. Cash flow from operations was $132.0 million in the third
quarter of fiscal 2017, up from $125.9 million in the third quarter of fiscal 2016.

2 2017 third quarter results Prepared remarks
August 8, 2017
© 2017 Nuance Communications, Inc. All rights reserved.
Pro Forma Q3 17 Results To aid the investment community in assessing the impact of the malware incident, we are providing certain
commentary and financial metrics on a pro forma basis as if the malware incident had not occurred, as shown
below:
• Net new bookings in the quarter of $448.7 million, up 24% compared to Q3 16;
• Organic non-GAAP revenue growth of 2% on a year-over-year basis;
• GAAP revenue of $501.6 million and non-GAAP revenue of $511.0 million;
• Recurring revenue at 73% of total GAAP and non-GAAP revenue, an increase of 200 basis points from
Q3 16;
• GAAP operating margin of 6.3% and non-GAAP operating margin of 28.9%;
• GAAP diluted EPS of $(0.04) and non-GAAP diluted EPS of $0.30; under our new effective tax
methodology; and,
• Cash Flow from Operations (CFFO) for Q3 17 of $132.0 million, with CFFO representing 151% of non-
GAAP net income, under our new effective tax methodology.
We delivered strong net new bookings on a pro forma basis driven by our growth businesses, specifically
Enterprise, where we had significant wins, including a record voice biometrics deal with a large global financial
institution. Additionally, we saw strength in our Enterprise omni-channel offerings, Dragon Medical cloud, and
automotive.
On a pro forma basis, Q3 17 was our second consecutive quarter of organic non-GAAP revenue growth,
reflecting strength in Enterprise omni-channel, automotive, and Dragon Medical cloud. Also, on a pro forma
basis we met our GAAP and non-GAAP revenue guidance ranges, and both metrics were up 5% on a year-over-
year basis as Q3 17 marked the first quarter where Dragon Medical cloud growth outpaced HIM transcription
declines.
We remained on target for our FY 17 margin goal, on a pro forma basis, with an increase in operating margins,
as a result of increased revenues while maintaining our cost discipline. Additionally, on a pro forma basis we
met the high end of our GAAP and non-GAAP EPS guidance ranges and were flat on a year-over-year basis.
3 2017 third quarter results Prepared remarks
August 8, 2017
© 2017 Nuance Communications, Inc. All rights reserved.
Table: As Reported, Incident Impact, and Pro Forma
Q3 2017 As
reported
Q3 2017
Incident Impact*
Q3 2017 Pro
Forma
Net new bookings $438.5 $(10.2) $448.7
Estimated 3-Year Value of Total On-
Demand Contracts
$2,359.5 $(240.2) $2,599.7
GAAP revenue $486.2 $(15.4) $501.6
GAAP Recurring revenue % of revenue 73% 73%
GAAP gross margin 55.5% (1.1)% 56.6%
GAAP operating margin 2.9% (3.4)% 6.3%
GAAP EPS $(0.10) $(0.06) $(0.04)
Non-GAAP revenue $495.6 $(15.4) $511.0
Non-GAAP Recurring revenue % of
revenue
73% 73%
Non-GAAP gross margin 61.5% (0.8)% 62.3%
Non-GAAP operating margin 27.0% (1.9)% 28.9%
Non-GAAP EPS $0.27 $(0.03) $0.30
CFFO as a % of Non-GAAP Net Income 167% 16% 151%
*Represents the incident impact included in our as reported results Key Financial Results for Third Quarter 2017 The following discussion shows key financial results on an as reported basis. These results include the impact of
the malware incident.
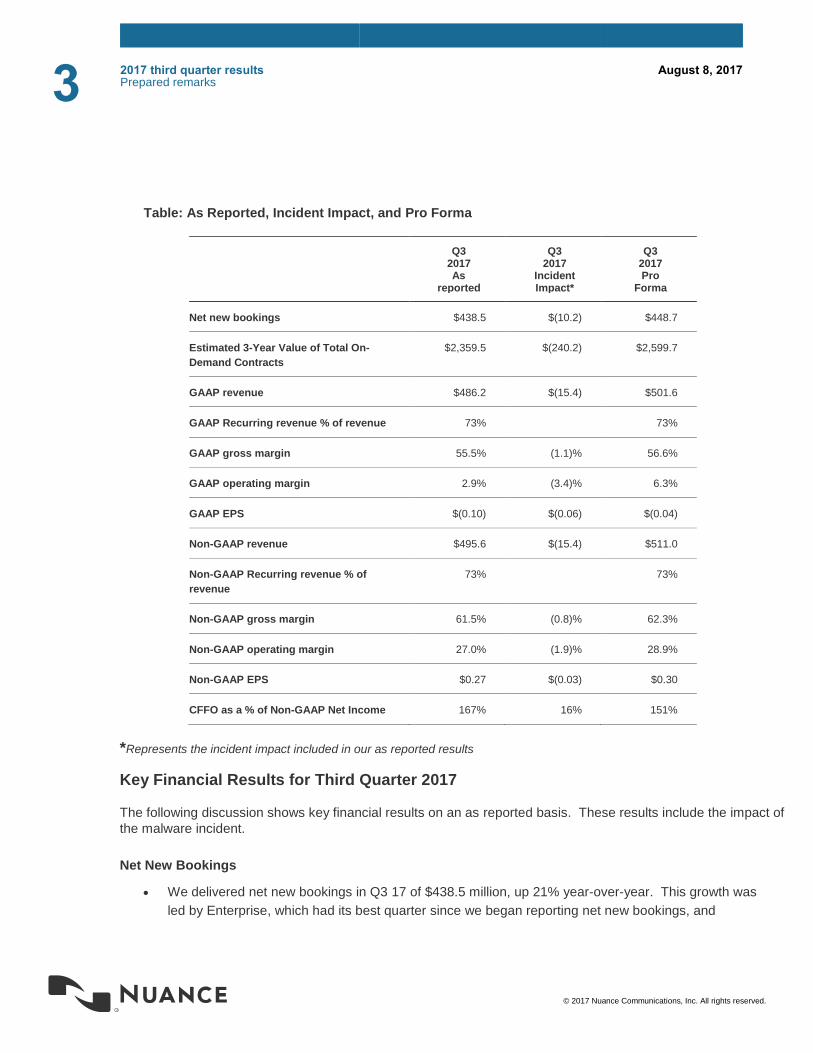
Net New Bookings
• We delivered net new bookings in Q3 17 of $438.5 million, up 21% year-over-year. This growth was
led by Enterprise, which had its best quarter since we began reporting net new bookings, and
4 2017 third quarter results Prepared remarks
August 8, 2017
© 2017 Nuance Communications, Inc. All rights reserved.
specifically by our voice biometrics and omni-channel offerings. Additionally, we continued to see
strong bookings for our Dragon Medical cloud solution and automotive business.
Table: Net New Bookings
Q1 2016
Q2 2016
Q3 2016
Q4 2016
FY 2016
Q1 2017
Q2 2017
Q3 2017
Net New
Bookings
(in millions)
$308.7 $313.7 $362.9 $516.9 $1,502.3 $380.3 $410.4 $438.5
Revenue
• In Q3 17, we achieved GAAP revenue of $486.2 million, up 2% from a year ago. Non-GAAP revenue
was $495.6 million, up 2% from a year ago, and down 1% on an organic basis. Our year-over-year
performance reflects growth across offerings in our Enterprise segment, Dragon Medical cloud,
automotive, mobile operator services, and core Imaging. These areas of growth were offset by
continued declines in HIM transcription related to expected levels of erosion, as well as lower
revenues due to the malware incident.
Transition to Recurring Revenue
• In Q3 17, GAAP recurring revenue was $354.5 million, compared to $339.7 million a year ago.
Non-GAAP recurring revenue was $363.2 million compared to $345.0 million a year ago. GAAP
and non-GAAP recurring revenue increased to 73% in Q3 17 compared to 71% in Q3 16.

5 2017 third quarter results Prepared remarks
August 8, 2017
© 2017 Nuance Communications, Inc. All rights reserved.
Table: Non-GAAP Revenue by Type and as % of Total Non-GAAP Revenue*
Q1 2016
Q2 2016
Q3 2016
Q4 2016
FY 2016
Q1 2017
Q2 2017
Q3 2017
Hosting ...................................................
$179.7 $187.1 $183.2 $189.3 $739.2 $195.6 $204.8 $192.5
% of Revenue .......................................
36% 38% 38% 37% 37% 39% 40% 39%
Maintenance and Support ......................................................
$80.2 $80.0 $82.5 $82.0 $324.7 $82.7 $82.0 $80.7
% of Revenue .......................................
16% 16% 17% 16% 16% 17% 16% 16%
Perpetual Product and Licensing ......................................................
$117.2 $90.2 $82.3 $100.5 $390.2 $79.3 $77.0 $74.4
% of Revenue .......................................
24% 19% 17% 20% 20% 16% 15% 15%
Recurring Product and Licensing ......................................................
$67.9 $74.1 $75.3 $81.7 $299.1 $78.2 $90.6 $85.8
% of Revenue .......................................
14% 15% 16% 16% 15% 16% 18% 17%
Professional Services ...................................................
$50.0 $55.9 $61.5 $58.9 $226.3 $60.3 $56.7 $62.2
% of Revenue .......................................
10% 11% 13% 11% 11% 12% 11% 13%
Total revenue ..............................................
$494.9 $487.4 $484.9 $512.4 $1,979.6 $496.0 $511.1 $495.6
Total Recurring Revenue * ......................................................
$332.5 $345.8 $345.0 $357.1 $1,380.3 $360.5 $381.7 $363.2
% of Revenue .......................................
67% 71% 71% 70% 70% 73% 75% 73%
* Total non-GAAP recurring revenue is the sum of recurring product and licensing, hosting, and maintenance and support
revenue as well as the portion of non-GAAP professional services revenue delivered under ongoing subscription
contracts. Non-GAAP recurring product and licensing revenue comprises term-based and ratable licenses as well as
revenue from royalty arrangements.
• At the end of the quarter, the Estimated 3-Year Value of Total On-Demand Contracts was $2,359.5
million, up from $2,161.1 million a year ago. The sequential quarterly decline from Q2 17 to Q3 17 of
$208.8 million was primarily driven by the $200.1 million estimated decline of 3 year HIM transcription
revenue expectations resulting primarily from the malware incident, offset by growth in Dragon
Medical cloud expectations.
Table: Estimated On-Demand Contract Values
Q1 2016
Q2 2016
Q3 2016
Q4 2016
Q1 2017
Q2 2017
Q3 2017
Estimated 3-Year Value of Total On-
Demand Contracts (in millions)
$2,245.3 $2,161.3 $2,161.1 $2,430.0 $2,499.4 $2,568.3 $2,359.5

6 2017 third quarter results Prepared remarks
August 8, 2017
© 2017 Nuance Communications, Inc. All rights reserved.
Gross Margin
• GAAP gross margin in Q3 17 was 55.5%, a decrease of 100 basis points year-over-year. Q3 17 non-
GAAP gross margin was 61.5%, a decrease of 50 basis points year-over-year. The reductions in
both GAAP and non-GAAP gross margins were a result of the lost revenues from the malware
incident.
Operating Expenses and Operating Margin
• Q3 17 GAAP operating expenses were $255.7 million, compared to $241.3 million a year ago. GAAP
operating margin was 2.9%, a decrease of 310 basis points year-over-year. Q3 17 non-GAAP
operating expenses were $170.9 million, compared to $168.8 million a year ago. Q3 17 non-GAAP
operating margin was 27.0%, a decrease of 20 basis points year-over-year as a result of the lost
revenues from the malware incident.
Interest Expense
• GAAP net interest expense was $38.5 million in Q3 17, up $6.3 million year-over-year. Non-GAAP
net cash interest expense was $22.3 million in Q3 17, up $3.0 million year-over-year. The increase in
non-GAAP net cash interest expense in Q3 17 is primarily a result of capital market activities,
including the issuance in December 2016 of $500 million in senior 5.625% notes and the issuance in
March 2017 of $350 million in 1.25% convertible notes, offset by the impact of the retirement of $600
million of our high-yield 5.375% bonds in January 2017.
Provision for Income Taxes
• Q3 17 GAAP provision for income taxes was $2.6 million, compared to $7.8 million a year ago.
• Q3 17 non-GAAP provision for income taxes was $31.3 million, compared to $29.6 million a year ago.
The non-GAAP tax rate under the new method was 28.4% in Q3 17, compared to 26.2% a year ago.
The increase in the non-GAAP income tax rate on a year-over-year basis was mainly due to the
higher level of pre-tax income being generated in the United States.
Earnings Performance
• GAAP EPS in Q3 17 was $(0.10) per share, compared to $(0.04) a year ago. In Q3 17, non-GAAP
EPS was $0.27, down $0.03 from a year ago as a result of the lost revenues due to the malware
incident.
• During Q3 17, we did not repurchase any shares of our common stock. As of June 30, 2017, we had
approximately $193.4 million remaining under the Board’s repurchase program authorization.

7 2017 third quarter results Prepared remarks
August 8, 2017
© 2017 Nuance Communications, Inc. All rights reserved.
Cash Flow from Operations (CFFO)
• Q3 17 CFFO was $132.0 million, an increase of 5% year over year. CFFO as a percent of non-GAAP
net income was 167% in Q3 17.
Table: Operating Cash Flow
Q1 2016
Q2 2016
Q3 2016
Q4 2016
FY 2016
Q1 2017
Q2 2017
Q3 2017
Cash Flow from
Operations (in millions)
$141.1 $159.9 $125.9 $138.9 $565.8 $124.9 $125.4 $132.0
• As of June 30, 2017, our balance of cash, cash equivalents and marketable securities was $901.1
million, an increase from $831.2 million at March 31, 2017. This increase was driven from cash flows
from operations during the quarter partially offset by $54 million of cash outflows from investing activities
during the quarter.
Days Sales Outstanding (DSO)
• In Q3 17, DSO was 66 days, down two days compared to a year ago.
Table: Days Sales Outstanding (DSO)
Q1 2016
Q2 2016
Q3 2016
Q4 2016
Q1 2017
Q2 2017
Q3 2017
Days Sales
Outstanding
69 68 68 67 71 69 66
Deferred Revenue
• We ended Q3 17 with deferred revenue of $798.7 million, up 9.5% from a year ago. This growth was
primarily driven by our hosting solutions, most notably for our automotive connected services in our
Mobile Segment.
Table: Total Deferred Revenue
Q1 2016
Q2 2016
Q3 2016
Q4 2016
Q1 2017
Q2 2017
Q3 2017
Total Deferred
Revenue (in millions)
$732.7 $748.5 $729.1 $736.1 $802.5 $802.4 $798.7

8 2017 third quarter results Prepared remarks
August 8, 2017
© 2017 Nuance Communications, Inc. All rights reserved.
Segment Discussions The following segment discussions include financial results on an as reported basis unless noted as otherwise in
the text. Healthcare
In our Healthcare segment, we continued to generate solid net new bookings in the quarter for our Dragon
Medical cloud offering. Segment revenue was $232.6 million, down approximately 3% on a year-over-year
basis. We estimate that segment revenue was negatively affected by approximately $11.0 million in Q3, and
absent the malware incident would have been up modestly year-over-year and flat on an organic year-over-
year basis. Excluding our estimated effects of the malware incident, we believe that Q3 17 would have been
the first quarter that growth in Dragon Medical cloud would have outpaced the decline from our HIM
transcription business. Segment margin was 30%, down 210 basis points over the same period last year.
We estimate that the malware incident negatively affected our segment margin by approximately 290 basis
points and, absent the incident, segment margin would have been up approximately 80 basis points driven by
strength in clinical documentation hosting margins and reduced operating expenses.
Highlights for Healthcare include:
• Q3 was another strong quarter for net new bookings driven by clinical documentation offerings;
• We saw continued demand for our integrated Healthcare offerings as notable accounts, such as
HSHS, BayCare, University of Maryland, and Cedars-Sinai, expanded their investments in our
solution portfolio;
• We expanded our international presence with an EHR partner-driven win with a France-based
healthcare institution for our clinical documentation solutions;
• We generated strong bookings for our Clintegrity offerings as healthcare insitutions expand and
standardize their regulatory and performance analytics reporting capabilities on our Quality Solutions
technology; and,
• We experienced positive momentum for our diagnostics solutions with key wins in Q3, including
Desert Radiology and Good Shepherd Health System, as radiologists adopt our solutions that
streamline workflows and increase productivity.

9 2017 third quarter results Prepared remarks
August 8, 2017
© 2017 Nuance Communications, Inc. All rights reserved.
Table: Healthcare Lines
Q1 2016
Q2 2016
Q3 2016
Q4 2016
Q1 2017
Q2 2017
Q3 2017
Annualized line run-rate in healthcare on-demand business (in billions)
5.140 5.130 5.003 4.785 4.651 4.743 4.345
Enterprise
Enterprise recorded its sixth consecutive quarter of year-over-year organic revenue growth with segment
revenue of $112.1 million, up 18% year-over-year and up 6% on an organic year-over-year basis. We
estimate that the malware incident negatively affected segment revenue by approximately $0.6 million in Q3.
Segment margin was 31%, a decrease of 190 basis points from a year ago due to growth in cloud services
revenue at lower gross margins. The malware incident did not have a material effect on our segment margin.
Highlights for Enterprise include:
• We drove strength across many of our businesses with marquee wins, such as Commonwealth
Bank of Australia, Telstra, Kotak Bank, Entergy, and New York Life;
• We continued momentum for our security and biometrics offerings with a record net new bookings
contract signed with a large global financial institution, as well as additional design wins with
Leadway Assurance and Union National Bank and an expansion of our strategic relationship with
HSBC;
• We delivered double digit organic growth for our omni-channel cloud offerings, specifically digital
virtual and live chat, driven by increasing demand for automated customer engagement solutions at
large enterprises worldwide, including notable Q3 wins, such as AT&T, Esurance, and Deutsche
Telekom;
• We saw increased demand for our Nuance Transcription Engine services as we secured wins, such
as Direct Energie, as customers select our solutions to accurately and quickly transform significant
volumes of recorded audio into actionable insights;
• We were named a strategic Customer Service Platform partner for Apple Business Chat Services
(BCS), which integrates our digital virtual and live chat solutions with Apple Messages, and we have
started pilots of this solution with some of our strategic customers;
• We introduced Nina for Amazon Alexa, the first Enterprise Virtual Assistant for the Smart Home;
• We delivered strong bookings with key channel partners, powered by growing demand for our
customer engagement portfolio; and,
• Forrester Research ranked our Nina offering the number one digital chatbot and virtual assistant for
Enterprise customer service.

10 2017 third quarter results Prepared remarks
August 8, 2017
© 2017 Nuance Communications, Inc. All rights reserved.
Mobile
Our Mobile segment continued its organic revenue growth trend in Q3, driven by automotive and devices.
Segment revenue was $101.5 million in Q3 up 11% year-over-year and up 7% on an organic year-over-year
basis. We estimate that the malware incident negatively affected segment revenue by approximately $0.2
million in Q3. Segment margin was 41%, an increase of 700 basis points from a year ago driven by improved
cloud margins and lower research and development expenses. The malware incident did not have a material
effect on our segment margin.
Highlights for the segment include:
• Our automotive business continued to lead the Mobile segment, with net new bookings owing to
strategic design wins from Harman, Opel, Delphi, Bosch, and BMW as our customers continue to
integrate our hybrid embedded-connected automotive AI platform, Dragon Drive, as part of their core
Human Machine Interface (HMI) experience;
• We expanded our telecommunications and mobile service operator business globally, including wins
from Oi, Vivo, VMS, Claro, Vonage, Sasktel, and Optus, as we empower service providers with voice,
artificial intelligence, and data analytics capabilities to drive subscriber marketing and engagement;
• We experienced continued adoption of our Dragon TV and Smart Home offerings, extending further
across Europe, with Q3 wins including Turkish TV manufacturer, Arcelik;
• We secured emerging and IoT wins with major Chinese and Japanese OEMs to bring conversational
experiences to mobile and emerging Smart Home devices; and,
• We increased recurring revenue across the business, led by product and licensing revenue in our
automotive business.
Imaging
Our Imaging business segment revenue was $49.4 million, down 13% on a year-over-year basis, due to lower
MFP revenue and the business disruption from the malware incident. We estimate that the malware incident
negatively affected segment revenue by approximately $3.6 million in Q3. Absent the malware incident, our
Imaging business would have been down approximately 7% year-over-year in the third quarter of fiscal 2017.
The decline was driven by lower MFP revenue as we continue our remediation work with the Imaging sales
team. Segment profit margin was 34% in Q3 17, down 190 basis points from Q3 of last year. We estimate
that the malware incident negatively affected our segment margins by approximately 350 basis points, and
absent the malware incident, we would have experienced an increase of 160 basis points in segment margin
relative to Q3 of last year due to reduced operating expenses.
Highlights for the segment include:
• We achieved sequential improvement in net new bookings, bolstered by a new strategic agreement
with a major MFP supplier and notable wins for our print and capture solutions, and,
• We were named leading print management vendor by IDC for the third consecutive year.

11 2017 third quarter results Prepared remarks
August 8, 2017
© 2017 Nuance Communications, Inc. All rights reserved.
Table: Non-GAAP Revenue by Segment
Q1
2016 Q2
2016 Q3
2016 Q4
2016 FY
2016 Q1
2017 Q2
2017 Q3
2017
Healthcare .......................................................
$248.1 $244.4 $241.0 $239.8 $973.3 $239.2 $238.5 $232.6
Yr/yr. Organic Growth ............................................. 1% 2% (5)% (11)% (4)% (6)% (5)% (5)%
Mobile ....................................................
$96.4 $91.8 $91.8 $97.2 $377.3 $91.8 $100.2 $101.5
Yr/yr. Organic Growth ............................................. (0)% (16)% (4)% (9)% (8)% (5)% 8% 7%
Enterprise ....................................................
$88.8 $94.4 $95.2 $109.0 $387.5 $112.9 $119.4 $112.1
Yr/yr. Organic Growth ............................................. (2)% 13% 10% 16% 9% 15% 14% 6%
Imaging .......................................................
$61.6 $56.7 $56.8 $66.4 $241.6 $52.1 $53.0 $49.4
Yr/yr. Organic Growth ............................................. 3% (5)% 1% 7% 2% (15)% (7)% (13)%
Total revenue ..................................................
$494.9 $487.4 $484.9 $512.4 $1,979.6 $496.0 $511.1 $495.6
Yr/yr. Organic Growth ............................................. 0% (1)% (1)% (4)% (1)% (3)% 1% (1)%
Yr/yr. Constant Currency Organic Growth ............................................. (3)% 1% (1)%
Table: Non-GAAP Segment Profit
Q1
2016 Q2
2016 Q3
2016 Q4
2016 FY
2016 Q1
2017 Q2
2017 Q3
2017
Healthcare .......................................................
$81.2 $78.4 $78.1 $75.7 $313.5 $78.6 $83.3 $70.5
Segment Profit as % of Segment Revenue ............................................. 33% 32% 32% 32% 32% 33% 35% 30%
Mobile ....................................................
$33.8 $33.4 $31.0 $35.2 $133.4 $33.5 $40.4 $41.4
Segment Profit as % of Segment Revenue ............................................. 35% 36% 34% 36% 35% 36% 40% 41%
Enterprise ....................................................
$26.2 $34.1 $31.1 $38.6 $130.0 $32.0 $41.8 $34.4
Segment Profit as % of Segment Revenue ............................................. 30% 36% 33% 35% 34% 28% 35% 31%
Imaging ....................................................
$27.0 $22.2 $20.6 $31.0 $100.8 $17.6 $18.5 $16.9
Segment Profit as % of Segment Revenue ............................................. 44% 39% 36% 47% 42% 34% 35% 34%
Total segment profit ..................................................
$168.2 $168.1 $160.8 $180.6 $677.6 $161.6 $184.0 $163.2
Total segment profit as % of total segment revenue ............................................. 34% 34% 33% 35% 34% 33% 36% 33%

12 2017 third quarter results Prepared remarks
August 8, 2017
© 2017 Nuance Communications, Inc. All rights reserved.
Malware Incident Update
As previously reported, on June 27, 2017, Nuance was victim of the sophisticated NotPetya malware incident
that affected thousands of companies globally. The malware affected certain Nuance systems, including
systems used by our healthcare customers, primarily for transcription services, as well as systems used by
our Imaging division to receive and process orders. Importantly, no customer data was altered, lost, or
removed by the malware and no Nuance software products were altered by the malware.
Since the incident, we have enhanced our security against similar future incidents, including hardening the
security configurations of endpoints, deploying advanced endpoint prevention and detection software, and
enhancing network security measures. We are upgrading our network architecture and IT policies as part of
these recovery efforts to ensure we emerge from this incident with a safer and more secure operating
environment.
In addition, we have made rapid progress in our restoration efforts for customer-facing systems. In
Healthcare, our team has systematically brought hospitals back online and as of today has restored
functionality for substantially all of our clients for our flagship eScription LH transcription platform. Within
Imaging, our licensing and activation systems for customers and partners were restored in July. As
referenced in earlier disclosures, the effect on our Mobile and Enterprise was immaterial.
While we have continued to make significant progress bringing our transcription customers back online
through July and into August, the period of down time coupled with certain other impacts to revenue related to
the malware incident will have a material effect on our revenue in the fourth quarter of fiscal 2017. There will
be continued impacts to fiscal 2018 transcription revenues, as discussed below. In addition, we expect to
incur material expenses related to remediation and restoration efforts in both the fourth quarter of fiscal 2017
and into fiscal 2018.
Guidance and Outlook In the fourth quarter and fiscal year of 2017, we expect a continuation of the positive market trends we have
experienced in recent quarters. Prior to the malware incident, we were on track for a strong fourth quarter in
line with our previous guidance. As a result of the malware incident, we expect a material financial impact
within the fourth quarter of fiscal 2017, which will also have impacts continuing into fiscal 2018, due to the
business disruption, particularly in our HIM transcription business, as well as the associated costs related to
restoring and enhancing our security environment.
Our pipeline coverage remains strong as we continue to outperform our expectations, giving us confidence to
narrow our net new bookings growth guidance range for FY 17 from between 6% and 10% to between 8%
13 2017 third quarter results Prepared remarks
August 8, 2017
© 2017 Nuance Communications, Inc. All rights reserved.
and 10%. We expect FY 17 performance to continue to be driven by Dragon Medical cloud, automotive,
mobile operator services and Enterprise solutions, including omni-channel and voice biometrics.
Growth in these businesses will be offset by the effects of the malware incident, specifically lost production
time in our HIM transcription business, as well as estimated customer-related credits. We also expect less
significant impacts to revenue in our other business segments due to delayed delivery on previously expected
product launches and customer deliverables. As a result of the incident, we are revising our full fiscal year
2017 GAAP revenue guidance range to $1,906 million to $1,936 million and non-GAAP revenue guidance
range to $1,945 million to $1,975 million, which represents a reduction of $90 million from the midpoint of our
May 2017 guidance range.
For reference, we estimate that, had the malware incident not occurred, FY 17 GAAP revenues on a pro
forma basis would have been between $1,996 million and $2,016 million and non-GAAP revenues on a pro
forma basis would have been between $2,035 million and $2,055 million.
We are also revising our organic revenue growth target from approximately 1% to (4)% as a consequence of
the malware incident. The impact will be primarily related to our HIM transcription business as we reactivate
customers during the quarter.
We are now targeting a gross margin of approximately 62% and an operating margin in the range of 25% to
26% for FY 17. This revised guidance accounts for lower revenues due to the malware incident as noted
above, along with increased costs for enhanced security measures.
Similarly, for EPS we are revising our GAAP range to $(0.64) to $(0.55) and non-GAAP range to $0.96 to
$1.03, which represents a reduction of $0.16 to our previous May 2017 midpoint guidance. We estimate FY
17 GAAP earnings per share on a pro forma basis would have been $(0.33) to $(0.27) and non-GAAP
earnings per share on a pro forma basis would have been $1.13 to $1.18.
As compared to our recent trends, CFFO will be materially reduced in the fourth quarter due to the malware
incident. This is due to lost HIM transcription production in June, July, and August of 2017, which has
resulted in delayed collections and lost billings, and therefore lower revenue and collections, in the quarter. In
addition, we expect to provide credits to certain customers during the fourth quarter to resolve issues related
to the malware incident. Lastly, the significant and incremental costs we have incurred and expect to incur in
Q4 17 related to the incident will largely be paid during the fourth quarter.
We continue to focus on making progress on our recurring revenue model transitions and as a result of the
malware incident, which impacted our most significant declining business, HIM transcription, we are seeing a
faster transition to our Dragon Medical cloud offering.

14 2017 third quarter results Prepared remarks
August 8, 2017
© 2017 Nuance Communications, Inc. All rights reserved.
After taking these factors into account, we expect the following for the fourth quarter fiscal 2017 (in millions,
except for share amounts):
Low High
Q4 2017 Guidance Incident
impact
Pro Forma Guidance Incident
impact
Pro Forma
GAAP revenue $433.0 $75.0 $508.0 $463.0 $65.0 $528.0
Non-GAAP revenue $442.0 $75.0 $517.0 $472.0 $65.0 $537.0
GAAP EPS $(0.35) $0.26 $(0.09) $(0.26) $0.23 $(0.03)
Non-GAAP EPS $0.12 $0.14 $0.26 $0.19 $0.12 $0.31
For the full year fiscal 2017 (in millions, except for share amounts):
Low High
2017 Guidance Incident
impact
Pro Forma Guidance Incident
impact
Pro Forma
GAAP revenue $1,906.0 $90.0 $1,996.0 $1,936.0 $80.0 $2,016.0
Non-GAAP revenue $1,945.0 $90.0 $2,035.0 $1,975.0 $80.0 $2,055.0
GAAP EPS $(0.64) $0.31 $(0.33) $(0.55) $0.28 $(0.27)
Non-GAAP EPS $0.96 $0.17 $1.13 $1.03 $0.15 $1.18
15 2017 third quarter results Prepared remarks
August 8, 2017
© 2017 Nuance Communications, Inc. All rights reserved.
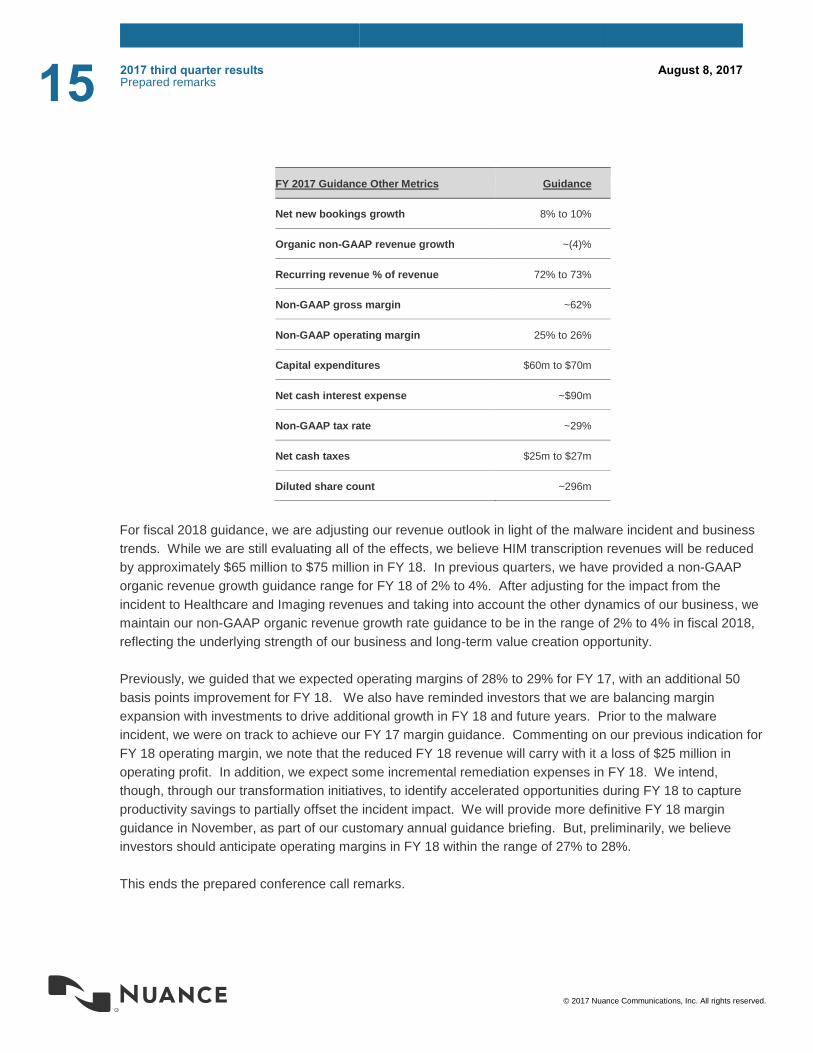
FY 2017 Guidance Other Metrics Guidance
Net new bookings growth 8% to 10%
Organic non-GAAP revenue growth ~(4)%
Recurring revenue % of revenue 72% to 73%
Non-GAAP gross margin ~62%
Non-GAAP operating margin 25% to 26%
Capital expenditures $60m to $70m
Net cash interest expense ~$90m
Non-GAAP tax rate ~29%
Net cash taxes $25m to $27m
Diluted share count ~296m
For fiscal 2018 guidance, we are adjusting our revenue outlook in light of the malware incident and business
trends. While we are still evaluating all of the effects, we believe HIM transcription revenues will be reduced
by approximately $65 million to $75 million in FY 18. In previous quarters, we have provided a non-GAAP
organic revenue growth guidance range for FY 18 of 2% to 4%. After adjusting for the impact from the
incident to Healthcare and Imaging revenues and taking into account the other dynamics of our business, we
maintain our non-GAAP organic revenue growth rate guidance to be in the range of 2% to 4% in fiscal 2018,
reflecting the underlying strength of our business and long-term value creation opportunity.
Previously, we guided that we expected operating margins of 28% to 29% for FY 17, with an additional 50
basis points improvement for FY 18. We also have reminded investors that we are balancing margin
expansion with investments to drive additional growth in FY 18 and future years. Prior to the malware
incident, we were on track to achieve our FY 17 margin guidance. Commenting on our previous indication for
FY 18 operating margin, we note that the reduced FY 18 revenue will carry with it a loss of $25 million in
operating profit. In addition, we expect some incremental remediation expenses in FY 18. We intend,
though, through our transformation initiatives, to identify accelerated opportunities during FY 18 to capture
productivity savings to partially offset the incident impact. We will provide more definitive FY 18 margin
guidance in November, as part of our customary annual guidance briefing. But, preliminarily, we believe
investors should anticipate operating margins in FY 18 within the range of 27% to 28%.
This ends the prepared conference call remarks.

16 2017 third quarter results Prepared remarks
August 8, 2017
© 2017 Nuance Communications, Inc. All rights reserved.
Definitions Certain supplemental data provided in the prepared call remarks above are based upon internal Nuance
definitions that are important for the reader to understand.
Non-GAAP Organic Revenue Growth. Organic revenue growth is calculated by comparing current period
non-GAAP revenue to non-GAAP revenue from the corresponding prior-year period. For purposes of this
calculation, prior period non-GAAP revenue is adjusted to include revenue from companies acquired by
Nuance as if we had owned the acquired businesses in all periods presented. Non-GAAP organic revenue
growth on a constant currency basis is calculated using current period non-GAAP revenue for entities
reporting in currencies other than United States dollars, excluding United States dollar-denominated
transactions recorded in those entities, converted into United States dollars using the average exchange rates
from the prior year period rather than the actual exchange rates in effect during the current period.
Bookings. Bookings represent the estimated gross revenue value of transactions at the time of contract
execution, except for maintenance and support offerings. For fixed price contracts, the bookings value
represents the gross total contract value. For contracts where revenue is based on transaction volume, the
bookings value represents the contract price multiplied by the estimated future transaction volume during the
contract term, whether or not such transaction volumes are guaranteed under a minimum commitment clause.
Actual results could be different than our initial estimates. The maintenance and support bookings value
represents the amounts billed in the period the customer is invoiced. Because of the inherent estimates
required to determine bookings and the fact that the actual resultant revenue may differ from our initial
bookings estimates, we consider bookings one indicator of potential future revenue and not as an arithmetic
measure of backlog.
Net new bookings. Net new bookings represents the estimated revenue value at the time of contract
execution from new contractual arrangements or the estimated revenue value incremental to the portion of
value that will be renewed under pre-existing arrangements. Constant currency for net new bookings is
calculated using current period net new bookings denominated in currencies other than United States dollars
converted into United States dollars using the average exchange rate for those currencies from the prior year
period rather than the actual exchange rate in effect during the current period.
Annualized line run-rate in Nuance’s healthcare on-demand business. We determine this run rate using
billed equivalent line counts in a given quarter, multiplied by four.
Estimated 3-year value of total on-demand contracts. We determine this value as of the end of the period
reported, by using our best estimate of three years of anticipated future revenue streams under signed on-
demand contracts then in place, whether or not they are guaranteed through a minimum commitment clause.
Our best estimate is based on assumptions used in evaluating the contracts and determining sales
compensation, adjusted for changes in estimated launch dates, actual volumes achieved and other factors
deemed relevant. For contracts with an expiration date beyond three years, we include only the value
expected within three years. For other contracts, we assume renewal consistent with historic renewal rates
unless there is a known cancellation. Investors should be aware that most of these contracts are priced by
volume of usage and typically have no or low minimum commitments. Actual revenue could vary from our
estimates due to factors such as cancellations, non-renewals or volume fluctuations.
Segment profit. Segment profit reflects the direct controllable costs of each segment together with an
allocation of sales and corporate marketing expenses, and certain research and development project costs

17 2017 third quarter results Prepared remarks
August 8, 2017
© 2017 Nuance Communications, Inc. All rights reserved.
that benefit multiple product offerings. Segment profit represents income from operations excluding stock-
based compensation, amortization of intangible assets, acquisition-related costs, net, restructuring and other
charges, net, costs associated with intellectual property collaboration agreements, other income (expense),
net and certain unallocated corporate expenses.
Safe Harbor and Forward-Looking Statements Statements in this document regarding future performance and our management’s future expectations,
beliefs, goals, plans or prospects constitute forward-looking statements within the meaning of the Private
Securities Litigation Reform Act of 1995. Any statements that are not statements of historical fact (including
statements containing the words “believes,” “plans,” “anticipates,” “expects,” or “estimates” or similar
expressions) should also be considered to be forward-looking statements. There are a number of important
factors that could cause actual results or events to differ materially from those indicated by such forward-
looking statements, including but not limited to: fluctuations in demand for our existing and future products;
further unanticipated costs resulting from the malware incident including potential costs associated with
litigation or governmental investigations that may result from the incident; changes to economic conditions in
the United States and internationally; fluctuating currency rates, our ability to control and successfully manage
our expenses and cash position; our ability to execute our transformation program to reduce costs and
optimize processes; the effects of competition, including pricing pressure; possible quality issues in our
products and technologies; our ability to successfully integrate operations and employees of acquired
businesses; the conversion rate of bookings into revenue; the ability to realize anticipated synergies from
acquired businesses; and the other factors described in our Annual Report on Form 10-K for the fiscal year
ended September 30, 2016 and in our Quarterly Report on Form 10-Q. We disclaim any obligation to update
any forward-looking statements as a result of developments occurring after the date of this document.
Discussion of non-GAAP Financial Measures We utilize a number of different financial measures, both Generally Accepted Accounting Principles (“GAAP”)
and non-GAAP, in analyzing and assessing the overall performance of the business, for making operating
decisions and for forecasting and planning for future periods. Our annual financial plan is prepared both on a
GAAP and non-GAAP basis, and the non-GAAP annual financial plan is approved by our board of directors.
Continuous budgeting and forecasting for revenue and expenses are conducted on a consistent non-GAAP
basis (in addition to GAAP) and actual results on a non-GAAP basis are assessed against the non-GAAP
annual financial plan. The board of directors and management utilize these non-GAAP measures and results
(in addition to the GAAP results) to determine our allocation of resources. In addition and as a consequence
of the importance of these measures in managing the business, we use non-GAAP measures and results in
the evaluation process to establish management’s compensation. For example, our annual bonus program
payments are based upon the achievement of consolidated non-GAAP revenue and consolidated non-GAAP
earnings per share financial targets. We consider the use of non-GAAP revenue helpful in understanding the
performance of our business, as it excludes the purchase accounting impact on acquired deferred revenue
and other acquisition-related adjustments to revenue. We also consider the use of non-GAAP earnings per
share helpful in assessing the organic performance of the continuing operations of our business. By organic
performance we mean performance as if we had owned an acquired business in the same period a year ago.
By constant currency organic performance we mean performance excluding the effect of current foreign
currency rate fluctuations. By continuing operations we mean the ongoing results of the business excluding
certain unplanned costs. While our management uses these non-GAAP financial measures as a tool to
enhance their understanding of certain aspects of our financial performance, our management does not
consider these measures to be a substitute for, or superior to, the information provided by GAAP financial

18 2017 third quarter results Prepared remarks
August 8, 2017
© 2017 Nuance Communications, Inc. All rights reserved.
statements. Consistent with this approach, we believe that disclosing non-GAAP financial measures to the
readers of our financial statements provides such readers with useful supplemental data that, while not a
substitute for GAAP financial statements, allows for greater transparency in the review of our financial and
operational performance. In assessing the overall health of the business during the three and nine months
ended June 30, 2017 and 2016, our management has either included or excluded items in seven general
categories, each of which is described below.
Acquisition-related revenue and cost of revenue.
We provide supplementary non-GAAP financial measures of revenue, which include revenue related to
acquisitions, primarily from TouchCommerce, Notable Solutions, mCarbon, and Quantim for the three and
nine months ended June 30, 2017, that we would have recognized but for the purchase accounting treatment
of these transactions. Non-GAAP revenue also includes revenue that we would have recognized had we not
acquired intellectual property and other assets from the same customer. Because GAAP accounting requires
the elimination of this revenue, GAAP results alone do not fully capture all of our economic activities. These
non-GAAP adjustments are intended to reflect the full amount of such revenue. We include non-GAAP
revenue and cost of revenue to allow for more complete comparisons to the financial results of historical
operations, forward-looking guidance and the financial results of peer companies. We believe these
adjustments are useful to management and investors as a measure of the ongoing performance of the
business because, although we cannot be certain that customers will renew their contracts, we have
historically experienced high renewal rates on maintenance and support agreements and other customer
contracts. Additionally, although acquisition-related revenue adjustments are non-recurring with respect to
past acquisitions, we generally will incur these adjustments in connection with any future acquisitions.
Acquisition-related costs, net.
In recent years, we have completed a number of acquisitions, which result in operating expenses, which
would not otherwise have been incurred. We provide supplementary non-GAAP financial measures, which
exclude certain transition, integration and other acquisition-related expense items resulting from acquisitions,
to allow more accurate comparisons of the financial results to historical operations, forward looking guidance
and the financial results of less acquisitive peer companies. We consider these types of costs and
adjustments to be largely unpredictable and dependent on a significant number of factors that are outside of
our control. Furthermore, we do not consider these acquisition-related costs and adjustments to be related to
the organic continuing operations of the acquired businesses and are generally not relevant to assessing or
estimating the long-term performance of the acquired assets. In addition, the size, complexity and/or volume
of past acquisitions, which often drives the magnitude of acquisition related costs, may not be indicative of the
size, complexity and/or volume of future acquisitions. By excluding acquisition-related costs and adjustments
from our non-GAAP measures, management is better able to evaluate our ability to utilize our existing assets
and estimate the long-term value that acquired assets will generate for us. We believe that providing a
supplemental non-GAAP measure, which excludes these items allows management and investors to consider
the ongoing operations of the business both with, and without, such expenses.
These acquisition-related costs fall into the following categories: (i) transition and integration costs; (ii)
professional service fees and expenses; and (iii) acquisition-related adjustments. Although these expenses
are not recurring with respect to past acquisitions, we expect to incur these expenses in connection with any
future acquisitions. These categories are further discussed as follows:
(i) Transition and integration costs. Transition and integration costs include retention payments,
transitional employee costs, earn-out payments treated as compensation expense, as well as the costs
of integration-related services, including services provided by third parties.

19 2017 third quarter results Prepared remarks
August 8, 2017
© 2017 Nuance Communications, Inc. All rights reserved.
(ii) Professional service fees and expenses. Professional service fees and expenses include financial
advisory, legal, accounting and other outside services in connection with acquisition activities, and
disputes and regulatory matters related to acquired entities.
(iii) Acquisition-related adjustments. Acquisition-related adjustments include items that are required to be
marked to fair value each reporting period, such as contingent consideration, and other items related to
acquisitions for which the measurement period has ended, such as gains or losses on settlements of
pre-acquisition contingencies.
Amortization of acquired intangible assets.
We provide supplemental non-GAAP financial measures, which exclude the amortization of acquired
intangible assets. Amortization of acquired intangibles assets is inconsistent in amount and frequency and is
significantly impacted by the timing and size of acquisitions. Providing a supplemental measure which
excludes these charges allows management and investors to evaluate results “as-if” the acquired intangible
assets had been developed internally rather than acquired and, therefore, provides a supplemental measure
of performance in which our acquired intellectual property is treated in a comparable manner to our internally
developed intellectual property. Although we exclude amortization of acquired intangible assets from our non-
GAAP expenses, we believe that it is important for investors to understand that such intangible assets
contribute to revenue generation. Amortization of intangible assets that relate to past acquisitions will recur in
future periods until such intangible assets have been fully amortized. Future acquisitions may result in the
amortization of additional intangible assets.
Costs associated with IP collaboration agreement.
We entered into IP collaboration agreements with a third party to gain access to the third party's extensive
speech recognition and natural language and semantic processing technologies. The contracts had terms
ranging between five and six years all ending during or before fiscal year 2016. Depending on the agreement,
some or all intellectual property derived from these collaborations is jointly owned by the two parties. We had
sole rights to commercialize a majority of the developed intellectual property for periods ranging between two
to six years, depending on the agreement. These sole-commercialization rights expired in fiscal year 2016.
We consider these long-term contracts and the resulting acquisitions of intellectual property from this third-
party over the agreements’ terms to be an investing activity occurring outside of our normal, organic,
continuing operating activities. We are therefore presenting supplemental non-GAAP financial measures to
show the results excluding these expenses. We do not exclude from our non-GAAP results the corresponding
revenue, if any, generated from these collaboration efforts. Costs associated with the research and
development portion of the agreements have been excluded from research and development expense and
costs for the marketing exclusivity period are excluded from sales and marketing expense.
Non-cash expenses.
We provide supplementary non-GAAP financial measures relative to the following non-cash expenses: (i)
stock-based compensation; and (ii) non-cash interest expense. These items are further discussed as follows:
Stock-based compensation. Stock-based compensation consists primarily of expenses for employee
restricted stock and restricted stock unit awards, including awards associated with acquisitions. We evaluate
our financial performance both with and without these expenses because they are non-cash, are generally not
controllable in the short-term and can vary significantly based on the Company’s stock price, timing, size and
nature of awards granted, including the timing and amount of new grants associated with acquisitions. We do

20 2017 third quarter results Prepared remarks
August 8, 2017
© 2017 Nuance Communications, Inc. All rights reserved.
not include such expenses in our operating plans. We expect stock-based compensation to continue and may
vary significantly in future periods.
Non-cash interest expense. We also exclude non-cash interest expense arising from the accretion of the
equity component of our convertible debentures, amortization of deferred debt issuance costs, and accretion
of debt discount and debt premium. We evaluate our financial performance both with and without these non-
cash interest expenses because the non-cash component often varies significantly from period-to-period
based on the timing, term and amount of the debentures. These non-cash expenses will continue in future
periods.
Other Expenses.
We provide supplementary non-GAAP financial measures that exclude certain other expenses that arise
outside of the ordinary course of continuing operations in order to measure the operating performance of the
business both with and without these expenses. By providing this information, we believe management, as
well as other users of our financial statements, are better able to understand the financial performance of our
continuing operations. Expenses excluded are items such as restructuring and other charges, net, loss on
extinguishment of debt, and contributions to the Nuance Foundation which was established to provide grants
to educational institutions and other non-profit organizations to advance charitable, scientific, literary or
educational purposes. Other items such as consulting and professional services fees related to assessing
strategic alternatives and our transformation program, implementation of the new revenue recognition
standard (ASC 606), expenses associated with the malware incident and remediation thereof, and gains or
losses on non-controlling strategic equity interests, are also excluded.
Non-GAAP Income Tax provision.
Effective Q2 2017, we changed our method of calculating our non-GAAP income tax provision. Under the
prior method, we calculated our non-GAAP tax provision using a cash tax method to reflect the estimated
amount we expected to pay or receive in taxes related to the period, which is equivalent to our GAAP current
tax provision. Under the new method, our non-GAAP income tax provision is determined based on our non-
GAAP pre-tax income. The tax effect of each non-GAAP adjustment, if applicable, is computed based on the
statutory tax rate of the jurisdiction to which the adjustment relates. Additionally, as our non-GAAP profitability
is higher based on the non-GAAP adjustments, we adjust the GAAP tax provision to remove valuation
allowances and related effects based on the higher level of reported non-GAAP profitability. We also exclude
from our non-GAAP tax provision certain discrete tax items as they occur.
We believe that providing the non-GAAP information to investors, in addition to the GAAP presentation,
allows investors to view the financial results in the way management views the operating results. We further
believe that providing this information allows investors to not only better understand our financial
performance, but more importantly, to evaluate the efficacy of the methodology and information used by
management to evaluate and measure such performance.
The non-GAAP information included in this document should not be considered superior to, or a substitute for,
financial statements prepared in accordance with GAAP.
Pro Forma Financial Measures.
The incident related and pro forma measures estimate our expected results for the third quarter ended June 30,
2017 as if the malware incident had not occurred. These pro forma amounts rely on as reported results through
the date of the malware incident and then include our projected performance for the remaining days of the

21 2017 third quarter results Prepared remarks
August 8, 2017
© 2017 Nuance Communications, Inc. All rights reserved.
quarter based on our anticipated run rate and management’s best estimate of business operations had the
malware incident had not occurred. These pro forma measures are being provided for the purpose of permitting
users of our financial statements to understand our estimates of the effects of the malware incident on our
continuing operations. These pro forma measures should not be considered as a substitute for our actual GAAP
financial statements in assessing the overall health of the business during the three months ended June 30,
2017.
Financial Tables Follow

22 2017 third quarter results Prepared remarks
August 8, 2017
© 2017 Nuance Communications, Inc. All rights reserved.
Nine months ended
June 30,
2017 2016 2017 2016
Revenues:
Professional services and hosting 251,488$ 242,331$ 763,595$ 709,662$
Product and licensing 154,228 153,015 465,238 490,687
Maintenance and support 80,505 82,505 244,619 242,350
Total revenues 486,221 477,851 1,473,452 1,442,699
Cost of revenues:
Professional services and hosting 169,439 158,412 498,501 466,383
Product and licensing 17,637 20,785 54,805 65,020
Maintenance and support 13,410 13,574 40,248 40,496
Amortization of intangible assets 15,727 15,107 48,487 47,077
Total cost of revenues 216,213 207,878 642,041 618,976
Gross profit 270,008 269,973 831,411 823,723
Operating expenses:
Research and development 66,565 67,761 199,119 205,512
Sales and marketing 97,011 96,012 292,201 289,439
General and administrative 42,329 40,328 123,637 126,769
Amortization of intangible assets 29,160 26,748 84,931 80,229
Acquisition-related costs, net 7,646 4,721 22,051 8,426
Restructuring and other charges, net 13,035 5,717 39,649 20,257
Total operating expenses 255,746 241,287 761,588 730,632
Income from operations 14,262 28,686 69,823 93,091
Other expense, net (39,489) (32,661) (133,292) (99,165)
Loss before income taxes (25,227) (3,975) (63,469) (6,074)
Provision for income taxes 2,609 7,846 22,103 24,858
Net loss (27,836)$ (11,821)$ (85,572)$ (30,932)$
Net loss per share:
Basic (0.10)$ (0.04)$ (0.30)$ (0.10)$
Diluted (0.10)$ (0.04)$ (0.30)$ (0.10)$
Weighted average common shares outstanding:
Basic 287,856 279,373 289,269 295,319
Diluted 287,856 279,373 289,269 295,319
June 30,
Condensed Consolidated Statements of Operations
(in thousands, except per share amounts)
Unaudited
Nuance Communications, Inc.
Three months ended

23 2017 third quarter results Prepared remarks
August 8, 2017
© 2017 Nuance Communications, Inc. All rights reserved.
ASSETS June 30, 2017 September 30, 2016
Current assets:
Cash and cash equivalents 693,594$ 481,620$
Marketable securities 175,615 98,840
Accounts receivable, net 359,497 380,004
Prepaid expenses and other current assets 90,794 78,126
Total current assets 1,319,500 1,038,590
Marketable securities 31,926 27,632
Land, building and equipment, net 161,826 185,169
Goodwill 3,578,689 3,508,879
Intangible assets, net 708,077 762,220
Other assets 137,475 138,980
Total assets 5,937,493$ 5,661,470$
LIABILITIES AND STOCKHOLDERS' EQUITY
Current liabilities:
Current portion of long-term debt 371,321$ -$
Contingent and deferred acquisition payments 31,561 9,468
Accounts payable and accrued expenses 325,715 332,258
Deferred revenue 374,033 349,173
Total current liabilities 1,102,630 690,899
Long-term portion of debt 2,229,336 2,433,152
Deferred revenue, net of current portion 424,635 386,960
Other liabilities 226,352 219,129
Total liabilities 3,982,953 3,730,140
Stockholders' equity 1,954,540 1,931,330
Total liabilities and stockholders' equity 5,937,493$ 5,661,470$
Nuance Communications, Inc.
Condensed Consolidated Balance Sheets
(in thousands)
Unaudited
24 2017 third quarter results Prepared remarks
August 8, 2017
© 2017 Nuance Communications, Inc. All rights reserved.
Nine months ended
June 30,
2017 2016 2017 2016
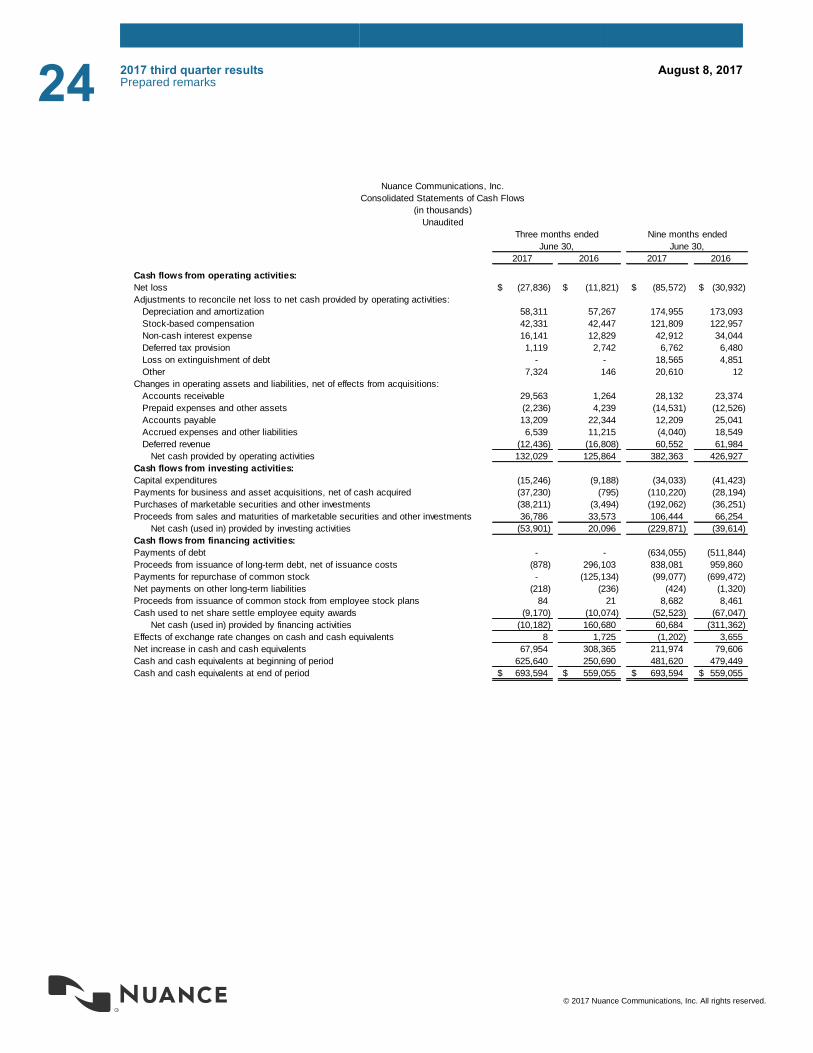
Cash flows from operating activities:
Net loss (27,836)$ (11,821)$ (85,572)$ (30,932)$
Adjustments to reconcile net loss to net cash provided by operating activities:
Depreciation and amortization 58,311 57,267 174,955 173,093
Stock-based compensation 42,331 42,447 121,809 122,957
Non-cash interest expense 16,141 12,829 42,912 34,044
Deferred tax provision 1,119 2,742 6,762 6,480
Loss on extinguishment of debt - - 18,565 4,851
Other 7,324 146 20,610 12
Changes in operating assets and liabilities, net of effects from acquisitions:
Accounts receivable 29,563 1,264 28,132 23,374
Prepaid expenses and other assets (2,236) 4,239 (14,531) (12,526)
Accounts payable 13,209 22,344 12,209 25,041
Accrued expenses and other liabilities 6,539 11,215 (4,040) 18,549
Deferred revenue (12,436) (16,808) 60,552 61,984
Net cash provided by operating activities 132,029 125,864 382,363 426,927
Cash flows from investing activities:
Capital expenditures (15,246) (9,188) (34,033) (41,423)
Payments for business and asset acquisitions, net of cash acquired (37,230) (795) (110,220) (28,194)
Purchases of marketable securities and other investments (38,211) (3,494) (192,062) (36,251)
Proceeds from sales and maturities of marketable securities and other investments 36,786 33,573 106,444 66,254
Net cash (used in) provided by investing activities (53,901) 20,096 (229,871) (39,614)
Cash flows from financing activities:
Payments of debt - - (634,055) (511,844)
Proceeds from issuance of long-term debt, net of issuance costs (878) 296,103 838,081 959,860
Payments for repurchase of common stock - (125,134) (99,077) (699,472)
Net payments on other long-term liabilities (218) (236) (424) (1,320)
Proceeds from issuance of common stock from employee stock plans 84 21 8,682 8,461
Cash used to net share settle employee equity awards (9,170) (10,074) (52,523) (67,047)
Net cash (used in) provided by financing activities (10,182) 160,680 60,684 (311,362)
Effects of exchange rate changes on cash and cash equivalents 8 1,725 (1,202) 3,655
Net increase in cash and cash equivalents 67,954 308,365 211,974 79,606
Cash and cash equivalents at beginning of period 625,640 250,690 481,620 479,449
Cash and cash equivalents at end of period 693,594$ 559,055$ 693,594$ 559,055$
June 30,
Nuance Communications, Inc.
Consolidated Statements of Cash Flows
(in thousands)
Unaudited
Three months ended

25 2017 third quarter results Prepared remarks
August 8, 2017
© 2017 Nuance Communications, Inc. All rights reserved.
2017 2016 2017 2016
GAAP revenues 486,221$ 477,851$ 1,473,452$ 1,442,699$
Acquisition-related revenue adjustments: professional services and hosting 3,258 2,315 8,508 7,678
Acquisition-related revenue adjustments: product and licensing 5,941 4,676 19,970 16,385
Acquisition-related revenue adjustments: maintenance and support 204 19 810 383
Non-GAAP revenues 495,624$ 484,861$ 1,502,740$ 1,467,145$
GAAP cost of revenues 216,213$ 207,878$ 642,041$ 618,976$
Cost of revenues from amortization of intangible assets (15,727) (15,107) (48,487) (47,077)
Cost of revenues adjustments: professional services and hosting (1,2) (8,385) (7,562) (24,875) (22,701)
Cost of revenues adjustments: product and licensing (1,2) (104) (42) (298) (286)
Cost of revenues adjustments: maintenance and support (1) (1,130) (1,083) (3,117) (3,074)
Non-GAAP cost of revenues 190,867$ 184,084$ 565,264$ 545,838$
GAAP gross profit 270,008$ 269,973$ 831,411$ 823,723$
Gross profit adjustments 34,749 30,804 106,065 97,584
Non-GAAP gross profit 304,757$ 300,777$ 937,476$ 921,307$
GAAP income from operations 14,262$ 28,686$ 69,823$ 93,091$
Gross profit adjustments 34,749 30,804 106,065 97,584
Research and development (1) 9,610 9,157 26,498 27,056
Sales and marketing (1) 11,981 13,726 34,968 37,023
General and administrative (1) 11,121 10,327 32,053 31,892
Acquisition-related costs, net 7,646 4,721 22,051 8,426
Amortization of intangible assets 29,160 26,748 84,931 80,229
Restructuring and other charges, net 13,035 5,717 39,649 20,257
Costs associated with IP collaboration agreements - - - 4,000
Other 2,269 2,114 7,980 11,989
Non-GAAP income from operations 133,833$ 132,000$ 424,018$ 411,547$
GAAP loss before income taxes (25,227)$ (3,975)$ (63,469)$ (6,074)$
Gross profit adjustments 34,749 30,804 106,065 97,584
Research and development (1) 9,610 9,157 26,498 27,056
Sales and marketing (1) 11,981 13,726 34,968 37,023
General and administrative (1) 11,121 10,327 32,053 31,892
Acquisition-related costs, net 7,646 4,721 22,051 8,426
Amortization of intangible assets 29,160 26,748 84,931 80,229
Restructuring and other charges, net 13,035 5,717 39,649 20,257
Non-cash interest expense 16,141 12,829 42,912 34,044
Costs associated with IP collaboration agreements - - - 4,000
Loss on extinguishment of debt - - 18,565 4,851
Other 2,269 2,838 7,980 12,963
Non-GAAP income before income taxes 110,485$ 112,892$ 352,203$ 352,251$
June 30, June 30,
Nuance Communications, Inc.
Supplemental Financial Information - GAAP to Non-GAAP Reconciliations
(in thousands)
Unaudited
Three months ended Nine months ended

26 2017 third quarter results Prepared remarks
August 8, 2017
© 2017 Nuance Communications, Inc. All rights reserved.
2017 2016 2017 2016
GAAP provision for income taxes 2,609$ 7,846$ 22,103$ 24,858$
Adjustment to income tax expense:
Income tax effect of Non-GAAP adjustments 45,759 38,360 139,048 120,044
Removal of valuation allowance and other items (17,455) (15,778) (56,457) (44,535)
Removal of discrete items 412 (800) (1,320) (800)
Non-GAAP provision for income taxes 31,325$ 29,628$ 103,374$ 99,567$
GAAP net loss (27,836)$ (11,821)$ (85,572)$ (30,932)$
Acquisition-related adjustment - revenues (2) 9,403 7,010 29,288 24,446
Acquisition-related adjustment - cost of revenues (2) - (550) - (925)
Acquisition-related costs, net 7,646 4,721 22,051 8,426
Cost of revenue from amortization of intangible assets 15,727 15,107 48,487 47,077
Amortization of intangible assets 29,160 26,748 84,931 80,229
Restructuring and other charges, net 13,035 5,717 39,649 20,257
Stock-based compensation (1) 42,331 42,447 121,809 122,957
Non-cash interest expense 16,141 12,829 42,912 34,044
Adjustment to income tax expense (28,716) (21,782) (81,271) (74,709)
Costs associated with IP collaboration agreements - - - 4,000
Loss on extinguishment of debt - - 18,565 4,851
Other 2,270 2,838 7,979 12,963
Non-GAAP net income 79,161$ 83,264$ 248,828$ 252,684$
Non-GAAP diluted net income per share 0.27$ 0.30$ 0.85$ 0.85$
Diluted weighted average common shares outstanding 290,592 281,786 292,107 298,830
Nuance Communications, Inc.
Supplemental Financial Information - GAAP to Non-GAAP Reconciliations, continued
(in thousands, except per share amounts)
Unaudited
Three months ended Nine months ended
June 30, June 30,
27 2017 third quarter results Prepared remarks
August 8, 2017
© 2017 Nuance Communications, Inc. All rights reserved.
2017 2016 2017 2016
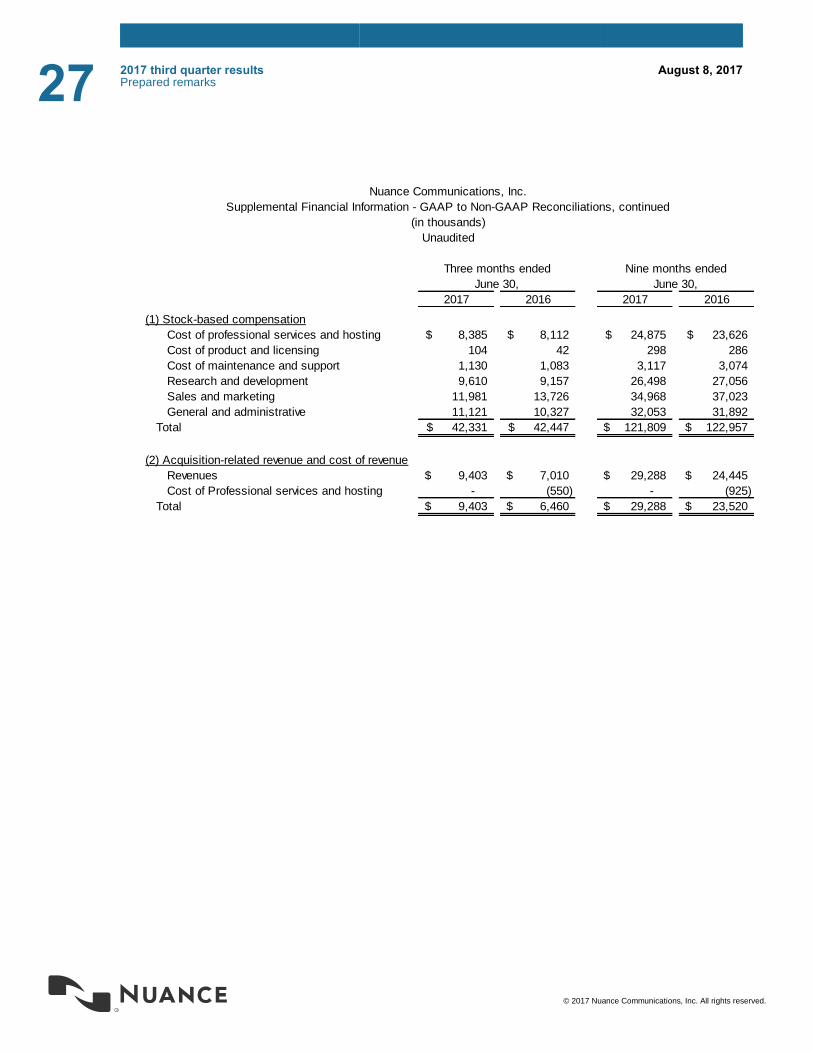
(1) Stock-based compensation
Cost of professional services and hosting 8,385$ 8,112$ 24,875$ 23,626$
Cost of product and licensing 104 42 298 286
Cost of maintenance and support 1,130 1,083 3,117 3,074
Research and development 9,610 9,157 26,498 27,056
Sales and marketing 11,981 13,726 34,968 37,023
General and administrative 11,121 10,327 32,053 31,892
Total 42,331$ 42,447$ 121,809$ 122,957$
(2) Acquisition-related revenue and cost of revenue
Revenues 9,403$ 7,010$ 29,288$ 24,445$
Cost of Professional services and hosting - (550) - (925)
Total 9,403$ 6,460$ 29,288$ 23,520$
Three months ended
June 30,
Nine months ended
June 30,
Nuance Communications, Inc.
Supplemental Financial Information - GAAP to Non-GAAP Reconciliations, continued
(in thousands)
Unaudited

28 2017 third quarter results Prepared remarks
August 8, 2017
© 2017 Nuance Communications, Inc. All rights reserved.
2017 2016 2017 2016
GAAP operating expenses 255,746$ 241,287$ 761,588$ 730,632$
Research and development (1) (9,610) (9,157) (26,498) (27,056)
Sales and marketing (1) (11,981) (13,726) (34,968) (37,023)
General and administrative (1) (11,121) (10,327) (32,053) (31,892)
Acquisition-related costs, net (7,646) (4,721) (22,051) (8,426)
Amortization of intangible assets (29,160) (26,748) (84,931) (80,229)
Restructuring and other charges, net (13,035) (5,717) (39,649) (20,257)
Costs associated with IP collaboration agreements - - - (4,000)
Other (2,269) (2,114) (7,980) (11,989)
Non-GAAP operating expenses 170,924$ 168,777$ 513,458$ 509,760$
GAAP research and development expense 66,565$ 67,761$ 199,119$ 205,512$
Stock-based compensation (1) (9,610) (9,157) (26,498) (27,056)
Non-GAAP research and development expense 56,955$ 58,604$ 172,621$ 178,456$
GAAP sales and marketing expense 97,011$ 96,012$ 292,201$ 289,439$
Stock-based compensation (1) (11,981) (13,726) (34,968) (37,023)
Costs associated with IP collaboration agreements - - - (4,000)
Non-GAAP sales and marketing expense 85,030$ 82,286$ 257,233$ 248,416$
GAAP general and administrative expense 42,329$ 40,328$ 123,637$ 126,769$
Stock-based compensation (1) (11,121) (10,327) (32,053) (31,892)
Other (2,269) (2,114) (7,980) (11,989)
Non-GAAP general and administrative expense 28,939$ 27,887$ 83,604$ 82,888$
June 30, June 30,
Three months ended Nine months ended
Nuance Communications, Inc.
Supplemental Financial Information - GAAP to Non-GAAP Reconciliations, continued
(in thousands)
Unaudited

29 2017 third quarter results Prepared remarks
August 8, 2017
© 2017 Nuance Communications, Inc. All rights reserved.
As-Reported Adjustment Pro Forma
GAAP revenues (3) 486,221$ 15,389$ 501,610$
Acquisition-related revenue adjustments: professional services and hosting 3,258 - 3,258
Acquisition-related revenue adjustments: product and licensing 5,941 - 5,941
Acquisition-related revenue adjustments: maintenance and support 204 - 204
Non-GAAP revenues (3) 495,624$ 15,389$ 511,013$
GAAP cost of revenues (4) 216,213$ 1,641$ 217,854$
Cost of revenues from amortization of intangible assets (15,727) - (15,727)
Cost of revenues adjustments: professional services and hosting (1,2) (8,385) - (8,385)
Cost of revenues adjustments: product and licensing (1,2) (104) - (104)
Cost of revenues adjustments: maintenance and support (1) (1,130) - (1,130)
Non-GAAP cost of revenues (4) 190,867$ 1,641$ 192,508$
GAAP gross profit (3,4) 270,008$ 13,748$ 283,756$
Gross profit adjustments 34,749 - 34,749
Non-GAAP gross profit (3,4) 304,757$ 13,748$ 318,505$
GAAP income from operations (3,4,5) 14,262$ 17,152$ 31,414$
Gross profit adjustments 34,749 - 34,749
Research and development (1) 9,610 - 9,610
Sales and marketing (1) 11,981 - 11,981
General and administrative (1,6) 11,121 1,760 12,881
Acquisition-related costs, net 7,646 - 7,646
Amortization of intangible assets 29,160 - 29,160
Restructuring and other charges, net (5) 13,035 (5,164) 7,871
Other 2,269 - 2,269
Non-GAAP income from operations (3,4) 133,833$ 13,748$ 147,581$
GAAP loss before income taxes (3,4,5,6) (25,227)$ 17,152$ (8,075)$
Gross profit adjustments 34,749 - 34,749
Research and development (1) 9,610 - 9,610
Sales and marketing (1) 11,981 - 11,981
General and administrative (1,6) 11,121 1,760 12,881
Acquisition-related costs, net 7,646 - 7,646
Amortization of intangible assets 29,160 - 29,160
Restructuring and other charges, net (5) 13,035 (5,164) 7,871
Non-cash interest expense 16,141 - 16,141
Other 2,269 - 2,269
Non-GAAP income before income taxes (3,4) 110,485$ 13,748$ 124,233$
(3) Adjustment represents estimated revenues lost due to the Malware Incident.
(4) Adjustment represents estimated cost of revenues not incurred due to the Malware Incident.
(5) Adjustment represents expenses that would not have been incurred but for the Malware Incident.
(6) Adjustment represents the effect of estimated compensation-related items that would have been incurred but
for the Malware Incident.
Nuance Communications, Inc.
Supplemental Financial Information - GAAP, Non-GAAP and Pro Forma Reconciliations, continued
Three Months Ended June 30, 2017
(in thousands, except per share amounts)
Unaudited

30 2017 third quarter results Prepared remarks
August 8, 2017
© 2017 Nuance Communications, Inc. All rights reserved.
As-Reported Adjustment Pro Forma
GAAP provision for income taxes 2,609$ -$ 2,609$
Adjustment to income tax expense:
Income tax effect of Non-GAAP adjustments (7) 45,759 (1,316) 44,443
Removal of valuation allowance and other items (8) (17,455) 6,629 (10,826)
Removal of discrete items 412 - 412
Non-GAAP provision for income taxes (7,8) 31,325$ 5,313$ 36,638$
GAAP net loss (3,4,5,6) (27,836)$ 17,152$ (10,684)$
Acquisition-related adjustment - revenues (2) 9,403 - 9,403
Acquisition-related costs, net 7,646 - 7,646
Cost of revenue from amortization of intangible assets 15,727 - 15,727
Amortization of intangible assets 29,160 - 29,160
Restructuring and other charges, net (5) 13,035 (5,164) 7,871
Stock-based compensation (1,6) 42,331 1,760 44,091
Non-cash interest expense 16,141 - 16,141
Adjustment to income tax expense (7,8) (28,716) (5,313) (34,029)
Other 2,270 - 2,270
Non-GAAP net income (3,4,5,6,7,8) 79,161$ 8,435$ 87,596$
GAAP basic and diluted net loss per share (9) (0.10)$ 0.06$ (0.04)$
Non-GAAP diluted net income per share (10) 0.27$ 0.03$ 0.30$
GAAP basic and diluted weighted average common shares outstanding 287,856 287,856
Non-GAAP diluted weighted average common shares outstanding 290,592 290,592
(7) Adjustment represents tax effect of other expenses that would not have been incurred but for the Malware Incident.
(10) Adjustment to Non-GAAP earnings per share represents the effect related to estimated lost revenues, cost of revenues, and
related taxes that would not have been incurred but for the Malware Incident.
Nuance Communications, Inc.
Supplemental Financial Information - GAAP, Non-GAAP and Pro Forma Reconciliations, continued
Three Months Ended June 30, 2017
(in thousands, except per share amounts)
Unaudited
(8) Adjustment represents tax effect of estimated lost revenues, cost of revenues not incurred and other expenses that would not
have been incurred but for the Malware Incident.
(9) Adjustment to GAAP earnings per share represents the effect related to estimated lost revenues, cost of revenues
compensation-related items and other expenses that would not have been incurred but for the Malware Incident.

31 2017 third quarter results Prepared remarks
August 8, 2017
© 2017 Nuance Communications, Inc. All rights reserved.
As-Reported Adjustment Pro Forma
(1) Stock-based compensation
Cost of professional services and hosting 8,385$ -$ 8,385$
Cost of product and licensing 104 - 104
Cost of maintenance and support 1,130 - 1,130
Research and development 9,610 - 9,610
Sales and marketing 11,981 - 11,981
General and administrative (6) 11,121 1,760 12,881
Total 42,331$ 1,760$ 44,091$
(2) Acquisition-related revenue and cost of revenue
Revenues 9,403 -$ 9,403$
Cost of Professional services and hosting - - -
Total 9,403$ -$ 9,403$
Nuance Communications, Inc.
Supplemental Financial Information - GAAP, Non-GAAP and Pro Forma Reconciliations, continued
Three Months Ended June 30, 2017
(in thousands)
Unaudited
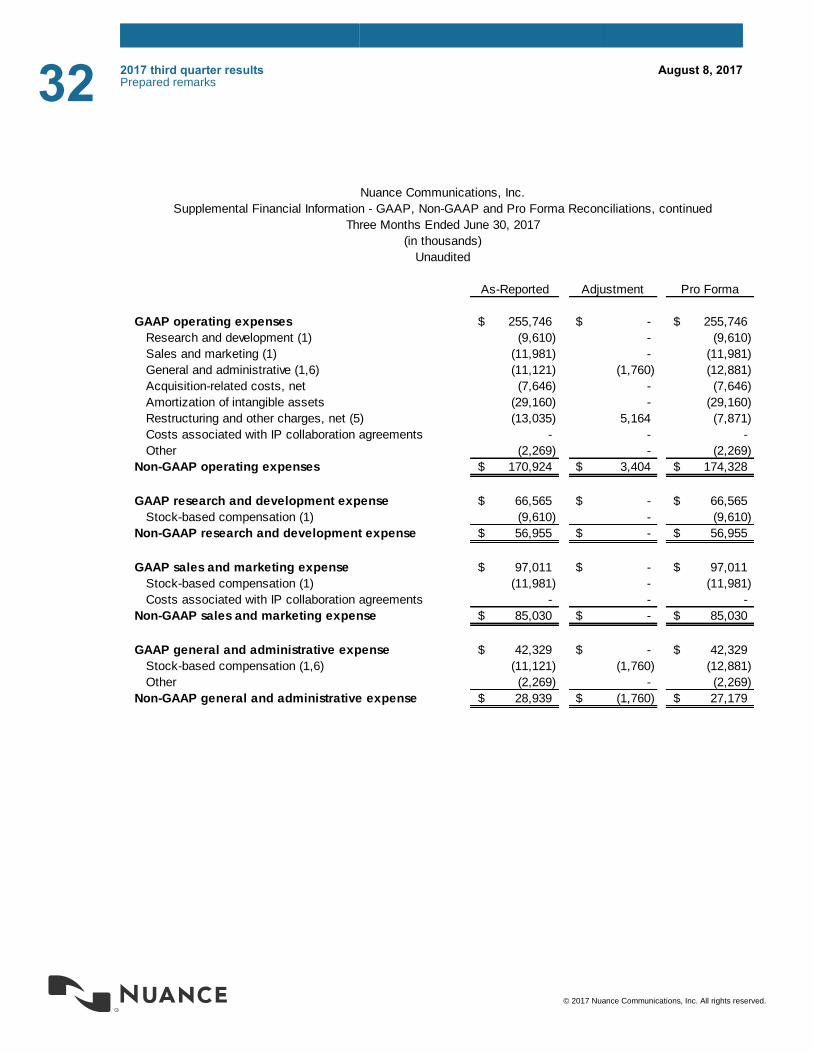
32 2017 third quarter results Prepared remarks
August 8, 2017
© 2017 Nuance Communications, Inc. All rights reserved.
As-Reported Adjustment Pro Forma
GAAP operating expenses 255,746$ -$ 255,746$
Research and development (1) (9,610) - (9,610)
Sales and marketing (1) (11,981) - (11,981)
General and administrative (1,6) (11,121) (1,760) (12,881)
Acquisition-related costs, net (7,646) - (7,646)
Amortization of intangible assets (29,160) - (29,160)
Restructuring and other charges, net (5) (13,035) 5,164 (7,871)
Costs associated with IP collaboration agreements - - -
Other (2,269) - (2,269)
Non-GAAP operating expenses 170,924$ 3,404$ 174,328$
GAAP research and development expense 66,565$ -$ 66,565$
Stock-based compensation (1) (9,610) - (9,610)
Non-GAAP research and development expense 56,955$ -$ 56,955$
GAAP sales and marketing expense 97,011$ -$ 97,011$
Stock-based compensation (1) (11,981) - (11,981)
Costs associated with IP collaboration agreements - - -
Non-GAAP sales and marketing expense 85,030$ -$ 85,030$
GAAP general and administrative expense 42,329$ -$ 42,329$
Stock-based compensation (1,6) (11,121) (1,760) (12,881)
Other (2,269) - (2,269)
Non-GAAP general and administrative expense 28,939$ (1,760)$ 27,179$
Three Months Ended June 30, 2017
Nuance Communications, Inc.
Supplemental Financial Information - GAAP, Non-GAAP and Pro Forma Reconciliations, continued
(in thousands)
Unaudited

33 2017 third quarter results Prepared remarks
August 8, 2017
© 2017 Nuance Communications, Inc. All rights reserved.
As-
Reported
Adjustment
(3)
Pro
Forma
Q1 Q2 Q3 Q4 FY Q1 Q2 Q3 Q3 Q3
2016 2016 2016 2016 2016 2017 2017 2017 2017 2017
GAAP Revenues……………………………….. $177.4 $184.6 $181.1 $187.0 $730.2 $193.3 $202.2 $189.4 $10.2 $199.6
Adjustment …………….…………………….. 2.3 2.5 2.0 2.3 9.1 2.3 2.7 3.1 - 3.1
Non-GAAP Revenues …..…………………….. $179.7 $187.1 $183.2 $189.3 $739.2 $195.6 $204.8 $192.5 $10.2 $202.7
Q1 Q2 Q3 Q4 FY Q1 Q2 Q3 Q3 Q3
2016 2016 2016 2016 2016 2017 2017 2017 2017 2017
GAAP Revenues……………………………….. $79.9 $79.9 $82.5 $82.0 $324.3 $82.5 $81.6 $80.5 $0.3 $80.8
Adjustment …………….…………………….. 0.2 0.1 0.0 0.0 0.4 0.2 0.4 0.2 - 0.2
Non-GAAP Revenues …..…………………….. $80.2 $80.0 $82.5 $82.0 $324.7 $82.7 $82.0 $80.7 $0.3 $81.0
Q1 Q2 Q3 Q4 FY Q1 Q2 Q3 Q3 Q3
2016 2016 2016 2016 2016 2017 2017 2017 2017 2017
GAAP Revenues……………………………….. $115.2 $88.0 $80.9 $99.5 $383.6 $78.7 $76.5 $73.5 $4.1 $77.6
Adjustment …………….…………………….. 2.0 2.2 1.4 1.0 6.6 0.7 0.5 0.9 - 0.9
Non-GAAP Revenues …..…………………….. $117.2 $90.2 $82.3 $100.5 $390.2 $79.3 $77.0 $74.4 $4.1 $78.5
Q1 Q2 Q3 Q4 FY Q1 Q2 Q3 Q3 Q3
2016 2016 2016 2016 2016 2017 2017 2017 2017 2017
GAAP Revenues……………………………….. $63.9 $70.6 $72.1 $79.1 $285.6 $73.1 $82.8 $80.8 $0.0 $80.8
Adjustment …………….…………………….. 4.0 3.5 3.3 2.7 13.5 5.1 7.8 5.0 - 5.0
Non-GAAP Revenues …..…………………….. $67.9 $74.1 $75.3 $81.7 $299.1 $78.2 $90.6 $85.8 $0.0 $85.8
Q1 Q2 Q3 Q4 FY Q1 Q2 Q3 Q3 Q3
2016 2016 2016 2016 2016 2017 2017 2017 2017 2017
GAAP Revenues……………………………….. $49.7 $55.6 $61.2 $58.7 $225.2 $60.1 $56.5 $62.1 $0.8 $62.9
Adjustment …………….…………………….. 0.3 0.4 0.3 0.2 1.1 0.2 0.1 0.1 - 0.1
Non-GAAP Revenues …..…………………….. $50.0 $55.9 $61.5 $58.9 $226.3 $60.3 $56.7 $62.2 $0.8 $63.0
Q1 Q2 Q3 Q4 FY Q1 Q2 Q3 Q3 Q3
2016 2016 2016 2016 2016 2017 2017 2017 2017 2017
GAAP Revenues……………………………….. $326.1 $339.6 $339.7 $352.1 $1,357.4 $353.0 $370.2 $354.5 $10.5 $365.0
Adjustment …………….…………………….. 6.4 6.2 5.3 5.0 22.9 7.5 11.4 8.7 - 8.7
Non-GAAP Revenues …..…………………….. $332.5 $345.8 $345.0 $357.1 $1,380.3 $360.5 $381.7 $363.2 $10.5 $373.7
Schedules may not add due to rounding.
Total Recurring Revenues
Recurring Product and Licensing
Revenues
Professional Services Revenues
Perpetual Product and Licensing
Revenues
Maintenance and Support Revenues
Hosting Revenues
Nuance Communications, Inc.
Supplemental Financial Information – GAAP, Non-GAAP, and Pro Forma Reconciliations, continued
(in millions)
Unaudited

34 2017 third quarter results Prepared remarks
August 8, 2017
© 2017 Nuance Communications, Inc. All rights reserved.
As-
Reported
Adjustment
(3)
Pro
Forma
Total Revenues Q1 Q2 Q3 Q4 FY Q1 Q2 Q3 Q3 Q3
2016 2016 2016 2016 2016 2017 2017 2017 2017 2017
GAAP Revenues………………………………….. $486.1 $478.7 $477.9 $506.2 $1,948.9 $487.7 $499.6 $486.2 $15.4 $501.6
Adjustment …………….…………………………. 8.8 8.7 7.0 6.2 30.7 8.4 11.5 9.4 - 9.4
Non-GAAP Revenues …..……………………….. $494.9 $487.4 $484.9 $512.4 $1,979.6 $496.0 $511.1 $495.6 $15.4 $511.0
Healthcare Q1 Q2 Q3 Q4 FY Q1 Q2 Q3 Q3 Q3
2016 2016 2016 2016 2016 2017 2017 2017 2017 2017
GAAP Revenues………………………………….. $245.4 $242.1 $238.8 $238.1 $964.4 $237.7 $237.3 $231.2 $11.0 $242.2
Adjustment …………….…………………………. 2.7 2.3 2.2 1.7 8.9 1.5 1.2 1.4 - 1.4
Non-GAAP Revenues …..……………………….. $248.1 $244.4 $241.0 $239.8 $973.3 $239.2 $238.5 $232.6 $11.0 $243.6
Mobile Q1 Q2 Q3 Q4 FY Q1 Q2 Q3 Q3 Q3
2016 2016 2016 2016 2016 2017 2017 2017 2017 2017
GAAP Revenues………………………………….. $95.0 $89.9 $90.2 $95.8 $370.9 $90.5 $98.5 $99.0 $0.2 $99.1
Adjustment …………….…………………………. 1.4 2.0 1.6 1.4 6.4 1.3 1.7 2.6 - 2.6
Non-GAAP Revenues …..……………………….. $96.4 $91.8 $91.8 $97.2 $377.3 $91.8 $100.2 $101.5 $0.2 $101.7
Enterprise Q1 Q2 Q3 Q4 FY Q1 Q2 Q3 Q3 Q3
2016 2016 2016 2016 2016 2017 2017 2017 2017 2017
GAAP Revenues………………………………….. $88.3 $93.7 $94.9 $108.1 $385.0 $109.3 $112.5 $108.1 $0.6 $108.8
Adjustment …………….…………………………. 0.5 0.8 0.3 0.9 2.5 3.7 6.9 3.9 - 3.9
Non-GAAP Revenues …..……………………….. $88.8 $94.4 $95.2 $109.0 $387.5 $112.9 $119.4 $112.1 $0.6 $112.7
Imaging Q1 Q2 Q3 Q4 FY Q1 Q2 Q3 Q3 Q3
2016 2016 2016 2016 2016 2017 2017 2017 2017 2017
GAAP Revenues………………………………….. $57.4 $53.1 $53.9 $64.2 $228.6 $50.1 $51.3 $47.9 $3.6 $51.5
Adjustment …………….…………………………. 4.2 3.6 2.9 2.2 13.0 1.9 1.8 1.5 - 1.5
Non-GAAP Revenues …..……………………….. $61.6 $56.7 $56.8 $66.4 $241.6 $52.1 $53.0 $49.4 $3.6 $53.0
Nuance Communications, Inc.
Supplemental Financial Information – GAAP, Non-GAAP, and Pro Forma Reconciliations, continued
(in millions)
Unaudited
Schedules may not add due to rounding.

35 2017 third quarter results Prepared remarks
August 8, 2017
© 2017 Nuance Communications, Inc. All rights reserved.
Q1 Q2 Q3 Q4 FY Q1 Q2 Q3
2016 2016 2016 2016 2016 2017 2017 2017
Total segment revenues……………………………………………. 494.9$ 487.4$ 484.9$ 512.4$ 1,979.6$ 496.0$ 511.1$ 495.6$
Acquisition-related revenue adjustments…………………………. (8.8) (8.7) (7.0) (6.2) (30.7) (8.4) (11.5) (9.4) Total consolidated revenues……………………………………….. 486.1$ 478.7$ 477.9$ 506.2$ 1,948.9$ 487.7$ 499.6$ 486.2$
Total segment profit………………………………………………… 168.2$ 168.1$ 160.8$ 180.6$ 677.6$ 161.6$ 184.0$ 163.2$
Corporate expenses and other, net………………………………. (30.7) (35.9) (30.9) (30.8) (128.2) (31.0) (30.2) (31.7)
Acquisition-related revenues and costs of revenues adjustment. (8.6) (8.5) (6.5) (6.2) (29.8) (8.4) (11.5) (9.4)
Stock-based compensation……………………………………….. (42.3) (38.2) (42.4) (40.9) (163.8) (39.1) (40.3) (42.3)
Amortization of intangible assets…………………………………. (42.7) (42.8) (41.9) (43.6) (170.9) (43.4) (45.1) (44.9)
Acquisition-related costs, net……………………………………… (2.5) (1.2) (4.7) (8.7) (17.2) (9.0) (5.4) (7.6)
Restructuring and other charges, net…………………………….. (7.9) (6.7) (5.7) (5.0) (25.2) (6.7) (19.9) (13.0)
Costs associated with IP collaboration agreements……………. (2.0) (2.0) - - (4.0) - - -
Other expense, net…………………………………………………. (35.8) (30.7) (32.7) (37.6) (136.8) (37.6) (56.2) (39.5)
(Loss) income before income taxes………………………………. (4.3)$ 2.2$ (4.0)$ 7.8$ 1.7$ (13.6)$ (24.7)$ (25.2)$
Nuance Communications, Inc.
Supplemental Financial Information – GAAP to Non-GAAP Reconciliations, continued
(in millions)
Unaudited
Schedules may not add due to rounding.
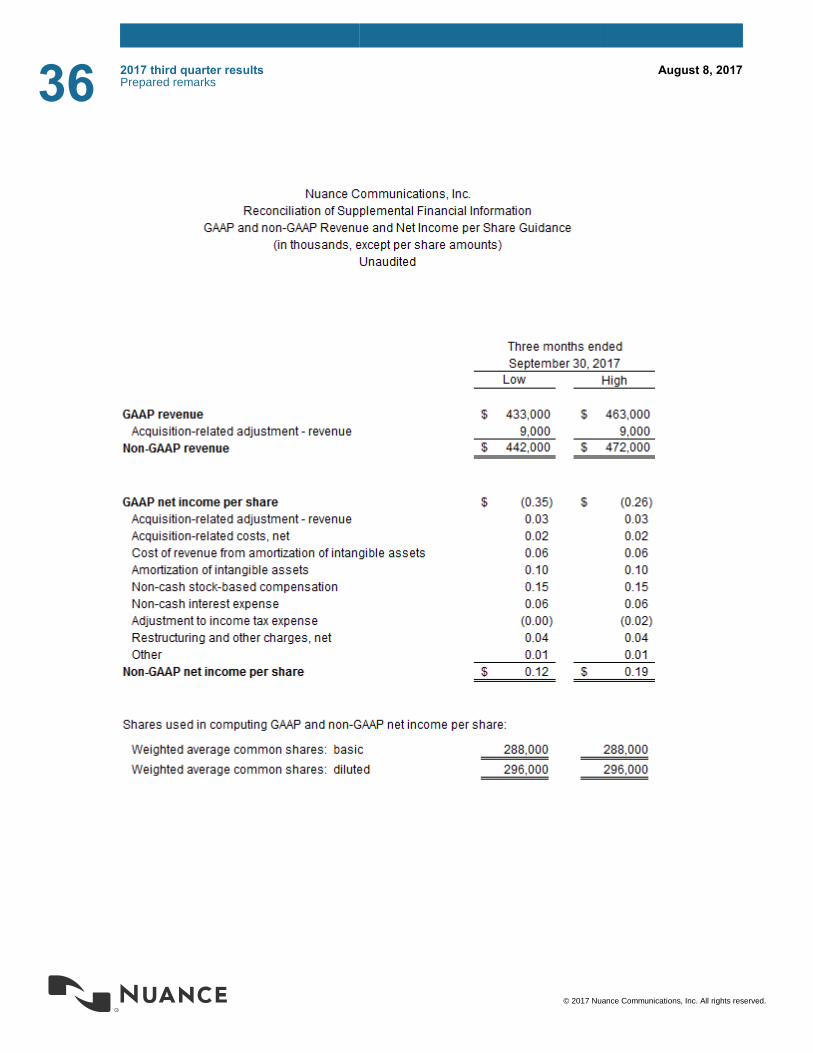
36 2017 third quarter results Prepared remarks
August 8, 2017
© 2017 Nuance Communications, Inc. All rights reserved.
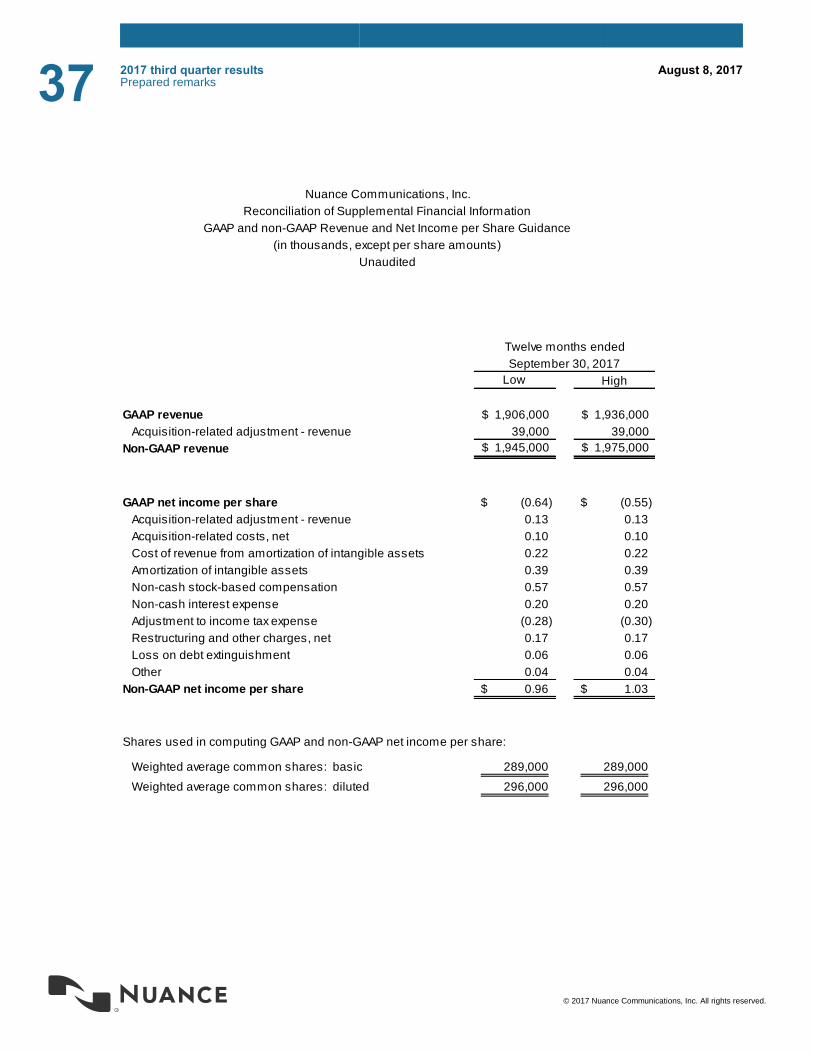
37 2017 third quarter results Prepared remarks
August 8, 2017
© 2017 Nuance Communications, Inc. All rights reserved.
Low High
GAAP revenue $ 1,906,000 $ 1,936,000
Acquisition-related adjustment - revenue 39,000 39,000
Non-GAAP revenue $ 1,945,000 $ 1,975,000
GAAP net income per share (0.64)$ (0.55)$
Acquisition-related adjustment - revenue 0.13 0.13
Acquisition-related costs, net 0.10 0.10
Cost of revenue from amortization of intangible assets 0.22 0.22
Amortization of intangible assets 0.39 0.39
Non-cash stock-based compensation 0.57 0.57
Non-cash interest expense 0.20 0.20
Adjustment to income tax expense (0.28) (0.30)
Restructuring and other charges, net 0.17 0.17
Loss on debt extinguishment 0.06 0.06
Other 0.04 0.04
Non-GAAP net income per share 0.96$ 1.03$
Shares used in computing GAAP and non-GAAP net income per share:
Weighted average common shares: basic 289,000 289,000
Weighted average common shares: diluted 296,000 296,000
Twelve months ended
September 30, 2017
Unaudited
Nuance Communications, Inc.
Reconciliation of Supplemental Financial Information
GAAP and non-GAAP Revenue and Net Income per Share Guidance
(in thousands, except per share amounts)

38 2017 third quarter results Prepared remarks
August 8, 2017
© 2017 Nuance Communications, Inc. All rights reserved.
Guidance Adjustment (A)
Pro Forma
Guidance Guidance Adjustment (A)
Pro Forma
Guidance
GAAP Revenue $433,000 $75,000 $508,000 $463,000 $65,000 $528,000
Non-GAAP Revenue $442,000 $75,000 $517,000 $472,000 $65,000 $537,000
Guidance Adjustment (A)
Pro Forma
Guidance Guidance Adjustment (A)
Pro Forma
Guidance
GAAP Earnings per Share (B) (0.35)$ 0.26$ (0.09)$ (0.26)$ 0.23$ (0.03)$
Non-GAAP Earnings per Share (C) 0.12$ 0.14$ 0.26$ 0.19$ 0.12$ 0.31$
Nuance Communications, Inc.
(C) Adjustment to Non-GAAP earnings per share guidance represents the cost of revenues and taxes associated with the estimated
revenue impact of the Malware Incident.
Low High
(A) Adjustmentrepresents estimated revenue impact of the Malware Incident(B) Adjustment to GAAP earnings per share guidance represents the cost of revenues and compensation-related items associated with the
estimated revenue impact of, as well as other expenses associated with, Malware Incident.
Pro Forma Reconciliation of Revenue and Earnings per Share Guidance
Three Months Ended September 30, 2017
(in thousands, except per share amounts)
Unaudited
Low High
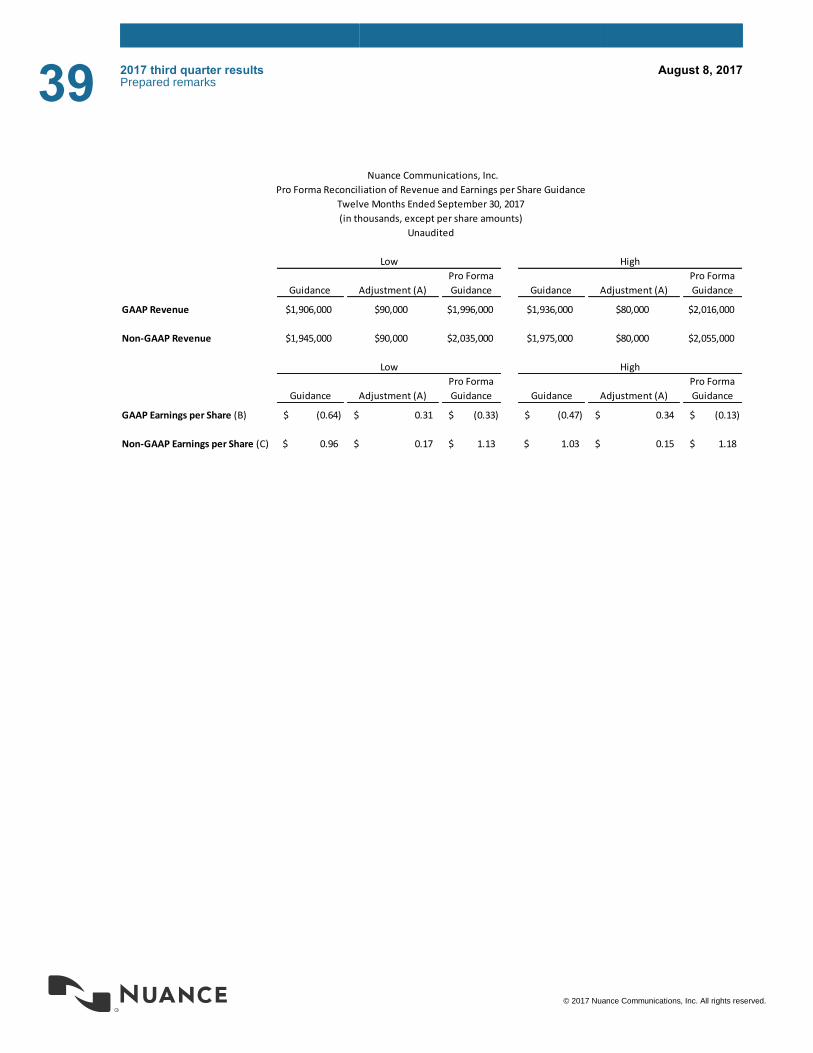
39 2017 third quarter results Prepared remarks
August 8, 2017
© 2017 Nuance Communications, Inc. All rights reserved.
Guidance Adjustment (A)
Pro Forma
Guidance Guidance Adjustment (A)
Pro Forma
Guidance
GAAP Revenue $1,906,000 $90,000 $1,996,000 $1,936,000 $80,000 $2,016,000
Non-GAAP Revenue $1,945,000 $90,000 $2,035,000 $1,975,000 $80,000 $2,055,000
Guidance Adjustment (A)
Pro Forma
Guidance Guidance Adjustment (A)
Pro Forma
Guidance
GAAP Earnings per Share (B) (0.64)$ 0.31$ (0.33)$ (0.47)$ 0.34$ (0.13)$
Non-GAAP Earnings per Share (C) 0.96$ 0.17$ 1.13$ 1.03$ 0.15$ 1.18$
Nuance Communications, Inc.
Low High
Pro Forma Reconciliation of Revenue and Earnings per Share Guidance
Twelve Months Ended September 30, 2017
(in thousands, except per share amounts)
Unaudited
Low High