Prepared for - Valid Nutrition · a panel survey of farmers in the districts of Lilongwe, Mchinji...
65
LINKAGES BETWEEN LAND, AGRICULTURAL FINANCE, INPUTS AND MARKETS: A CONTEXTUAL ANALYSIS OF MALAWI’S AGRICULTURAL SECTOR WITH A FOCUS ON LILONGWE, MCHINJI AND SALIMA DISTRICTS STUDY REPORT Prepared by: CENTRE FOR AGRICULTURAL RESEARCH AND DEVELOPMENT LILONGWE UNIVERSITY OF AGRICULTURE AND NATURAL RESOURCES P.O. Box 219, LILONGWE, MALAWI. Prepared for: VALID NUTRITION January 2014
Transcript of Prepared for - Valid Nutrition · a panel survey of farmers in the districts of Lilongwe, Mchinji...

LINKAGES BETWEEN LAND, AGRICULTURAL FINANCE, INPUTS AND MARKETS: A
CONTEXTUAL ANALYSIS OF MALAWI’S AGRICULTURAL SECTOR WITH A FOCUS
ON LILONGWE, MCHINJI AND SALIMA DISTRICTS
STUDY REPORT
Prepared by:
CENTRE FOR AGRICULTURAL RESEARCH AND DEVELOPMENT
LILONGWE UNIVERSITY OF AGRICULTURE AND NATURAL RESOURCES
P.O. Box 219, LILONGWE, MALAWI.
Prepared for:
VALID NUTRITION
January 2014

2
Table of Contents Acronyms ...................................................................................................................................................... 4
Acknowledgements ....................................................................................................................................... 6
Introduction and Background ....................................................................................................................... 8
SECTION 1: AGRICULTURAL INPUTS ........................................................................................... 10
Introduction ............................................................................................................................................. 10
Targeting ................................................................................................................................................. 12
Gender Perspective of the FISP .............................................................................................................. 13
Budget and cost of the FISP .................................................................................................................... 15
Effect of currency devaluation ................................................................................................................ 16
References ............................................................................................................................................... 19
SECTION 2: AGRICULTURAL LAND ................................................................................................... 21
Introduction ............................................................................................................................................. 21
Land Tenure System ............................................................................................................................... 21
Categories of Land Tenure ...................................................................................................................... 22
Land Availability at national Level and Study Districts ......................................................................... 24
Opportunities and Barriers to Land Redistribution to Smallholder Farmers .......................................... 26
Opportunities ....................................................................................................................................... 26
Barriers to Land Redistribution........................................................................................................... 27
SECTION 3: MICROFINANCE .......................................................................................................... 29
Introduction ............................................................................................................................................. 29
Historical Financing Arrangements for Small Farmers .......................................................................... 30
Financial Regulatory Environment and Current Micro-financing Institutions ....................................... 30
Regulatory Environment ..................................................................................................................... 30
Existing Micro-financing Institutions ................................................................................................. 31
Loan Portfolio ......................................................................................................................................... 32
Concern Universal Microfinance Operations (CUMO) .......................................................................... 32
CUMO’s Clients ................................................................................................................................. 33
CUMO’s Products ............................................................................................................................... 33
Non-financial Products ....................................................................................................................... 34
Participation of Women in the Financial Markets .................................................................................. 35
Challenges to Micro-Finace Institutions in Malawi ................................................................................ 35

3
References ............................................................................................................................................... 36
SECTION 4: ACCESS TO AGRICULTURAL MARKETS ............................................................... 38
Introduction ............................................................................................................................................. 38
Government Policy and Strategies .......................................................................................................... 38
Gender imbalance in decision making .................................................................................................... 43
References ............................................................................................................................................... 44
4
Acronyms
ACE Agricultural Commodity Exchange
ADD Agricultural Development Division
ADMARC Agricultural Development and Marketing Corporation
AEDO Agricultural Extension Development Officer
AFMIN African Microfinance Network
AHLCX Auction Holdings Limited Commodity Exchange
AISP Agricultural Input Subsidy Programme
AOA Agreements on Agriculture
CARD Center for Agricultural Research and Development
CARE Cooperative for Assistance and Relief Everywhere
CBRLDP Community Based Rural Land Development Project
CCODE Centre for Community Organisation and Development
CDP Cooperative Development Policy
CISANET Civil Society Agriculture Network
CISP Comitato Internazionele per lo Sviluppo dei Popoli
COMSIP Community Savings and Investment Promotion
CUMO Concern Universal Microfinance Operations
DEMAT Development of Malawian Enterprises Trust
FAO Food and Agriculture Organisation
FARA Forum for Agricultural Research in Africa
FCA Financial Cooperatives Act
FILP Farm Inputs Loan Program
FIMA Financial Inclusion in Malawi
FINCA Foundation for International Community Assistance
FISP Farm Input Subsidy Program
FITSE Malawi Finance Trust for the Self Employed

5
FSA Financial Services Act
FSRP Fertilizer Subsidy Removal Programme
GDP Gross Domestic Product
GoM Government of Malawi
IFPRI International Food Policy Research Institute
IJAS International Journal of Agricultural Sustainability
ILO International Labour Organization
IMF International Monetary Fund
LUANAR Lilongwe University of Agriculture and Natural Resources
MAMN Malawi Microfinance Network
MARDEF Malawi Rural Development Fund
MFA Microfinance Act
MFI Microfinance Institutions
MFT Micro Finance Transparency
MoAFS Ministry of Agriculture and Food Security
MoIT Ministry of Industry and Trade
MRFC Malawi Rural Finance Company Limited
MSE Malawi Stock Exchange
MTN Malawi Telekom Network
MUSCCO Malawi Union of Savings and Credit Co-operatives
NABW National Association of Business Women
NES National Export Strategy
NGO Non-Governmental Organizations
NSO National Statistical Office
OIBM Opportunity International Bank of Malawi
OPV Open Pollinated Variety
PWLHIV Pregnant Women Living with HIV
6
PRIDE Promotion of Rural Initiatives and Development Enterprises
RBM Reserve Bank of Malawi
ROSCA Rotating Savings and Credit Associations
RUCF Ready to Use Complementary Food
RUSF Ready to Use Supplementary Food
RUTF Ready to Use Therapeutic Food
SACA Agricultural Credit Administration
SACCO Savings and Credit Cooperatives
SAMCAF Southern Africa Microfinance & Enterprise Capacity Enhancement Facility
SAP Structural Adjustment Program
SAPs Structural Adjustment Programs
SEDOM Small Enterprise Development Organisation of Malawi
SFFRFM Smallholder Farmers Fertilizer Revolving Fund of Malawi
SOAS School of Oriental and African Studies
SPS Sanitary and Phytosanitary
TA Traditional Authority
TIP Targeted Input Program
TLF Touching Lives Fund
UCC University College Cork
UNCDF United Nations Capital Development Fund
UNCTAD United Nations Conference on Trade and Development
UNDP United Nations Development Program
USAID United States Agency for International Development
VN Valid Nutrition
VSLA Village Savings and Loan Associations
Acknowledgements
7
The Centre for Agricultural Research and Development1 (CARD) would like to thank Valid Nutrition for
entrusting the Centre with the task of undertaking this study.
Special thanks go to all the stakeholders and the key informants who were consulted in course of the study
for their time and for sharing the information sought.
The author takes responsibility for any omissions, misrepresentation of facts or any other errors in the
report.
Richard Kachule
CARD, Lilongwe, Malawi
January, 2014
1 Research Center under the Lilongwe University of Agriculture and Natural Resources - Bunda Campus

8
Introduction and Background
Valid Nutrition (VN) promotes the manufacture in African countries of Ready to Use Foods
(RUFs2) to treat and prevent malnutrition. The market for such foods is expanding rapidly and
although most of the usage is in Africa most of the production takes place outside Africa. This
results in profits accruing outside Africa and potential for agricultural stimulus in Africa being
lost.
To counter this trend, VN is working towards ensuring that the majority of this food is grown and
processed in Africa thus promoting African agriculture and business, retaining profits in Africa
and minimising environmental damage resulting from food miles. As an initial step towards
achieving this, VN in collaboration with University College in Cork (UCC) has been conducting
a panel survey of farmers in the districts of Lilongwe, Mchinji and Salima within the central region
of Malawi, Figure 1. The aim of these panel surveys is to determine the effects on the livelihood
and food security of small farmers producing groundnuts for sale to VN’s RUTF production unit
in Lilongwe district.
Source: Department of Lands and Surveys
2 RUTF ready to use therapeutic food; RUSF ready to use supplementary food; and RUCF ready to use
complementary food.

9
In addition to the panel surveys, VN recognises that it is important to understand the major factors
in the groundnuts value chain that ultimately determine the usefulness of the chain to small
farmers. In this regard, VN/UCC has also been collaborating with the Center for Agricultural
Research and Development (CARD) to carry out contextual studies alongside the panel surveys.
The aim of the contextual analyses has been to identify key features of the value chains for RUF
component crops in Malawi. The contextual analyses has therefore focused on investigating the
linkages and interaction among agricultural inputs, land, microfinance and markets as some of the
key factors influencing farmers’ decision in producing either food or cash crops.
VN intends to use the results from the panel surveys and the contextual analyses to develop
agricultural policy papers relevant to the Government of Malawi and to the major multilateral and
bilateral donors to persuade them to invest in African agriculture rather than purchasing food
processed outside Africa even though it may have been grown in Africa.
This report is organised in five sections with the first four sections looking at each of the key
factors namely agricultural inputs, land, microfinance and markets exclusively. The fifth section
highlights the linkages amongst these factors in determining farmers’ decision making.
10
SECTION 1: AGRICULTURAL INPUTS
Introduction
Malawian smallholder agriculture is characterised by large numbers of very poor farmers heavily
dependent on low input maize production on small nitrogen deficient land holdings. Maize
production by these farmers is not normally sufficient to meet annual household consumption
needs, and they depend upon casual labouring and other income earning opportunities to finance
the purchase of the balance of their needs.
Raising smallholder farmers’ productivity is one of the major challenges for most developing
countries. One straightforward answer to raising smallholder farmers’ productivity as Jerven
(2014) observes, has been to subsidize agricultural inputs and thereby increase agricultural yields.
Jerven notes that governments of poor as well as rich countries have tended to subsidize
agricultural inputs such as seeds and fertilizers. In line with this, Ellis (1992) noted that subsidies
play a primary role of promoting the adoption of new technologies thereby increasing agricultural
productivity by allowing farmers to access purchased inputs such as seeds and fertilizers at a lower
cost, and reduce the disincentives to adoption that result from farmers’ cash constraints.
Subsidies were an integral part of the state-led development push in the 1960s and 1970s, but were
then scaled down as part of a larger trend of cuts in state spending during the Structural Adjustment
Programmes (SAPs) of the 1980s and 1990s. Now, however, subsidies are back on the agenda
once again. Baltzer and Hansen (2011) observed that the issue of subsidizing agricultural inputs
has been a controversial attracting divergent views with those that believe that agricultural input
subsidies offer the hope of inducing farmers to adopt the use of inputs thereby increasing
agricultural productivity. On the contrary, criticisms against subsidies include the fact that
subsidies distort markets. The other criticism is based on the impact of providing subsidized credit3
on the development of rural financial markets. Mkandawire, (1999) noted that even when it is
agreed that market-driven credit rationing is biased against the poor, there is disagreement as to
whether the interest charged on such specialized credit should be at “market rates”. Some scholars
argue that subsidized credit with low recovery rates undermines current efforts to establish market-
driven microfinance. In addition to distorting the markets, there are also substantial “leakages” of
subsidized credit away from those for whom it is intended towards the estates.
Political pressure to use the subsidised credit for political gains also aggravates the situation. For
example, during the run-up to the referendum on one-party rule and election in Malawi, rural credit
was used as a campaign tool against the one party regime to the extent that reversals in policy
encouraged default amongst the smallholder farmers. Mkandawire (1999) observed that as a
consequence of these arguments, subsidies together with other policies seen to cause “market
distortions” were targeted for removal under the International Monetary Fund (IMF) and World
SAPs. As part of the SAPs, the Malawi government adopted the Ffertilizer Subsidy Removal
Programme (FSRP) in 1983. This resulted in the aggregate rate of fertilizer subsidization falling
from 30.5 per cent in 1983/84 to 19.8 per cent in 1987/88. The FSRP was suspended between 1987
and 1992 to relieve the smallholder farmers from the burden of escalating fertilizer prices due to high
transport costs and the devaluation of the Malawian Kwacha. Resumption of the FSRP in 1993
resulted in an 11 per cent subsidy in 1994/95 and a zero per cent subsidy in 1995/96.
3 Credit offered at lower interest rates than the prevailing market rates

11
Faced with continuous hunger and food insecurity both at national and household level, the Malawi
government re-introduced Agricultural Input Subsidy Programme (AISP) in the 2005/06 farming
season. The AISP has in later years become to be known as the Farm Input Subsidy Program
(FISP). The FISP is a targeted intervention with the overall objective of improving access to
improved agricultural inputs by resource- poor smallholder famers’ in order to achieve household
and national food self-sufficiency and to raise famers’ incomes through increased food and cash
crop production. This has been the core objective of the FISP despite alterations to the design and
implementation of the program since the 2005/06 cropping season, Chirwa and Dorward (2013).
The major inputs in the Malawi FISP are maize fertilizers (basal and top dressing) improved maize
seeds (hybrids and Open Pollinated Varieties OPVs). In some cases there have been variations in
the subsidy package whereby in addition to maize, the program has also included crops such as
tobacco, legumes, and cotton alongside chemicals for cotton and maize storage chemicals, Annex
1. The latest the subsidy package for each beneficiary is comprised of one 50kg bag of NPK:
23:21:0 +4S; one 50kg bag of Urea (46%N); 5kg hybrid seed or 7kg composite/OPVseed; and 2kg
of legume seed (either groundnut or soya beans).
The reintroduction of subsidies by the Malawi government was in defiance to the IMF and World
Bank’s SAPs as mentioned previously. Unlike the universal subsidies that were implemented prior
to SAP, the current subsidy program targets the poorer and marginalized smallholder farmers.
Prior to the 2005/06 FISP, there had been a series of subsidy interventions but on a smaller scale
in terms of the quantities of fertilizer and seeds that were issued to the smallholder farmers. For
example, during the 1998/99 and 1999/2000 agricultural seasons, the Malawi government
introduced a free input distribution program known as the Starter Park. The program targeted all
smallholder farmers in the country (estimated at 2.86 farm families). The Starter Pack contained
0.1 ha-worth of fertilizer, OPV maize seed and legume seed. Following the starter pack program
was the Targeted Input Program (TIP), which was implemented from 2001 to 2004. Both the
starter pack and TIP aimed at increased national food production, especially for maize; incremental
use of chemical fertilizer by smallholder farmers for improved yield; reduced household food
insecurity, particularly for the poorest farm families; and provision of legume seeds to improve
soil fertility and diet, Levy and Barahona (2001). The TIP was scaled down in the 2004/5 season
which coincided with bad weather that resulted in poor maize harvest, which translated into high
prices and acute food shortages, Chibwana et al., (2010). In response, the Malawi government
reintroduced the targeted FISP during the 2005/6 agricultural season.
Quantities of the subsidy inputs (seeds, fertilizer and chemicals) and number of beneficiaries have
been varying over the years as presented in Annexes 2.1 and 2.2. The variations could be attributed
to budgetary constraints and ad hoc political interventions, for example the addition of
supplementary quantities that are allocated to some areas after the official budget figures have
been approved.
12
Targeting
Beneficiaries of the FISP are smallholder farmers who are considered poorer and vulnerable.
Vulnerable members of the community include guardians looking after physically challenged
persons, child-headed, female-headed and orphan-headed households and households infected or
affected with HIV and AIDS. In a study on factors influencing access to agricultural input
subsidies under the FISP, Chirwa et.al (2010) noted that vulnerable households such as the poor
and elderly-headed were less likely than other households to receive fertilizer coupons and hence
receive less of the subsidized fertilizers. Whilst, households with larger parcels of land and those
who sold part of their produce (commercialized) were more likely to receive coupons and acquired
more fertilizers, which clearly contradict the official targeting criteria. However, the study also
revealed that use of open meetings in the allocation of coupons, which was introduced in 2008/09,
tended to favour the poor and they received more fertilizer. A positive relation between
participation in other social safety nets and access to subsidized fertilizer coupons was also
observed suggesting that households which participated in other social safety net programmes
were not excluded from the input subsidy programme by virtue of benefiting from the other social
assistance programmes. However, evaluation of the 2008/09 subsidy program revealed that
female-headed recipient households got less subsidized fertilizers compared to male-headed
recipient households, yet female-headed households have severe affordability problems acquiring
only 21 kilograms of commercial fertilizers compared on average, to 64 kilograms acquired by
male-headed households, Chirwa et.al (2010).
Targeting and beneficiary identification criteria are very crucial to the success of the program
because they affect the effectiveness and efficiency with which the program achieves its
objectives. Dorward and Chirwa (2013) noted that targeting is important because of the way it
impacts on displacement4, productivity of input use, the direct benefits to beneficiaries, and wider
economic, social and environmental benefits. Targeting of beneficiaries also helps to determine
whether the intended beneficiaries are actually included in the program and whether they get the
right types and quantities of the subsidised inputs. It is noted that rarely are targeted subsidy
programs free of controversies and rivalry amongst community members due to the fact that not
all legible members of society benefit due to limited resources on the part of the implementing
agencies. A number of difficulties highlighted by Chirwa and Dorward (2013) are associated with
applying the beneficiary targeting criteria, such difficulties include: ambiguities, tensions and
contradictions among different targeting criteria; difficulties in clearly establishing measures for
applying these criteria due to large numbers of deserving households relative to the number of
coupons available; and that village leaders and agricultural extension staff involved in beneficiary
targeting may not consistently apply the set criteria, Dorwad and Chirwa, ibid.
Amongst the implementation strategies of the FISP was the development of criteria for beneficiary
identification to ensure that only deserving smallholder farmers benefit from the program. Through
evaluations of a series of the Malawi subsidy programmes implemented so far, Dorward and
Chirwa (2013) established that targeting occurs at two levels - area level and beneficiary level.
The area level targets the subsidies to different zones or districts while the beneficiary level targets
beneficiaries within already targeted areas. Dorward and Chirwa (2013) further observed that over
the years, implementation modalities of the FISP have varied with respect to criteria of targeting
4 The extent to which purchases of subsidised inputs replace purchases of unsubsidised inputs that farmers would
have bought anyway without the subsidy.
13
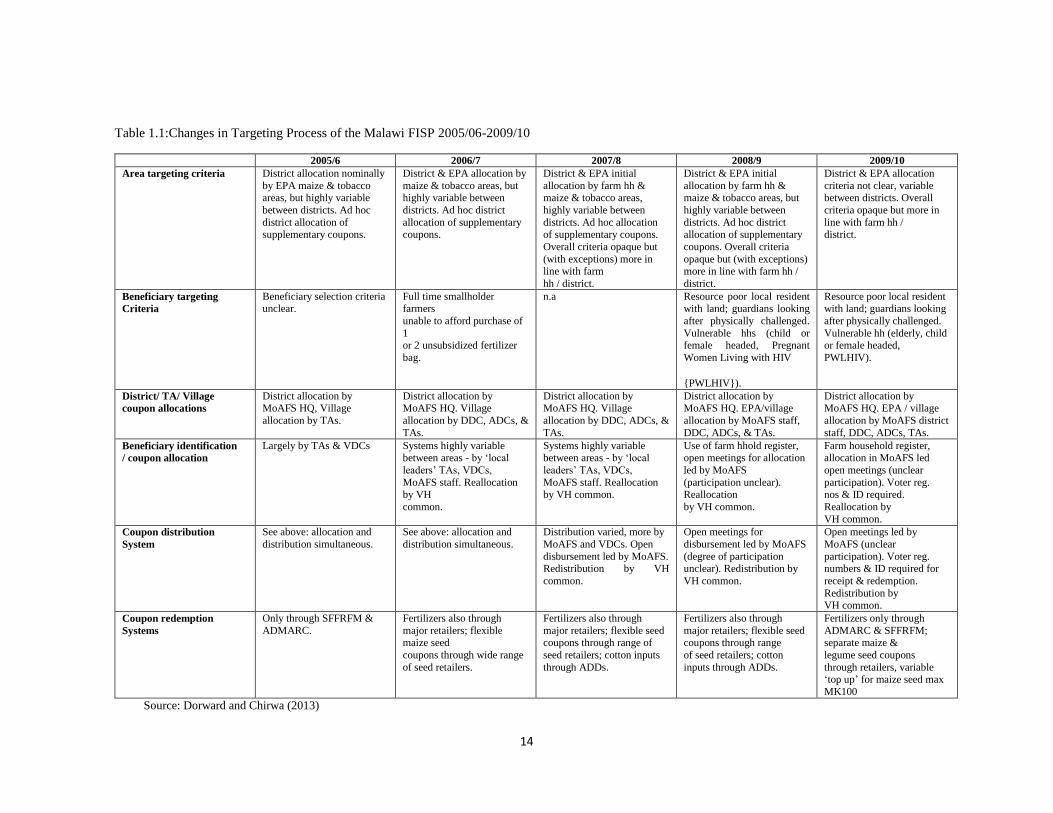
beneficiaries, coupon allocation, distribution and redemption, as shown in Table 1.1 Despite a set
of targeting criteria, variations occur between communities in the use of the targeting guidelines
due to the fact that the number of needy households tends to be much larger than the available
number of fertilizer coupons.
A study by the Kalondolondo Program (2013) revealed that community members from the
different study sites were satisfied with the selection process of the FISP beneficiaries. This is
evident from the increase in community members who regarded the selection process as totally
fair from 16 percent in 2012 to 40 percent in 2013. Similar results were reported by Makoka
(2013).
Gender Perspective of the FISP
Various studies have shown that women in African agriculture are marginalized in many respects
including access to extension services; access to productive resources such as land, and
microfinance; access to markets; and decision making at household level.
Improving women’s access to agricultural services and productive resources has, in some cases
resulted in positive impacts on women’s welfare and livelihoods. For example, Dorward et.al
(2008) highlights a number of positive impacts from the gender perspective. One of these impacts
was how women are able to afford education costs in the years when they have benefitted from
the subsidy program. In cases where agricultural extension officers encouraged formation of
fertilizer savings groups that included women, cooperation between group members was noted to
have positively affected social cohesion in villages and fostered innovation and the uptake of
technology by women. It is also noted that the subsidy program has resulted in change in attitudes
of people towards their land and own capacity to support themselves whereby household members
have increased confidence and enthusiasm regarding their earning potential in agriculture and their
capacity to feed their families. Reduced disputes over resources within households; some women
wanting to engage in market-oriented agricultural activity rather than focusing solely on the
domestic provision of food as evident from high demand for fertilizer among women, despite the
significant demands on women’s time (and safety) that procuring fertilizer under FISP requires.
Women have also used the profits or benefits from the subsidy to make further investments in
productive assets such as livestock.
14
Table 1.1:Changes in Targeting Process of the Malawi FISP 2005/06-2009/10
2005/6 2006/7 2007/8 2008/9 2009/10
Area targeting criteria District allocation nominally
by EPA maize & tobacco areas, but highly variable
between districts. Ad hoc
district allocation of supplementary coupons.
District & EPA allocation by
maize & tobacco areas, but highly variable between
districts. Ad hoc district
allocation of supplementary coupons.
District & EPA initial
allocation by farm hh & maize & tobacco areas,
highly variable between
districts. Ad hoc allocation of supplementary coupons.
Overall criteria opaque but
(with exceptions) more in line with farm
hh / district.
District & EPA initial
allocation by farm hh & maize & tobacco areas, but
highly variable between
districts. Ad hoc district allocation of supplementary
coupons. Overall criteria
opaque but (with exceptions) more in line with farm hh /
district.
District & EPA allocation
criteria not clear, variable between districts. Overall
criteria opaque but more in
line with farm hh / district.
Beneficiary targeting
Criteria
Beneficiary selection criteria unclear.
Full time smallholder farmers
unable to afford purchase of
1 or 2 unsubsidized fertilizer
bag.
n.a Resource poor local resident with land; guardians looking
after physically challenged.
Vulnerable hhs (child or female headed, Pregnant
Women Living with HIV
{PWLHIV}).
Resource poor local resident with land; guardians looking
after physically challenged.
Vulnerable hh (elderly, child or female headed,
PWLHIV).
District/ TA/ Village
coupon allocations
District allocation by MoAFS HQ, Village
allocation by TAs.
District allocation by MoAFS HQ. Village
allocation by DDC, ADCs, &
TAs.
District allocation by MoAFS HQ. Village
allocation by DDC, ADCs, &
TAs.
District allocation by MoAFS HQ. EPA/village
allocation by MoAFS staff,
DDC, ADCs, & TAs.
District allocation by MoAFS HQ. EPA / village
allocation by MoAFS district
staff, DDC, ADCs, TAs.
Beneficiary identification
/ coupon allocation
Largely by TAs & VDCs Systems highly variable between areas - by ‘local
leaders’ TAs, VDCs,
MoAFS staff. Reallocation by VH
common.
Systems highly variable between areas - by ‘local
leaders’ TAs, VDCs,
MoAFS staff. Reallocation by VH common.
Use of farm hhold register, open meetings for allocation
led by MoAFS
(participation unclear). Reallocation
by VH common.
Farm household register, allocation in MoAFS led
open meetings (unclear
participation). Voter reg. nos & ID required.
Reallocation by
VH common.
Coupon distribution
System
See above: allocation and
distribution simultaneous.
See above: allocation and
distribution simultaneous.
Distribution varied, more by
MoAFS and VDCs. Open
disbursement led by MoAFS. Redistribution by VH
common.
Open meetings for
disbursement led by MoAFS
(degree of participation unclear). Redistribution by
VH common.
Open meetings led by
MoAFS (unclear
participation). Voter reg. numbers & ID required for
receipt & redemption.
Redistribution by
VH common.
Coupon redemption
Systems
Only through SFFRFM &
ADMARC.
Fertilizers also through
major retailers; flexible maize seed
coupons through wide range
of seed retailers.
Fertilizers also through
major retailers; flexible seed coupons through range of
seed retailers; cotton inputs
through ADDs.
Fertilizers also through
major retailers; flexible seed coupons through range
of seed retailers; cotton
inputs through ADDs.
Fertilizers only through
ADMARC & SFFRFM; separate maize &
legume seed coupons
through retailers, variable ‘top up’ for maize seed max
MK100
Source: Dorward and Chirwa (2013)

15
Constraints
Implementation of the subsidy program has had numerous constraints over the years. Some of the
constraints identified in evaluation studies of the program have included; markets opening late in
the season for farmers to access the inputs on time; some markets running out of stocks before
beneficiaries redeem their coupons; long queues resulting in beneficiaries spending much of their
time at the market (Dorward et.al, 2013, Dorward and Chirwa, 2011, Chirwa and Slater, 2010).
Some of these problems lead to delays in planting and/or fertilizer applications which have a
negative effect on yield.
Exclusion errors5 are also reported whereby some community members feel that deserving
beneficiaries (poorest and/or most deserving households) are left out of the program (Chirwa, et.al
2010, Chirwa and Dorward, 2013, Dorward and Chirwa, 2013). Errors of inclusion6 were also
reported in some of the studied communities in Makoka, (2013). Finally but not least, incidents of
leakage of coupons from intended beneficiaries to unintended beneficiaries are reported in a
number of studies (Makoka, 2013, Holden and Lunduka, 2010) whereby traditional leaders (village
heads) and officials from Ministry of Agriculture and Food Security (MoAFS) are among some of
the individuals that sell coupons. Makoka (2013) indicates that MoAFS officials would
deliberately over-estimate the number of potential beneficiaries so that they sale the excess
coupons. Likewise, the 2013 Kalondolondo report identified a number of ‘ghost’ villages whose
coupons would then be sold by MoAFS officials.
Budget and cost of the FISP
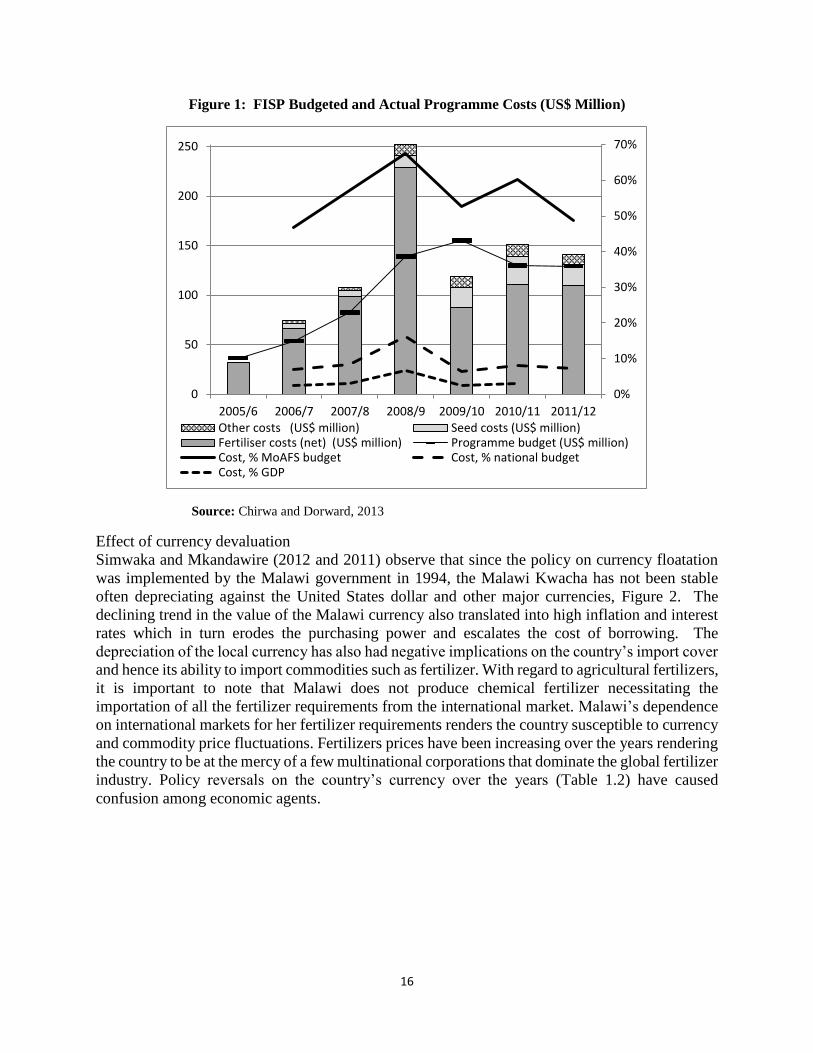
The budget and cost of the FISP has been increasing over the years since inception of the program.
Actual expenditure on the program has been exceeding what is budgeted for in the national budget
for each of the years the program has been implemented. Since 2006/07 agricultural season, the
cost of the FISP has exceeded 50% of the total budget allocation to the Ministry of Agriculture
and Food Security, see Figure 1, Doward and Chirwa (2013).
6 Situation where a member who did not qualify for FISP, was admitted to the programme. 6 Situation where a member who did not qualify for FISP, was admitted to the programme.
16
Figure 1: FISP Budgeted and Actual Programme Costs (US$ Million)
Source: Chirwa and Dorward, 2013
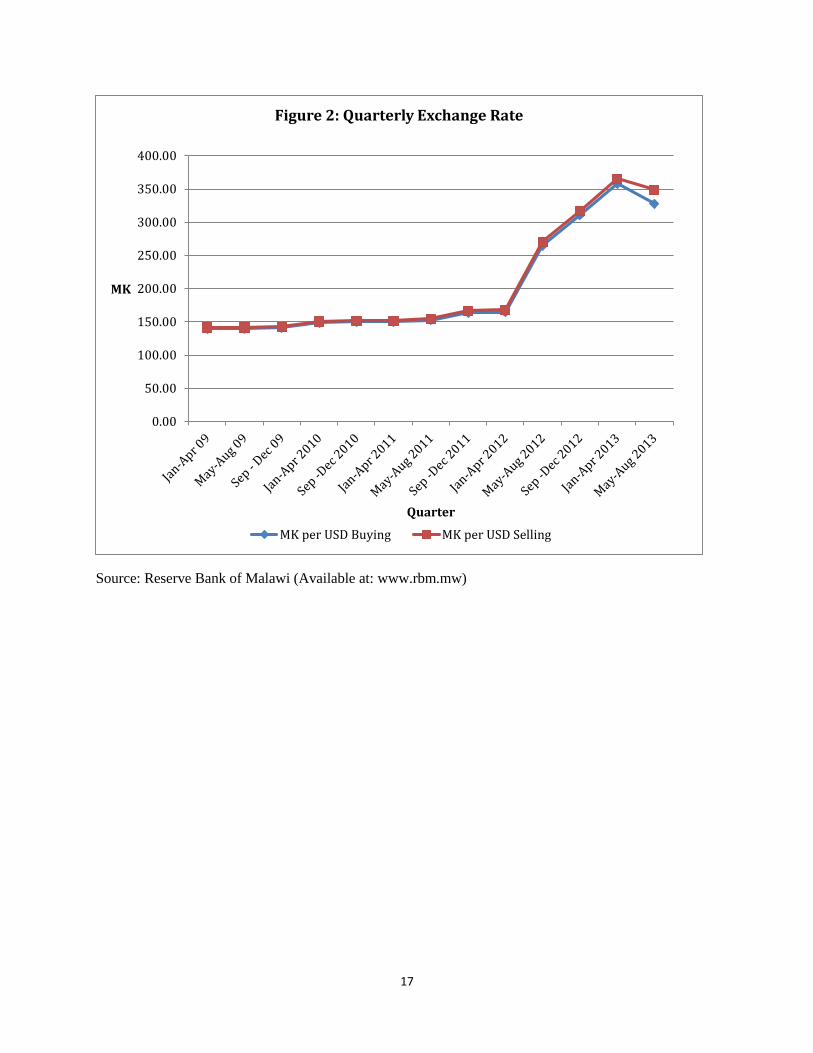
Effect of currency devaluation
Simwaka and Mkandawire (2012 and 2011) observe that since the policy on currency floatation
was implemented by the Malawi government in 1994, the Malawi Kwacha has not been stable
often depreciating against the United States dollar and other major currencies, Figure 2. The
declining trend in the value of the Malawi currency also translated into high inflation and interest
rates which in turn erodes the purchasing power and escalates the cost of borrowing. The
depreciation of the local currency has also had negative implications on the country’s import cover
and hence its ability to import commodities such as fertilizer. With regard to agricultural fertilizers,
it is important to note that Malawi does not produce chemical fertilizer necessitating the
importation of all the fertilizer requirements from the international market. Malawi’s dependence
on international markets for her fertilizer requirements renders the country susceptible to currency
and commodity price fluctuations. Fertilizers prices have been increasing over the years rendering
the country to be at the mercy of a few multinational corporations that dominate the global fertilizer
industry. Policy reversals on the country’s currency over the years (Table 1.2) have caused
confusion among economic agents.
0%
10%
20%
30%
40%
50%
60%
70%
0
50
100
150
200
250
2005/6 2006/7 2007/8 2008/9 2009/10 2010/11 2011/12Other costs (US$ million) Seed costs (US$ million)Fertiliser costs (net) (US$ million) Programme budget (US$ million)Cost, % MoAFS budget Cost, % national budgetCost, % GDP
17
Source: Reserve Bank of Malawi (Available at: www.rbm.mw)
0.00
50.00
100.00
150.00
200.00
250.00
300.00
350.00
400.00
MK
Quarter
Figure 2: Quarterly Exchange Rate
MK per USD Buying MK per USD Selling

18
Table 1.2: Policy Decisions on Malawi’s Currency
Year Policy action on the currency
Feb 94-Nov 94 Floating
Dec 94-June 97 Fixed
July 97-July 2003 Flexible
Aug03-Feb05 Fixed
Mar05-Jun05 Flexible
July05-Dec05 Fixed
Jan06-Nov07 Flexible
Dec07-April12 Fixed with occasional devaluation
May 2012 Devaluation and floating
Source: Ngwira (2012)
Apart from the negative effects at country level, depreciation of the local currency also erodes
smallholder farmers’ purchasing power because the farmers do not get better revenues from their
produce sales to enable them purchase inputs in absence of the subsidy. On the part of the
government, its ability to continue with the subsidy programme at the same level is also
jeopardized by the currency depreciation.
While it may be necessary for the government to provide direct support to small farmers, more
dollars spent on fertilizer imports implies less money for other public expenditure. Continuing
high fertilizer prices on the international market is likely to exert more pressure on the national
budget of which 40 per cent is donor funded.
Policy Options/Alternatives
A number of policy options are provided in studies on Malawi’s FISP, (Doward and Chirwa, 2013,
2011, 2008, Holden and Lunduka, 2010, Chibwana et. al., 2010). Among the various alternatives
to achieving an effective farm input subsidy are the following suggestions: The government should
consider introducing the component of graduation7 to free up some resources that can be invested
in other productive sectors, even within the agricultural sector. The governments should also
withdraw from direct involvement in the importation and distribution of fertilizers. Instead, the
government should put in place a regulatory framework on the implementation of the subsidy
program and its monitoring process while the private sector assumes an active role in the
importation and distribution of the farm inputs.
Furthermore, the government should facilitate easy access to financial services and other loan
facilities for the smallholder farmers. The subsidy program should include complementary
services to make subsidized fertilizer accessible and its use more effective. The complementary
services include extension services, improved seed, credit access, and support for irrigation and
pesticides. The subsidy program should also be designed in a way that allows for the involvement
of farmers, importers and agro-dealers in the design and implementation of the subsidy program.
Efforts must also be made to strengthen the capacity of the existing private fertilizer market. This
can be achieved through provision of support through some of the following measures: i) acting
7 Movement of people from state of dependence to self-reliance

19
as credit guarantee or issuance of letters of credit for importation of fertilizers; ii) building up the
private import and distribution network by supporting and investing in training, exposure and
credit facilities; iii) training local importers and linking them with international networks of traders
and financial institutions.
References
Baltzer, K., and Hansen, H, 2011.’Evaluation Study Agricultural input subsidies in Sub-Saharan
Africa’: Institute of Food and Resource Economics, University of Copenhagen.
Chibwana1, C., Fisher, M., Jumbe, C., Masters, W. and Shively, G. 2010. ‘Measuring the Impacts
of Malawi’s Farm Input Subsidy Program.
Chirwa, E. , Matita, M., and Dorward, A., 2010. Targeting Agricultural Input Subsidy Coupons in
Malawi’.
Chirwa, E. W., Matita,M., and Dorward, A. , 2013. ‘Factors Influencing Access to Agricultural Input
Subsidy Coupons in Malawi’: Policy Brief
Chirwa, E., and Dorward, A. 2013. ‘Agricultural Input Subsidies; The Recent Malawi
Experience’: Oxford Press.
Dorward, A. and Chirwa, E. 2011, (b). ‘’The Malawi Agricultural Input Subsidy Programme:
2005-6 to 2008-91’: International Journal of Agricultural Sustainability (IJAS), January
2011,vl9:1
Dorward, A. and Chirwa, E. 2011,. (a). ‘’Evaluation of the 20010/11 Farm Input Subsidy
Programme, Malawi:Report on Programme Implementation’
Dorward, A. Kydd, J., Lyon, F., Poole, N., Poulton, C., Smith, L. and Stockbridge, M., 1998.
‘Commercial Financing of Seasonal Input Use By Smallholders in Liberalised Agricultural
Marketing Systems’: Odi Natural Perspective Number 30, April 1998.
Dorward, A., Chirwa, E. , 2013. ‘Targeting in the Farm Input Subsidy Programme in Malawi:
Issues and Options’: Future Agricultures.
Dorward, A., Chirwa, E., ,2008. ‘Evaluation Of The 2006/7 Agricultural Input Subsidy
Programme’, Malawi Final Report.
Dorward, A., Chirwa, E., Jayne, T.S,(undated). ‘Chapter 7: Malawi’s Agricultural Input Subsidy
Program Experience Over 2005–09’FULL REF ?
Dorward, A., Chirwa, E., Kelly, V., Jayne, T., Slater, R., and Boughton, D. 2008.’Evaluation of
the 2006/7 Agricultural input Subsidy Programme, Malawi Final Report’: School of Oriental and
African Studies (SOAS), London.
Ellis, F. 1992. Agricultural Policies in Developing Countries. Cambridge, U.K.: Cambridge
University Press.
20
Holden, S., Lunduka, R., 2010. Too poor to be efficient? Impacts of the targeted fertilizer subsidy
program in Malawi on farm plot level input use, crop choice and land productivity: Norwegian
University of Life Sciences
Jerven, M., 2014. ‘The Political Economy of Agricultural Statistics and Input Subsidies: Evidence
from India, Nigeria and Malawi’: The Journal of Agrarian Change, Vol. 14 No. 1, January 2014,
pp. 129–145.
Kalondolondo PIU, 2013. ‘Service Users’ Feedback of the Implementation of the Farm Input
Subsidy Programme in Malawi for the Years 2013 and 2013’: Kalondolondo Programme
Implementation Unit, Lilongwe.
Levy, S. and Barahona, C., 2001. 2000-01 Targeted Inputs Programme (TIP): Main Report of the
Monitoring & Evaluation Programme.
Makoka, D. 2013.’Smallholder Farmers’ Perceptions and Household Impact of The Malawi Farm
Input Subsidy Program’: Report submitted to ADRA Malawi.
Mkandawire, T., 1999. ‘Agriculture, Employment and Poverty in Malawi’. International Labour
Organization: ILO/SAMAT Policy Paper No. 9.
Ngwira, N. 2012. ‘Drivers of Economic Growth in Malawi’. Paper Presented at ECAMA Annual
Conference; November 2012
Simwaka and Mkandawire, (2011.) ‘The Efficacy of Foreign Exchange Market Intervention in
Malawi’. AERC Research Paper 216, African Economic Research Consortium, Nairobi.
Simwaka, K., and Mkandawire,L., 2012 ‘The Efficacy of Official Intervention in the Foreign
Exchange Market in Malawi’. African Development Review, Vol. 24, No. 2, 2012, 125–136.

21
SECTION 2: AGRICULTURAL LAND
Introduction
Malawi’s surface area is estimated at 118,000 km2 and with a population of about 15 million
people, the country is considered as one of the most densely populated countries in Sub-Saharan
Africa. The land resource is spatially distributed and in differing quantities across different
locations throughout Malawi. Such distribution of land is not static as people have the ability to
alter the mix and hence change its availability value and productivity. Through their various
actions, people can conserve or deplete the existing resources. In addition to this, people can also
invest time and effort to improve the stock of certain land resources thereby improving
accessibility and usage. Policies on land in terms of legal framework, access to land, title to land,
land use and land market therefore have a greater impact on people’s attitude and action towards
land.
Because of the relevance of policies on land, the Malawi government, through the Ministry of
Lands and Housing formulated the Malawi National Land Policy in 2002. One of the major reasons
behind the Malawi land policy was to bring parity between land tenure categories and to check the
willy-nilly conversion of land under customary tenure into other tenure categories. The land policy
therefore embodies the country’s vision from the political context as well as economic and social
significance. The land policy empowers the Malawian citizen and communities to take active
interest in their affairs towards land. The policy serves as a powerful symbol and focus for local
development effort, provides a mechanism for reconciling widely differing attitudes towards
Malawi’s developmental challenges and it sets forth as a national guideline for action, the
incorporation of desirable principles of land use and management, effective civic education and
broad public appreciation of the constraints and trade-offs that need to be made, (Government of
The Republic of Malawi, 2002). The policy provides a sound institutional framework for
democratizing the management of land and introduces much needed procedures for protecting land
tenure rights, land based investments and management of development at all levels. Furthermore,
the land policy aims at ensuring equal opportunities for the acquisition, use and enjoyment of land
for all citizens.
In respect of vulnerable groups, the government recognizes that more often than not, the rights of
women, children and the disabled are denied on the basis of customs and traditions that are no
longer relevant, or they are totally disregarded due to prejudice and lack of effective representation.
In view of this, coupled with the effects of increasing land pressure due to population growth as
well as the devastating effects of HIV and AIDS pandemic, the government attests to the need for
a clear policy on gender access and the rights of children and the disabled.
Land Tenure System
One of the major provisions in the Malawi land policy is the land tenure system which
distinguishes the different land categories including that between Government and Public Land.
The land policy also makes a clarification with respect to customary land and land under leasehold.
The policy further clarifies on land access and tenure reforms; land access for non-citizens; land

22
use planning and registration; land administration and dispute settlement; as well as crosscutting
and inter-sectoral issues.
Categories of Land Tenure
The Malawi land policy affirms that “the radical title to all land in Malawi, irrespective of land
tenure regime, will continue to be vested in the state, traditional authorities and in some cases
individuals and families”. This is based on the premise that the welfare and development
objectives of the nation can best be achieved within a system of private ownership of interest and
participatory governance. The policy also ascertains that every person has a natural dependence
on land and it is therefore the responsibility of the government to assure the private rights of
citizens by making provisions for secure and equitable access to land as a multi-purpose resource
and an economic asset. In terms of property ownership, land inclusive, the Constitution of the
Republic of Malawi stipulates that every person shall be able to acquire property alone or in
association with others and that no person shall be arbitrarily deprived of property8. In this regard,
the land policy makes a distinction among the following land categories; government land; public
land; customary land; leasehold land; and freehold land.
Government Land: the policy defines this category of land as land exclusively acquired and
privately owned by the government to be used for dedicated purposes such as government
buildings, schools, hospitals, public infrastructure or made available for private use by individuals
and organizations.
Public land: defined as land held in trust and managed by the Government or Traditional
Authorities (TA) and openly used or accessible to the public at large. This category of land includes
land gazetted for use as national parks, recreation areas, forest reserves, conservation areas, historic
and cultural sites, etc. The public land designation also applies to all land vested in the Government
as a result of uncertain ownership, abandonment and land that is unusable for one reason or
another. Within the traditional set up, i.e. under the Traditional Authority, the community’s public
land includes all land within the boundaries of the TA not allocated exclusively to any group,
individual or family9. Such common access or unallocated customary land reserved for the
community are regarded as public only to members of a particular community.
Prior to the 2002 National Land Policy, lack of distinction between Government Land and Public
Land caused a lot of mistrust and confusion among citizens and land administrators. The public
land designation was used to effectively expropriate customary land without compensation which
was the root cause of most land problems in Malawi. The distinction between Government and
Public Land in the current land policy makes the Government’s acquisition plans more transparent.
The distinction is also necessary for separating land held in trust by the Government from land
acquired by the Government for which ownership is actually transferred to the Government.
Customary land: With regard to customary land, the policy refers to land managed by TAs,
common access land reserved as dambos10, community woodlots, etc. Such land is classified as
8 Section 28 of the Constitution of the Republic of Malawi 9 This applies to areas such as dambos, dry season communal grazing areas, etc.
10 Refers to permanent wetlands

23
public land exclusive to members of the TA. The government recognizes that failure to reform and
secure the tenure rights of smallholders has been the primary cause of under investment, reliance
on primitive technology and a fundamental reason for low wages in most rural areas. In view of
this, and with respect to customary land, the policy stipulates that government will allow all
customary land to be registered and protected by law against arbitrary conversion to public land.
The traditional supervisory role of chiefs, clan leaders, headpersons and family heads in land
matters will be formalized and streamlined to allow uniform administrative procedures and
transparency in all customary land transactions. Furthermore, the policy states that all customary
landholders11 will be encouraged to register their holdings as private customary estates with land
tenure rights that preserve the advantages of customary ownership but also ensures security of
tenure.
Private land: defined as all land that is exclusively owned, held or occupied under (a) freehold
tenure, and (b) customary land allocated exclusively to a clearly defined community, corporation,
institution, clan, family or individual. For Private Leasehold Tenure, the policy states that estates
shall be created as subsidiary interests out of any private land, including registered customary
estates without relinquishing the ownership of the customary landholder. This provision allows
traditional leaders, family heads and individual holders of registered customary land to grant
leases.
Leasehold estate: created out of government land or any private land including customary estates.
The leasehold which is recognized as a legitimate source of land title is a private contractual right
subject to the enforcement of development conditions imposed by the owner. The lease grants
exclusive use rights and hence a leasehold estate is also regarded as private land held by the
leaseholder.
Freehold: this tenure category has some unique features that provide security of tenure and
exclusive user rights. These features include; (a) how a freeholder has exclusive possession of the
land in perpetuity, there are no term limits placed on the title of the owner; (b) subject to land use
planning, the owner has the right to subdivide or lease the land, etc., without seeking the
government’s approval; (c) no development conditions are imposed on the owner if the land in
question lies outside the boundary of a planning area; and (d) the government has no legal right to
interfere with the occupational right to land.
Based on these unique features, freehold tenure is often misconstrued to be above the law.
However, that is not the case because based on Section 207 of the Constitution of the Republic of
Malawi, all land in Malawi including the freehold is vested in the Republic of Malawi.
Land tenure can change from one form to another, however, most Malawians access land through
inheritance (52%) and marriage (18%), USAID, (undated). Rights to land through marriage and
11 Defined to include entire communities, families or individuals
24
inheritance are governed by either matrilineal12 or patrilineal customary system. Under customary
land tenure, land is allocated from traditional leaders to his/her subordinates. Customary land can
be converted to leasehold tenure upon consent from the local leaders whereby the new owner is
offered title deed by the government. Thus in such cases, jurisdiction over land changes from local
leaders to government. Government resettlement programs, and land purchase are additional routes
through which individuals access land. USAID, (undated) also noted that an estimated 20% of
landholders obtain land from traditional authorities; roughly 1% of landholders obtain land through
purchase. Leases, government land programs, and other means account for the remaining
percentage (9%). In urban areas, Local Assemblies and agencies such as the Malawi Housing
Corporation allocate plots in the areas within their jurisdiction (Kambewa 2005; Matchaya 2009;
Chirwa 2008; GOM 2002), as cited by USAID (ibid).
Land Availability at national Level and Study Districts
Land is one of the basic and key resources in agricultural production. The land resource is quite
valuable to people depending on the classification of the resource. For example the land can be
classified into arable land which is of much interest for agricultural purposes. The land can further
be classified into other valuable categories such as forest, pasture, wildlife habitat and marine
ecosystems. Attempts were made to collect data on agricultural land from the agricultural district
offices in the three study districts as presented in Table 2.1.
Various sources of information on land including district socio-economic profiles (SEP) for the
three districts13, and personal interviews with officials from the district agriculture offices and
Department of Land resources. According to the Mchinji district socio-economic profile,
smallholder agriculture production accounted for 167,731 ha of land with land holding size of
about 2.0 ha and over 141,347 farm families within the smallholder subsector. Mchinji district has
over 2,000 estates all of which account for 91,329 ha of land.
Lilongwe district has about 429,435 hectares of arable land for smallholder agriculture with an
average landholding size of 1.30ha per farmer and 11,525 ha are under estate farming. As of
2010, the district had a total of 339,841 farm families.
Salima district has a total land area of 2,196 Km. Sq (219,600 Ha.) with a total of 99,729 farm
families. cultivating a total of 107,377 hectares, which is mostly arable land. The district has 78%
of its land under the customary tenure system mainly used for subsistence farming, 18% under
private land tenure and 4% under public land tenure system.
12 Under matrilineal system, powers and rights over land are vested along maternal lineage and vice versa for
patrilineal system. 13 At the time of the study, Salima and Lilongwe districts had the most recent versions of the district socio-economic
profiles spanning from 2011 to 2016 while that of Mchinji was outdated (2008-2012)

25
The challenge in collecting statistics on land from the three districts and other sources was lack of
such data from the different sources including government departments.
Table 2.1: Statistics on Land
Lilongwe Mchinji Salima
Land use classification
Total ha 525,300 335,600
Customary land 127,650 156,459 175,987.50
Public land 70,250 20,135 40,612.50
Lease land 327,400 55,102.20 9,025
Total arable land 429,435 222,445
High agriculture potential 11,600
Medium agriculture potential 157,100
Low agriculture potential 39,800
Unsuitable for agricultural
production 127,700
Land currently cultivated 208,500
Grass land 100,100
Plantation forests 17,500
National Forests and woodlands 248,000 333,221
open water 300
Built up area 9,700
26
It was noted in course of compiling this data that there are variations in the databases at district
level in terms of categories of land captured, and other details such as average land holding sizes
for the different types of households. Some districts like the case of Lilongwe have somewhat
detailed data compared to the other districts. This is one of the areas that government can
emphasize on to have detailed and recent district level data for different variables to help in
planning, budgeting and forecasting.
The Malawi government with assistance from the Food and Agriculture Organisation (FAO) in
collaboration with other partners undertook the assessment of land resource using FAO
methodology and tools, FAO (2013). The main objective of the land cover change mapping
component was the preparation of an accurate, up-to-date and reliable land cover change database
of Malawi in order to improve effective and focused decision making on landscape dynamics and
climate change related issues. Results of the land cover at national level including the study
districts are presented in Annex 3. This land cover and land classification forms the basis on which
the government can institute a nationwide land redistribution program to alleviate land constraints
among smallholder farmers and also to enhance productivity. The following section discusses
potential for land redistribution and associated barriers.
Opportunities and Barriers to Land Redistribution to Smallholder Farmers
Opportunities
Malawi being an agricultural based economy with more than 80 per cent of its rural population
engaged in agriculture, access to land has direct impact on livelihoods and quality of life for the
rural people. Problems of access to land are particularly pronounced in Southern region where
population densities in some districts are highest in Africa (Machira, 2009). 1994 estimates on
land indicate that 2.6 million hectares of suitable land were uncultivated in rural Malawi. This
represented 28 per cent of total national land area lying idle with the northern and central regions
having much of the idle land compared to the southern region due to skewed population
distribution across the country and because of colonial and post-colonial policies on land
allocation. During both colonial and post-colonial periods, the state favored concentration of most
fertile and well watered land within the hands of relatively few people through leases of large
estates to European settlers and after independence to the then Malawi Young pioneers. According
to World Bank (2004) an estimated 1.1 million ha of land was held by about 30,000 estates with
land holding sizes ranging from 10 to 500 ha. A large number of such estates are currently
underutilized while majority of smallholder farmers have landholdings of less than 0.4 ha.
With rapidly growing population estimat5ed at 2.8 per cent growth rate, (NSO, 2012, smallholder
land holdings are gradually declining and the frontiers of land available for allocation from the
traditional chiefs have declined and most land is inherited from parents, Chirwa (2004). The 2008
Malawi Population Census estimated the country’s population at 13,077,160 with an average
annual/inter-censal growth rate of 2.8. The National Statistical Office (NSO) indicates that
Malawi’s population is growing rapidly increasing from 4 million people in 1966 to 13.1 million
in 2008 in just over 40 years and the it is expected that the population will continue to increase

27
steadily growing to 26 million in 2030, NSO (2012). Chirwa (2004) further noted that there is
evidence in Malawi that adoption of agricultural productivity-enhancing technologies is positively
associated with the size of cultivatable land and that farmers with small land holdings are
technically inefficient yet no efforts are made to redistribute the land to the landless on a wider
scale. Liberalisation of tobacco production rendered most estates unprofitable which resulted in
most landowners willing to sell their land while others left their estates underutilized. This created
a favourable situation for land redistribution based on voluntary or negotiated land transfers.
The MPRSP (2002) identified two ways in which the problem of small land holdings among
smallholder farmers can be addressed and these are: 1) ensuring security of tenure which would
help in developing the land market in Malawi; and 2) distributing land to the landless. Security
of tenure helps in developing the land market, which has implications on poverty reduction such
as facilitating access to financial or physical capital and rent or sales. The 2002 Malawi land
policy categorised and clarified the different land categories and tenure systems with the aim of
minimising disputes over land and to enhance security of rights over land for improved land
management and productivity.
Under the World Bank funded project on Community Based Rural Land Development Project
(CBRLDP), land redistribution has been piloted in the districts of Machinga, Mulanje, Mangochi
and Thyolo in the southern region of Malawi. This project set a better foundation for scaling the
program to other parts of the country. Thus through the CBRLDP, the Malawi Government bought
some of the estates in the piloted districts for redistribution to land constraint citizens. The pilot
districts are among those with high population densities in the country with a total population
estimated at 2.4 million people representing 18 per cent of the country’s total population,
(Government of Malawi, 2008 Population Census).
In view of the fact that the study districts of Lilongwe, Mchinji and Salima are in the region of
high agricultural productivity in especially Lilongwe and Mchinji districts, and the fact that there
are still some estates lying idle in these districts, the land redistribution program can be extended
to these districts. Discussions with the Crops Officer for Salima district revealed that there is
potential for land redistribution in the country based on the fact that some of the TAs in the district
have more underutilized land than others.
Barriers to Land Redistribution
There are a number of barriers that the CBRLDP and other land redistribution policies face in the
course of implementation. For CBRLDP in particular, lack of transparency and understanding
between parties including insufficient planning was one of the challenges encountered.
Additionally, the selection criteria for beneficiaries was not clearly laid out and explained to
communities. Promises to provide social amenities such as clean water, school, hospitals and
markets were not fulfilled. Also, a number of undeserving beneficiaries were given plots while
deserving beneficiaries were unable to maintain their plots because they did not have resources to
develop their plots. As a result, some of the beneficiaries sold their plots and returned to their
places of origin, Machira (2009). In addition to these problems there was low capacity of land
agencies to establish authenticities of the titleholders check their indebtedness and approve new
deed plans. Scatteredness of the estates and outdated records further exercebates the problem on
28
land redistribution. Integrating the beneficiary groups and the surrounding communities also poses
a problem due to differences in social-cultural beliefs. Such challenges could likely be encountered
in similar land redistribution programs for other parts of the country such as the study districts of
Lilongwe, Mchinji and Salima.
References
Chirwa, E.W., 2004. ‘Access to Land, Growth and Poverty Reduction in Malawi’: University of
Malawi, Chancellor College.
Cross, S., 2002. ‘Customary Land Tenure, Taxes and Service Delivery in Rural Malawi: A Review
of Institutional Features of Rural Livelihoods’: LADDER Working Paper No.21
FAO, 2012. ‘Atlas of Malawi Land Cover and Land Cover Change 1990-2010’.
Government of Malawi – National Statistical Office, 2012. ‘Malawi Population Data Sheet 2012’
Government of Malawi, 2002. ‘Malawi Poverty Reduction Strategy Paper’.
Government of Malawi, 2002: ‘The Constitution of the Republic of Malawi’.
Government of Malawi, 2011: ‘Statistical Yearbook’: National Statistical Office.
Government of the Republic of Malawi, 2002. ‘Malawi National Land Policy’: Ministry of Lands
and Housing.
Machira, S., 2009. ‘Piloting Testing a Land Re-distribution Program in Malawi: Land
Redistribution: Toward Greater Consensus’. World Bank, 2009, Edited by Hans P. Binswanger-
Mkhize, Camille Bourguignon, Rogerius Johannes Eugenius van den Brink.
USAID, (undated). ‘Country Profile Property Rights and Resource Governance Malawi’.
World Bank, 2004. ‘Project Appraisal Document for the Community Based Rural Land
Development Project’: Report No.28188-MAI
29
SECTION 3: MICROFINANCE
Introduction
Access to financial services is an important component for enterprise productivity the world over.
In Sub-Saharan Africa, where most people live in rural areas and agriculture is the main activity
of the rural economy, access to financial services of all kinds remains to be poor. Under the
influence and sponsorship of the IMF and the World Bank, the financial sector in Malawi was
liberalized in the 1980s as part of the SAPs. Before the SAP, government had greater control of
the banking sector through regulation of credit and interest rates. Prior to the liberalization of
Malawi’s financial sector, most of the financial institutions operated in urban areas with the
exception of commercial banks and credit unions. The commercial banks concentrated on offering
working capital, mainly to large-scale business enterprises and the development banks relied more
on foreign resources than on domestic resource mobilization to finance their operations. By 1994,
the financial sector was completely liberalized, (Micro Finance Transparency –MFT 2011). MFT
observes that the financial sector’s access to credit has historically been restricted by both the
limited availability of loanable funds and lack of resources to administer an extensive credit
network. Furthermore, credit providers have also suffered from controls, inflexibility, and high
administrative costs.
Although the microfinance subsector has often focused on serving trade and industry in urban,
peri-urban and densely populated rural areas, microfinance services are also critical to businesses
and households in the agricultural sector most of which are also rural based. Burritt (2005) noted
that millions of poor, vulnerable non-poor, and unbanked households want financial services yet
financial intermediaries like commercial banks generally do not serve these households. The
commercial banks do no serve the poor for a variety of reasons including unsuitable models,
collateral requirements which the poor often cannot afford and the unjustly belief by most
conventional banks that the unbanked are unwilling and unable to repay loans and save money.
A variety of institutional models have emerged globally to serve microfinance markets including
specialized microfinance banks, nongovernmental organizations (NGOs), credit unions, credit
cooperatives, non-banking financial institutions, and commercial banks that develop new lines of
business or specialized subsidiaries that focus on microfinance market segments. Burrit (ibid)
observed that the spectrum of potential microfinance clients is broad. In Malawi this includes
women in the informal sector working at home to produce prepared foods to sell outside the home;
venders selling vegetables or fish in an open-air market and a farming household that seeks access
to credit to buy farm inputs or a farming family that establishes a contract with a buyer before the
harvest and hence seeks financial assistance to enable the family to produce in compliance to the
contractual agreements.
Given the predominance of smallholder farmers in the agricultural sector,financial services in the
rural areas are therefore critical to support the productive activities thereby contributing to
economic growth and poverty reduction. Despite the crucial role that financial services play in
rural farming, institutions supplying rural and agricultural financial services to rural communities
are faced with special challenges. These challenges include greater exposure to systemic risks such
as droughts and floods, higher transactions costs, weak physical infrastructure, seasonality in
production, and greater price volatility.

30
Historical Financing Arrangements for Small Farmers
Limited purchasing power by smallholder farmers is one of the most binding constraints on the
use of fertilizer and improved seeds by the smallholders. Another major constraint on smallholder
farmers’ inability to increase productivity is the lack of access to credit or the prohibitive cost of
borrowing in the form of high interest rates in both formal and informal financial markets. Dating
from the colonial days to post independence period, smallholder farmers hardly had any formal
access to financial credit. The one party regime in the post independent period deliberately
supported the estate sub-sector with access to cheap financial credit from commercial banks while
smallholder farmers were restricted to subsidized fertilizers sold through the Agricultural
Development and Marketing Corporation (ADMARC). During this period, the government
simply commanded the banks to allocate a considerable amount of credit to estates and in addition,
ADMARC funds were recycled so as to benefit estate agriculture14.
Financial Regulatory Environment and Current Micro-financing Institutions
Regulatory Environment
The Government of Malawi (GoM) recognizes that a more inclusive financial system is critical to
the development of the country’s economy. The government believes that inclusive finance is an
essential instrument for increasing agricultural productivity and production, expanding micro and
small enterprises, creating employment, increasing household income and smoothening
consumption, UNCDF/GoM, (2007). In this context, Malawi has, in recent years undertaken some
reforms in the financial sector. For example, in 2007, the government, in partnership with United
Nations Development Program (UNDP) and the United Nations Capital Development Fund
(UNCDF) launched a project called Financial Inclusion in Malawi (FIMA). FIMA aims at
increasing sustainable access to financial services to Malawi’s low income population, thereby
contributing to the achievement of both the MGDS and the Millennium Development Goals. The
project has adopted a sectoral approach positioning the development of microfinance in the overall
financial sector including banking and capital markets. In addition to this, a four-year National
Strategy for Financial Inclusion was launched in October 2010 with the aim of improving delivery
of quality and diverse financial services to the excluded population from 2010 to 2014.
In 2010, Malawi developed the Financial Services Act (FSA) to facilitate regulating the entire
financial sector. The FSA provides the Registrar with power to issue directives relating to the
conduct of financial institutions and supervise compliance. Until the 2010 financial sector reforms,
only banks were subject to supervision and regulation by the Reserve Bank of Malawi (RBM).
Through the Microfinance Act (MFA) of 2010 and the Financial Cooperatives Act (FCA) of 2011
Microfinance Institutions (MFIs) and Savings and Credit Cooperatives (SACCOs) are now
governed by the two Acts bringing the MFIs and SACCOs under the supervision of the RBM.
Through the Trustees Incorporation Act, the RBM regulates services and operations of the
informal finance providers such as NGOs and some government-sponsored projects. This is a
14 Since attainment of independence in Malawi in the year 1964 and prior to the introduction of the SAPs, the estate
sub-sector was the major economic sub-sector within the agricultural sector as it produced the major export crops of
Tobacco, tea and sugar while the smallholder sub-sector mainly focused on food crops. Smallholder farmers grew
tobacco as tenants on the tobacco estates. The bias towards estate agriculture resulted in increased number of estates
predominantly owned by top government officials including cabinet ministers.
31
positive development for the informal sector since most of the informal groups prevalent in rural
areas are initiated and supported by various NGOs. In addition to the MFA and the FCA, enactment
of the Securities Act in 2010 gives room for the establishment and operation of collective
investment schemes which also allows for the formation of unit trusts and other collective
mechanisms for investment.
The MFIs in Malawi operate under an umbrella body known as Malawi Microfinance Network
(MAMN) which was established in 2000. MAMN aims at developing, promoting and regulating
microfinance activities to ensure good governance. MAMN further aims at facilitating the
exchange of experiences, ideas and innovations, in order to strengthen microfinance operations
and build capacity within the sector. Through its operations MAMN has developed partnerships
and strategic alliances with key organizations in the microfinance industry including the African
Microfinance Network (AFMIN), Hivos15, the United States Agency for International
Development (USAID), UNDP, UNCDF, and Southern Africa Microfinance & Enterprise
Capacity Enhancement Facility (SAMCAF) and AFMIN. Through such partnerships, MAMN is
able to implement activities including information dissemination, capacity building, performance
monitoring, advocacy and lobbying and resource mobilization.
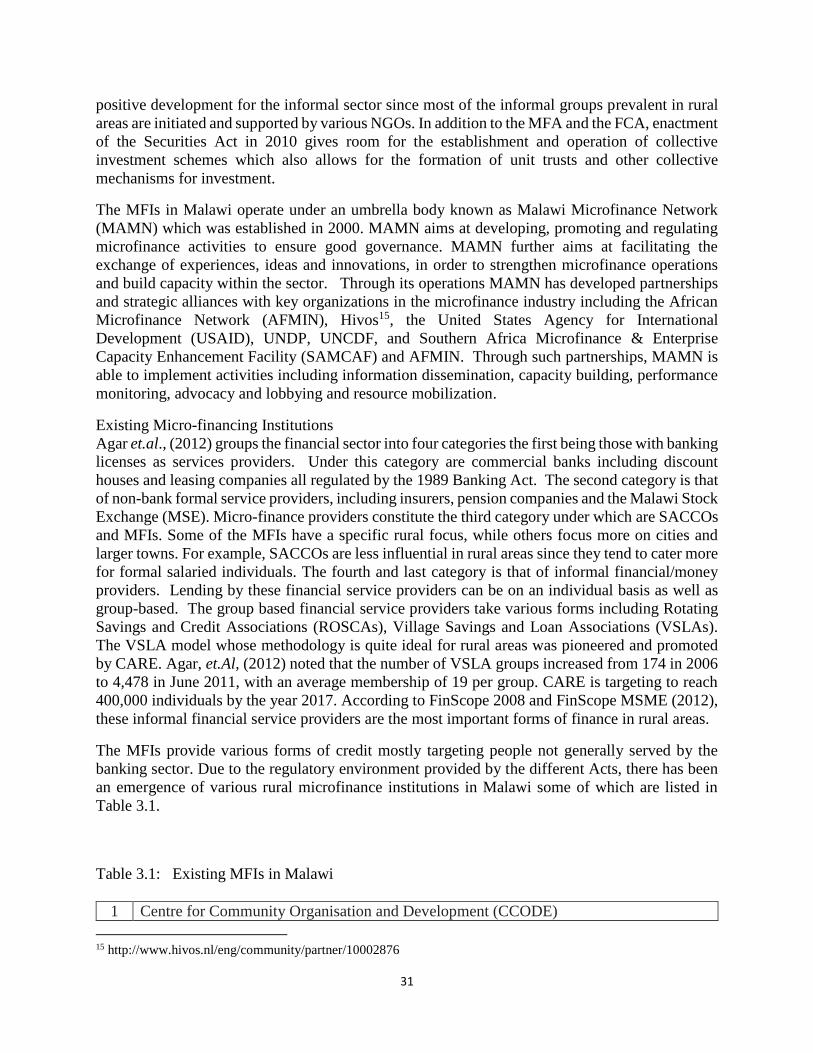
Existing Micro-financing Institutions
Agar et.al., (2012) groups the financial sector into four categories the first being those with banking
licenses as services providers. Under this category are commercial banks including discount
houses and leasing companies all regulated by the 1989 Banking Act. The second category is that
of non-bank formal service providers, including insurers, pension companies and the Malawi Stock
Exchange (MSE). Micro-finance providers constitute the third category under which are SACCOs
and MFIs. Some of the MFIs have a specific rural focus, while others focus more on cities and
larger towns. For example, SACCOs are less influential in rural areas since they tend to cater more
for formal salaried individuals. The fourth and last category is that of informal financial/money
providers. Lending by these financial service providers can be on an individual basis as well as
group-based. The group based financial service providers take various forms including Rotating
Savings and Credit Associations (ROSCAs), Village Savings and Loan Associations (VSLAs).
The VSLA model whose methodology is quite ideal for rural areas was pioneered and promoted
by CARE. Agar, et.Al, (2012) noted that the number of VSLA groups increased from 174 in 2006
to 4,478 in June 2011, with an average membership of 19 per group. CARE is targeting to reach
400,000 individuals by the year 2017. According to FinScope 2008 and FinScope MSME (2012),
these informal financial service providers are the most important forms of finance in rural areas.
The MFIs provide various forms of credit mostly targeting people not generally served by the
banking sector. Due to the regulatory environment provided by the different Acts, there has been
an emergence of various rural microfinance institutions in Malawi some of which are listed in
Table 3.1.
Table 3.1: Existing MFIs in Malawi
1 Centre for Community Organisation and Development (CCODE)
15 http://www.hivos.nl/eng/community/partner/10002876
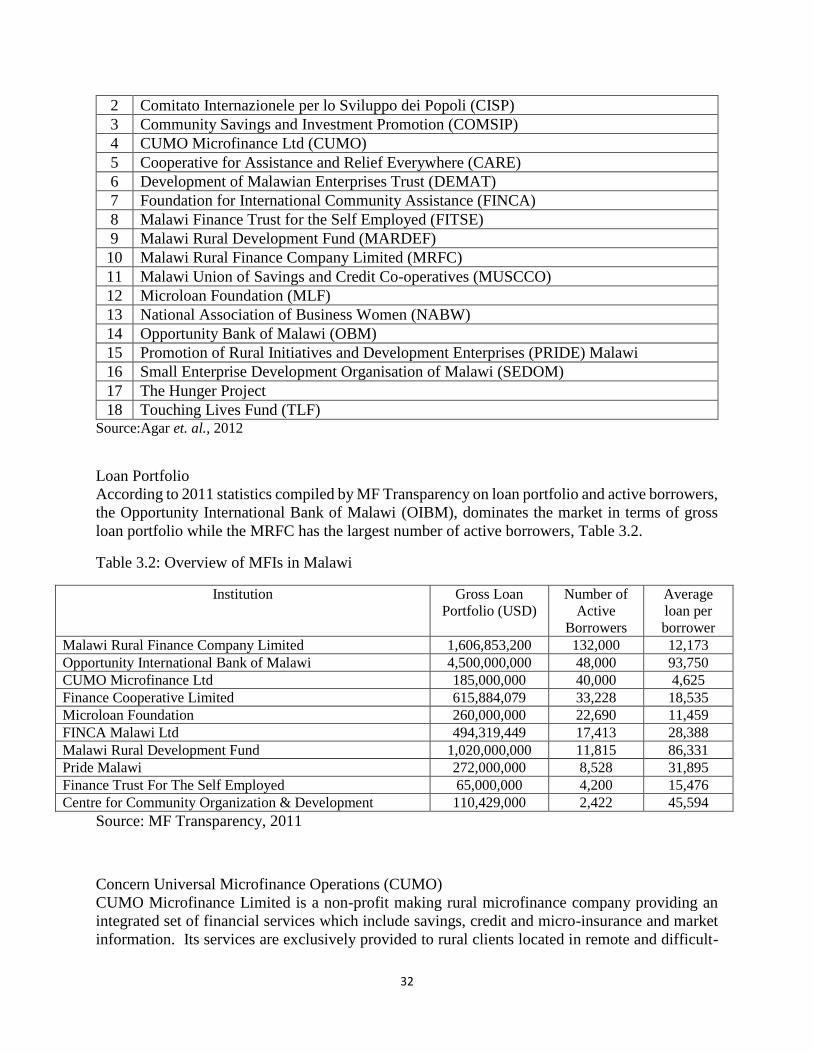
32
2 Comitato Internazionele per lo Sviluppo dei Popoli (CISP)
3 Community Savings and Investment Promotion (COMSIP)
4 CUMO Microfinance Ltd (CUMO)
5 Cooperative for Assistance and Relief Everywhere (CARE)
6 Development of Malawian Enterprises Trust (DEMAT)
7 Foundation for International Community Assistance (FINCA)
8 Malawi Finance Trust for the Self Employed (FITSE)
9 Malawi Rural Development Fund (MARDEF)
10 Malawi Rural Finance Company Limited (MRFC)
11 Malawi Union of Savings and Credit Co-operatives (MUSCCO)
12 Microloan Foundation (MLF)
13 National Association of Business Women (NABW)
14 Opportunity Bank of Malawi (OBM)
15 Promotion of Rural Initiatives and Development Enterprises (PRIDE) Malawi
16 Small Enterprise Development Organisation of Malawi (SEDOM)
17 The Hunger Project
18 Touching Lives Fund (TLF) Source:Agar et. al., 2012
Loan Portfolio
According to 2011 statistics compiled by MF Transparency on loan portfolio and active borrowers,
the Opportunity International Bank of Malawi (OIBM), dominates the market in terms of gross
loan portfolio while the MRFC has the largest number of active borrowers, Table 3.2.
Table 3.2: Overview of MFIs in Malawi
Institution
Gross Loan
Portfolio (USD)
Number of
Active
Borrowers
Average
loan per
borrower
Malawi Rural Finance Company Limited 1,606,853,200 132,000 12,173
Opportunity International Bank of Malawi 4,500,000,000 48,000 93,750
CUMO Microfinance Ltd 185,000,000 40,000 4,625
Finance Cooperative Limited 615,884,079 33,228 18,535
Microloan Foundation 260,000,000 22,690 11,459
FINCA Malawi Ltd 494,319,449 17,413 28,388
Malawi Rural Development Fund 1,020,000,000 11,815 86,331
Pride Malawi 272,000,000 8,528 31,895
Finance Trust For The Self Employed 65,000,000 4,200 15,476
Centre for Community Organization & Development 110,429,000 2,422 45,594
Source: MF Transparency, 2011
Concern Universal Microfinance Operations (CUMO)
CUMO Microfinance Limited is a non-profit making rural microfinance company providing an
integrated set of financial services which include savings, credit and micro-insurance and market
information. Its services are exclusively provided to rural clients located in remote and difficult-

33
to-reach areas. CUMO was established in 2000 as a project of Concern Universal (CU) and was
incorporated as a standalone company in May 2007 following a decision by Concern Universal, a
UK-based charity organization to separate its microfinance operations from the rest of its charity
projects in Malawi, Planet Rating (2008). Currently CUMO operates in the central and southern
regions of Malawi and covers a total of 14 districts16 in these two regions with its headquarters
based in Dedza district17.
CUMO’s Clients
CUMO targets poor people, primarily women18. It does so through its Masika loans, which are
designed to attract only the poor. The low loan size is sufficient only for very tiny businesses,
which are typical of those run by small entrepreneurs in rural areas. Self selection takes place
during the group formation process. CUMO specifically mentions that rich or salaried persons
should not be included in groups, so also prominent members of the community. Others excluded
are defaulters on loans to other MFIs, and the very sick or very old. However, CUMO does not
apply a formal screening criterion (such as poverty profiling or cash flow analysis) to all clients,
Micro-Credit Ratings (2009).
CUMO’s Products
CUMO’s loan products are specifically intended for use in productive enterprises. CUMO’s loan
products are categorized into four groups namely; Masika; Fumba; Kasupe, and Mtenthandevu.
Services offered by CUMO include agriculture loans, small enterprise loans, micro-insurance,
enterprise training and market linkage services, Planet Rating (2008). CUMO uses the group model
for financial intermediation, to encourage collective decision-making, as well as to facilitate joint
liability and preliminary risk assessment. Potential clients are encouraged to form solidarity
groups of 10-20 members, which save and lend internally. After establishing a history of internal
lending, the group can approach CUMO for its first external loan. Group meetings take place
fortnightly using existing physical infrastructure (e.g. churches and schools) in the villages, and
are attended by the CUMO’s Financial Service Officers. The meeting is a forum for collection of
savings, internal lending and repayment of loans. CUMO’s procedures ensure that group members
collectively pass each other’s loan applications, impose fines on members making late payments,
and take turns for depositing collections. The group’s secretary is responsible for cash counting,
book-keeping, and recording minutes. Training in CUMO’s policies is provided to the group
members over six weeks by CUMO staff. CUMO also facilitates the opening of a group savings
bank account.
Masika loans: The Masika loan offers clients lower interest rates on subsequent loan cycles: 6%
p.m. till second cycle, 5% from third to fifth cycle, and 4.5% p.m. till the tenth cycle. Groups with
members average loans of MWK 7,500 can shift to monthly repayments from their second cycle,
while those taking an average of MWK 17,500 can extend their loan term to six months. Clients
are incentivised to borrow higher amounts, while staying with CUMO’s programme for several
cycles. Loan size starts at MWK 3,000 ($20) up to a maximum of MWK 5,000 for a first loan.
16 Dedza, Dowa, Lilongwe, Ntcheu, Salima in the Central Region and Balaka, Chiradzulu, Machinga, Mangochi,
Mulanje, Neno, Phalombe, Thyolo,Zomba in the Southern region
17 Interview with CUMO Regional Manager 18 The organisations emphasizes on the ratio of 4: 1 (i.e Female: Male ratio) within each of groups.

34
Fumba loans: The Fumba is an agricultural loan product meant to be disbursed at the onset of the
rainy season to enable the clients to cultivate crops such as maize, tobacco, or other crops and
repay at the end of the season. Fumba loans can only be accessed by clients who have successfully
completed one cycle of Masika. Clients can access a Fumba loan while they have an outstanding
amount on their Masika loan. Although the Fumba loan is designed to have a balloon repayment,
the staff encourage clients to pay some amount on a monthly basis, to reduce the risk in case there
is a crop failure. The Fumba loan when first introduced used to be in kind, generally in the form
of an agricultural input such as seed or fertilizer. However, CUMO had a bad experience when the
government introduced a fertilizer subsidy, while CUMO had huge stocks of fertilizer bought at
original prices in its warehouse, Micro-Credit Ratings (2009).
Kasupe loans: This is a solidarity-group based loan product for graduated clients of Masika loans.
For this product, groups of 5-7 are formed, with clients co-guaranteeing each other. This product
is open to graduating clients of Masika who have completed ten cycles of Masika loans. New
clients can only access up to MWK 30,000 in their first Kasupe cycle. CUMO also targets new
clients in peri-urban areas with the Kasupe loans. The maximum loan that can be extended under
Kasupe is MWK 200,000 (in the sixth cycle). Repayments are monthly and there is no grace period
in this product. CUMO intends to increase the portfolio under Kasupe to at least 20% of its entire
portfolio so as to cross subsidise its other products.
Mtenthandevu loans: Mtenthandevu is a small-holder tea growers’ loan, extended in solidarity
groups of 5-7, ranging from MWK 10,000- 50,000, with monthly repayments over 4-6 months.
This loan product is specifically extended to tea-growers with small farm holdings.
Non-financial Products
Non-financial products offered by CUMO include business training, HIV and AIDS interventions
for staff, and market information on agricultural prices. Business training programs provide
entrepreneurship training to its clients and the training sessions are provided through mobile
services. Through this program, relevant, doorstep business training sessions are delivered in the
local language. Trainings are intended to be held in clusters of 3 groups, for 2 hours per session.
The training sessions are also meant to increase clients’ access to formal and more profitable
markets, train clients to think about more profitable and environmentally friendly businesses,
gradually influence/shift their focus away from charcoal burning and reduce the number of
CUMO’s clients currently engaged in charcoal burning. Furthermore, the training sessions provide
HIV and AIDS sensitization/counseling to the CUMO clients with the aim of gradually reducing
clients’ mortality rate.
CUMO has also partnered with NICO LIFE, a leading insurance provider in Malawi, to provide
funeral benefit insurance to its clients. Each client contributes 2% of their loan amount (collected
for every loan cycle) and in the event of death, the outstanding loan amount is covered. In addition
the client’s family receives MWK 5,000 to cover the funeral costs. CUMO plans to introduce
hospitalisation insurance, based on client feedback. CUMO earns a small commission on a profit-
sharing basis with NICO LIFE.
Linkage: CUMO is in partnership with the Malawi Agricultural Commodity Exchange (MACE)
for dissemination of price-related information to its clients since a large proportion of them are
small farmers. This initiative is called Agriculture Marketing Information Services aiming at
shortening the supply chain and linking CUMO clients with higher and more profitable market.
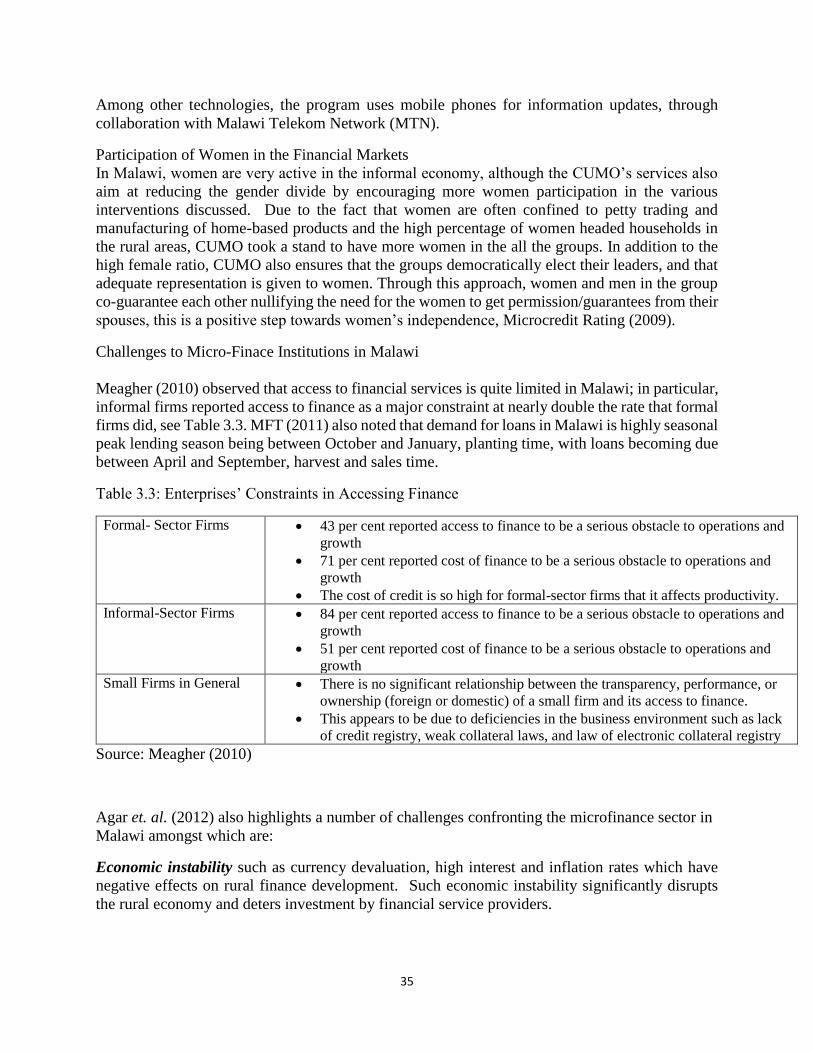
35
Among other technologies, the program uses mobile phones for information updates, through
collaboration with Malawi Telekom Network (MTN).
Participation of Women in the Financial Markets
In Malawi, women are very active in the informal economy, although the CUMO’s services also
aim at reducing the gender divide by encouraging more women participation in the various
interventions discussed. Due to the fact that women are often confined to petty trading and
manufacturing of home-based products and the high percentage of women headed households in
the rural areas, CUMO took a stand to have more women in the all the groups. In addition to the
high female ratio, CUMO also ensures that the groups democratically elect their leaders, and that
adequate representation is given to women. Through this approach, women and men in the group
co-guarantee each other nullifying the need for the women to get permission/guarantees from their
spouses, this is a positive step towards women’s independence, Microcredit Rating (2009).
Challenges to Micro-Finace Institutions in Malawi
Meagher (2010) observed that access to financial services is quite limited in Malawi; in particular,
informal firms reported access to finance as a major constraint at nearly double the rate that formal
firms did, see Table 3.3. MFT (2011) also noted that demand for loans in Malawi is highly seasonal
peak lending season being between October and January, planting time, with loans becoming due
between April and September, harvest and sales time.
Table 3.3: Enterprises’ Constraints in Accessing Finance
Formal- Sector Firms 43 per cent reported access to finance to be a serious obstacle to operations and
growth
71 per cent reported cost of finance to be a serious obstacle to operations and
growth
The cost of credit is so high for formal-sector firms that it affects productivity.
Informal-Sector Firms 84 per cent reported access to finance to be a serious obstacle to operations and
growth
51 per cent reported cost of finance to be a serious obstacle to operations and
growth
Small Firms in General There is no significant relationship between the transparency, performance, or
ownership (foreign or domestic) of a small firm and its access to finance.
This appears to be due to deficiencies in the business environment such as lack
of credit registry, weak collateral laws, and law of electronic collateral registry
Source: Meagher (2010)
Agar et. al. (2012) also highlights a number of challenges confronting the microfinance sector in
Malawi amongst which are:
Economic instability such as currency devaluation, high interest and inflation rates which have
negative effects on rural finance development. Such economic instability significantly disrupts
the rural economy and deters investment by financial service providers.
36
Price and production Volatility: : Since most of the MFI target agricultural enterprises and the
fact that rural incomes are heavily dependent on agriculture, volatility in agricultural production
and prices significantly affect operations of the MFIs. Occurrence of systematic risks such as
drought, floods pest infestations, etc. often contribute to low production which influences
widespread defaults on loans thereby resulting in major credit portfolio losses by the MFIs. Such
production risks are worsened by volatility in agricultural produce prices and unpredictable
international price volatility for export commodities such groundnuts and soya beans. Such
volatilities create problems for producing households and the MFIs which provide financial
services to the farming households.
Underdeveloped rural infrastructure makes it difficult to access some of the remote areas. This
is particularly hard during the rainy season resulting in access to such areas to be more costly and
time consuming. In addition to poor road infrastructure, inefficient energy infrastructure is a
serious disabling factor for operations of the MFIs especially in rural areas.
Absence of national identity cards makes it extremely difficult to track down individuals who
either default on loans or deliberately change their names to secure fresh loans. Though voter
registration cards have been used in some cases, it is still a challenge to follow up on individual
defaulters.
Weak property rights is another challenge negatively impacting upon operations of MFIs in both
rural and urban areas. Within the smallholder sub-sector, land ownership is predominantly
customary and based on traditional rules of allocation and inheritance. Lack of formal/official land
titles implies that land cannot be used as collateral for the different categories of loans. This
reduces the incentive to invest in land as the property is regarded not secure.
Involvement of government as a financial service provider tends to disrupt operations of the private
oriented MFIs since most of the government interventions are subsidized rendering the private
MFIs uncompetitive. For example, the government of Malawi has a number of credit programs
such as the MARDEF, the Farm Inputs Loan Program (FILP) introduced in the 2013/14 as a
parallel program to the FISP within the MoAFS. The FILP target the rural masses who are also the
clientele for the private MFIs. Such government programs have posed stiff competition to the
MFIs because of easy credit terms and weak repayment discipline on the part of the government
programs. The poor repayment culture in government programs may spill over into other MFIs
clientele thereby weakening operations of the MFIs.
References
Agar, J. Donaldson, T.L, Mwabumba, M ,Mwabutwa, C. and Vuyo Mahlati, V. 2012. Status of
Agricultural and Rural Finance in Malawi, FinMark Trust.
Burritt, K. 2005. Expanding Access to Financial Services in Malawi,UNCDF, New York, NY
10017:web: http://www.uncdf.org;e-mail: [email protected].
Meagher, P., 2010. Constant Gardening: A Study of Malawi’s Enabling Environment for
Microfinance; IRIS Center, University of Maryland

37
Micro Finance Transparency, 2011. Country Survey- Malawi: mftransparency.org
Micro-Credit Ratings International Private Limited, 2009. Social Performance Assessment and
Institutional: Case Study of CUMO, Malawi E-mail: [email protected] Website: www.m-
cril.com
Mkandawire, T., 1999. ‘Agriculture, Employment and Poverty in Malawi’. International Labour
Organization: ILO/SAMAT Policy Paper No. 9.
Planet Rating, 2008. CUMO Microfianance Limited, Malawi; The Global Microfinancne Rating
Agency.
UNCDF/GoM, 2007. ‘Building an Inclusive Financial Sector in Malawi’

38
SECTION 4: ACCESS TO AGRICULTURAL MARKETS
Introduction
The agricultural input and output marketing system in Malawi is fully liberalized following the
Structural Adjustment Program implemented in the late 80s and early 90s. Prior to liberalization,
agricultural marketing system, particularly for the smallholder sub-sector was regulated by the
state through state institutions ADMARC19 and the Smallholder Farmers Fertilizer Revolving
Fund of Malawi (SFFRFM). Liberalisation of the marketing system was meant to remove state
control and allow active participation of the private sector for increased efficiency in the marketing
system and also to enhance smallholder farmer’s access to both input and output markets.
Despite the liberalization, a number of studies (Minot, N., 2010; Kherallah et. al, 2001; Green,
2000; UNDP/UNCTAD, 1999; Devereux, S., 1997; Kherallah and Govindan,K,1997) indicate that
access to markets by smallholder farmers remains a challenge due to a number of reasons including
poor macroeconomic performance of the economy which hampers private sector involvement in
the markets; poor sequencing of agricultural policy reforms; price interventions by the state;
inefficient production systems among smallholder farmers, etc.
Studies on market access (AGRA ,2012; Bouchitté and Dardel 2012; Livingston,G. 2010;
Schonberger and Delaney 2011; Lemessa,G., 2010;Svensson and Drott 2010; Rios et.al 2008; Butt
and Bandara 2008; Chamberlin et.al 2007; Hammouda et.al 2006; Kamara 2004) have shown that
improvement in market access increases agricultural productivity, firstly by facilitating
specialisation and exchange transactions in rural areas, and secondly through intensification of
input use. This implies that improved market access increases agricultural productivity resulting
in increased farm income, which facilitates the purchase of more farm inputs to intensify
production and improve farmers’ welfare.
Government Policy and Strategies
Having recognized the importance of improved market access on smallholders’ welfare and
economic development of the country, the Malawi government, has put in place strategies and
initiatives to enhance farmers access to markets. Such strategies and initiatives are spelt out in
documents such as the Malawi Growth and Development Strategy II 2011-2016 (MGDS II) and
the Agriculture Sector Wide Approach (ASWAp) 2011. The MGDS II recognizes that lack of
markets and market information, inadequate access to agricultural credit, inefficient input and
output market are among the critical constraints in the agricultural sector. Sustainable economic
growth is one of the thematic areas in the MGDS II and there are 8 sub-themes under the
sustainable economic growth of which agriculture is priority number one.
Within the context of the MGDS II, key strategies towards promoting access to markets for
smallholder farmers include; Strengthening linkages of farmers to input and output markets;
promoting contract farming arrangements; promoting irrigation farming; improving agricultural
production and diversification; promoting agricultural production for exports; and strengthening
and scaling up market-based risk management initiatives.
19 ADMARC was responsible for produce buying and selling within the smallholder sector. It also dealt in fertilizer
and seeds. While the SFFRFM was wholly responsible for fertilizer imports and sales. Some of SFFRFM’s
fertilizer was also sold through ADMARC.

39
The ASWAp is a priority investment program in the agricultural sector aimed at increasing
agricultural productivity to make Malawi a hunger free nation; enable people access nutritious
foods and increase the contribution of agro-processing to economic growth. The ASWAp targets
three focus areas, two key support services and two cross-cutting issues. The focus areas are i)
food Security and risk management; ii) commercial agriculture, agro-processing and market
development; and iii) sustainable agricultural land and water management. Technology generation
and dissemination; and institutional strengthening and capacity building constitute the two key
support services while HIV prevention and AIDS impact mitigation; and gender equity and
empowerment fall under cross-cutting issues. Overall, the ASWAp emphasizes promotion of
agro-processing for value addition and import substitution; developing the domestic market for
import substitution; and expanding the export market to increase foreign currency earning potential
of the country.
In addition to the MGDS II and the ASWAp is the five year (2013-2018) National Export Strategy
(NES) developed by the Ministry of Industry and Trade. The NES is aimed at providing a clearly
prioritized roadmap for building Malawi’s productive base to generate sufficient exports to match
the ever-increasing demand for imports. Four priority areas – of the NES are; export clusters;
conducive environment; supportive economic institutions to build the productive base of the
economy, and; competencies, skills and knowledge. The NES includes market access as one of
the ‘enablers’ necessary to develop the export-oriented clusters/niche. The NES highlights the need
for improving the coordination efforts to connect smallholder farmers to processors and to markets.
It also promotes access to affordable finance to smallholder farmers, including women in order to
improve access to technology.
Other strategies that the Malawi government has put in place to promote smallholder farmers’
access to markets are:
Contract Farming Strategy: The government, through the Ministry of Agriculture and Food
Security is in the process of finalising the contract farming strategy. Once finalised and
implemented, it is expected that the contract farming strategy will enhance farmers’ access to
inputs as well as an assured market for the different commodities to be grown under contractual
agreements. It is also expected that through the contract arrangements, farmers will be in a position
to bargain for better prices while also conforming on the agreed upon grades and standards for
presentation of the commodities. Default on the loans is also expected to be minimised through
the legal framework within which the contract strategy will be framed, thus the contract farming
strategy is expected to have mutual benefits and security checks for both the farmer/s and the
contracting agent.
Farmer Organisations: For the government to effectively implement its various strategies and
initiatives towards enhanced farmers’ access to agricultural markets, the government promotes the
formation of farmer groups at various stages. The basic farmer group is the farmers club, which,
with appropriate empowerment including gender balance, stands a chance to graduate into an
association and a cooperative. To facilitate the progression of farmer organisations, the
government of Malawi through the Ministry of Industry and Trade, has the Cooperative
Development Policy (CDP) in place. The CDP aims at enabling cooperatives to become efficient
business institutions for mobilising human, financial and material resources.

40
Market Information System: Through the agro-economic survey of the Ministry of Agriculture
and Food Security, the government collects various market related information which include
production and price levels for different commodities and in different geographic locations across
the country. The information from the various geographic locations is consolidated at the
headquarters of the Agro-economic survey and is available for public consumption. The
consolidated information is also supposed to be disseminated through the Agricultural
Development Division (ADD) structure, which goes down to the village level through sections
manned by the Agricultural Extension Development Officer (AEDO).
In addition to the government initiative in promoting market access, the private sector also makes
efforts to enhance market access to farmers. The various agricultural commodity exchange
platforms are prime examples of this.
Currently there are two major commodity exchange facilities dealing in agricultural commodities
and these are the Agricultural Commodity Exchange (ACE) established in 2005 and the Auction
Holdings Limited Commodity Exchange (AHLCX) established in 2012. The two commodity
exchange facilities have some common strategies in terms of facilitating farmers’ access to markets
even though they may differ in the details of operations.
The basic concept of the commodity exchange is to provide a platform where farmers/suppliers of
different commodities interact and make transactions to the mutual benefit of both parties. Various
modes of interaction or access to information are used, including the use of mobile phones, use of
print media and the warehousing system. For the mobile and print media, commodity suppliers
and prospective buyers exchange information on the commodities available, the quantities, quality,
geographic location, price and mode of transaction.
Through the warehouse receipt system, the farmer/commodity supplier deposits the commodity in
the warehouse until such a time that the supplier feels it is profitable to sell. Meanwhile the
commodity supplier opts to receive a warehouse receipt. Several advantages are associated with
the warehouse receipt system for both the commodity suppliers and buyers. On the part of the
farmer/commodity suppliers, they are able to obtain immediate finance from a bank using the
warehouse receipt and there are no defaults in terms of payment which comes through the bank
almost immediately after a transaction is made. The system also allows the supplier to obtain
better prices, access bridging finance, minimise post-harvest losses. For the buyers, they are able
to get the quantities they want in good quality and also minuses chances of default
Constraints to Smallholder Farmers’ Access to Markets
There are a number of factors with the agriculture sector that impede upon farmers access to
markets. These constraints include:
Low volumes and seasonality in production by smallholder farmers: Volumes produced by
smallholder farmers are usually too small to attract meaningful demand. The low production is
associated with other challenges such as over reliance on rain-fed agriculture which confines
farmers to seasonal production resulting in fluctuations in supply making it impossible for farmers
to sustain supply as demanded by most buyers. Other challenges include; small landholding sizes;
and limited access to financial markets or agricultural loans.
41
Noncompliance to Grades and standards: Farmers often do not comply with grades and
standards as required by the markets. The non-compliance to grades and standards results in low
prices offered to farmers. Poor grades and standards also make it difficult for the famers to
penetrate regional and global markets.
Poor transport and storage infrastructure: Poor road condition and network makes it difficult
for farmers to transport their produce from the farm to the market. The poor road condition and
network also makes it expensive for the farmer to pay transporters thereby confining the farmers
to markets within the production zones and limiting access to other markets that would otherwise
pay higher prices. Poor storage infrastructure contributes to quality deterioration and increased
post-harvest losses. The poor quality produce and low volumes due to post harvest losses also
inhibits farmers’ access to better markets.
Poor market information system: The smallholder farmers are operating in an environment
where availability and flow of market information is very poor and greatly contributes to poor
access to markets by the farmers. Access to market information is quite critical for planning
purposes on the part of both farmers and buyers. Farmers would want to know what commodities
are on demand, where and when the commodities are demanded, quantities demanded, grades and
standards required, prices offered, terms of delivery and payment. Such type of information is
necessary for the farmers to make decisions on whether to produce and supply the commodities as
demanded. Unfortunately, this type of information is scanty and difficult for the farmers to access
and make use of.
Low literacy level and poor business skills: Low level of literacy among farmers is one of the
factors contributing to farmers’ limited access to markets. Due to the low level of literacy, most
smallholder farmers are not able to understand the dynamics of agricultural marketing hence their
limited access to better markets. Coupled with low literacy levels is limited and in most cases lack
of business skills to undertake basic business practices such as recording keeping and gross margin
analysis which would help them to set appropriate prices for their commodities. As a result, most
smallholder farmers are price takers with the buyers dictating the price.
Scattered and unorganised production and marketing arrangements: With scattered and
small landholding sizes, production among smallholder farmers tend to be unorganised and hence
contributing to unorganised marketing arrangements resulting in poor access to markets. Some of
the existing farmer organisations do not have strong bargaining power because of weak structures
within the organisations but also worsened by low literacy levels.
Poor access to extension services:
The public extension services on agriculture have been blamed for a number of reasons including
fewer number of extension agents compared to the number of farmers in need of extension
services. The LUANAR and CISANET 2013 report observes that for effective and efficient
extension service delivery, recommended extension worker/farmer ratio should range from 1:750
to 1:850. However, due to various attrition factors such as normal retirement, resignation in search
for green pastures and deaths which increased due to HIV and AIDS, the extension staff/farmer
ratios have dwindled to levels ranging from 1:1500 to as low as 1:3900. LUANAR and CISANET
note that the few remaining extension workers are overburdened with multiple tasks from both
government and non-governmental organisations including activities that are not directly related
42
to extension delivery such as the safety net programmes. Furthermore, distances to cover by
bicycle to reach out to farmers are too vast hence few and ineffective visits to farming
communities. In addition to fewer numbers, the public extension service is blamed for not
covering market related topics to detail.
Unregulated contract farming:
Contract farming system if well regulated can enhance farmers’ access to markets and also
minimise negative effects of price volatility. However, some of the contracts that smallholder
farmers have been subjected to seem not to have mutual benefits to both parties with the
smallholder farmers often falling victims by being offered lower prices and sometimes the buying
partner absconding on the whole contract.
On the other hand, buying partners in the contract have expressed concerns against the behaviour
of the smallholder farmers who sometimes do not deliver the quantities as agreed because of side
selling which is influenced by better prices outside the contract but also farmers need for an early
cash income. Complaints have also been levelled against the smallholder farmers in failing to
comply on agreed upon grades, standards and volumes.
Policy incoherence
Stakeholders note that there is some policy incoherence within and across related sectors.
Particular examples are drawn from the Ministry of Agriculture and the Ministry of Industry and
Trade on export licenses for agricultural exports. Issuing of export license is a responsibility of
both the Ministry of Agriculture and Ministry of Industry and Trade (MoIT). The MoAFS first
scrutinizes every application for export license on a case-by-case basis. After scrutiny by the
MoAFS, the MoIT issues the export license upon approval by the Minister of Industry and Trade.
Stakeholders noted that there is an element of lack of transparency in the process with possible
delays as the documents change hands between the two ministries. Stakeholders feel that if indeed
it is necessary for the export license to be processed between the two ministries, then government
should consider having a desk officer from the Ministry of Industry in the Ministry of Agriculture
to look into all agricultural trade related issues or vice versa.
Another policy issue that impedes access to markets is ad hoc bans by government on exports of
some commodities without consulting the private sector. Often the government imposes such bans
upon some looming shortages of the commodity in the country. It has however occurred in some
instances that the government’s projections or estimates of production upon which the bans are
based do not reflect reality due to under or over estimations thereby causing disequilibrium in
demand and supply and hence distorting the markets. Because of such distortions, the private
sector greatly feels that there is need for thorough consultations between the government and the
private sector before any ban on exports or imports is imposed. It is also noted that even in cases
where justifiable bans or regulations are imposed, the government lacks an effective and efficient
enforcement mechanism due to limited human and financial resources thereby rendering the bans
ineffective.
Furthermore, there are suggestions that the methodology on national agricultural production
estimates should be reviewed and improved to provide realistic estimates. Advocates for such a

43
review propose the use of satellite images for the production estimates as well as the use of
Geographic Positioning System (GPS) in assessing hectarage of farmers’ fields/gardens.
Gender imbalance in decision making
Several studies on Malawian agriculture have shown that women contribute significantly to
agricultural labour but that they are often sidelined when it comes to decisions on what to produce
and sell, how much to sale, and how to use the proceeds from the sales. This implies that despite
their great involvement in production women tend to have limited access to agricultural markets
and less influence in decision making.
There are also a number of constraints that affect women farmers’ access to both input and output
markets. On the input side, women are constrained to buy farm inputs such as fertilizer and
improved seeds due to lack of financial resources. Even within the FISP, women farmers find it
more difficult to access the subsidy inputs from the outlets points such as ADMARC. One of the
challenges on the FISP inputs for the women is that the women are subjected to long queues to the
extent that some take more 2 days before they can buy their fertilizers. In some cases incidents
have been reported where officials manning the inputs at the outlet points demand sexual favours
from women if they are to buy the fertilizer quickly.
On marketing agricultural produce, women become victims of intermediate traders (vendors), who
use unreliable weighing scales. Cases have been reported in some instances whereby buyers tend
to have two different weighing scales, one that is accurate and the other one that is deliberately
tampered with to cheat the seller. For such traders, when a woman farmer comes alone to sell her
produce, the trader uses the dubious scale taking advantage that often the women do not confront
the buyers and the opposite is true for male farmers.
Discussions with some farmers also revealed that women farmers tend to have less bargaining
power and vendors usually take advantage of the women by offering low prices. It was also noted
that women end up selling to vendors who come to their doorsteps because the women have
difficulties in transporting their produce to better markets. In many cases, better prices are offered
at district centres, which are often far away and women do not have the time or resources to
transport their produce to the district centres. In some cases, incidents of transporters demanding
sex from women to have their produce transported to the market are also common. Such type of
gender disparities in the conduct of trade affect women farmers’ access to markets.

44
References
AGRA, 2012, ‘Market access Program; Monitoring and Evaluation Plan’
Barrett, C.B., (undated). ‘Developing Pro-poor Markets for African Smallholder Farmers;
Challenges to pro-poor market development for African agriculture’:
http://data.worldbank.org/indicator.
Bouchitté, A., and Dardel, S., 2012. ‘Agricultural Markets and Small-Scale Producers: Access And
Risk Management Tools’. European Commission.
Butt, M.S. and Bandara, J.S, 2008. ‘National and Regional Impacts of Increasing Non-Agricultural
Market Access by Developing Countries – the Case of Pakistan’.
Chamberlin, J., Diao, X., Kolavalli, S., and Breisinger, C., 2007. ‘Smallholder Agriculture in
Ghana; Ghana Strategy Support Program-IFPRI’; Discussion Brief 3.
Devereux, S., 1997. ‘Household Food Security in Malawi’. Institute Of Development Studies,
Discussion Paper 362.
FAO, 2010. ‘Gender and Agriculture’, The FAO Representation, Malawi
Government of Malawi, 2011 Malawi Growth and Development Strategy II, 2011-2016,
Government of Malawi, Lilongwe.
Government of Malawi, 2011. ‘Malawi Agricultural Sector Wide Approach; A Prioritised and
Harmonised Agricultural Development Agenda: 20112015’. Ministry of Agriculture and Food
Security
Government of Malawi, 2012. Malawi Economic Recovery Plan, Government of Malawi,
Lilongwe.
Green, E., 2000. ‘Liberalisation of the agricultural markets and its impact on the smallholder
farmers; The case of Malawi’. Department of Economic History, Lund University, Sweden
Hammouda, H.B., Karingi, S., Oulmane, N., Lang, R., and Jallab, M.S., 2006. ‘Can Market Access
Help African Agriculture?’. Economic Commission for Africa
Kamara, A.B., 2004. ‘The Impact of Market Access on Input Use and Agricultural Productivity:
Evidence From Machakos District, Kenya’. Agrekon, Vol 43, No 2 Kherallah, M., and
Govindan, K., 1997. ‘The Sequencing of Agricultural Market Reforms in Malawi.’ IFPRI, MSSD
Discussion Paper NO. 13
Kherallah, M.,Minot, N., Kachule, R., Soule, B.G.,Berry, P., 2001. ‘Impact of Agricultural
Market Reforms on Smallholder Farmers in Benin and Malawi Final Report, Volume 1,
Submitted to GTZ.
Lemessa, G., 2010. ‘Market Access for African Agricultural Exports: Assessment of the AoA And
SPSs Agreements’. Society of International Economic Law.
45
Livingston, G., Schonberger, S., and Delaney, S., 2011. ‘Sub-Saharan Africa: The state of
smallholders in agriculture’. Paper presented at the IFAD Conference on New Directions for
Smallholder Agriculture 24-25 January, 2011
LUANAR and CISANET, 2013, ‘Policy Briefing Note the State Of Agricultural Extension
Services In Malawi ????
Makoka, D., and Kachule, R., 2013. ‘Smallholder Farmers’ Access to Agricultural Markets in
Malawi’. Report submitted to OXFAM Malawi.
Ministry of Industry and Trade, 2013. Malawi National Export Strategy 2013-2018: Volume I
Main Document, Ministry of Industry and Trade, Lilongwe.
Minot, N., 2010. ‘Staple food prices in Malawi’. Prepared for the Comesa policy seminar on
“Variation in staple food prices: Causes, consequence, and policy options”, Maputo,
Mozambique, 25-26 January 2010.
Reiquam, S., (Undated). ‘The Private Sector and Smallholder Agriculture: Best Practices with
Relevance to Mali, Zambia, India and Sri Lanka’.
Rios, A.R., Masters, W.A., Shively, G.E., 2008. ‘Linkages between Market Participation and
Productivity: Results from a Multi-Country Farm Household Sample’. Prepared for presentation
at the American Agricultural Economics Association Annual Meeting, Orlando, Florida, July 27-
29, 2008
Simler, K.R., 1997. ‘The Transition to a Market-Based Agricultural Economy in Malawi: A Multi-
Market Analysis.
Svensson, J., and Drott, D.Y., 2010. ‘Tuning in the Market Signal: The Impact of Market Price
Information on Agricultural Outcomes’.
UNDP/UNCTAD, 1999. ‘Malawi Globalization, Liberalization and Sustainable Human
Development’. Country Assessment Report.

46
SECTION 5: LINKAGES BETWEEN LAND, AGRICULTURAL FINANCE, INPUTS AND
MARKETS
The four aspects considered in this study namely, land, finance, inputs and markets are
complementary with respect to agricultural productivity and production. However, land plays a
central role compared with the other three elements because any agricultural production system
cannot exist in absence of land. Thus, no land implies zero production while absence of the other
factors production can still take place on a piece of land. The issue becomes that of productivity
and level of production - one would say “no miracles without land”. The quantities of other inputs,
seed, fertilizer and finances would be determined by the amount and quality of land that a farmer
has access to. In view of this, policies to do with land acquisition are paramount to promotion of
agricultural production.
Even among the groundnut farmers countrywide and within the study districts of Lilongwe,
Mchinji and Salima, dynamics on land are crucial for the promotion of groundnut production.
Issues of property rights over land have a significant bearing on access to financial loans from
formal lending institutions including microfinance institutions that often attach greater value on
land as collateral for one to access loan. In this context, the direction that the Malawi government
took in coming up with a land policy that confers greater security to customary landholders within
which majority of smallholder farmers fall is a positive development towards facilitating
smallholder farmers’ access to financial loans. In addition to accessing financial loans as a result
of secure tenure on customary land, smallholder farmers are also likely to be encouraged to invest
in the land by way of maintaining its quality because they are assured of their surety of tenure over
the land.
Likewise for the micro-financing institutions, because of secure land tenure, over the different
categories of land, the MFIs are bound to develop different loan products hinging upon land as
collateral. The financial sectors regulatory framework developed by the government also offers
an enabling environment for the MFIs to operate across sectors including agriculture which would
be to the advantage of smallholder groundnut farmers. Thus increased access of smallholder
farmers to financial loans is bound to encourage the use of improved inputs amongst the farmers.
This will contribute towards increased productivity and production of commodities such as
groundnuts. Furthermore increased MFIs operations would also have a multiplier effect on other
subsectors such as increased volumes of input sales on the part of input dealers but also increased
volumes of raw materials on the part of processors.
However, despite the conducing regulatory environment for the MFIs, continued government’s
involvement as a financial service provider is bound to disrupt operations of the private MFIs since
most of the government interventions are subsidized rendering the private MFIs uncompetitive.
Due to much interest and emphasis on national and household food security on the part of the
government, focus of the FISP has been on maize production ignoring other equally important
crops like groundnuts that have the potential to make a greater impact on the social economic
welfare of the smallholder farmers. As groundnut production does not require heavy dosages of
fertilizer, the government may wish to consider including improved groundnut seed and pesticides
in order to promote groundnut production among smallholder farmers countrywide but also in the
study districts. Such an action will enhance economic empowerment of the smallholder farmers

47
through improved incomes realized from the groundnut sales. This might gradually result in some
farmers graduating from the FISP thereby relieving the pressure on the national budget.
With efficient operations in the land, inputs and MFI sub-sectors, improved access to commodity
markets would have a positive impact on aggregate agricultural production. As Kamara, (2004)
noted, the impact of market access on aggregate agricultural productivity can be looked at from
two levels, which are direct and indirect. The direct level comes into effect through market-
induced allocation of land to high value crops and specialized production while an indirect effect
would be through the intensification of input use to raise productivity.
Although it might seem like an egg and chick situation when some of these factors, land, inputs,
microfinance and markets are considered, realizing the effects that access to markets has on the
other elements, it may be a plausible conclusion as Kamara (2004) noted that prioritising the
improvement of market access is an important approach to rural development, as it gives farmers
the opportunity to specialise and optimise their portfolios with respect to available resources and
subsequently exploit economies of scale.
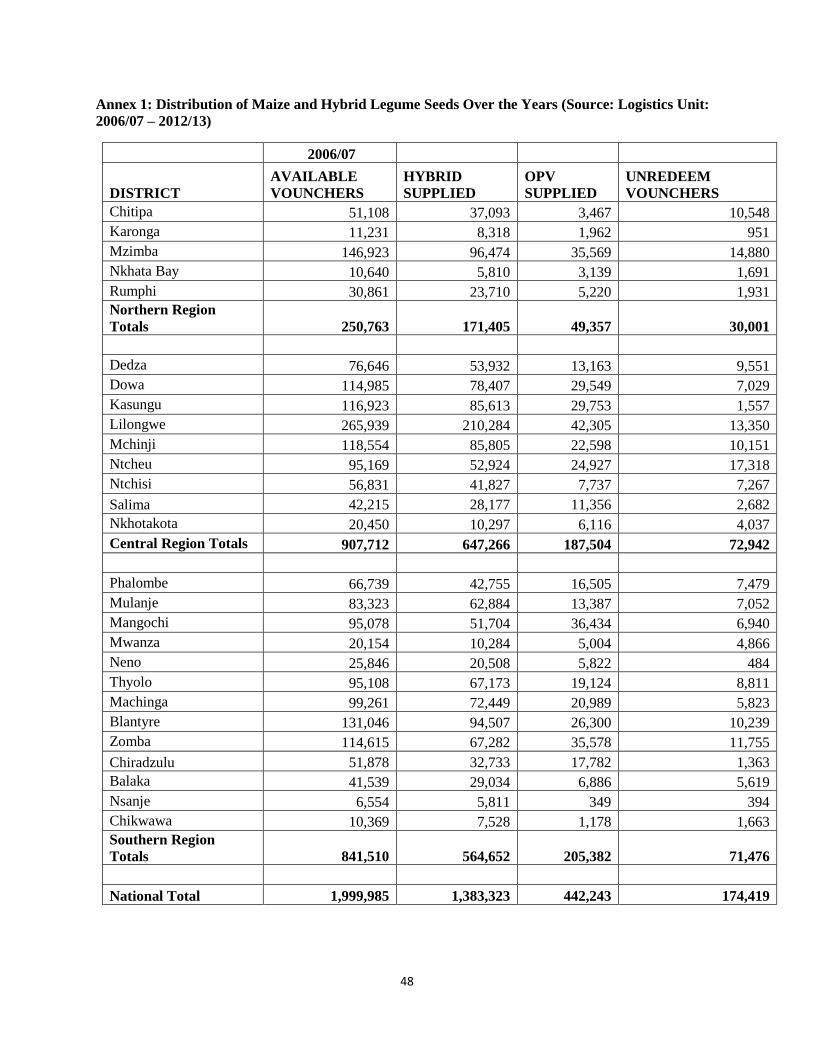
48
Annex 1: Distribution of Maize and Hybrid Legume Seeds Over the Years (Source: Logistics Unit:
2006/07 – 2012/13)
2006/07
DISTRICT
AVAILABLE
VOUNCHERS
HYBRID
SUPPLIED
OPV
SUPPLIED
UNREDEEM
VOUNCHERS
Chitipa 51,108 37,093 3,467 10,548
Karonga 11,231 8,318 1,962 951
Mzimba 146,923 96,474 35,569 14,880
Nkhata Bay 10,640 5,810 3,139 1,691
Rumphi 30,861 23,710 5,220 1,931
Northern Region
Totals 250,763 171,405 49,357 30,001
Dedza 76,646 53,932 13,163 9,551
Dowa 114,985 78,407 29,549 7,029
Kasungu 116,923 85,613 29,753 1,557
Lilongwe 265,939 210,284 42,305 13,350
Mchinji 118,554 85,805 22,598 10,151
Ntcheu 95,169 52,924 24,927 17,318
Ntchisi 56,831 41,827 7,737 7,267
Salima 42,215 28,177 11,356 2,682
Nkhotakota 20,450 10,297 6,116 4,037
Central Region Totals 907,712 647,266 187,504 72,942
Phalombe 66,739 42,755 16,505 7,479
Mulanje 83,323 62,884 13,387 7,052
Mangochi 95,078 51,704 36,434 6,940
Mwanza 20,154 10,284 5,004 4,866
Neno 25,846 20,508 5,822 484
Thyolo 95,108 67,173 19,124 8,811
Machinga 99,261 72,449 20,989 5,823
Blantyre 131,046 94,507 26,300 10,239
Zomba 114,615 67,282 35,578 11,755
Chiradzulu 51,878 32,733 17,782 1,363
Balaka 41,539 29,034 6,886 5,619
Nsanje 6,554 5,811 349 394
Chikwawa 10,369 7,528 1,178 1,663
Southern Region
Totals 841,510 564,652 205,382 71,476
National Total 1,999,985 1,383,323 442,243 174,419
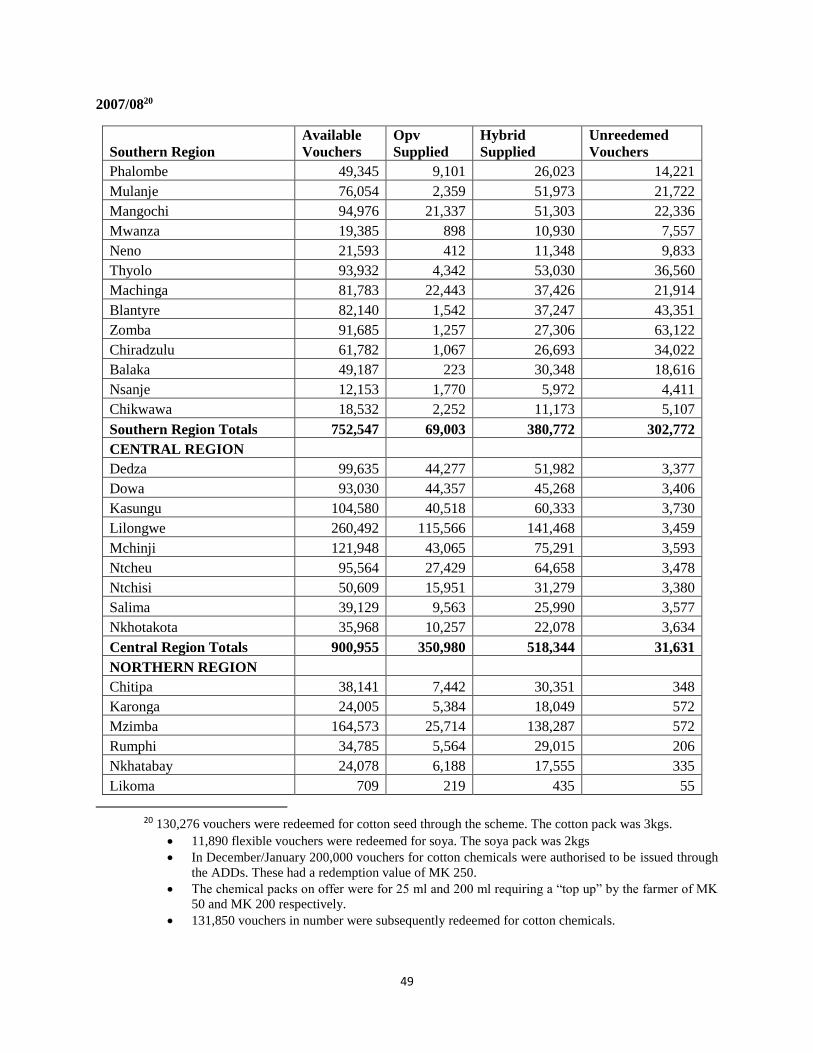
49
2007/0820
Southern Region
Available
Vouchers
Opv
Supplied
Hybrid
Supplied
Unreedemed
Vouchers
Phalombe 49,345 9,101 26,023 14,221
Mulanje 76,054 2,359 51,973 21,722
Mangochi 94,976 21,337 51,303 22,336
Mwanza 19,385 898 10,930 7,557
Neno 21,593 412 11,348 9,833
Thyolo 93,932 4,342 53,030 36,560
Machinga 81,783 22,443 37,426 21,914
Blantyre 82,140 1,542 37,247 43,351
Zomba 91,685 1,257 27,306 63,122
Chiradzulu 61,782 1,067 26,693 34,022
Balaka 49,187 223 30,348 18,616
Nsanje 12,153 1,770 5,972 4,411
Chikwawa 18,532 2,252 11,173 5,107
Southern Region Totals 752,547 69,003 380,772 302,772
CENTRAL REGION
Dedza 99,635 44,277 51,982 3,377
Dowa 93,030 44,357 45,268 3,406
Kasungu 104,580 40,518 60,333 3,730
Lilongwe 260,492 115,566 141,468 3,459
Mchinji 121,948 43,065 75,291 3,593
Ntcheu 95,564 27,429 64,658 3,478
Ntchisi 50,609 15,951 31,279 3,380
Salima 39,129 9,563 25,990 3,577
Nkhotakota 35,968 10,257 22,078 3,634
Central Region Totals 900,955 350,980 518,344 31,631
NORTHERN REGION
Chitipa 38,141 7,442 30,351 348
Karonga 24,005 5,384 18,049 572
Mzimba 164,573 25,714 138,287 572
Rumphi 34,785 5,564 29,015 206
Nkhatabay 24,078 6,188 17,555 335
Likoma 709 219 435 55
20 130,276 vouchers were redeemed for cotton seed through the scheme. The cotton pack was 3kgs.
11,890 flexible vouchers were redeemed for soya. The soya pack was 2kgs
In December/January 200,000 vouchers for cotton chemicals were authorised to be issued through
the ADDs. These had a redemption value of MK 250.
The chemical packs on offer were for 25 ml and 200 ml requiring a “top up” by the farmer of MK
50 and MK 200 respectively.
131,850 vouchers in number were subsequently redeemed for cotton chemicals.
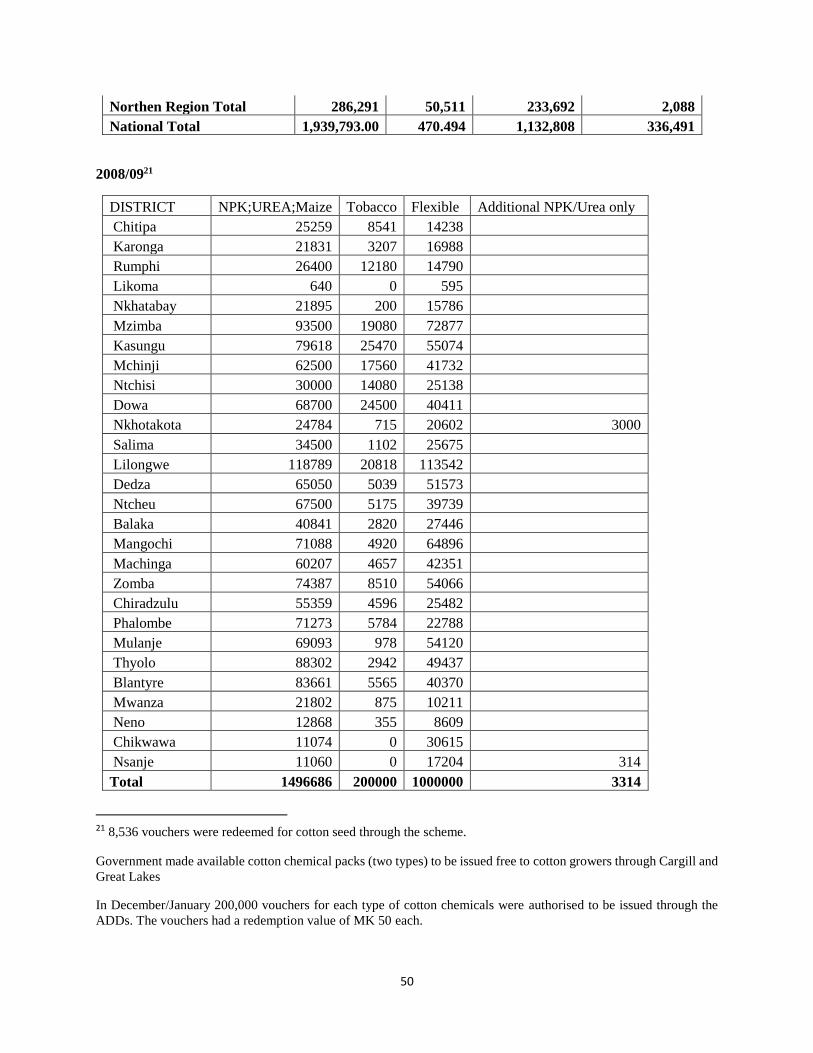
50
Northen Region Total 286,291 50,511 233,692 2,088
National Total 1,939,793.00 470.494 1,132,808 336,491
2008/0921
DISTRICT NPK;UREA;Maize Tobacco Flexible Additional NPK/Urea only
Chitipa 25259 8541 14238
Karonga 21831 3207 16988
Rumphi 26400 12180 14790
Likoma 640 0 595
Nkhatabay 21895 200 15786
Mzimba 93500 19080 72877
Kasungu 79618 25470 55074
Mchinji 62500 17560 41732
Ntchisi 30000 14080 25138
Dowa 68700 24500 40411
Nkhotakota 24784 715 20602 3000
Salima 34500 1102 25675
Lilongwe 118789 20818 113542
Dedza 65050 5039 51573
Ntcheu 67500 5175 39739
Balaka 40841 2820 27446
Mangochi 71088 4920 64896
Machinga 60207 4657 42351
Zomba 74387 8510 54066
Chiradzulu 55359 4596 25482
Phalombe 71273 5784 22788
Mulanje 69093 978 54120
Thyolo 88302 2942 49437
Blantyre 83661 5565 40370
Mwanza 21802 875 10211
Neno 12868 355 8609
Chikwawa 11074 0 30615
Nsanje 11060 0 17204 314
Total 1496686 200000 1000000 3314
21 8,536 vouchers were redeemed for cotton seed through the scheme.
Government made available cotton chemical packs (two types) to be issued free to cotton growers through Cargill and
Great Lakes
In December/January 200,000 vouchers for each type of cotton chemicals were authorised to be issued through the
ADDs. The vouchers had a redemption value of MK 50 each.
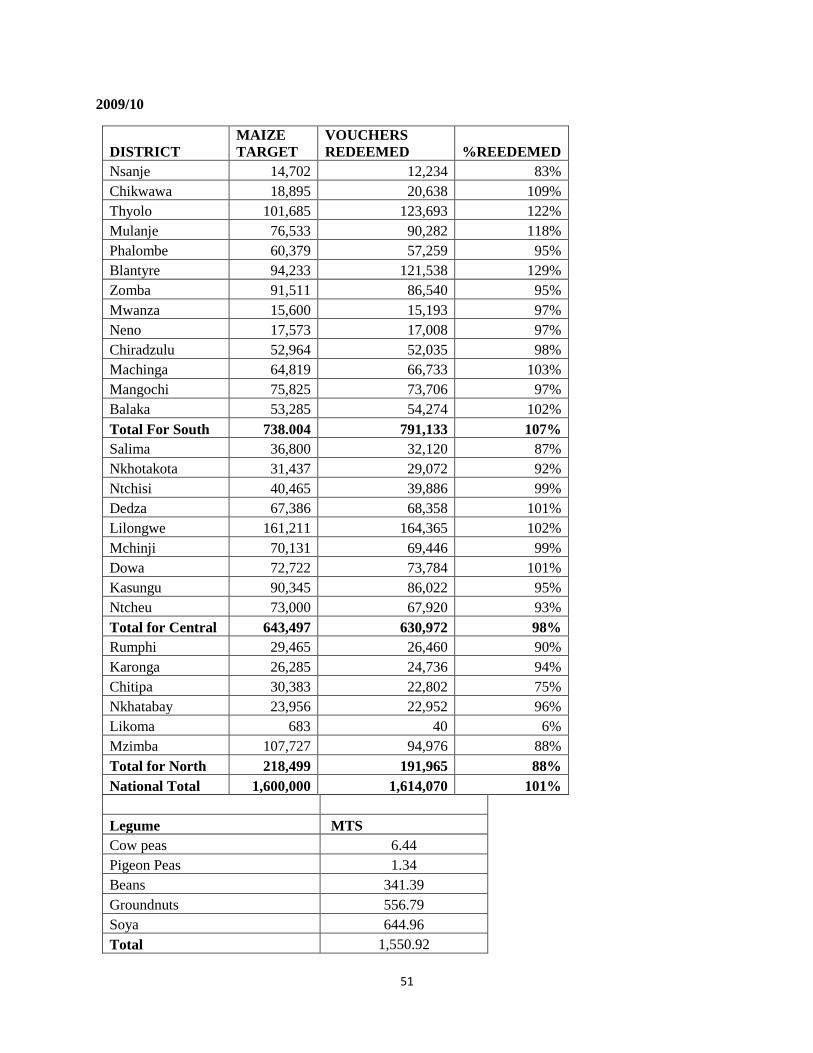
51
2009/10
DISTRICT
MAIZE
TARGET
VOUCHERS
REDEEMED %REEDEMED
Nsanje 14,702 12,234 83%
Chikwawa 18,895 20,638 109%
Thyolo 101,685 123,693 122%
Mulanje 76,533 90,282 118%
Phalombe 60,379 57,259 95%
Blantyre 94,233 121,538 129%
Zomba 91,511 86,540 95%
Mwanza 15,600 15,193 97%
Neno 17,573 17,008 97%
Chiradzulu 52,964 52,035 98%
Machinga 64,819 66,733 103%
Mangochi 75,825 73,706 97%
Balaka 53,285 54,274 102%
Total For South 738.004 791,133 107%
Salima 36,800 32,120 87%
Nkhotakota 31,437 29,072 92%
Ntchisi 40,465 39,886 99%
Dedza 67,386 68,358 101%
Lilongwe 161,211 164,365 102%
Mchinji 70,131 69,446 99%
Dowa 72,722 73,784 101%
Kasungu 90,345 86,022 95%
Ntcheu 73,000 67,920 93%
Total for Central 643,497 630,972 98%
Rumphi 29,465 26,460 90%
Karonga 26,285 24,736 94%
Chitipa 30,383 22,802 75%
Nkhatabay 23,956 22,952 96%
Likoma 683 40 6%
Mzimba 107,727 94,976 88%
Total for North 218,499 191,965 88%
National Total 1,600,000 1,614,070 101%
Legume MTS
Cow peas 6.44
Pigeon Peas 1.34
Beans 341.39
Groundnuts 556.79
Soya 644.96
Total 1,550.92

52
2010/11
DISTRICT
ALLOCATION MAIZE
OVER/UNDER LEGUME
OVER/UNDER
Blantyre 94,403 100,177 (5,774) 73,285 21,118
Chiradzulu 52,549 53,189 (640) 46,174 6,375
Mwanza 15,455 15,874 (419) 13,547 1,908
Neno 17,326 18,275 (949) 12,612 4,714
Mulanje 76,299 79,079 (2,780) 62,854 13,445
Phalombe 60,145 59,885 260 44,953 15,192
Thyolo 101,746 104,546 (2,803) 86,989 14,757
Chikwawa 19,295 17,688 1,607 8,801 10,494
Nsanje 15,202 14,361 841 7,327 7,875
Balaka 53,664 54,230 (566) 48,538 5,126
Machinga 65,119 64,125 994 51,446 13,673
Mangochi 75,729 73,495 2,234 38,760 36,969
Zomba 91,216 92,648 (1,432) 59,137 32,079
South 738,148 747,575 (9,427) 554,424 183,724
Dedza 67,536 103,077 (35,541) 56,165 11,371
Ntcheu 73,120 88,667 (15,547) 65,046 8,074
Lilongwe 160,572 193,819 (33,247) 155,501 5,071
Kasungu 90,325 130,548 (40,223) 102,550 (12,225)
Dowa 72,782 135,316 (62,534) 73,522 (740)
Mchinji 69,816 112,134 (42,318) 64,771 5,045
Ntchisi 41,357 53,532 (12,175) 39,041 2,316
Nkhotakota 31,557 49,809 (18,252) 24,625 6,932
Salima 36,940 46,302 (9,362) 32,519 4,421
Central 664,005 913,205 (269,200) 613,739 30,266
Mzimba 106,800 172,357 (65,557) 97,672 9,128
Rumphi 29,330 49,075 (19,745) 29,094 236
Nkhatabay 24,056 25,105 (1,049) 18,361 5,695
Likoma 1,183 998 185 18 1,165
Chitipa 30,093 43,878 (13,785) 27,218 2,875
Karonga 26,385 35,825 (9,440) 22,865 3,520
Northen 217,847 327,238 (109,391) 195,227 22,620
National 1,600,000 1,988,066 (388,066) 1,363,390 236,610
Legume MTS
Beans 316.49
Cow peas 1.62
Groundnuts 2,029.46
Pigeon Peas 4.16
Soya 375.04
Total 2,726.77
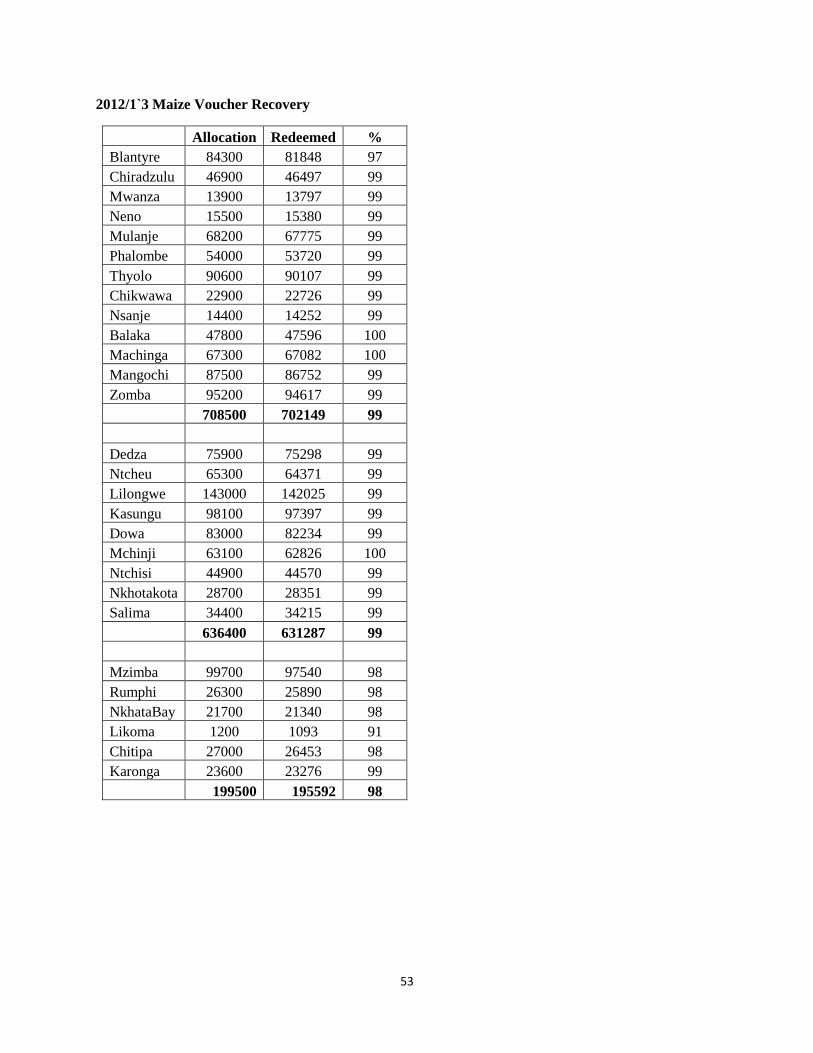
53
2012/1`3 Maize Voucher Recovery
Allocation Redeemed %
Blantyre 84300 81848 97
Chiradzulu 46900 46497 99
Mwanza 13900 13797 99
Neno 15500 15380 99
Mulanje 68200 67775 99
Phalombe 54000 53720 99
Thyolo 90600 90107 99
Chikwawa 22900 22726 99
Nsanje 14400 14252 99
Balaka 47800 47596 100
Machinga 67300 67082 100
Mangochi 87500 86752 99
Zomba 95200 94617 99
708500 702149 99
Dedza 75900 75298 99
Ntcheu 65300 64371 99
Lilongwe 143000 142025 99
Kasungu 98100 97397 99
Dowa 83000 82234 99
Mchinji 63100 62826 100
Ntchisi 44900 44570 99
Nkhotakota 28700 28351 99
Salima 34400 34215 99
636400 631287 99
Mzimba 99700 97540 98
Rumphi 26300 25890 98
NkhataBay 21700 21340 98
Likoma 1200 1093 91
Chitipa 27000 26453 98
Karonga 23600 23276 99
199500 195592 98

54
Legume Distribution by District and Variety during the 2012/13 FISP
Beans Cowpeas Groundnuts Pigeon peas Soya
District K
alim
a
Kh
olo
ph
eth
e Nap
ilir
a
Su
dan
1
ZT
82E
-16
Ch
alim
ban
a
CG
7
ICE
AP
00
55
7
Ch
ital
a
Nsi
nji
lo
Mai
wat
hu
Ali
mi
Sau
ma
Mth
awaj
uni
So
lite
ra
So
pra
nao
Sq
uir
e
Mak
wac
ha
Nas
ok
o
Blantyre 773 16,981 118 355 0 0 56,308 0 248 0 6 51 0 0 44 2,125 106 1,952
Chiradzulu 612 7,371 8 258 1 0 30,228 4605 0 0 353 44 49 0 207 1,086 27 54
Mwanza 845 2,139 0 102 0 0 9,394 0 0 0 360 0 0 0 399 0 0 0
Neno 862 1,232 0 4 0 0 11,796 0 0 0 81 0 0 0 100 205 0 8
Mulanje 3011 9,433 0 3 0 0 46,931 0 224 0 18 0 0 0 1,260 1,082 115 1,188
Phalombe 2921 9,079 0 123 0 0 28,944 0 0 0 1,097 1 0 0 745 1991 37 1,104
Thyolo 556 14,732 0 1 0 0 61,575 392 86 0 18 0 376 0 1293 3291 0 1710
Chikwawa 1097 10,986 0 2 0 0 8,822 0 0 0 28 0 143 0 205 659 166 0
Nsanje 1452 6,950 0 2 0 0 3,973 0 0 0 0 329 171 0 0 10 19 5
Balaka 619 7,095 132 121 0 0 38,176 0 0 0 172 0 0 0 459 76 43 85
Machinga 300 10,303 75 393 4 0 51,689 0 3 0 10,325 233 0 0 421 1,136 119 527
Mangochi 2020 9,893 44 3,583 2813 0 44,822 0 2,664 0 2,668 175 0 1 16 1,409 10 2,257
Zomba 1330 11,568 0 3,262 19 0 53,076 0 2,560 0 170 3,575 0 0 475 5081 2323 1,928
Dedza 1 16,665 0 594 14 0 43,426 0 0 48 1472 0 0 0 3890 4583 16 1,263
Ntcheu 706 13,296 1 2,433 316 0 39,364 0 0 0 1 31 0 0 0 254 1219 2,488
Lilongwe 7 19,185 263 164 1 278 94,151 0 0 1240 97 0 0 0 1091 19574 218 573
Kasungu 0 30,959 0 330 25 0 53,930 0 0 4,003 232 5 0 0 0 4607 126 574
Dowa 0 11,004 220 1,930 132 83 54,692 0 0 460 0 0 0 338 6258 250 1,124

55
Mchinji 0 14,886 0 162 0 0 42,076 0 0 8 116 0 0 1 0 2016 58 232
Ntchisi 0 13,121 7 1033 192 481 22,853 0 0 820 0 0 0 0 0 1787 49 445
Nkhotakota 0 7,080 0 1,188 1 0 14,175 0 0 54 290 0 0 0 162 1419 14 365
Salima 0 7,305 1 544 157 0 23,368 0 0 1 0 0 0 0 4 1570 0 544
Mzimba 0 29,793 263 127 0 0 40,688 0 0 236 0 0 0 1 301 7949 476 6,927
Rumphi 0 3417 0 38 0 0 15,925 0 0 0 0 0 0 0 25 1366 2 2,335
NkhataBay 0 5,596 0 0 0 0 8,947 0 0 0 0 0 0 0 0 1780 77 562
Likoma 0 0 0 0 0 0 0 0 0 0 0 0 0 0 0 0 0 0
Chtipa 0 2,270 0 0 0 0 13,113 0 0 0 0 0 0 0 0 2651 486 1,388
Karonga 0 3,051 0 5 0 0 15,931 0 0 0 0 0 0 0 0 653 333 508
National 17112 29,5390 1,135 16,757 3675 842 92,8373 4997 5,785 6,870 18,602 4,444 739 11 11,435 74,618 6,289 30,146

56
Annex 2.1 FISP Beneficiaries (Source: Logistics Unit: 2006/07 – 2012/13)
2006/07 2007/08 2008/09 2009/10 2010/11 2011/12 2012/13
Chitipa 51,108 38,141 25,259 30,383 30,093 26,340 26,400
Karonga 11,231 24,005 21,832 26,285 26,385 23,082 23,100
Likoma - 709 640 683 1,183 1,100 1,000
Mzimba 146,923 164,573 70,500 107,727 106,800 93,451 99,700
Nkhata Bay 10,640 24,078 21,896 23,956 24,056 21,100 21,700
Rumphi 30,861 34,785 26,400 29,465 29,330 25,700 19,700
Northern Region Totals 250,763 286,291 166,527 218,499 217,847 190,773 191,600
Dedza 76,646 99,635 65,050 67,386 67,536 59,200 75,900
Dowa 114,985 93,030 68,700 72,722 72,782 63,700 63,100
Kasungu 116,923 104,580 79,618 90,345 90,325 79,090 21,700
Lilongwe 265,939 260,492 118,789 161,211 160,572 140,300 143,000
Mchinji 118,554 121,948 62,500 70,131 69,816 61,099 99,700
Nkhotakota 20,450 35,968 24,784 31,437 31,557 27,697 28,700
Ntcheu 95,169 95,564 67,500 73,000 73,120 64,000 64,000
Ntchisi 56,831 50,609 30,000 40,465 41,357 35,700 98,100
Salima 42,215 39,129 34,500 36,800 36,940 32,383 34,400
Central Region Totals 907,712 900,955 551,441 643,497 644,005 563,169 628,600
Balaka 41,539 49,187 40,841 53,285 53,664 46,800 46,900
Blantyre 131,046 82,140 83,661 94,233 94,403 82,600 81,300
Chikwawa 10,369 18,532 11,074 18,895 19,295 16,890 22,900
Chiradzulu 51,878 61,782 55,359 52,964 52,549 45,990 46,000
Machinga 99,261 81,783 62,315 64,819 65,119 56,900 67,300
Mangochi 95,078 94,976 50,088 75,825 75,729 66,270 87,500
Mulanje 83,323 76,054 69,093 76,533 76,299 66,769 66,800
Mwanza 20,154 19,385 21,802 15,600 15,455 13,530 13,000
Neno 25,846 21,593 12,868 17,573 17,326 15,200 15,200
Nsanje 6,554 12,153 10,970 14,702 15,202 13,310 14,400
Phalombe 66,739 49,345 71,273 60,379 60,145 52,700 43,200
Thyolo 95,108 93,932 88,302 101,685 101,746 88,766 73,600
Zomba 114,615 91,685 74,387 91,511 91,216 79,824 95,200
Southern Region Totals 841,510 752,547 652,033 738,004 738,148 645,549 673,300
National Total 1,999,985 1,939,793 1,370,001 1,600,000 1,600,000 1,399,491 1,493,500

57
Annex 2.1 FISP Fertilizer Distribution (Source: Logistics Unit: 2006/07 – 2012/13)
2006/07
District Urea NPK 23:21:00 D-Compound Total Fertilizer
Chitipa 1,635.30 1,686.60 459.3 468.9 4,250.10
Karonga 585.55 592.4 0.3 1,178.25
Rumphi 1,588.95 1,635.60 650.4 572 4,446.95
Nkhata Bay 349.45 464.25 23.15 2.65 839.5
Mzimba 9,061.75 8,053.65 1,857.56 1,711.40 20,684.36
Regional Total 13,221.00 12,432.50 2,990.71 2,754.95 31,399.16
Ntchisi 1,869.20 1,818.20 591.25 538.25 4,817
Dowa 3,789.70 3,631.70 1,035.35 1,220.55 9,677.30
Mchinji 4,189.60 4,245.75 828.65 845.75 10,109.75
Kasungu 4,570.40 4,285.25 1,385.90 1,729.25 11,970.80
Salima 1,463.55 1,436.60 58.55 6.3 2,965.00
Nkhotakota 702.95 685 34 29.7 1,451.65
Lilongwe 12,712.30 11,629.10 2,234.95 1,843.85 28,420.20
Dedza 2,706.45 2,567.90 167.45 175.2 5,617.00
Ntcheu 4,390.10 4,244.70 221.1 184.1 9,040.00
Regional Total 36,394.25 34,544.20 6,557.20 6,572.95 84,068.60
Balaka 1,533.40 1,467.14 47.1 39.2 3,086.84
Mangochi 2,947.75 2,966.90 317.05 287 6,518.70
Machinga 4,092.65 3,476.30 218.75 193.15 7,980.85
Zomba 3,679.60 3,810.25 447.75 402.8 8,340.40
Chiradzulu 2,288.05 2,133.30 89.8 81.05 4,592.20
Mwanza 578 577.7 4.95 7.15 1,167.80
Neno 452.8 686.8 4 4 1,147.60
Thyolo 3,467.50 3,568.85 89.55 119.5 7,245.40
Phalombe 2,191.15 2,219.85 130.2 134.2 4,675.40
Mulanje 2,776.05 2,793.95 25.25 32.2 5,627.45
Blantyre 4,078.35 3,828.60 95 53.5 8,055.45
Chikwawa 240.05 278.2 518.25
Nsanje 123.5 140.5 264
Regional Total 28,448.85 27,948.34 1,469.40 1,353.75 59,220.34
National Total 78,064.10 74,925,04 11,017.31 10,681.65 174,688.10
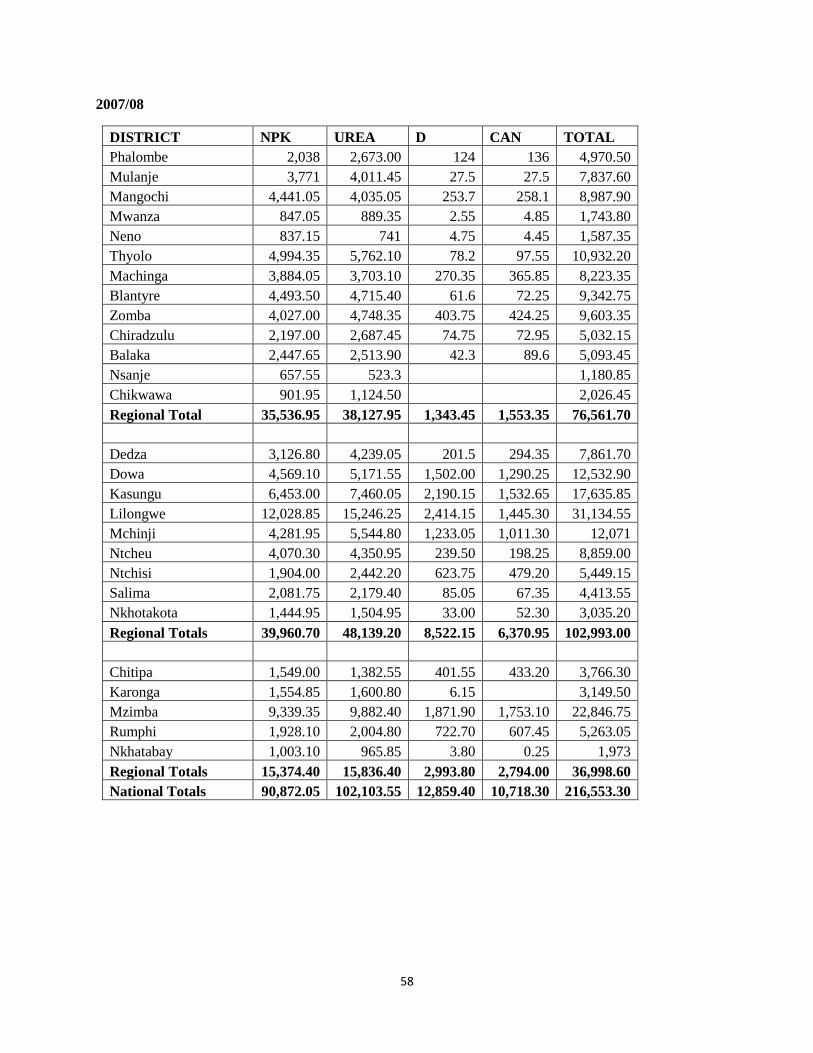
58
2007/08
DISTRICT NPK UREA D CAN TOTAL
Phalombe 2,038 2,673.00 124 136 4,970.50
Mulanje 3,771 4,011.45 27.5 27.5 7,837.60
Mangochi 4,441.05 4,035.05 253.7 258.1 8,987.90
Mwanza 847.05 889.35 2.55 4.85 1,743.80
Neno 837.15 741 4.75 4.45 1,587.35
Thyolo 4,994.35 5,762.10 78.2 97.55 10,932.20
Machinga 3,884.05 3,703.10 270.35 365.85 8,223.35
Blantyre 4,493.50 4,715.40 61.6 72.25 9,342.75
Zomba 4,027.00 4,748.35 403.75 424.25 9,603.35
Chiradzulu 2,197.00 2,687.45 74.75 72.95 5,032.15
Balaka 2,447.65 2,513.90 42.3 89.6 5,093.45
Nsanje 657.55 523.3 1,180.85
Chikwawa 901.95 1,124.50 2,026.45
Regional Total 35,536.95 38,127.95 1,343.45 1,553.35 76,561.70
Dedza 3,126.80 4,239.05 201.5 294.35 7,861.70
Dowa 4,569.10 5,171.55 1,502.00 1,290.25 12,532.90
Kasungu 6,453.00 7,460.05 2,190.15 1,532.65 17,635.85
Lilongwe 12,028.85 15,246.25 2,414.15 1,445.30 31,134.55
Mchinji 4,281.95 5,544.80 1,233.05 1,011.30 12,071
Ntcheu 4,070.30 4,350.95 239.50 198.25 8,859.00
Ntchisi 1,904.00 2,442.20 623.75 479.20 5,449.15
Salima 2,081.75 2,179.40 85.05 67.35 4,413.55
Nkhotakota 1,444.95 1,504.95 33.00 52.30 3,035.20
Regional Totals 39,960.70 48,139.20 8,522.15 6,370.95 102,993.00
Chitipa 1,549.00 1,382.55 401.55 433.20 3,766.30
Karonga 1,554.85 1,600.80 6.15 3,149.50
Mzimba 9,339.35 9,882.40 1,871.90 1,753.10 22,846.75
Rumphi 1,928.10 2,004.80 722.70 607.45 5,263.05
Nkhatabay 1,003.10 965.85 3.80 0.25 1,973
Regional Totals 15,374.40 15,836.40 2,993.80 2,794.00 36,998.60
National Totals 90,872.05 102,103.55 12,859.40 10,718.30 216,553.30
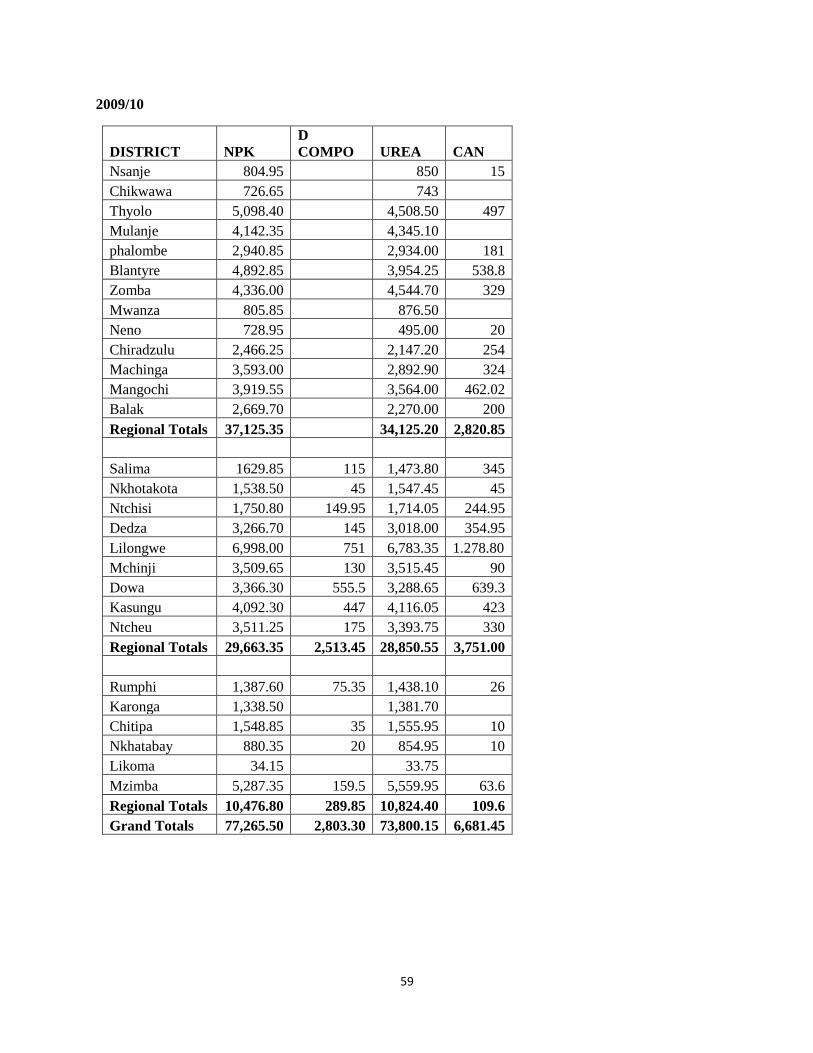
59
2009/10
DISTRICT NPK
D
COMPO UREA CAN
Nsanje 804.95 850 15
Chikwawa 726.65 743
Thyolo 5,098.40 4,508.50 497
Mulanje 4,142.35 4,345.10
phalombe 2,940.85 2,934.00 181
Blantyre 4,892.85 3,954.25 538.8
Zomba 4,336.00 4,544.70 329
Mwanza 805.85 876.50
Neno 728.95 495.00 20
Chiradzulu 2,466.25 2,147.20 254
Machinga 3,593.00 2,892.90 324
Mangochi 3,919.55 3,564.00 462.02
Balak 2,669.70 2,270.00 200
Regional Totals 37,125.35 34,125.20 2,820.85
Salima 1629.85 115 1,473.80 345
Nkhotakota 1,538.50 45 1,547.45 45
Ntchisi 1,750.80 149.95 1,714.05 244.95
Dedza 3,266.70 145 3,018.00 354.95
Lilongwe 6,998.00 751 6,783.35 1.278.80
Mchinji 3,509.65 130 3,515.45 90
Dowa 3,366.30 555.5 3,288.65 639.3
Kasungu 4,092.30 447 4,116.05 423
Ntcheu 3,511.25 175 3,393.75 330
Regional Totals 29,663.35 2,513.45 28,850.55 3,751.00
Rumphi 1,387.60 75.35 1,438.10 26
Karonga 1,338.50 1,381.70
Chitipa 1,548.85 35 1,555.95 10
Nkhatabay 880.35 20 854.95 10
Likoma 34.15 33.75
Mzimba 5,287.35 159.5 5,559.95 63.6
Regional Totals 10,476.80 289.85 10,824.40 109.6
Grand Totals 77,265.50 2,803.30 73,800.15 6,681.45

60
2010/11
DISTRICT
ALLOCATION NPK UREA
OVER/UNDER
Blantyre 94,403 94,751 92,997 1,058
Chiradzulu 52,549 51,264 50,770 3,064
Mwanza 15,455 13,687 14,158 3,065
Neno 17,326 18,132 17,671 (1,151)
Mulanje 76,299 75,409 76,333 856
Phalombe 60,145 57,951 60,246 2,093
Thyolo 101,746 99,734 99,438 4,320
Chikwawa 19,295 17,351 13,467 7,772
Nsanje 15,202 13,508 10,788 6,108
Balaka 53,664 54,468 53,200 (340)
Machinga 65,119 67,962 67,464 (5,188)
Mangochi 75,729 78,684 83,348 10,574
Zomba 91,216 84,948 90,713 6,771
South 738,148 727,849 730,593 17,854
Dedza 67,536 69,466 63,766 1,840
Ntcheu 73,120 78,175 77,294 (9,229)
Lilongwe 160,572 160,995 160,952 (803)
Kasungu 90,325 90,498 90,248 (96)
Dowa 72,782 72,613 72,346 605
Mchinji 69,816 68,752 70,401 479
Ntchisi 41,357 40,997 41,276 441
Nkhotakota 31,557 30,246 30,305 2,563
Salima 36,940 35,767 36,769 1,344
Central 664,005 647,509 643,357 (2,856)
Mzimba 106,800 106,746 106,760 94
Rumphi 29,330 28,862 29,351 447
Nkhatabay 24,056 23,845 23,860 407
Likoma 1,183 1,069 1,045 252
Chitipa 30,093 28,948 30,725 513
Karonga 26,385 26,027 26,225 518
Northen 217,847 215,497 217,966 2,231
National 1,600,000 1,590,855 1,591,916 17,229

61
2011/12
DISTRICT NPK UREA TOTAL
Balaka 2,326.00 2,262,95 4,588.95
Blantyre 4,261 4,264.50 8,525.50
Chikwaw 711,60 642.4 1,354.00
Chiradzulu 2,285.00 2,292.00 4,577.00
Machinga 2,979.45 2,622.90 5,602.35
Mangochi 3,600.00 3,193,50 6,793.50
Mulanje 3,156.00 3,226.85 6,382.85
Mwanza 726.00 736.05 1,462.05
Neno 689.00 669.90 1,358.90
Nsanje 630.00 542.00 1,172.00
Phalombe 2,762.00 2,525.00 5,287.00
Thyolo 4,393.75 4,641.45 9,035.20
Zomba 4,134.00 4,117.50 8,251.50
Southern
Region 32,653.80 31,737.00 64,390.80
Dedza 2,733.20 2,761.85 5,495.05
Dowa 3,271.00 2,926 6,196.50
Kasungu 4,063.90 4,110.00 8,173.90
Lilongwe 7,039.30 7,167.10 14,206.40
Mchinji 3,014.95 3,023.05 6,038.00
Nkhotakota 1,352.00 1,440.00 2,792.00
Ntcheu 3,244.20 3,343.75 6,587.95
Ntchisi 1,533.05 1,854.00 3,387.05
Salima 1,471.95 1,558.40 3,030.35
Central Region 27,723.55 28,183.65 55,907.20
Chitipa 1,442.05 1,277.20 2,719.25
Karonga 1,169.50 1,178.00 2,347.50
Likoma 51.25 51,25 102,50
Mzimba 4,820.50 5,041.81 9,862.31
Nkhatabay 919.00 975.00 1,894.00
Rumphi 1,255.10 1.421.65 2,676.75
Northern
Region 9,657.40 9,944.91 19,602.31
National Total 70.034.75 69,865.56 139,900.31

62
2012/13
DISTRICT NPK UREA TOTAL
Balaka 2,406 2,445.15 4,852.10
Blantyre 4,282.40 4,218.70 8,501.10
Chikhwawa 1,011.95 842.00 1,853.95
Chiradzulu 2,382.75 2,298.00 4,680.75
Machinga 3,410.85 3,234.95 6,645.80
Mangochi 4,463.95 4,446.95 8,910.90
Mulanje 3,239.95 3,221.00 6,460.95
Mwanza 739.00 655.95 1,394.95
Neno 739 655.95 1,556.35
Nsanje 829.8 938.05 1,767.85
Phalombe 2,621.85 2,649.00 5,270.85
Thyolo 4,429.75 4,569 8,999.65
Zomba 4,857.90 5,087.00 9,944.90
Southern
Region 35,429.25 35,410.85 70,840.10
Dedza 3,800.00 3,637.45 7,437.45
Dowa 4,418.80 4,795.70 9,214.50
Kasungu 4,729.10 4,849.60 9,579
Lilongwe 7,088.80 6,915.95 14,004.75
Mchinji 3,224,65 3,186.65 6,411.00
Nkhotakota 1,396.20 1,451.80 2,848.00
Ntcheu 3,230.90 3,180.10 6,411.00
Ntchisi 2,211.25 2,197.00 4,408.25
Salima 1,772.70 1,674.65 3,447.35
Central
Region 31,872.40 31,888.80 63,761.30
Chitipa 1,418.45 1,420.65 2,839.10
Karonga 1,115.20 1,079.95 2,195.15
Likoma 50 50 100
Mzimba 4,972.95 4,935.95 9,908.90
Nkhatabay 1,071.65 1,082.15 2,153.80
Rumphi 1,310.10 1,346.10 2,656.20
Northern
Region 9,938.35 9,914.80 19,853.15
National 77,240.00 77,214.55 154,454.55
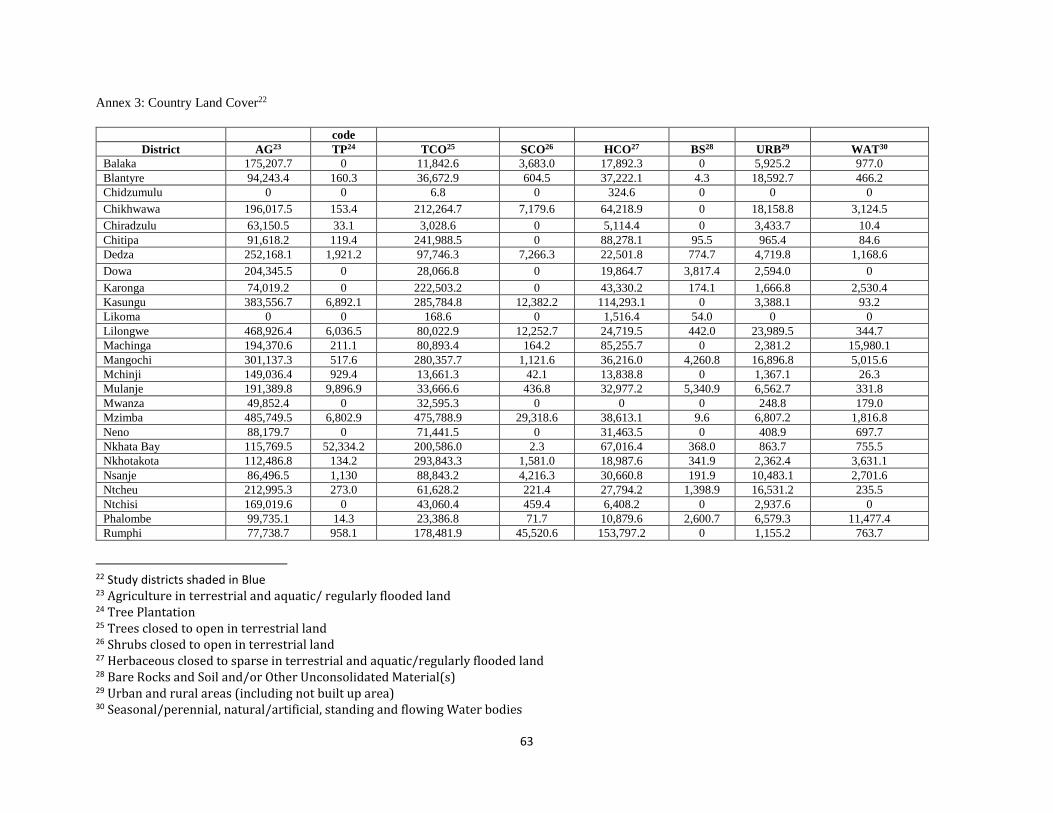
63
Annex 3: Country Land Cover22
code
District AG23 TP24 TCO25 SCO26 HCO27 BS28 URB29 WAT30
Balaka 175,207.7 0 11,842.6 3,683.0 17,892.3 0 5,925.2 977.0
Blantyre 94,243.4 160.3 36,672.9 604.5 37,222.1 4.3 18,592.7 466.2
Chidzumulu 0 0 6.8 0 324.6 0 0 0
Chikhwawa 196,017.5 153.4 212,264.7 7,179.6 64,218.9 0 18,158.8 3,124.5
Chiradzulu 63,150.5 33.1 3,028.6 0 5,114.4 0 3,433.7 10.4
Chitipa 91,618.2 119.4 241,988.5 0 88,278.1 95.5 965.4 84.6
Dedza 252,168.1 1,921.2 97,746.3 7,266.3 22,501.8 774.7 4,719.8 1,168.6
Dowa 204,345.5 0 28,066.8 0 19,864.7 3,817.4 2,594.0 0
Karonga 74,019.2 0 222,503.2 0 43,330.2 174.1 1,666.8 2,530.4
Kasungu 383,556.7 6,892.1 285,784.8 12,382.2 114,293.1 0 3,388.1 93.2
Likoma 0 0 168.6 0 1,516.4 54.0 0 0
Lilongwe 468,926.4 6,036.5 80,022.9 12,252.7 24,719.5 442.0 23,989.5 344.7
Machinga 194,370.6 211.1 80,893.4 164.2 85,255.7 0 2,381.2 15,980.1
Mangochi 301,137.3 517.6 280,357.7 1,121.6 36,216.0 4,260.8 16,896.8 5,015.6
Mchinji 149,036.4 929.4 13,661.3 42.1 13,838.8 0 1,367.1 26.3
Mulanje 191,389.8 9,896.9 33,666.6 436.8 32,977.2 5,340.9 6,562.7 331.8
Mwanza 49,852.4 0 32,595.3 0 0 0 248.8 179.0
Mzimba 485,749.5 6,802.9 475,788.9 29,318.6 38,613.1 9.6 6,807.2 1,816.8
Neno 88,179.7 0 71,441.5 0 31,463.5 0 408.9 697.7
Nkhata Bay 115,769.5 52,334.2 200,586.0 2.3 67,016.4 368.0 863.7 755.5
Nkhotakota 112,486.8 134.2 293,843.3 1,581.0 18,987.6 341.9 2,362.4 3,631.1
Nsanje 86,496.5 1,130 88,843.2 4,216.3 30,660.8 191.9 10,483.1 2,701.6
Ntcheu 212,995.3 273.0 61,628.2 221.4 27,794.2 1,398.9 16,531.2 235.5
Ntchisi 169,019.6 0 43,060.4 459.4 6,408.2 0 2,937.6 0
Phalombe 99,735.1 14.3 23,386.8 71.7 10,879.6 2,600.7 6,579.3 11,477.4
Rumphi 77,738.7 958.1 178,481.9 45,520.6 153,797.2 0 1,155.2 763.7
22 Study districts shaded in Blue 23 Agriculture in terrestrial and aquatic/ regularly flooded land 24 Tree Plantation 25 Trees closed to open in terrestrial land 26 Shrubs closed to open in terrestrial land 27 Herbaceous closed to sparse in terrestrial and aquatic/regularly flooded land 28 Bare Rocks and Soil and/or Other Unconsolidated Material(s) 29 Urban and rural areas (including not built up area) 30 Seasonal/perennial, natural/artificial, standing and flowing Water bodies
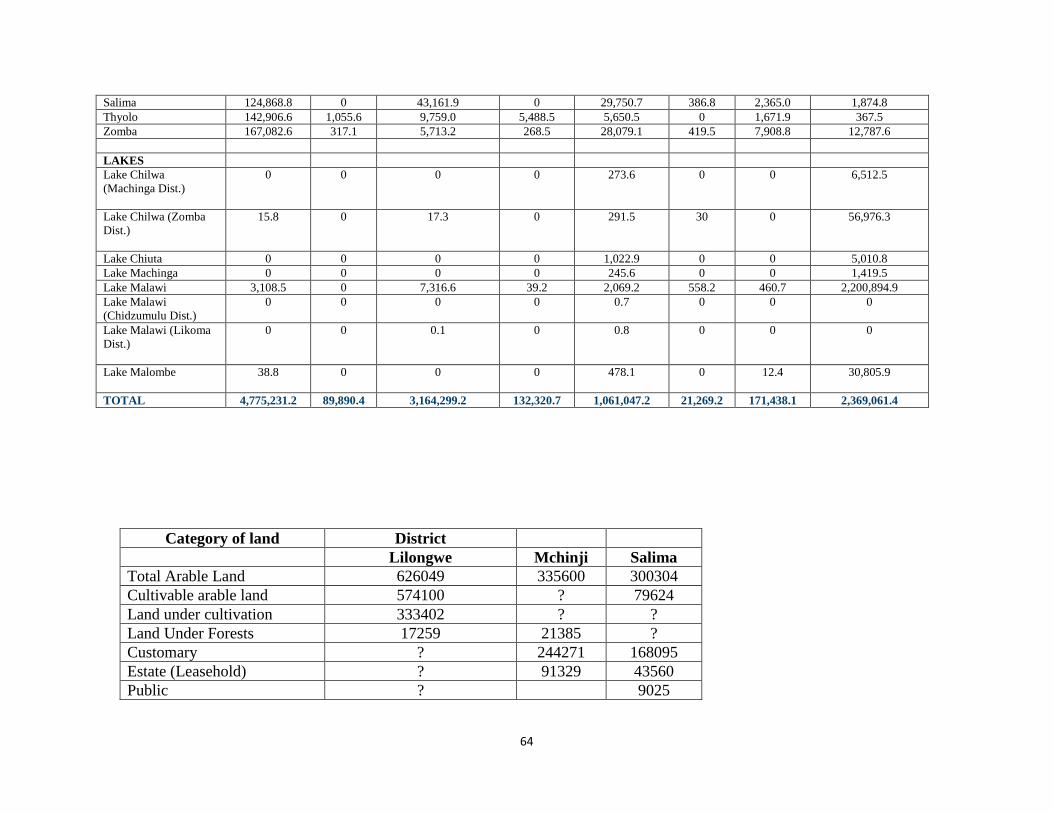
64
Salima 124,868.8 0 43,161.9 0 29,750.7 386.8 2,365.0 1,874.8
Thyolo 142,906.6 1,055.6 9,759.0 5,488.5 5,650.5 0 1,671.9 367.5
Zomba 167,082.6 317.1 5,713.2 268.5 28,079.1 419.5 7,908.8 12,787.6
LAKES
Lake Chilwa
(Machinga Dist.)
0 0 0 0 273.6 0 0 6,512.5
Lake Chilwa (Zomba
Dist.)
15.8 0 17.3 0 291.5 30 0 56,976.3
Lake Chiuta 0 0 0 0 1,022.9 0 0 5,010.8
Lake Machinga 0 0 0 0 245.6 0 0 1,419.5
Lake Malawi 3,108.5 0 7,316.6 39.2 2,069.2 558.2 460.7 2,200,894.9
Lake Malawi
(Chidzumulu Dist.)
0 0 0 0 0.7 0 0 0
Lake Malawi (Likoma
Dist.)
0 0 0.1 0 0.8 0 0 0
Lake Malombe
38.8 0 0 0 478.1 0 12.4 30,805.9
TOTAL 4,775,231.2 89,890.4 3,164,299.2 132,320.7 1,061,047.2 21,269.2 171,438.1 2,369,061.4
Category of land District
Lilongwe Mchinji Salima
Total Arable Land 626049 335600 300304
Cultivable arable land 574100 ? 79624
Land under cultivation 333402 ? ?
Land Under Forests 17259 21385 ?
Customary ? 244271 168095
Estate (Leasehold) ? 91329 43560
Public ? 9025

65
Freehold ? ? ? Salima
Total Farm families 443670 ? ?
Male Headed 308766 ? 67562 FromFao 2013 total ag land 468,926.4 149,036.4 124,868.8