Prepared For Financial Goal Plan Jim and Anne Sample ...
76
Financial Goal Plan Prepared by: Baird Advisor Financial Advisor Private Wealth Management Prepared For Prepared on January 29, 2019 Jim and Anne Sample
Transcript of Prepared For Financial Goal Plan Jim and Anne Sample ...

Financial Goal Plan
Prepared by:
Baird AdvisorFinancial AdvisorPrivate Wealth Management
Prepared For
Prepared on January 29, 2019
Jim and Anne Sample

Table Of Contents
IMPORTANT DISCLOSURE INFORMATION 1 - 7
Summary of Goals and Resources
Personal Information and Summary of Financial Goals 8 - 9
Worksheet Detail - Health Care Expense Schedule 10 - 13
Net Worth Summary - All Resources 14
Net Worth Detail - All Resources 15 - 16
Resources Summary 17 - 18
Tax and Inflation Assumptions 19
Model Portfolio Table 20
Worksheet Detail - Allocation Comparison 21 - 22
Employer Stock Plans
Stock Options 23 - 24
Stock Options Summary 25 - 28
Restricted Stock Summary 29 - 30
Results
What If Worksheet 31 - 38
Worksheet Detail - Social Security Analysis 39 - 40
Worksheet Detail - Special Asset Test 41
Worksheet Detail - Inside the Numbers Final Result 42
Worksheet Detail - Combined Details 43 - 46
Worksheet Detail - Retirement Distribution Cash Flow Chart 47 - 55
Risk Management
Life Insurance Needs Analysis 56
Disability Needs Analysis - Jim 57 - 59
Long-Term Care Needs Analysis - Jim 60
Estate Analysis
Estate Analysis Results Combined Summary 61
Estate Analysis Results Flowchart 62 - 63
Star Track
Star Track 64
Glossary 65 - 68

IMPORTANT DISCLOSURE INFORMATION
01/29/2019
Prepared for : Jim and Anne Sample Company: R. W. Baird Prepared by: Baird Advisor
Page 1 of 68
The return assumptions in MoneyGuidePro are not reflective of any specific product, and donot include any fees or expenses that may be incurred by investing in specific products. Theactual returns of a specific product may be more or less than the returns used inMoneyGuidePro. It is not possible to directly invest in an index. Financial forecasts, rates ofreturn, risk, inflation, and other assumptions may be used as the basis for illustrations. Theyshould not be considered a guarantee of future performance or a guarantee of achievingoverall financial objectives. Past performance is not a guarantee or a predictor of futureresults of either the indices or any particular investment.
IMPORTANT: The projections or other information generated by MoneyGuidePro regardingthe likelihood of various investment outcomes are hypothetical in nature, do not reflectactual investment results, and are not guarantees of future results.
MoneyGuidePro results may vary with each use and over time.
In consideration for the receipt of this financial report or plan (the “Report” or “Plan”),each recipient (“you”), hereby understands, acknowledges, and agrees as follows:
Important Information about Baird’s Obligations To You When Providing FinancialPlans and Financial Planning Services
Robert W. Baird & Co. Incorporated (“Baird”) offers financial plans and financial planningservices to clients in two ways: (1) as a brokerage service, provided in Baird’s capacity asbroker-dealer; and (2) as an investment advisory service, provided in Baird’s capacity asinvestment advisor under the Investment Advisers Act of 1940, as amended (the “AdvisersAct”). There are important differences between brokerage services and investment advisoryservices and Baird’s obligations to clients when it provides those services. Some of thosedifferences are described below. More specific information about those services, and thedifferences between them, is available on Baird’s website at http://www.rwbaird.com/about-baird/disclosures.aspx.
Whether Baird provides financial planning services as broker-dealer or investment advisordepends upon whether or not a client has entered into a written financial planningagreement with Baird. If a client does not enter into a written financial planning agreementwith Baird, then Baird acts as broker-dealer when providing those services. If a client entersinto a written financial planning agreement with Baird, then Baird acts as investmentadvisor when providing those services.
Brokerage Services—Financial Planning Services Provided without a Written FinancialPlanning Agreement
If you have not entered into a written financial planning agreement with Baird for the Planand related financial planning services, you should understand that Baird and your BairdFinancial Advisor do not provide investment advisory services to you or act as a fiduciary toyou under the Advisers Act. Rather, Baird is providing the Plan and related financialplanning services to you in its capacity as a broker-dealer, and Baird’s provision of the Planand financial planning services to you are solely incidental to the brokerage services itprovides to you. In providing services to you as a broker-dealer, Baird must have areasonable basis for believing the recommendations made to you are suitable. Once thePlan is delivered to you, the financial planning services provided to you will be deemed tobe completed, and Baird and your Baird Financial Advisor will have no obligation to updatethe Plan, implement the Plan or monitor the investments in your accounts.
If you would like more information about investment advisory financial planning services, orif you would like to enter into a written financial planning agreement with Baird for thoseservices, please contact your Baird Financial Advisor. You should note that Baird generallycharges a separate financial planning fee for investment advisory financial planning services.
Investment Advisory Services—Financial Planning Services Provided under a WrittenFinancial Planning Agreement
If Baird is providing the Plan and related financial planning services to you under a writtenfinancial planning agreement, Baird acts as a fiduciary to you under the Advisers Act andsuch services constitute investment advisory services subject to the Advisers Act. Thespecific terms and conditions related to the Plan and financial planning services provided toyou will be contained in your written financial planning agreement. Additional importantinformation about Baird, Baird’s Financial Planning Department and your Baird FinancialAdvisor and the advisory services they provide in connection with the Plan is contained inBaird’ Form ADV Part 2A Financial Planning Services Brochure and the Form ADV Part 2BBrochure Supplements for the Financial Planning Department and your Baird FinancialAdvisor (collectively, the “Brochure Documents”). Unless your written financial planningagreement with Baird otherwise provides, the advisory services provided by Baird and yourBaird Financial Advisor to you are limited to advice or recommendations incorporated intothe Plan delivered to you and advice or recommendations made to you, if any, during ameeting relating to the contents of the Plan. Unless Baird has otherwise agreed in writing,the financial planning services provided to you and Baird’s investment advisory relationshipwith you will be deemed to be completed when the Plan is delivered to you, and Baird andyour Baird Financial Advisor will have no obligation to update the Plan, implement the Planor monitor the investments in your accounts. You should refer to your written financialplanning agreement and the Brochure Documents for more specific information.

IMPORTANT DISCLOSURE INFORMATION
01/29/2019
Prepared for : Jim and Anne Sample Company: R. W. Baird Prepared by: Baird Advisor
Page 2 of 68
Date of Plan
The information contained in the Plan is provided as of the date shown on the cover pageto the Plan. Baird and its Financial Advisors do not undertake to update the Plan or theinformation contained therein unless they specifically agree to do so in writing. However,Baird reserves the right to amend the Plan should additional information or evidencebecome available. Account values that are shown in the Plan are based on values providedas of a specific date. Actual account values will change on an ongoing basis, and they maybe substantially different from that shown in the Plan.
Use of Third Party Software
The Plan was prepared using MoneyGuidePro Software. While Baird believes thatMoneyGuidePro Software is reliable, Baird makes no representation or guarantee that thecalculations made by the software or the information contained in the Plan are accurate.
Legal and Tax Advice
Baird and its representatives do not provide legal or tax advice to clients. You are stronglyurged to consult with your legal and tax professionals prior to taking any action based uponthe information contained in the Report.
Not an Official Statement of Assets, Debt or Income
The Plan is provided to you for informational purposes only and is not intended, in anymanner, to be an official account statement or an official statement of your assets, debt orincome.
Baird’s Reliance upon Information Provided by You
Baird and your Baird Financial Advisor have prepared the Plan for you using the informationthat you have provided. You are solely responsible for providing information to Baird andyour Baird Financial Advisor reasonably requested by them in order to provide the servicesselected by you and for ensuring the information in this Plan is true and complete. Inproviding the services and preparing the Plan, Baird and your Baird Financial Advisor haveassumed that you have provided true and complete responses to the information requestedby them. Baird and your Baird Financial Advisor have relied upon this information withoutindependent verification. You are responsible for promptly informing your Baird FinancialAdvisor of any inaccuracies or changes in any information you provide. Neither Baird noryour Baird Financial Advisor is responsible for any errors in the Plan or any adverseconsequence arising out of the failure by you to provide true and complete information orto promptly inform your Baird Financial Advisor of any such inaccuracies or changes.
Forward-Looking Projections and Certain Hypothetical Assumptions
The Report contains forward-looking projections that are based upon certain hypotheticalassumptions about future events. Some of these hypothetical assumptions include, withoutlimitation, hypothetical assumptions about future: rates of inflation, interest rates, rates ofreturn, levels of asset appreciation, dividend rates, growth rates, your income andexpenditure amounts, taxes, tax rates, tax filing status, liquidations and divisions ofproperty, and support payments, as applicable. If you would like information about theassumptions made in connection with the preparation of the Report, you should contactyour Baird Financial Advisor. Forward-looking projections illustrate the effects of usingassumptions and should be used only as an aid for planning and decision making. Youshould not interpret forward-looking projections as an indication or guarantee of what willhappen in the future. Baird and its representatives do not make any promise or guaranteethat forward-looking projections or hypothetical assumptions will be realized in the future.You should note that any hypothetical assumption about future events made in the Reportmay not occur as is assumed by the Report. The forward-looking projections contained inthe Report could be materially impacted to the extent actual future events differ from thehypothetical assumptions made in the Report. You are, therefore, cautioned against undulyrelying upon the forward-looking projections contained in the Report.
You and your tax and legal professionals should carefully review the Report andconsider the hypothetical assumptions made before making any decision or takingany action based upon the Report.
Asset, Debt, Income and Expense Information
If the Plan contains assets over which Baird has custody, Baird generally relies upon thirdparty sources, such as third party pricing services, when valuing those assets. In someinstances, such as when Baird is unable to obtain a price for an asset from a pricing service,Baird may obtain a price from its trading desk or it may elect to not price the asset.Obtaining a price from its trading desk may present a conflict of interest. In some cases,Baird obtains prices from the issuers or sponsors of investment products. This frequentlyoccurs with respect to the valuation of alternative investment products. Baird does notconduct a review of valuation information provided by third party pricing services, issuers,or sponsors, and it does not verify or guarantee the accuracy of such information. Valuationdata for investments, particularly alternative investment products, may not be provided toBaird in a timely manner, resulting in valuations that are not current.

IMPORTANT DISCLOSURE INFORMATION
01/29/2019
Prepared for : Jim and Anne Sample Company: R. W. Baird Prepared by: Baird Advisor
Page 3 of 68
The Plan contains assets that are not custodied with Baird. Those assets have beenincluded in the Plan at your request and have been valued based solely upon theinformation that you or your agents have provided to your Baird FinancialAdvisor(s). Likewise, all debt, income and expense information included in thePlan has been included in the Plan at your request based solely upon theinformation that you or your agents have provided to your Baird FinancialAdvisor(s). The Plan is useful only if all asset, debt, income and expenseinformation contained in the Plan is accurate. Therefore, you and your tax andlegal professionals should carefully review the Plan and verify the accuracy of allasset, debt, income and expense information before making any decision or takingany action based upon the Plan. Baird and its Financial Advisors do not verify orguarantee the existence of assets that are not under Baird’s custody or theaccuracy of any information provided by you or your agents. Neither Baird nor itsFinancial Advisors are responsible for any adverse consequence arising out ofinformation provided by you or your agents.
The values shown in the Plan could be materially different from prices obtained from othersources. This is especially true for certain types of assets that may be difficult to value, suchas real property, automobiles, jewelry, art, antiques, coins, or other similar assets orcollectibles. Values used in the Plan may vary from prices received in actual transactions andare not firm bids, offers or guarantees of any type with respect to the value of assets, andthe values shown in the Plan may be greater than or less than the amount you wouldreceive if the assets were actually sold.
Characterization and Division of Property; Support Payments
Any characterization of property in the Report as marital property or separate property andany proposed division of property contained in the Report is based solely upon informationprovided by you or your agents. Any proposed division of property contained in the Reportare for settlement and discussion purposes only (i.e., to reflect a proposed settlement offer,possible property division scenarios, etc.). It is not a recommendation of what should bedone. In addition, support calculations contained in the Report are shown for settlementand discussion purposes only. It is not a recommendation of what should be done. You andyour legal professionals should carefully review any such property characterization ordivision or support payments to ensure that they are accurate.
Information that you provided about your assets, financial goals, and personal situation arekey assumptions for the calculations and projections in this Report. Please review theReport sections titled "Personal Information and Summary of Financial Goals", "CurrentPortfolio Allocation", and "Tax and Inflation Options" to verify the accuracy of theseassumptions. If any of the assumptions are incorrect, you should notify your financialadvisor. Even small changes in assumptions can have a substantial impact on the resultsshown in this Report. The information provided by you should be reviewed periodically andupdated when either the information or your circumstances change.
Information Provided by You
MoneyGuidePro Assumptions and Limitations
All asset and net worth information included in this Report was provided by you or yourdesignated agents, and is not a substitute for the information contained in the officialaccount statements provided to you by custodians. The current asset data and valuescontained in those account statements should be used to update the asset informationincluded in this Report, as necessary.
Assumptions and Limitations
MoneyGuidePro offers several methods of calculating results, each of which provides oneoutcome from a wide range of possible outcomes. All results in this Report are hypotheticalin nature, do not reflect actual investment results, and are not guarantees of future results.All results use simplifying assumptions that do not completely or accurately reflect yourspecific circumstances. No Plan or Report has the ability to accurately predict the future. Asinvestment returns, inflation, taxes, and other economic conditions vary from theMoneyGuidePro assumptions, your actual results will vary (perhaps significantly) from thosepresented in this Report.
All MoneyGuidePro calculations use asset class returns, not returns of actual investments.The projected return assumptions used in this Report are estimates based on average annualreturns for each asset class. The portfolio returns are calculated by weighting individualreturn assumptions for each asset class according to your portfolio allocation. The portfolioreturns may have been modified by including adjustments to the total return and theinflation rate. The portfolio returns assume reinvestment of interest and dividends at netasset value without taxes, and also assume that the portfolio has been rebalanced to reflectthe initial recommendation. No portfolio rebalancing costs, including taxes, if applicable,are deducted from the portfolio value. No portfolio allocation eliminates risk or guaranteesinvestment results.
MoneyGuidePro does not provide recommendations for any products or securities.

IMPORTANT DISCLOSURE INFORMATION
01/29/2019
Prepared for : Jim and Anne Sample Company: R. W. Baird Prepared by: Baird Advisor
Page 4 of 68
Asset Class NameProjected Return
AssumptionProjected Standard
Deviation
Large Cap Core 7.20% 15.00%
Large Cap Growth 6.70% 16.90%
Large Cap Value 7.30% 14.40%
Mid Cap Core 8.90% 16.50%
Mid Cap Growth 8.60% 20.00%
Mid Cap Value 9.20% 15.60%
Small Cap Core 9.40% 19.30%
Small Cap Growth 9.30% 22.40%
Small Cap Value 9.50% 17.30%
International Equity 7.70% 17.20%
Emerging Markets Equity 9.90% 22.10%
Broad Equity 7.60% 15.20%
Commodities 2.10% 14.60%
REITs 12.20% 18.30%
Global REITs 10.10% 17.60%
Short Term Taxable 1.70% 2.70%
Intermediate Term Taxable 2.30% 4.10%
Long Term Taxable 4.20% 8.60%
Short Term Tax-Exempt 2.15% 3.00%
Short Term Tax-Exempt(Tax-Free)
1.40% 3.00%
Intermediate Term Tax-Exempt 2.92% 3.80%
Intermediate Term Tax-Exempt(Tax-Free)
1.90% 3.80%
Long-Term Tax-Exempt 4.77% 7.10%
Long-Term Tax-Exempt(Tax-Free)
3.10% 7.10%
High Yield Fixed Income 6.30% 8.50%
Global Fixed Income 3.20% 5.40%
Broad Fixed Income 3.20% 5.30%
Asset Class NameProjected Return
AssumptionProjected Standard
Deviation
Cash 0.70% 1.10%
Hedge Funds 6.70% 8.50%
Managed Futures 4.40% 6.40%
Private Equity 13.40% 23.50%
Alternatives - Other 5.80% 7.40%
IMPORTANT DISCLOSURE INFORMATION
01/29/2019
Prepared for : Jim and Anne Sample Company: R. W. Baird Prepared by: Baird Advisor
Page 5 of 68
Risks Inherent in Investing
Investing in fixed income securities involves interest rate risk, credit risk, and inflation risk.Interest rate risk is the possibility that bond prices will decrease because of an interest rateincrease. When interest rates rise, bond prices and the values of fixed income securities fall.When interest rates fall, bond prices and the values of fixed income securities rise. Creditrisk is the risk that a company will not be able to pay its debts, including the interest on itsbonds. Inflation risk is the possibility that the interest paid on an investment in bonds willbe lower than the inflation rate, decreasing purchasing power.
Cash alternatives typically include money market securities and U.S. treasury bills. Investingin such cash alternatives involves inflation risk. In addition, investments in money marketsecurities may involve credit risk and a risk of principal loss. Because money marketsecurities are neither insured nor guaranteed by the Federal Deposit Insurance Corporationor any other government agency, there is no guarantee the value of your investment will bemaintained at $1.00 per share, and your shares, when sold, may be worth more or less thanwhat you originally paid for them. U.S. Treasury bills are subject to market risk if sold priorto maturity. Market risk is the possibility that the value, when sold, might be less than thepurchase price.
Investing in stock securities involves volatility risk, market risk, business risk, and industryrisk. The prices of most stocks fluctuate. Volatility risk is the chance that the value of a stockwill fall. Market risk is chance that the prices of all stocks will fall due to conditions in theeconomic environment. Business risk is the chance that a specific company’s stock will fallbecause of issues affecting it. Industry risk is the chance that a set of factors particular to anindustry group will adversely affect stock prices within the industry. (See “Asset Class –Stocks” in the Glossary section of this Important Disclosure Information for a summary ofthe relative potential volatility of different types of stocks.)
International investing involves additional risks including, but not limited to, changes incurrency exchange rates, differences in accounting and taxation policies, and political oreconomic instabilities that can increase or decrease returns.
Report Is a Snapshot and Does Not Provide Legal, Tax, or Accounting Advice
This Report provides a snapshot of your current financial position and can help you to focuson your financial resources and goals, and to create a plan of action. Because the resultsare calculated over many years, small changes can create large differences in future results.You should use this Report to help you focus on the factors that are most important to you.This Report does not provide legal, tax, or accounting advice. Before making decisions withlegal, tax, or accounting ramifications, you should consult appropriate professionals foradvice that is specific to your situation.
MoneyGuidePro Methodology
MoneyGuidePro offers several methods of calculating results, each of which provides oneoutcome from a wide range of possible outcomes. The methods used are: “AverageReturns,” “Historical Test,” “Bad Timing,” “Class Sensitivity,” and “Monte CarloSimulations.” When using historical returns, the methodologies available are AverageReturns, Historical Test, Bad Timing, and Monte Carlo Simulations. When using projectedreturns, the methodologies available are Average Returns, Bad Timing, Class Sensitivity, andMonte Carlo Simulations.
Results Using Average Returns
The Results Using Average Returns are calculated using one average return for yourpre-retirement period and one average return for your post-retirement period. AverageReturns are a simplifying assumption. In the real world, investment returns can (and oftendo) vary widely from year to year and vary widely from a long-term average return.
Results Using Historical Test
The Results Using Historical Test are calculated by using the actual historical returns andinflation rates, in sequence, from a starting year to the present, and assumes that youwould receive those returns and inflation rates, in sequence, from this year through the endof your Plan. If the historical sequence is shorter than your Plan, the average return for thehistorical period is used for the balance of the Plan. The historical returns used are those ofthe broad-based asset class indices listed in this Important Disclosure Information.
Results with Bad Timing
Results with Bad Timing are calculated by using low returns in one or two years, andaverage returns for all remaining years of the Plan. For most Plans, the worst time for lowreturns is when you begin taking substantial withdrawals from your portfolio. The Resultswith Bad Timing assume that you earn a low return in the year(s) you select and then anAdjusted Average Return in all other years. This Adjusted Average Return is calculated sothat the average return of the Results with Bad Timing is equal to the return(s) used incalculating the Results Using Average Returns. This allows you to compare two results withthe same overall average return, where one (the Results with Bad Timing) has low returns inone or two years.
When using historical returns, the default for one year of low returns is the lowest annualreturn in the historical period you are using, and the default for two years of low returns isthe lowest two-year sequence of returns in the historical period. When using projectedreturns, the default for the first year of low returns is two standard deviations less than theaverage return, and the default for the second year is one standard deviation less than theaverage return.

IMPORTANT DISCLOSURE INFORMATION
01/29/2019
Prepared for : Jim and Anne Sample Company: R. W. Baird Prepared by: Baird Advisor
Page 6 of 68
Results Using Class Sensitivity
The Results Using Class Sensitivity are calculated by using different return assumptions forone or more asset classes during the years you select. These results show how your Planwould be affected if the annual returns for one or more asset classes were different thanthe average returns for a specified period in your Plan.
Results Using Monte Carlo Simulations
Monte Carlo simulations are used to show how variations in rates of return each year canaffect your results. A Monte Carlo simulation calculates the results of your Plan by runningit many times, each time using a different sequence of returns. Some sequences of returnswill give you better results, and some will give you worse results. These multiple trialsprovide a range of possible results, some successful (you would have met all your goals) andsome unsuccessful (you would not have met all your goals). The percentage of trials thatwere successful is the probability that your Plan, with all its underlying assumptions, couldbe successful. In MoneyGuidePro, this is the Probability of Success. Analogously, thepercentage of trials that were unsuccessful is the Probability of Failure. The Results UsingMonte Carlo Simulations indicate the likelihood that an event may occur as well as thelikelihood that it may not occur. In analyzing this information, please note that the analysisdoes not take into account actual market conditions, which may severely affect theoutcome of your goals over the long-term.
MoneyGuidePro Presentation of Results
The Results Using Average Returns, Historical Test, Bad Timing, and Class Sensitivity displaythe results using an “Estimated % of Goal Funded” and a “Safety Margin.”
Estimated % of Goal Funded
For each Goal, the “Estimated % of Goal Funded” is the sum of the assets used to fund theGoal divided by the sum of the Goal’s expenses. All values are in current dollars. A result of100% or more does not guarantee that you will reach a Goal, nor does a result under100% guarantee that you will not. Rather, this information is meant to identify possibleshortfalls in this Plan, and is not a guarantee that a certain percentage of your Goals will befunded. The percentage reflects a projection of the total cost of the Goal that was actuallyfunded based upon all the assumptions that are included in this Plan, and assumes that youexecute all aspects of the Plan as you have indicated.
Safety Margin
The Safety Margin is the estimated value of your assets at the end of this Plan, based on allthe assumptions included in this Report. Only you can determine if that Safety Margin issufficient for your needs.
Bear Market Loss and Bear Market Test
The Bear Market Loss shows how a portfolio would have been impacted during the worstbear market since the Great Depression. Depending on the composition of the portfolio,the worst bear market is either the "Great Recession" or the "Bond Bear Market."
The Great Recession, from November 2007 through February 2009, was the worst bearmarket for stocks since the Great Depression. In MoneyGuidePro, the Great RecessionReturn is the rate of return, during the Great Recession, for a portfolio comprised of cash,bonds, stocks, and alternatives, with an asset mix equivalent to the portfolio referenced.
The Bond Bear Market, from July 1979 through February 1980, was the worst bear marketfor bonds since the Great Depression. In MoneyGuidePro, the Bond Bear Market Return isthe rate of return, for the Bond Bear Market period, for a portfolio comprised of cash,bonds, stocks, and alternatives, with an asset mix equivalent to the portfolio referenced.
The Bear Market Loss shows: 1) either the Great Recession Return or the Bond Bear MarketReturn, whichever is lower, and 2) the potential loss, if you had been invested in thiscash-bond-stock-alternative portfolio during the period with the lower return. In general,most portfolios with a stock allocation of 20% or more have a lower Great RecessionReturn, and most portfolios with a combined cash and bond allocation of 80% or morehave a lower Bond Bear Market Return.
The Bear Market Test, included in the Stress Tests, examines the impact on your Plan resultsif an identical Great Recession or Bond Bear Market, whichever would be worse, occurredthis year. The Bear Market Test shows the likelihood that you could fund your Needs,Wants and Wishes after experiencing such an event.
Regardless of whether you are using historical or projected returns for all otherMoneyGuidePro results, the Bear Market Loss and Bear Market Test use returns calculatedfrom historical indices. If you are using historical returns, the indices in the Bear Market Lossand the Bear Market Test may be different from indices used in other calculations. Theseresults are calculated using only four asset classes – Cash, Bonds, Stocks, and Alternatives.The indices and the resulting returns for the Great Recession and the Bond Bear Market are:

IMPORTANT DISCLOSURE INFORMATION
01/29/2019
Prepared for : Jim and Anne Sample Company: R. W. Baird Prepared by: Baird Advisor
Page 7 of 68
Because the Bear Market Loss and Bear Market Test use the returns from asset class indicesrather than the returns of actual investments, they do not represent the performance forany specific portfolio, and are not a guarantee of minimum or maximum levels of losses orgains for any portfolio. The actual performance of your portfolio may differ substantiallyfrom those shown in the Great Recession Return, the Bond Bear Market Return, the BearMarket Loss, and the Bear Market Test.
Asset Class Index Great RecessionReturn
11/2007 – 02/2009
Bond Bear MarketReturn
07/1979 – 02/1980
Cash Ibbotson U.S. 30-dayTreasury Bills
2.31% 7.08%
Bond Ibbotson Intermediate-TermGovernment Bonds – TotalReturn
15.61% -8.89%
Stock S&P 500 - Total Return -50.95% 14.61%
Alternative HFRI FOF: Diversified*S&P GSCI Commodity - TotalReturn**
-19.87%N/A
N/A23.21%
*Hedge Fund Research Indices Fund of Funds
**S&P GSCI was formerly the Goldman Sachs Commodity Index
MoneyGuidePro Risk Assessment
The MoneyGuidePro Risk Assessment highlights some – but not all – of the trade-offs youmight consider when deciding how to invest your money. This approach does not provide acomprehensive, psychometrically-based, or scientifically-validated profile of your risktolerance, loss tolerance, or risk capacity, and is provided for informational purposes only.
Based on your specific circumstances, you must decide the appropriate balance betweenpotential risks and potential returns. MoneyGuidePro does not and cannot adequatelyunderstand or assess the appropriate risk/return balance for you. MoneyGuidePro requiresyou to select a risk score. Once selected, three important pieces of information are availableto help you determine the appropriateness of your score: an appropriate portfolio for yourscore, the impact of a Bear Market Loss (either the Great Recession or the Bond BearMarket, whichever is lower) on this portfolio, and a compare button to show how yourscore compares to the risk score of others in your age group.
MoneyGuidePro uses your risk score to select a risk-based portfolio on the Portfolio Tablepage. This risk-based portfolio selection is provided for informational purposes only, andyou should consider it to be a starting point for conversations with your advisor. It is yourresponsibility to select the Target Portfolio you want MoneyGuidePro to use. The selectionof your Target Portfolio, and other investment decisions, should be made by you, afterdiscussions with your advisor and, if needed, other financial and/or legal professionals.

Summary of Goals and Resources

Personal Information and Summary of Financial Goals
01/29/2019
Prepared for : Jim and Anne Sample Company: R. W. Baird Prepared by: Baird Advisor
Page 8 of 68
See Important Disclosure Information section in this Report for explanations of assumptions, limitations, methodologies, and a glossary.
Jim and Anne Sample
Needs
Retirement - Living Expense10
Jim (2021)Anne (2021)Both Retired (2021-2050)Anne Alone Retired (2051-2051)
6665$425,000$365,000Base Inflation Rate (3.00%)
Health Care10
Both Medicare (2021-2050)Anne Alone Medicare (2051)
$17,177$9,921Base Inflation Rate plus 2.00% (5.00%)
Wants
College - Daughter7
4 years starting in 2021Attending College - Private (4 years)
$50,900Base Inflation Rate plus 2.00% (5.00%)
New Vehicle7
In 2017Recurring every 5 years for a total of 8 times
$40,000No Inflation
Vacation Home5
In 2020 $1,000,000Base Inflation Rate (3.00%)

Personal Information and Summary of Financial Goals
01/29/2019
Prepared for : Jim and Anne Sample Company: R. W. Baird Prepared by: Baird Advisor
Page 9 of 68
See Important Disclosure Information section in this Report for explanations of assumptions, limitations, methodologies, and a glossary.
Jim and Anne Sample
Wishes
Charitable Gifts3
In 2016Recurring every year until end of plan
$25,000No Inflation
Annual Exclusion Gifts to Brian3
In 2016Recurring every year until end of plan
$14,000Base Inflation Rate (3.00%)
Personal Information
Jim
Male - born 08/29/1955, age 63
Anne
Female - born 05/27/1956, age 62
Married, US Citizens living in WI
Employed - $400,000
Employed - $200,000
• This section lists the Personal and Financial Goal information you provided, which willbe used to create your Report. It is important that it is accurate and complete.
Participant Name Date of Birth Age Relationship
Brian 05/27/1973 45 Child
Emma 01/01/2003 16 Child
Charity Charity
Worksheet Detail - Health Care Expense Schedule
01/29/2019
Prepared for : Jim and Anne Sample Company: R. W. Baird Prepared by: Baird Advisor
Page 10 of 68
See Important Disclosure Information section in this Report for explanations of assumptions, limitations, methodologies, and a glossary.
Year Age/EventPrivate
InsurancePrior to
Medicare
Out-of-PocketPrior to
Medicare
MedicarePart B
MedicarePart D
MedigapPolicy
Out-of-PocketDuring
Medicare
Jim'sTotal
Jim
AnnualTotal
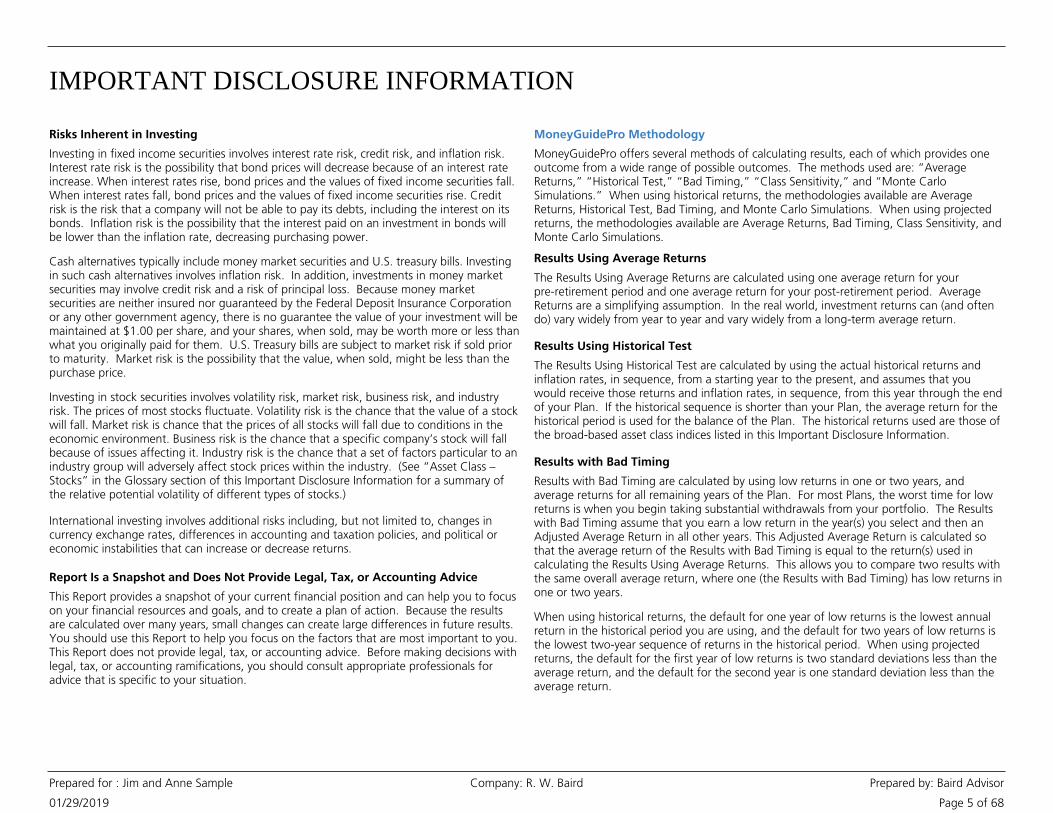
2021 Both retire andstart Medicare
$0 $0 $5,670 $632 $1,355 $1,897 $9,554 $18,938
2022 67/66 $0 $0 $5,954 $663 $1,469 $2,012 $10,098 $20,003
2023 68/67 $0 $0 $6,251 $697 $1,602 $2,133 $10,683 $21,150
2024 69/68 $0 $0 $6,564 $731 $1,753 $2,262 $11,310 $22,382
2025 70/69 $0 $0 $6,892 $768 $1,921 $2,399 $11,980 $23,700
2026 71/70 $0 $0 $7,237 $806 $2,106 $2,544 $12,693 $25,104
2027 72/71 $0 $0 $7,599 $847 $2,305 $2,698 $13,448 $26,596
2028 73/72 $0 $0 $7,978 $889 $2,519 $2,838 $14,225 $28,152
2029 74/73 $0 $0 $8,377 $933 $2,749 $2,984 $15,044 $29,776
2030 75/74 $0 $0 $8,796 $980 $2,995 $3,139 $15,910 $31,491
2031 76/75 $0 $0 $9,236 $1,029 $3,258 $3,302 $16,825 $33,302
2032 77/76 $0 $0 $9,698 $1,081 $3,537 $3,472 $17,788 $35,213
2033 78/77 $0 $0 $10,183 $1,135 $3,833 $3,632 $18,783 $37,205
2034 79/78 $0 $0 $10,692 $1,191 $4,146 $3,799 $19,829 $39,286
Scenario : Current Scenario

Worksheet Detail - Health Care Expense Schedule
01/29/2019
Prepared for : Jim and Anne Sample Company: R. W. Baird Prepared by: Baird Advisor
Page 11 of 68
See Important Disclosure Information section in this Report for explanations of assumptions, limitations, methodologies, and a glossary.
Year Age/EventPrivate
InsurancePrior to
Medicare
Out-of-PocketPrior to
Medicare
MedicarePart B
MedicarePart D
MedigapPolicy
Out-of-PocketDuring
Medicare
Jim'sTotal
Jim
AnnualTotal
2035 80/79 $0 $0 $11,227 $1,251 $4,481 $3,974 $20,932 $41,478
2036 81/80 $0 $0 $11,788 $1,313 $4,836 $4,157 $22,095 $43,788
2037 82/81 $0 $0 $12,377 $1,379 $5,213 $4,349 $23,318 $46,221
2038 83/82 $0 $0 $12,996 $1,448 $5,613 $4,516 $24,572 $48,748
2039 84/83 $0 $0 $13,646 $1,521 $6,037 $4,689 $25,893 $51,362
2040 85/84 $0 $0 $14,328 $1,597 $6,493 $4,870 $27,287 $54,118
2041 86/85 $0 $0 $15,045 $1,676 $6,982 $5,057 $28,760 $57,028
2042 87/86 $0 $0 $15,797 $1,760 $7,503 $5,252 $30,311 $60,098
2043 88/87 $0 $0 $16,587 $1,848 $8,049 $5,454 $31,938 $63,325
2044 89/88 $0 $0 $17,416 $1,941 $8,610 $5,664 $33,630 $66,694
2045 90/89 $0 $0 $18,287 $2,038 $9,174 $5,947 $35,445 $70,254
2046 91/90 $0 $0 $19,201 $2,140 $9,744 $6,244 $37,329 $74,019
2047 92/91 $0 $0 $20,161 $2,247 $10,326 $6,556 $39,290 $77,931
2048 93/92 $0 $0 $21,169 $2,359 $10,923 $6,884 $41,336 $82,008
2049 94/93 $0 $0 $22,228 $2,477 $11,528 $7,229 $43,461 $86,253
2050 Jim's plan ends $0 $0 $23,339 $2,601 $12,133 $7,590 $45,663 $90,655
2051 Anne's plan ends $0 $0 $0 $0 $0 $0 $0 $47,272
$709,431Total Lifetime Cost ofHealth Care
Year Age/EventPrivate
InsurancePrior to
Medicare
Out-of-PocketPrior to
Medicare
MedicarePart B
MedicarePart D
MedigapPolicy
Out-of-PocketDuring
Medicare
Anne'sTotal
Anne
AnnualTotal
2021 Both retire andstart Medicare
$0 $0 $5,670 $632 $1,321 $1,761 $9,384 $18,938
Scenario : Current Scenario

Worksheet Detail - Health Care Expense Schedule
01/29/2019
Prepared for : Jim and Anne Sample Company: R. W. Baird Prepared by: Baird Advisor
Page 12 of 68
See Important Disclosure Information section in this Report for explanations of assumptions, limitations, methodologies, and a glossary.
Scenario : Current Scenario
Year Age/EventPrivate
InsurancePrior to
Medicare
Out-of-PocketPrior to
Medicare
MedicarePart B
MedicarePart D
MedigapPolicy
Out-of-PocketDuring
Medicare
Anne'sTotal
Anne
AnnualTotal
start Medicare $0 $0 $5,670 $632 $1,321 $1,761 $9,384 $18,938
2022 67/66 $0 $0 $5,954 $663 $1,422 $1,866 $9,905 $20,003
2023 68/67 $0 $0 $6,251 $697 $1,542 $1,977 $10,467 $21,150
2024 69/68 $0 $0 $6,564 $731 $1,682 $2,094 $11,071 $22,382
2025 70/69 $0 $0 $6,892 $768 $1,840 $2,219 $11,719 $23,700
2026 71/70 $0 $0 $7,237 $806 $2,017 $2,351 $12,411 $25,104
2027 72/71 $0 $0 $7,599 $847 $2,211 $2,491 $13,147 $26,596
2028 73/72 $0 $0 $7,978 $889 $2,421 $2,639 $13,927 $28,152
2029 74/73 $0 $0 $8,377 $933 $2,645 $2,775 $14,731 $29,776
2030 75/74 $0 $0 $8,796 $980 $2,887 $2,918 $15,580 $31,491
2031 76/75 $0 $0 $9,236 $1,029 $3,145 $3,068 $16,478 $33,302
2032 77/76 $0 $0 $9,698 $1,081 $3,421 $3,225 $17,424 $35,213
2033 78/77 $0 $0 $10,183 $1,135 $3,714 $3,391 $18,423 $37,205
2034 79/78 $0 $0 $10,692 $1,191 $4,024 $3,549 $19,457 $39,286
2035 80/79 $0 $0 $11,227 $1,251 $4,354 $3,714 $20,546 $41,478
2036 81/80 $0 $0 $11,788 $1,313 $4,705 $3,887 $21,693 $43,788
2037 82/81 $0 $0 $12,377 $1,379 $5,078 $4,068 $22,902 $46,221
2038 83/82 $0 $0 $12,996 $1,448 $5,474 $4,258 $24,176 $48,748
2039 84/83 $0 $0 $13,646 $1,521 $5,893 $4,410 $25,469 $51,362
2040 85/84 $0 $0 $14,328 $1,597 $6,339 $4,567 $26,831 $54,118
2041 86/85 $0 $0 $15,045 $1,676 $6,818 $4,730 $28,269 $57,028
2042 87/86 $0 $0 $15,797 $1,760 $7,331 $4,899 $29,787 $60,098
2043 88/87 $0 $0 $16,587 $1,848 $7,878 $5,074 $31,387 $63,325
2044 89/88 $0 $0 $17,416 $1,941 $8,452 $5,256 $33,064 $66,694

Worksheet Detail - Health Care Expense Schedule
01/29/2019
Prepared for : Jim and Anne Sample Company: R. W. Baird Prepared by: Baird Advisor
Page 13 of 68
See Important Disclosure Information section in this Report for explanations of assumptions, limitations, methodologies, and a glossary.
Year Age/EventPrivate
InsurancePrior to
Medicare
Out-of-PocketPrior to
Medicare
MedicarePart B
MedicarePart D
MedigapPolicy
Out-of-PocketDuring
Medicare
Anne'sTotal
Anne
AnnualTotal
2045 90/89 $0 $0 $18,287 $2,038 $9,040 $5,444 $34,809 $70,254
2046 91/90 $0 $0 $19,201 $2,140 $9,633 $5,717 $36,690 $74,019
2047 92/91 $0 $0 $20,161 $2,247 $10,231 $6,003 $38,641 $77,931
2048 93/92 $0 $0 $21,169 $2,359 $10,842 $6,303 $40,673 $82,008
2049 94/93 $0 $0 $22,228 $2,477 $11,470 $6,618 $42,792 $86,253
2050 Jim's plan ends $0 $0 $23,339 $2,601 $12,104 $6,949 $44,992 $90,655
2051 Anne's plan ends $0 $0 $24,506 $2,731 $12,740 $7,296 $47,272 $47,272
$744,119Total Lifetime Cost ofHealth Care
• Program assumptions:
• The scenario assumes that client and co-client will each use a combination of Medicare PartA (Hospital Insurance), Part B (Medical Insurance), Part D (Prescription Drug Insurance),Medigap insurance , and Out-of Pocket expenses. Alternatively, Medicare Advantage may beselected instead of Medigap and a Part D plan. The program uses initial default values thatmay have been adjusted based on your preferences and information provided by you.
Notes
• The scenario assumes that client and co-client each qualify to receive Medicare Part A at nocharge and therefore it is not reflected in the Health Care Expense schedule.
• Medicare and Medigap costs begin at the later of age 65, your retirement age, or thecurrent year.
• All costs are in future dollars.
• Costs associated with Long Term Care needs are not addressed by this goal. A separate LTCgoal can be created.
• General Information regarding Medicare:
• Part B premiums are uniform nationally and are increased for those with a higher ModifiedAdjusted Gross Income.
• Part D coverage is optional. Premiums are increased for those with a higher ModifiedAdjusted Gross Income, differ from state to state, and vary based on the specific plan andlevel of benefit selected.
• Medigap coverage is optional and policies (Plans A-N) are issued by private insurers.
• Clients may incur out-of-pocket healthcare expenses, for costs not covered by Medicarebenefits and Medigap insurance.
• If clients retire before age 65, they may choose to purchase private health insurance or toself-insure. Costs and coverage for private health insurance varies greatly.
Scenario : Current Scenario

Net Worth Summary - All Resources
01/29/2019
Prepared for : Jim and Anne Sample Company: R. W. Baird Prepared by: Baird Advisor
Page 14 of 68
See Important Disclosure Information section in this Report for explanations of assumptions, limitations, methodologies, and a glossary.
This is your Net Worth Summary as of 01/29/2019. Your Net Worth is the difference between what you own (your Assets) and what youowe (your Liabilities). To get an accurate Net Worth statement, make certain all of your Assets and Liabilities are entered.
+ $12,549,700Other Assets
Investment Assets $9,254,297
Total Liabilities $150,000
Net Worth $21,653,997
$21,803,997Total Assets
-
Description Total
Investment Assets
Employer Retirement Plans $2,850,000
Individual Retirement Accounts $799,297
Annuities & Tax-Deferred Products $130,000
Taxable and/or Tax-Free Accounts $5,475,000
Total Investment Assets: $9,254,297
Other Assets
Home and Personal Assets $1,750,000
Business and Property $10,000,000
Pension and Deferred Compensation $500,000
Cash Value Life $250,000
Stock Options $49,700
Total Other Assets: $12,549,700
Liabilities
Personal Real Estate Loan: $150,000
Total Liabilities: $150,000
Net Worth: $21,653,997

Net Worth Detail - All Resources
01/29/2019
Prepared for : Jim and Anne Sample Company: R. W. Baird Prepared by: Baird Advisor
Page 15 of 68
See Important Disclosure Information section in this Report for explanations of assumptions, limitations, methodologies, and a glossary.
This is your Net Worth Detail as of 01/29/2019. Your Net Worth is the difference between what you own (your Assets) and what you owe(your Liabilities). To get an accurate Net Worth statement, make certain all of your Assets and Liabilities are entered.
Description TotalJointAnneJim
Investment Assets
Employer Retirement Plans
401(k) $0
Jim's 401(k) $2,850,000$2,850,000
Individual Retirement Accounts
Anne's Baird IRA $480,000$480,000
Jim's Baird IRA $319,297$319,297
Annuities & Tax-Deferred Products
Variable Annuity with GMWB $130,000$130,000
Taxable and/or Tax-Free Accounts
Jim's Baird Account $1,500,000$1,500,000
Jim's Investment Account $3,000,000$3,000,000
Joint Cash & Bank Accounts $300,000$300,000
Joint Mutual Fund Account $675,000$675,000
Total Investment Assets: $9,254,297$7,799,297 $480,000 $975,000
Other Assets
Home and Personal Assets
AIG 10-Year Fixed Annuity $100,000$100,000
Home $650,000$650,000
Lake Home $1,000,000$1,000,000
Business and Property
Business $10,000,000$10,000,000
Pension and Deferred Compensation
Deferred Compensation $500,000$500,000

Net Worth Detail - All Resources
01/29/2019
Prepared for : Jim and Anne Sample Company: R. W. Baird Prepared by: Baird Advisor
Page 16 of 68
See Important Disclosure Information section in this Report for explanations of assumptions, limitations, methodologies, and a glossary.
Description TotalJointAnneJim
Other Assets
Cash Value Life
Second to Die Policy $250,000$250,000
Stock Options
APPLE INC $49,700$49,700
Total Other Assets: $12,549,700$10,799,700 $0 $1,750,000
Liabilities
Personal Real Estate Loan:
Mortgage $150,000$150,000
Total Liabilities: $150,000$0 $0 $150,000
Net Worth: $21,653,997

Resources Summary
01/29/2019
Prepared for : Jim and Anne Sample Company: R. W. Baird Prepared by: Baird Advisor
Page 17 of 68
See Important Disclosure Information section in this Report for explanations of assumptions, limitations, methodologies, and a glossary.
Description Owner Current Value
Investment Assets
Additions Assign to Goal
Manually Entered
Jim401(k) Fund All Goals
AnneAnne's Baird IRA $480,000 Fund All Goals
JimJim's 401(k) $2,850,000 $25,000 Fund All Goals
JimJim's Baird Account $1,500,000 Fund All Goals
JimJim's Baird IRA $319,297 Fund All Goals
JimJim's Investment Account $3,000,000 $50,000 Fund All Goals
Joint SurvivorshipJoint Cash & Bank Accounts $300,000 Fund All Goals
Joint SurvivorshipJoint Mutual Fund Account $675,000 Fund All Goals
JimVariable Annuity with GMWB $130,000 Fund All Goals
$9,254,297Total Investment Assets :
Description Owner Scenario Year Assign to Goal
Stock Options
Amount
- See the Stock Options Summary for Scenario Detail.
Manually Entered
APPLE INC (AAPL) Jim 2019 $49,700
Description Owner Current Value Future Value Assign to Goal
Other Assets
Manually Entered
Business Jim $10,000,000 $10,000,000 Fund All Goals
Home Joint Survivorship $650,000 Not Funding Goals
Lake Home Joint Survivorship $1,000,000 Not Funding Goals
Deferred Compensation Jim $500,000 $140,376 for 5 years Fund All Goals
Second to Die Policy Jim $250,000 Not Funding Goals
AIG 10-Year Fixed Annuity Joint Survivorship $100,000 $130,000 Fund All Goals
$12,500,000Total of Other Assets :

Resources Summary
01/29/2019
Prepared for : Jim and Anne Sample Company: R. W. Baird Prepared by: Baird Advisor
Page 18 of 68
See Important Disclosure Information section in this Report for explanations of assumptions, limitations, methodologies, and a glossary.
Annual Premium Cash ValueDescription Owner BeneficiaryInsured Death Benefit Premium Paid
Insurance Policies
Manually Entered
Cash Value Life Insurance Policies Summary (included in Assets)
$15,000 $250,000Second to Die Policy Whole Life
Jim Co-Client of Insured- 100%
Second to Die $5,000,000 Until Insured Dies
Insurance Policies Summary (not included in Assets)
Term Policy Term Life
Anne Co-Client of Insured- 100%
Anne $100,000 Until Policy Terminates
$5,100,000Total Death Benefit of All Policies :
Social Security
Description Value Assign to Goal
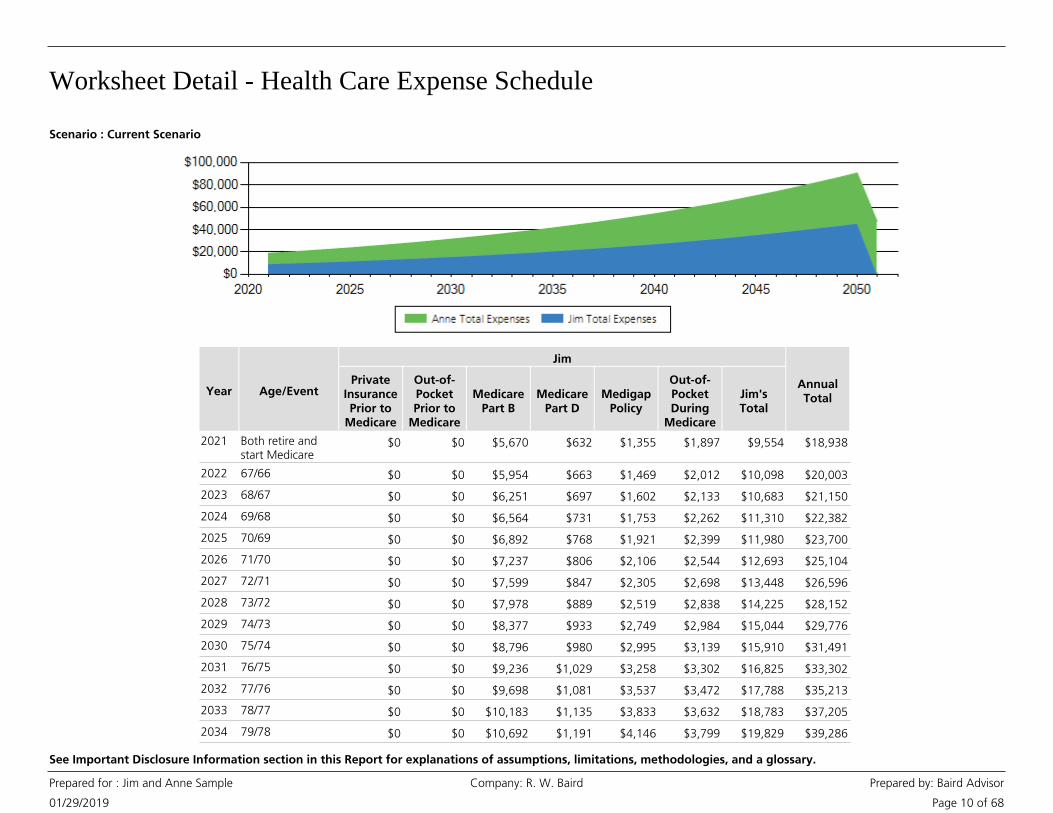
Social Security Jim will file a normal application at age 66 Years, 2 Months.He will receive $30,588 in retirement benefits at age 66.
Fund All Goals
Social Security Anne will file a normal application at age 65.She will receive $24,294 in retirement benefits at age 65.
Fund All Goals
Retirement Income
Description Value Assign to GoalOwner Inflate?
Pension Jim $155,000 from Jim'sRetirement to End of Jim'sPlan
Fund All GoalsNo
Pension Anne $4,000 from Anne'sRetirement to End of Anne'sPlan
Fund All GoalsNo
Type Outstanding BalanceDescription Owner
Liabilities
Interest Rate Monthly Payment
Manually Entered
Total Amount Mortgage $150,000Joint $1,000
$150,000Total Outstanding Balance :

Tax and Inflation Assumptions
01/29/2019
Prepared for : Jim and Anne Sample Company: R. W. Baird Prepared by: Baird Advisor
Page 19 of 68
See Important Disclosure Information section in this Report for explanations of assumptions, limitations, methodologies, and a glossary.
Base Inflation Rate
Inflation rate : 3.00%
Social Security Inflation rate : 2.00%
Tax Assumption Inflation rate : 3.00%
Tax Rates : 35.00%
Federal
7.65%
State
0.00%
Local
Marginal Tax Rates Before Retirement
Untaxed Gain on Taxable Earnings - Before Retirement
What portion of your Annual Taxable InvestmentEarnings will not be taxed until withdrawn?
0.00%
What portion of your Taxable Investment Earningswill be taxed at the LTCG rate?
20.00%
Long Term Capital Gains rate : 20.00%
Long Term Capital Gains (LTCG) - Before Retirement
Tax Rates During Retirement
Local rate : 0.00%
Deduction estimate : Use standard deductions
Let the Program calculate taxes each year
0.00%
Untaxed Gain on Taxable Earnings - During Retirement
What portion of your Annual Taxable InvestmentEarnings will not be taxed until withdrawn?
Long Term Capital Gains (LTCG) - During Retirement
What portion of your Taxable Investment Earningswill be taxed at the LTCG rate?
20.00%
Long Term Capital Gains rate : Use Program estimate
Taxation of Social Security
What portion of Social Security will be taxed? 85.00%
Tax Penalty
Include penalties in Plan? : Yes
Treat Tax-Free Assets as Tax-Free
Tax Free Earnings - Options

Model Portfolio Table
01/29/2019
Prepared for : Jim and Anne Sample Company: R. W. Baird Prepared by: Baird Advisor
Page 20 of 68
See Important Disclosure Information section in this Report for explanations of assumptions, limitations, methodologies, and a glossary.
The Risk-Based Portfolio was selected from this list of Portfolios, based upon the risk assessment. The Risk Band is comprised of theportfolio(s) that could be appropriate for you, based upon the Risk-Based Portfolio indicated. The Target Portfolio was selected by you.Refer to the Standard Deviation column in the chart below to compare the relative risk of your Current Portfolio to the Target Portfolio.
Portfolios Name Cash Bond Stock Alternative UnclassifiedProjected
ReturnStandardDeviation
Capital Preservation 20% 80% 0% 0% 0% 1.80% 2.76%
Conservative Income 15% 65% 20% 0% 0% 2.91% 3.70%
Income with Growth 10% 50% 40% 0% 0% 4.40% 6.81%
Current 8% 35% 57% 0% 0% 5.07% 9.41%
Growth with Income 5% 35% 60% 0% 0% 5.62% 9.89%
Capital Growth 3% 17% 80% 0% 0% 6.73% 12.94%
All Growth 3% 0% 97% 0% 0% 7.63% 15.57%
Risk Band Current Risk-Based Target
Return vs. Risk Graph
This graph shows the relationship of return and risk for each Portfolio in the chart above.
When deciding how to invest your money, you must determine the amount of risk you arewilling to assume to pursue a desired return. The Return versus Risk Graph reflects a set ofportfolios that assume a low relative level of risk for each level of return, or conversely anoptimal return for the degree of investment risk taken. The graph also shows the position ofthe Risk Band, Target, Risk-Based, and Custom Portfolios. The positioning of these portfoliosillustrates how their respective risks and returns compare to each other as well as theoptimized level of risk and return represented by the Portfolios.

Worksheet Detail - Allocation Comparison
01/29/2019
Prepared for : Jim and Anne Sample Company: R. W. Baird Prepared by: Baird Advisor
Page 21 of 68
See Important Disclosure Information section in this Report for explanations of assumptions, limitations, methodologies, and a glossary.
Current Portfolio
These charts compare your Current Portfolio with the Composite Portfolio you selected and show changes associated with investmentstrategies (if applicable) and allocation changes you should consider.
Composite PortfolioGrowth with IncomeProjected Returns
5.07% Total Return 5.61%
3.00% Base Inflation Rate 3.00%
2.07% Real Return 2.61%
9.41% Standard Deviation 9.86%
Bear Market Returns
-24% Great Recession -25%
6% Bond Bear Market 6%
Asset Class % of Total Composite AmountCurrent Amount % of Total
Portfolio Comparison with Allocation Changes
Increase / Decrease
Large Cap Core 0% $020%$1,859,136 -$1,859,136
Large Cap Growth 15% $1,349,41821%$1,937,808 -$588,390
Large Cap Value 15% $1,349,4181%$48,960 $1,300,458
Mid Cap Core 10% $899,6120%$34,587 $865,025
Small Cap Core 4% $359,8452%$150,000 $209,845
Small Cap Growth 0% $06%$600,000 -$600,000
International Equity 14% $1,259,4577%$603,585 $655,872
Emerging Markets Equity 2% $179,9220%$9,650 $170,273
Broad Equity 1% $64,0871%$65,000 -$913
Commodities 0% $00%$9,434 -$9,434
Short Term Taxable 10% $899,61215%$1,415,452 -$515,840
Intermediate Term Taxable 20% $1,799,2252%$180,895 $1,618,330
Short Term Tax-Exempt 0% $012%$1,125,000 -$1,125,000
Intermediate Term Tax-Exempt 0% $02%$225,000 -$225,000
Scenario : Baird Model

Worksheet Detail - Allocation Comparison
01/29/2019
Prepared for : Jim and Anne Sample Company: R. W. Baird Prepared by: Baird Advisor
Page 22 of 68
See Important Disclosure Information section in this Report for explanations of assumptions, limitations, methodologies, and a glossary.
Asset Class % of Total Composite AmountCurrent Amount % of Total
Portfolio Comparison with Allocation Changes
Increase / Decrease
High Yield Fixed Income 5% $449,8062%$155,214 $294,592
Global Fixed Income 0% $00%$5,214 -$5,214
Broad Fixed Income 1% $64,0871%$92,629 -$28,542
Cash 5% $449,8068%$736,732 -$286,926
$9,254,297 $9,124,297 -$130,000
Changes to the Investable Assets Target ValueCurrent Value
Total Investment Portfolio $9,124,297$9,124,297
Effect of Investment Strategies
Current GMWB Investment Strategies $130,000$130,000
$9,254,297Total Investment Assets$9,254,297
Scenario : Baird Model

Employer Stock Plans

Stock Options
01/29/2019
Prepared for : Jim and Anne Sample Company: R. W. Baird Prepared by: Baird Advisor
Page 23 of 68
See Important Disclosure Information section in this Report for explanations of assumptions, limitations, methodologies, and a glossary.
- Beginning in the exercise start year, vested options thatequal or exceed the minimum percentage gain are exercised. After the exercise start year,remaining options are exercised in the year they expire if they are in-the-money by anyamount.
- Currently vested options that are in-the-money by any amountare exercised now; all remaining options are lost.
- Currently vested options that equal or exceed the minimumpercentage gain are exercised now. Remaining options are either exercised in the first yearthey are both vested and exceed the minimum percentage gain or are exercised in the yearthey expire if they are in-the-money by any amount.
- Currently vested options that equal or exceed the minimumpercentage gain are exercised now. All remaining options are exercised in the year theyexpire if they are in-the-money by any amount.
- Beginning in the exercise start year, vested options that equalor exceed the minimum percentage gain are exercised. After the exercise start year,remaining options are either exercised in the first year they are both vested and exceed theminimum percentage gain or are exercised in the year they expire if they are in-the-moneyby any amount.
- One advantage of an ISO is that no regular income tax isrecognized upon exercising the option. In addition, if the acquired stock is held for twoyears from the date of grant and one year from the date of exercise, favorable long-termcapital gains rates will apply to all of the appreciation (between the strike price and saleprice) upon the subsequent sale of the stock. The sale of any shares prior to satisfyingeither of these holding period requirements will be treated as a "disqualifying disposition".If the acquired stock is not held for one year from exercise, the bargain element (thedifference between the value of the stock on exercise and the strike price, also referred toas "spread") is treated as ordinary income and any post-exercise gain is short-term capitalgain. If the stock is held for one year from exercise but not two years from grant, thebargain element (or spread) is ordinary income and any post-exercise gain is long-termcapital gain.
Introduction to Your Stock Options Although the exercise of an ISO is generally not a taxable event for regular tax purposes,the difference between the strike price and the stock price on the date of exercise isconsidered a preference item for federal, and possibly state, alternative minimum tax(AMT) purposes. Depending on the circumstances, the exercise of ISOs can cause ataxpayer to be subject to the AMT and incur a higher tax liability even though shares havenot yet been sold and gains have yet to be realized.
Stock Options Scenarios
Available Timing Methods
• Now - All Vested Only
This section of your report summarizes your Stock Option plan and calculates your currentoption equity value for all fully vested shares. It also calculates an estimate of the potentialfuture option equity values, that may be available to help fund your goals each year basedupon the assumptions you have made.
We believe this information is an important step in a financial goal plan. We look forwardto helping you make informed decisions regarding your stock option strategy.
This Report is for your information only and does not constitute the solicitation to purchaseor sell any specific security.
General Discussion
Your stock options can be a significant component of your financial portfolio. Stock optionscan give you the opportunity to benefit from the potential appreciation in your company'sstock. As with any other investments, there are certain risks associated with stock optionswhich you should take into consideration. Therefore, it is critical that you are familiar withyour stock options, how they function, and the financial implications they may have on youroverall portfolio. Stock options provide employees with the right to buy company stock at aspecified price, known as the strike price, within a certain period of time. A company cangrant two types of stock options - incentive stock options (ISOs) and non-qualified stockoptions (NQOs).
Incentive Stock Options (ISOs)
Nonqualified Stock Options (NQOs) - Unlike ISOs, the spread on NQOs is immediatelyrecognized as compensation income upon exercise, for regular tax purposes, and istherefore subject to federal, and possibly state income tax, as well as Medicare and FICAtax. If the stock is held after exercise, any subsequent appreciation is treated as capitalgain (long-term, if held for more than one year) when the stock is sold.
The future potential after-tax option equity cash flows illustrated in this analysis, for eachexercise scenario, were calculated based on selecting one or more Timing Methods andcertain assumptions described below:
All scenarios assume a cashless exercise strategy.
• Now and As Vested
• Now and At Expiration
• Start Year and As Vested
• Start Year and At Expiration
- Options are exercised in the year they expire if they are in-the-money byany amount.
• At Expiration

Stock Options
01/29/2019
Prepared for : Jim and Anne Sample Company: R. W. Baird Prepared by: Baird Advisor
Page 24 of 68
See Important Disclosure Information section in this Report for explanations of assumptions, limitations, methodologies, and a glossary.
- The projected return for the asset class categoryselected, unless otherwise indicated by you. If a Stock Option Plan with Scenarios is treatedas a Special Asset, the return assumption for this stock includes three growth rates --labeled Low, Expected and High returns. The Program default for all three returns is theprojected return for the asset class category selected, and can be changed by you. Thisapproach can help illustrate financial risk not otherwise reflected in the Plan results.
Other Assumptions
• Return assumption for this Stock
- A year in which it is assumed that vesting ends prematurely.All remaining unvested options are lost.
- The minimum percentage gain in the stock priceabove the exercise price that is required before exercising options. Applying this minimumdefers the exercise of options with only relatively small spread between the stock price andthe option price.
• Minimum percentage gain to exercise
• Vesting Termination Year
- A year in which it is expected that you will begin to exercise vestedoptions, if different than the current year.
• Exercise Start Year
- If it is indicated that ISO shares are not to be "Held for OneYear", then it is assumed that the ISO shares are disqualified and a Regular Tax Rate isapplied. If it is indicated that ISO shares are to be "Held for One Year", it is assumed thatthose shares will have been held for at least two years from the date of grant and over oneyear from the date of exercise, thus qualifying for long-term capital gains treatment and theLong-Term Tax Rate is applied.
• Hold ISO for One Year
General Assumptions
• The Long-Term Tax Rate is the estimated tax rate applied to the potential option equity onany ISO shares sold that were held for more than one year after exercise (as well as twoyears from date of grant). This rate should be the total estimate for all applicable taxes,including Federal, State, and Local Income taxes.
• The possible impact of the Alternative Minimum Tax (AMT) is not reflected in anycalculations. Since the exercise of ISOs can have substantial AMT consequences, you shouldconsult with your personal tax advisor.
• The Regular Tax Rate is the estimated tax rate applied to the potential option equity on allNQOs exercised and sold and on any ISO shares sold that were not held for one year. Thisrate should be the total estimate for all applicable taxes, including Federal, State, and LocalIncome taxes. Unless included in this rate, Medicare and FICA taxes are not appliedseparately to NQO equity.
• The after-tax calculations within the Option Equity Schedule and Price Sensitivity Analysisassume that all ISOs are disqualified and the Regular Tax Rate is applied. In addition, theVesting Schedule does not calculate whether ISO grants meet the $100,000 limitation.
• Exercise costs for NQOs and ISOs have not been considered nor have any dividends thatmight have been received from ISOs that are exercised and held for one year.
• Grants expected to be received in the future are not represented in this Stock OptionSummary.
Cash Receipt Schedule
The future potential after-tax option equity cash flows illustrated in this analysis, for eachCash Receipt Schedule, are the amounts you entered, based on your own calculations.
Assumptions
• The Current Value should represent the current value of all vested stock options in thisStock Option Plan.
• The Value if the Owner dies today should represent the value to be paid by the StockOption Plan if the owner dies today.
• The Cash Receipts Table shows expected after-tax amounts for one or more years in thefuture, based on your own calculations and as entered by you.
• If a Stock Option Plan with a Cash Receipt Schedule is treated as a Special Asset, the CashReceipts Table shows the Low, Expected, and High after-tax amounts for each year in thefuture, based on your own calculation and as entered by you. This approach can helpillustrate financial risk not otherwise reflected in the Plan results.
• The possible impact of the Alternative Minimum Tax (AMT) and any other cost and taxesassociated with exercising Stock Options are not reflected in any calculations, unless itsimpact was taken into account, by you, when entering the cash receipt amounts.

Stock Options Summary
01/29/2019
Prepared for : Jim and Anne Sample Company: R. W. Baird Prepared by: Baird Advisor
Page 25 of 68
See Important Disclosure Information section in this Report for explanations of assumptions, limitations, methodologies, and a glossary.
APPLE INC (AAPL)
Owner : Jim
Options
Granted :
Exercised :
Outstanding Options
Vested :
Not Vested :
2,000
0
2,000
0
Regular Tax Rate : 50.0%
Long-Term Tax Rate : 23.8%
Assumptions
Option Equity After Tax : $24,850
Market Price* :
Options Vest at Death :
$109.85 on 04/15/2016
No
Asset Class : Large Cap Core
* Security prices included in the stock option analysis are based on the market price that you entered for the date referenced and are included onlybecause the system requires it for analysis purposes. This Report is for your information only and does not constitute the solicitation to purchase orsell any specific security and you should not rely on the information presented when making an investment or liquidation decision. We make nowarranty with respect to any security price and do not guarantee that the price listed will be available to you should you choose to exercise youroptions. The actual price available to you should you choose to exercise your options may be more or less than indicated on the report.
Special Asset : No
Vesting Schedule
The Vesting Schedule below is a summary showing the percentage of each option grant that becomes exercisable over time according to theinformation you have provided.
Name % Vested by Year
1 2 3 4 5 6 7 8 9 10
3-Year Vest 33% 33% 34% 0% 0% 0% 0% 0% 0% 0%

Stock Options Summary
01/29/2019
Prepared for : Jim and Anne Sample Company: R. W. Baird Prepared by: Baird Advisor
Page 26 of 68
See Important Disclosure Information section in this Report for explanations of assumptions, limitations, methodologies, and a glossary.
Option Equity Schedule
The Option Equity Schedule below shows a summary of your stock option grants and calculates the pre-tax and after-tax option equity value for allvested stock options based on the current market price. These values are calculated using the information you provided for each grant, your taxrate assumption and the current market price of the stock as indicated by you. If your plan includes ISOs, the After Tax Option Equity value assumesthat all ISOs are immediately disqualified and the regular tax rate is applied. This Report does not constitute the solicitation to purchase or sell anyspecific security.
Name Date Price Type ExpirationDate
Granted Exercised Vested Not Vested Pre-Tax Tax at 50.0%
Grant
VestingSchedule
Options Outstanding Options
After Tax
Option Equity - Vested OnlyMarket Price $109.85
2013 Grant 03/01/2013 $70.00 NQO 03/01/2023 3-Year Vest 1,000 0 1,000 0 $39,850 $19,925 $19,925
2015 Grant 03/01/2015 $100.00 NQO 03/01/2025 3-Year Vest 1,000 0 1,000 0 $9,850 $4,925 $4,925
2,000 0Total : 2,000 0 $49,700 $24,850 $24,850
Price Sensitivity Analysis
The Price Sensitivity Analysis shows a summary of your stock option grants and calculates the potential after-tax option equity values for all vestedstock options based on the current market price as indicated by you as well as a variety of higher and lower assumed prices. Understanding theimpact of potential stock price changes on the after-tax option equity value of particular grants can play an important role in determining optionexercise strategies. If your plan includes ISOs, the After Tax Option Equity value assumes that all ISOs are immediately disqualified and the regulartax rate is applied.
Name Date Price Type ExpirationDate
-25%$82.39
-15%$93.37
Market*$109.85
+15%$126.33
Grant
VestedOptions
+25%$137.31
Option Equity Sensitivity - After Tax for Vested Options Only
2013 Grant 03/01/2013 $70.00 NQO 03/01/2023 1,000 $6,194 $11,686 $19,925 $28,164 $33,656
2015 Grant 03/01/2015 $100.00 NQO 03/01/2025 1,000 $0 $0 $4,925 $13,164 $18,656
$6,194 $11,686 $24,850 $41,328 $52,313Total :
Change In Value: -$18,656 -$13,164 $0 $16,478 $27,463
* Security prices included in the stock option analysis are based on the market price that you entered for the date referenced and are included onlybecause the system requires it for analysis purposes. This Report is for your information only and does not constitute the solicitation to purchase orsell any specific security and you should not rely on the information presented when making an investment or liquidation decision. We make nowarranty with respect to any security price and do not guarantee that the price listed will be available to you should you choose to exercise youroptions. The actual price available to you should you choose to exercise your options may be more or less than indicated on the report.

Stock Options Summary
01/29/2019
Prepared for : Jim and Anne Sample Company: R. W. Baird Prepared by: Baird Advisor
Page 27 of 68
See Important Disclosure Information section in this Report for explanations of assumptions, limitations, methodologies, and a glossary.
Full Vesting Schedule
The Full Vesting Schedule illustrates the amount of stock options that are currently vested and calculates any additional amounts that vest in futureyears based on the applicable Vesting Schedule.
Name Date Price Type ExpirationDate
2019 2020 2021 2022
Grant
VestingSchedule
2023
Options Vesting Each Year
CurrentlyVested
Beyond
2013 Grant 03/01/2013 $70.00 NQO 03/01/2023 3-Year Vest 0 0 0 0 01,000 0
2015 Grant 03/01/2015 $100.00 NQO 03/01/2025 3-Year Vest 0 0 0 0 01,000 0
0 0 0 0 02,000 0Total :
Stock Options Scenarios
The Stock Options Scenarios show a summary of your stock option grants and, for each scenario, the timing method(s) and other assumptionsoutlined in the Stock Options Introduction that will be used to calculate future potential after-tax option equity as summarized in the Cash FlowSchedule.
Name Date Price Type ExpirationDate
Timing HoldISO?
Timing HoldISO?
Grant
VestingSchedule
Timing
Scenario 1
Vested Not Vested
Outstanding Options
HoldISO?
Scenario 2 Scenario 3
2013 Grant 03/01/2013 $70.00 NQO 03/01/2023 3-Year Vest Now And AsVested
N/A Now And AtExpiration
N/A At Expiration1,000 0 N/A
2015 Grant 03/01/2015 $100.00 NQO 03/01/2025 3-Year Vest Now And AsVested
N/A Now And AtExpiration
N/A At Expiration1,000 0 N/A
2,000 0Total :
7.40%7.40%7.40%Return assumption for this stock :
Accelerated Expiration Year : 2025 2025 2025
Minimum percentage gain to exercise : 8.00% 8.00%
Exercise Start Year : 2015 2015 2015

Stock Options Summary
01/29/2019
Prepared for : Jim and Anne Sample Company: R. W. Baird Prepared by: Baird Advisor
Page 28 of 68
See Important Disclosure Information section in this Report for explanations of assumptions, limitations, methodologies, and a glossary.
Cash Flow Schedule
The Cash Flow Schedule below shows the future potential after-tax option equity value for each scenario indicated, on a year-by-year basis. Theseare only estimates based on current information and not guarantees that you will obtain a specific value or tax benefit upon exercise of the StockOptions. This Report does not constitute the solicitation to purchase or sell any specific security.
Year Assign to Goals Scenario 1 - Option Equity (after-tax) Scenario 2 - Option Equity (after-tax) Scenario 3 - Option Equity (after-tax)
2019 Fund All Goals $24,850$24,850
2020 Fund All Goals
2021 Fund All Goals
2022 Fund All Goals
2023 Fund All Goals $38,078
2024 Fund All Goals
2025 Fund All Goals $34,294
2026 Fund All Goals
$24,850 $24,850 $72,372Total :
Important Note on Alternative Minimum Tax (AMT): If your plan includes ISOs, the possible impact of AMT is not reflected in these calculations.Since the exercise of ISOs can have substantial AMT consequences, you should consult with your personal tax advisor. Also, the possible impact ofthe value of ISOs becoming first exercisable during a single year and exceeding the $100,000 limitation, causing the excess ISOs to be disqualified, isnot reflected in these calculations.

Restricted Stock Summary
01/29/2019
Prepared for : Jim and Anne Sample Company: R. W. Baird Prepared by: Baird Advisor
Page 29 of 68
See Important Disclosure Information section in this Report for explanations of assumptions, limitations, methodologies, and a glossary.
APPLE INC (AAPL)
JimOwner :
Granted :
Not Vested :
1,000
0
Regular Tax Rate : 50.0%
AssumptionsShares
Market Price* :
Shares Vest at Death :
$109.85 on 04/15/2016
No
Asset Class : Large Cap Core
* Security prices included in the restricted stock analysis are based on the market price that you entered for the date referenced and are includedonly because the system requires it for analysis purposes. This Report is for your information only and does not constitute the solicitation topurchase or sell any specific security and you should not rely on the information presented when making an investment or liquidation decision. Wemake no warranty with respect to any security price and do not guarantee that the price listed will be available to you should you choose to sellyour shares. The actual price available to you should you choose to sell your shares may be more or less than indicated on the report.
Special Asset : No
Vesting Schedule
The Vesting Schedule below is a summary showing the percentage of each grant that becomes vested over time according to the information youhave provided.
Name % Vested by Year
1 2 3 4 5 6 7 8 9 10
Year ofGrant
5-Year Vest 20% 20% 20% 20% 20% 0% 0% 0% 0% 0%0%
The Full Vesting Schedule below illustrates the shares of restricted stock granted and the shares vesting in each year.
Full Vesting Schedule
Name Date 2019 2020 2021 2022
Grant
VestingSchedule
2023
Shares Vesting Each Year
BeyondVestedSharesGranted
2014 Grant 01/01/2014 5-Year Vest 0 0 0 0 01,000 01000
0 0 0 0 01,000 0Total :

Restricted Stock Summary
01/29/2019
Prepared for : Jim and Anne Sample Company: R. W. Baird Prepared by: Baird Advisor
Page 30 of 68
See Important Disclosure Information section in this Report for explanations of assumptions, limitations, methodologies, and a glossary.
Restricted Stock Scenarios
Scenario 1 - Equity (after-tax) Scenario 2 - Equity (after-tax) Scenario 3 - Equity (after-tax)
The Restricted Stock Scenarios show a summary of the return assumptions and last year for vesting of restricted stock shares. This information willbe used to calculate the after-tax equity as summarized in the Cash Flow Schedule.
Return assumption for these Shares : 7.20% 0.00% 14.00%
2026Last Year Shares will Vest : 2026 2026
The Cash Flow Schedule below shows the future potential after-tax equity value for each scenario indicated, on a year-by-year basis. These are onlyestimates based on current information and not guarantees that you will obtain a specific value or tax benefit upon the sale of shares. This Reportdoes not constitute the solicitation to purchase or sell any specific security.
Cash Flow Schedule
Year Assign to GoalsScenario 1 - Equity (after-tax) Scenario 2 - Equity (after-tax) Scenario 3 - Equity (after-tax)
Total : $0 $0 $0

Results

What If Worksheet
01/29/2019
Prepared for : Jim and Anne Sample Company: R. W. Baird Prepared by: Baird Advisor
Page 31 of 68
See Important Disclosure Information section in this Report for explanations of assumptions, limitations, methodologies, and a glossary.
This Worksheet allows you to analyze and compare the results of one or more scenarios that you created by varying the Plan assumptions.
Goals
Likelihood of Funding All Goals
Current Scenario Baird Model Increase Spending
Probability of Success Probability of Success Probability of Success
98% 98% 84%All Goals
Your Confidence Zone: 75% - 90%
Likelihood of Funding All GoalsMonte Carlo Results
Total Spending : $16,421,285 $16,409,009 $21,194,009
Indicates different data between the Scenario in the first column and the Scenario in any other column.

What If Worksheet
01/29/2019
Prepared for : Jim and Anne Sample Company: R. W. Baird Prepared by: Baird Advisor
Page 32 of 68
See Important Disclosure Information section in this Report for explanations of assumptions, limitations, methodologies, and a glossary.
Key Assumptions Current Scenario Baird Model Increase Spending
Hypothetical Average Rate of Return
False 1
Before Retirement : Current Growth w/ Inc Growth w/ Inc False 1
Composite Return : 5.07% 5.61% 5.61% False 1
Composite Standard Deviation : 9.41% 9.86% 9.86% False 1
Total Return Adjustment : 0.00% 0.00% 0.00% False 1
Adjusted Real Return : 2.07% 2.61% 2.61% False 1
False 1
After Retirement : Current Growth w/ Inc Growth w/ Inc False 1
Composite Return : 5.07% 5.61% 5.61% False 1
Composite Standard Deviation : 9.41% 9.86% 9.86% False 1
Total Return Adjustment : 0.00% 0.00% 0.00% False 1
Adjusted Real Return : 2.07% 2.61% 2.61% False 1
Base inflation rate : 3.00% 3.00% 3.00% False 1
Indicates different data between the Scenario in the first column and the Scenario in any other column.

What If Worksheet
01/29/2019
Prepared for : Jim and Anne Sample Company: R. W. Baird Prepared by: Baird Advisor
Page 33 of 68
See Important Disclosure Information section in this Report for explanations of assumptions, limitations, methodologies, and a glossary.
Key Assumptions Current Scenario Baird Model Increase Spending
Goals
Living Expense True 1
Retirement Age True 1
Jim 66 66 66 False 1
Anne 65 65 65 False 1
Planning Age True 1
Jim 95 95 95 False 1
Anne 95 95 95 False 1
One Retired True 1
Jim Retired and Anne Employed $0 $0 $0 False 1
Anne Retired and Jim Employed $0 $0 $0 False 1
Both Retired True 1
Both Retired $425,000 $425,000 $500,000 False 1
One Alone - Retired True 1
Anne Alone Retired $365,000 $365,000 $425,000 False 1
Jim Alone Retired $0 $0 $0 False 1
One Alone - Employed True 1
Jim Alone Employed $0 $0 $0 False 1
Anne Alone Employed $0 $0 $0 False 1
Health Care True 1
Percentage to increase costs : 100% 100% 100% False 1
Cost determined by Schedule : See details See details See details False 1
College - Daughter True 1
Year : 2021 2021 2021 False 1
Years of Education : 4 4 4 False 1
Annual Cost : $50,900 $47,831 $47,831 False 1
New Vehicle True 1
Year : 2017 2017 2017 False 1
Cost : $40,000 $40,000 $40,000 False 1
Indicates different data between the Scenario in the first column and the Scenario in any other column.

What If Worksheet
01/29/2019
Prepared for : Jim and Anne Sample Company: R. W. Baird Prepared by: Baird Advisor
Page 34 of 68
See Important Disclosure Information section in this Report for explanations of assumptions, limitations, methodologies, and a glossary.
Key Assumptions Current Scenario Baird Model Increase Spending
Goals
Is recurring : Yes Yes Yes False 1
Years between occurrences : 5 5 5 False 1
Number of occurrences : 8 8 8 False 1
Vacation Home True 1
Year : 2020 2020 2020 False 1
Cost : $1,000,000 $1,000,000 $1,000,000 False 1
Charitable Gifts True 1
Year : 2016 2016 2016 False 1
Cost : $25,000 $25,000 $100,000 False 1
Is recurring : Yes Yes Yes False 1
Years between occurrences : 1 1 1 False 1
This goal will end at End of plan. False 1
Annual Exclusion Gifts to Brian True 1
Year : 2016 2016 2016 False 1
Cost : $14,000 $14,000 $14,000 False 1
Is recurring : Yes Yes Yes False 1
Years between occurrences : 1 1 1 False 1
This goal will end at End of plan. False 1
Indicates different data between the Scenario in the first column and the Scenario in any other column.

What If Worksheet
01/29/2019
Prepared for : Jim and Anne Sample Company: R. W. Baird Prepared by: Baird Advisor
Page 35 of 68
See Important Disclosure Information section in this Report for explanations of assumptions, limitations, methodologies, and a glossary.
Key Assumptions Current Scenario Baird Model Increase Spending
Retirement Income
Pension (Jim) True 1
Annual Income : $155,000 $155,000 $155,000 False 1
Start Year : Jim's retirement Jim's retirement Jim's retirement False 1
Select when income will end : End of Jim's Plan End of Jim's Plan End of Jim's Plan False 1
Year to end retirement income : False 1
Survivor Benefit : 0% 0% 0% False 1
Pension (Anne) True 1
Annual Income : $4,000 $4,000 $4,000 False 1
Start Year : Anne's retirement Anne's retirement Anne's retirement False 1
Select when income will end : End of Anne's Plan End of Anne's Plan End of Anne's Plan False 1
Year to end retirement income : False 1
Survivor Benefit : 0% 0% 0% False 1
Social Security True 1
Select Social Security Strategy Current Current Current False 1
Jim True 1
Filing Method : Normal Normal Normal False 1
Age to File Application : 66 Years, 2 Months 66 Years, 2 Months 66 Years, 2 Months False 1
Age Retirement Benefits begin : 66 Years, 2 Months 66 Years, 2 Months 66 Years, 2 Months False 1
First Year Benefit : $30,588 $30,588 $30,588 False 1
Anne True 1
Filing Method : Normal Normal Normal False 1
Age to File Application : 65 65 65 False 1
Age Retirement Benefits begin : 65 65 65 False 1
First Year Benefit : $24,294 $24,294 $24,294 False 1
Reduce Benefits By : 0% 0% 0% False 1
Indicates different data between the Scenario in the first column and the Scenario in any other column.

What If Worksheet
01/29/2019
Prepared for : Jim and Anne Sample Company: R. W. Baird Prepared by: Baird Advisor
Page 36 of 68
See Important Disclosure Information section in this Report for explanations of assumptions, limitations, methodologies, and a glossary.
Key Assumptions Current Scenario Baird Model Increase Spending
Asset Additions
Jim's 401(k) Maximum Maximum Maximum True 1
Roth: N/A N/A N/A False 1
Maximum contribution each year: Yes Yes Yes False 1
% Designated as Roth: 0.00% 0.00% 0.00% False 1
Plan addition amount: $25,000 $25,000 $25,000 False 1
Year additions begin: 2019 2019 2019 False 1
Jim - Fund All Goals False 1
Jim's Investment Account True 1
After-Tax Addition: $50,000 $50,000 $50,000 False 1
Tax-Free Addition: $0 $0 $0 False 1
Year additions begin: 2019 2019 2019 False 1
Jim - Fund All Goals False 1
Extra Savings by Tax Category
Jim's Qualified $0 $0 False 1
Anne's Qualified $0 $0 False 1
Jim's Roth $0 $0 False 1
Anne's Roth $0 $0 False 1
Jim's Tax-Deferred $0 $0 False 1
Anne's Tax-Deferred $0 $0 False 1
Taxable $0 $0 False 1
Stock Options
APPLE INC True 1
Include in plan : Yes Yes Yes False 1
Stock Options Scenario : Scenario 1 Scenario 1 Scenario 1 False 1
Vesting Termination Year : 2025 2025 2025 False 1
Return : 7.40% 7.40% 7.40% False 1
Indicates different data between the Scenario in the first column and the Scenario in any other column.

What If Worksheet
01/29/2019
Prepared for : Jim and Anne Sample Company: R. W. Baird Prepared by: Baird Advisor
Page 37 of 68
See Important Disclosure Information section in this Report for explanations of assumptions, limitations, methodologies, and a glossary.
Key Assumptions Current Scenario Baird Model Increase Spending
Restricted Stock
APPLE INC True 1
Include in plan : Yes Yes Yes False 1
Restricted Stock Scenario : Scenario 1 Scenario 1 Scenario 1 False 1
Last year shares will vest : 2026 2026 2026 False 1
Return : 7.20% 7.20% 7.20% False 1
Other Assets
AIG 10-Year Fixed Annuity True 1
Include in Plan : Yes Yes Yes False 1
When received : 2024 2024 2024 False 1
Amount of cash received : $130,000 $130,000 $130,000 False 1
Business True 1
Include in Plan : Yes Yes Yes False 1
Select special amount : Expected Expected Expected False 1
When received : 2020 2020 2020 False 1
Amount of cash received : $10,000,000 $10,000,000 $10,000,000 False 1
Cash Reserve
Include : No No False 1
Your Goal Coverage True 1
Needs : 3 3 False 1
Wants : 2 2 False 1
Wishes : 1 1 False 1
Minimum in Cash Reserve : $0 $0 False 1
Annual offset for Cash Reserve : $0 $0 False 1
Selected Allocation : Enter Own Return andStandard Deviation
Enter Own Return andStandard Deviation
False 1
Return : 0.00% 0.00% False 1
Standard Deviation : 0.00% 0.00% False 1
Reverse Mortgage Line of Credit Loan True 1
Indicates different data between the Scenario in the first column and the Scenario in any other column.

What If Worksheet
01/29/2019
Prepared for : Jim and Anne Sample Company: R. W. Baird Prepared by: Baird Advisor
Page 38 of 68
See Important Disclosure Information section in this Report for explanations of assumptions, limitations, methodologies, and a glossary.
Key Assumptions Current Scenario Baird Model Increase Spending
Aspirational Bucket
Include : No No False 1
Additional : $0 $0 False 1
Selected Allocation : Enter Own Return andStandard Deviation
Enter Own Return andStandard Deviation
False 1
Return : 9.00% 9.00% False 1
Standard Deviation : 18.00% 18.00% False 1
Tax Options
Include Tax Penalties : Yes Yes Yes False 1
Change Tax Rate? No No No False 1
Year To Change : False 1
Change Tax Rate by this % (+ or -) : 0.00% 0.00% 0.00% False 1
Indicates different data between the Scenario in the first column and the Scenario in any other column.
Worksheet Detail - Social Security Analysis
01/29/2019
Prepared for : Jim and Anne Sample Company: R. W. Baird Prepared by: Baird Advisor
Page 39 of 68
See Important Disclosure Information section in this Report for explanations of assumptions, limitations, methodologies, and a glossary.
As Soon AsPossible
At Retirement At FRA At Age 70
Jim begins atage 70 and
Anne beginsat FRA
SelectedStrategy
Social Security Strategy
Start age Jim Anne
6665
6362
6665
6666
7070
7066
First year benefit in current dollars Jim Anne
$30,588$24,294
$0$0
$30,248$24,294
$30,588$26,664
$39,968$34,485
$39,968$26,664
Total lifetime benefit in currentdollars
$1,677,044 $1,387,658 $1,666,508 $1,721,484 $1,941,281 $1,852,401
Probability of success 98% 97% 98% 98% 98% 98%
Break Even Point Jim Anne
6665
N/AN/A
6665
6867
7675
7473
Social Security Analysis for Current Scenario

Worksheet Detail - Social Security Analysis
01/29/2019
Prepared for : Jim and Anne Sample Company: R. W. Baird Prepared by: Baird Advisor
Page 40 of 68
See Important Disclosure Information section in this Report for explanations of assumptions, limitations, methodologies, and a glossary.
Social Security Analysis for Current Scenario
Notes
Selected Strategy:
You apply for and begin benefits at the later of your current age or age 62. The benefit isautomatically adjusted to account for excess earnings from part-time work, if applicable, andtaking benefits prior to your FRA. If you are age 62 or older, this option is not available.
This strategy is available only if you are married. The higher wage earner applies for and beginsbenefits at age 70. The lower wage earner applies for and begins benefits at his/her FRA. Thehigher/lower wage earners are determined based on the employment incomes you specified.
This is the strategy you selected.
At FRA:
You apply for and begin retirement benefits at your Full Retirement Age (FRA), which isdetermined by your date of birth. If the retirement age you specified is after your FRA, weassume you will begin benefits at FRA, and we will adjust the benefit for inflation until yourretirement age.
At Retirement:
You apply for and begin retirement benefits at the retirement age shown. The benefit isautomatically adjusted to account for excess earnings from part-time work and/or taking benefitsprior to your FRA, if either is applicable.
As soon as possible:
At age 70:
You apply for and begin benefits at age 70.
(Higher Wage Earner) begins at age 70 and (Lower Wage Earner) begins at FRA:
This strategy is available only if you are married and assumes that you filed for and suspendedyour benefits prior to April 30, 2016 and your spouse reached age 62 by January 1, 2016. Thehigher wage earner applies for and suspends taking benefits until age 70. The higher wageearner can file at or after his/her FRA, at which time the spouse (the lower wage earner) files forand takes spousal benefits. The spouse then files for and begins his/her own benefit at age 70, atthe higher benefit amount.
(Higher Wage Earner) files/suspends and (Lower Wage Earner) restricted application:
After April 30, 2016, you (or your spouse) can still file and suspend your benefits upon reachingyour FRA; but this strategy (that allowed your spouse to receive spousal benefits for the sameperiod that the benefits are suspended ) has been discontinued by the Social SecurityAdministration.
The lower wage earner makes a restricted application at his/her FRA. Restricted application allowsthe account holder to apply only for the "spousal benefit" s/he would be due under dualentitlement rules. At any age beyond his/her FRA, the lower wage earner can apply for andreceive benefits based on his/her own work history.
This strategy is available only if you are married and assumes that you filed for and suspendedyour benefits prior to April 30, 2016 and your spouse reached age 62 by January 1, 2016. Thelower wage earner applies for and suspends taking benefits until age 70. The lower wage earnercan file at or after his/her FRA, at which time the spouse (the higher wage earner) files for andtakes spousal benefits. The spouse then files for and begins his/her own benefit at age 70, at thehigher benefit amount.
(Lower Wage Earner) files/suspends and (Higher Wage Earner) restricted application:
The higher wage earner makes a restricted application at his/her FRA. Restricted applicationallows the account holder to apply only for the "spousal benefit" s/he would be due under dualentitlement rules. At any age beyond his/her FRA, the higher wage earner can apply for andreceive benefits based on his/her own work history.
After April 30, 2016, you (or your spouse) can still file and suspend your benefits upon reachingyour FRA; but this strategy (that allowed your spouse to receive spousal benefits for the sameperiod that the benefits are suspended ) has been discontinued by the Social SecurityAdministration.
Maximized Benefits:
This is the strategy that provides the highest estimate of lifetime Social Security income, assumingyou live to the age(s) shown on the Detailed Results page.
Total Lifetime Benefit:
The total estimate of benefits you and your co-client, if applicable, would receive in your lifetime,assuming you live to the age(s) shown on the Detailed Results page. This amount is in current(non-inflated) dollars.
Break Even Point:
The age(s) at which this strategy would provide benefits equivalent to the “As Soon As Possible”strategy. If you live longer than the “break even” age for a strategy, your total lifetime benefitsusing that strategy would be greater than the lifetime benefits of the “As Soon As Possible”strategy. If you are older than age 62 and the “As Soon As Possible” strategy is not shown, thebreak even comparison uses the strategy that begins at the earliest age(s) as the baseline forcomparison.

Worksheet Detail - Special Asset Test
01/29/2019
Prepared for : Jim and Anne Sample Company: R. W. Baird Prepared by: Baird Advisor
Page 41 of 68
See Important Disclosure Information section in this Report for explanations of assumptions, limitations, methodologies, and a glossary.
Likelihood of Funding Goals
Low Expected High
Description When SoldLow Expected High
Future Amounts
$10,000$10,000 in 2020Variable Annuity with GMWB $10,000
$10,000,000$5,000,000in 2020Business $13,000,000
It is often difficult to predict the value that will be received from the sale of assets in the future. This creates a hidden risk to your plan.
These results show your Probability of Success using the three estimates you provided for the amount of after-tax cash you might receivefrom the sale of each Special Asset shown in the table. For each result calculated, all assets are assumed to receive the Low, Expected orHigh amount. All other assumptions in the plan remain unchanged.
There is a Risk that you will receive the Low values (or less than the Low values). If this causes your Probability of Success to fall below yourConfidence Zone, you should consider what adjustments might be necessary.
Special Asset Test for Current Scenario

Worksheet Detail - Inside the Numbers Final Result
01/29/2019
Prepared for : Jim and Anne Sample Company: R. W. Baird Prepared by: Baird Advisor
Page 42 of 68
See Important Disclosure Information section in this Report for explanations of assumptions, limitations, methodologies, and a glossary.
• The graph below shows the results for all 1000 Monte Carlo Trials.• The Probability of Success meter displays the percentage of trials that were successful in funding all of your goals.• We identify the Confidence Zone as a probability of Success between 75% and 90%.
(75% - 90%)
In the table below, values are shown for the 99th, 75th, 50th, 25th and 1st percentile trialsbased on the End of Plan value. For each trial displayed, the corresponding portfolio valueis illustrated for specific years of the plan. These trials serve as checkpoints to illustrate howthe portfolio might perform over the life of the plan.
Although the graph and table help illustrate a general range of results you may expect,neither of them reflect the Final Result, your Probability of Success.
Trial Number Percentile Year 5 Year 10 Year 15 Year 20 Year 25 End of Plan FutureDollars
End of PlanCurrent Dollars
Year Money Goesto $0
10 99th Percentile $24,427,090 $31,761,168 $34,624,841 $49,690,164 $48,178,436 $70,281,545 $27,292,927
250 75th Percentile $16,577,144 $23,073,319 $29,671,907 $26,033,604 $33,752,946 $30,430,326 $11,817,222
500 50th Percentile $19,030,556 $23,406,841 $26,086,217 $22,823,089 $18,994,170 $20,147,099 $7,823,865
750 25th Percentile $18,927,857 $24,179,006 $22,213,745 $18,776,964 $13,870,069 $11,463,951 $4,451,877
990 1st Percentile $16,289,309 $17,994,623 $11,266,188 $8,146,154 $5,130,532 $0 $0 2050
Inside the Numbers - Final Result For Current Scenario

Worksheet Detail - Combined Details
01/29/2019
Prepared for : Jim and Anne Sample Company: R. W. Baird Prepared by: Baird Advisor
Page 43 of 68
See Important Disclosure Information section in this Report for explanations of assumptions, limitations, methodologies, and a glossary.
Total Portfolio Value Graph
These pages provide a picture of how your Investment Portfolio may hypothetically perform over the life of this Plan. The graph shows theeffect on the value of your Investment Portfolio for each year. The chart shows the detailed activities that increase and decrease yourInvestment Portfolio value each year including the funds needed to pay for each of your Goals. Shortfalls that occur in a particular year aredenoted with an 'X' under the Goal column.
Scenario : Current Scenario using Average Return
x - denotes shortfall

Worksheet Detail - Combined Details
01/29/2019
Prepared for : Jim and Anne Sample Company: R. W. Baird Prepared by: Baird Advisor
Page 44 of 68
See Important Disclosure Information section in this Report for explanations of assumptions, limitations, methodologies, and a glossary.
Event or Ages Year
Beginning Portfolio Value
Earmarked Fund All Goals Additions ToAssets
OtherAdditions
StockOptions
StrategyReductions
StrategyIncome
PostRetirement
Income
InvestmentEarnings
InvestmentReturn
Taxes
Funds Used
All Goals Ending PortfolioValue
64/63 2019 130,000 9,124,297 75,000 0 24,850 0 0 0 472,948 5.08% 109,390 39,000 9,678,705
65/64 2020 137,020 9,541,685 75,500 10,140,376 0 137,020 10,000 0 939,324 5.04% 356,807 1,069,420 19,280,657
Jim & Anne Retire 2021 0 19,280,657 0 140,376 0 0 10,000 216,099 957,667 5.04% 384,785 565,790 19,654,223
67/66 2022 0 19,654,223 0 140,376 0 0 10,000 217,241 973,914 5.04% 384,398 623,633 19,987,724
68/67 2023 0 19,987,724 0 140,376 0 0 10,000 218,406 992,132 5.04% 385,033 602,118 20,361,487
69/68 2024 0 20,361,487 0 270,376 0 0 10,000 219,594 1,016,859 5.05% 388,040 621,266 20,869,011
70/69 2025 0 20,869,011 0 0 0 0 10,000 220,806 1,033,799 5.05% 323,497 572,888 21,237,230
71/70 2026 0 21,237,230 0 0 0 0 10,000 222,042 1,048,682 5.05% 411,175 590,019 21,516,760
72/71 2027 0 21,516,760 0 0 0 0 10,000 223,303 1,059,820 5.05% 416,388 647,708 21,745,787
73/72 2028 0 21,745,787 0 0 0 0 10,000 224,589 1,072,391 5.05% 422,452 625,947 22,004,368
74/73 2029 0 22,004,368 0 0 0 0 10,000 225,901 1,084,393 5.05% 428,560 644,755 22,251,346
75/74 2030 0 22,251,346 0 0 0 0 10,000 227,239 1,095,765 5.05% 434,710 664,170 22,485,469
76/75 2031 0 22,485,469 0 0 0 0 10,000 228,603 1,106,441 5.05% 440,899 684,211 22,705,404
77/76 2032 0 22,705,404 0 0 0 0 10,000 229,996 1,114,368 5.05% 445,799 744,899 22,869,069
78/77 2033 0 22,869,069 0 0 0 0 10,000 231,415 1,123,368 5.05% 453,230 726,232 23,054,391
79/78 2034 0 23,054,391 0 0 0 0 10,000 232,864 1,131,349 5.05% 461,913 748,234 23,218,456
80/79 2035 0 23,218,456 0 0 0 0 10,000 234,341 1,138,316 5.04% 467,275 770,944 23,362,894
81/80 2036 0 23,362,894 0 0 0 0 10,000 235,848 1,144,240 5.04% 472,526 794,388 23,486,068
82/81 2037 0 23,486,068 0 0 0 0 10,000 237,385 1,147,034 5.04% 476,817 858,589 23,545,081
83/82 2038 0 23,545,081 0 0 0 0 10,000 238,953 1,150,558 5.04% 481,751 843,537 23,619,302
84/83 2039 0 23,619,302 0 0 0 0 10,000 240,552 1,152,774 5.04% 486,495 869,245 23,666,888
85/84 2040 0 23,666,888 0 0 0 0 10,000 242,183 1,153,621 5.04% 490,047 895,788 23,686,857
86/85 2041 0 23,686,857 0 0 0 0 10,000 243,846 1,153,025 5.04% 493,065 923,198 23,677,465
87/86 2042 0 23,677,465 0 0 0 0 10,000 245,543 1,148,890 5.04% 494,796 991,503 23,595,600
88/87 2043 0 23,595,600 0 0 0 0 10,000 247,274 1,145,064 5.04% 496,803 980,721 23,520,413
89/88 2044 0 23,520,413 0 0 0 0 10,000 249,040 1,139,502 5.04% 498,213 1,010,863 23,409,878
90/89 2045 0 23,409,878 0 0 0 0 10,000 250,840 1,132,152 5.04% 497,518 1,041,998 23,263,355
91/90 2046 0 23,263,355 0 0 0 0 10,000 252,677 1,122,946 5.04% 496,364 1,074,165 23,078,449
92/91 2047 0 23,078,449 0 0 0 0 10,000 254,551 1,109,759 5.03% 493,472 1,147,331 22,811,955
93/92 2048 0 22,811,955 0 0 0 0 10,000 256,462 1,096,435 5.03% 490,269 1,141,541 22,543,042
94/93 2049 0 22,543,042 0 0 0 0 10,000 258,411 1,081,000 5.03% 484,107 1,176,821 22,231,526
Jim's Plan Ends 2050 0 22,231,526 0 0 0 0 10,000 260,399 1,063,397 5.03% 476,294 1,213,190 21,875,838
Anne's Plan Ends 2051 0 21,875,838 0 643,771 0 0 0 61,644 1,077,536 5.03% 465,270 1,048,229 22,145,291
Scenario : Current Scenario using Average Return
x - denotes shortfall

Worksheet Detail - Combined Details
01/29/2019
Prepared for : Jim and Anne Sample Company: R. W. Baird Prepared by: Baird Advisor
Page 45 of 68
See Important Disclosure Information section in this Report for explanations of assumptions, limitations, methodologies, and a glossary.
Scenario : Current Scenario using Average Return
Event or Ages Year
Funds Used
Retirement Health Care College -Daughter
New Vehicle Vacation Home Charitable Gifts AnnualExclusion Gifts
to Brian
Ending PortfolioValue
64/63 2019 0 0 0 0 0 25,000 14,000 9,678,705
65/64 2020 0 0 0 0 1,030,000 25,000 14,420 19,280,657
Jim & Anne Retire 2021 450,883 18,938 56,117 0 0 25,000 14,853 19,654,223
67/66 2022 464,409 20,003 58,923 40,000 0 25,000 15,298 19,987,724
68/67 2023 478,341 21,150 61,869 0 0 25,000 15,757 20,361,487
69/68 2024 492,691 22,382 64,963 0 0 25,000 16,230 20,869,011
70/69 2025 507,472 23,700 0 0 0 25,000 16,717 21,237,230
71/70 2026 522,696 25,104 0 0 0 25,000 17,218 21,516,760
72/71 2027 538,377 26,596 0 40,000 0 25,000 17,735 21,745,787
73/72 2028 554,529 28,152 0 0 0 25,000 18,267 22,004,368
74/73 2029 571,164 29,776 0 0 0 25,000 18,815 22,251,346
75/74 2030 588,299 31,491 0 0 0 25,000 19,379 22,485,469
76/75 2031 605,948 33,302 0 0 0 25,000 19,961 22,705,404
77/76 2032 624,127 35,213 0 40,000 0 25,000 20,559 22,869,069
78/77 2033 642,851 37,205 0 0 0 25,000 21,176 23,054,391
79/78 2034 662,136 39,286 0 0 0 25,000 21,812 23,218,456
80/79 2035 682,000 41,478 0 0 0 25,000 22,466 23,362,894
81/80 2036 702,460 43,788 0 0 0 25,000 23,140 23,486,068
82/81 2037 723,534 46,221 0 40,000 0 25,000 23,834 23,545,081
83/82 2038 745,240 48,748 0 0 0 25,000 24,549 23,619,302
84/83 2039 767,597 51,362 0 0 0 25,000 25,286 23,666,888
85/84 2040 790,625 54,118 0 0 0 25,000 26,044 23,686,857
86/85 2041 814,344 57,028 0 0 0 25,000 26,825 23,677,465
87/86 2042 838,774 60,098 0 40,000 0 25,000 27,630 23,595,600
88/87 2043 863,937 63,325 0 0 0 25,000 28,459 23,520,413
89/88 2044 889,856 66,694 0 0 0 25,000 29,313 23,409,878
90/89 2045 916,551 70,254 0 0 0 25,000 30,192 23,263,355
91/90 2046 944,048 74,019 0 0 0 25,000 31,098 23,078,449
92/91 2047 972,369 77,931 0 40,000 0 25,000 32,031 22,811,955
93/92 2048 1,001,540 82,008 0 0 0 25,000 32,992 22,543,042
94/93 2049 1,031,587 86,253 0 0 0 25,000 33,982 22,231,526
Jim's Plan Ends 2050 1,062,534 90,655 0 0 0 25,000 35,001 21,875,838
Anne's Plan Ends 2051 939,905 47,272 0 0 0 25,000 36,051 22,145,291
x - denotes shortfall

Worksheet Detail - Combined Details
01/29/2019
Prepared for : Jim and Anne Sample Company: R. W. Baird Prepared by: Baird Advisor
Page 46 of 68
See Important Disclosure Information section in this Report for explanations of assumptions, limitations, methodologies, and a glossary.
Notes
• Calculations are based on a “Rolling Year” rather than a Calendar Year. The current datebegins the 365-day “Rolling Year”.
• Additions and withdrawals occur at the beginning of the year.
• Post Retirement Income includes the following: Social Security, pension, annuity, rentalproperty, royalty, alimony, part-time employment, trust, and any other retirement income asentered in the Plan.
• Other Additions come from items entered in the Other Assets section and any applicableproceeds from insurance policies.
• Stock Options and Restricted Stock values are after-tax.
• Strategy Income is based on the particulars of the Goal Strategies selected. Strategy Incomefrom immediate annuities, 72(t) distributions, and variable annuities with a guaranteed minimumwithdrawal benefit (GMWB) is pre-tax. Strategy Income from Net Unrealized Appreciation (NUA)is after-tax.
• Investment Earnings are calculated on all assets after any withdrawals for 'Goal Expense', 'Taxeson Withdrawals' and 'Tax Penalties' are subtracted.
• When married, if either Social Security Program Estimate or Use a Better Estimate of AnnualBenefits is selected for a participant, the program will default to the greater of the selectedbenefit or the age adjusted spousal benefit, which is based on the other participant's benefit.
• The taxes column is a sum of (1) taxes on retirement income, (2) taxes on strategy income, (3)taxes on withdrawals from qualified assets for Required Minimum Distributions, (4) taxes onwithdrawals from taxable assets' untaxed gain used to fund Goals in that year, (5) taxes onwithdrawals from tax-deferred or qualified assets used to fund goals in that year, and (6) taxes onthe investment earnings of taxable assets. Tax rates used are detailed in the Tax and InflationOptions page. (Please note, the Taxes column does not include any taxes owed from the exerciseof Stock Options or the vesting of Restricted Stock.)
• Funds for each Goal Expense are first used from Earmarked Assets. If sufficient funds are notavailable from Earmarked Assets, Fund All Goals Assets will be used to fund the remainingportion of the Goal Expense, if available in that year.
• These calculations do not incorporate penalties associated with use of 529 Plan withdrawals fornon-qualified expenses.
• All funds needed for a Goal must be available in the year the Goal occurs. Funds fromEarmarked Assets that become available after the goal year(s) have passed are not included in thefunding of that Goal, and accumulate until the end of the Plan.
• Tax Penalties can occur when Qualified and Tax-Deferred Assets are used prior to age 59½. Ifthere is a value in this column, it illustrates that you are using your assets in this Plan in a mannerthat may incur tax penalties. Generally, it is better to avoid tax penalties whenever possible.
• When married, ownership of qualified assets is assumed to roll over to the surviving co-client atthe death of the original owner. It is also assumed the surviving co-client inherits all assets of theoriginal owner.
x - denotes shortfall

Worksheet Detail - Retirement Distribution Cash Flow Chart
01/29/2019
Prepared for : Jim and Anne Sample Company: R. W. Baird Prepared by: Baird Advisor
Page 47 of 68
See Important Disclosure Information section in this Report for explanations of assumptions, limitations, methodologies, and a glossary.
202166 / 65
202267 / 66
202368 / 67
202469 / 68
202570 / 69
202671 / 70
202772 / 71
202873 / 72
YearAge (Jim / Anne)
Retirement and Strategy Income Assign To
Pension 155,000Fund All Goals 155,000 155,000 155,000 155,000 155,000 155,000 155,000
Pension 4,000Fund All Goals 4,000 4,000 4,000 4,000 4,000 4,000 4,000
Social Security - Anne 25,275Fund All Goals 25,781 26,296 26,822 27,359 27,906 28,464 29,033
Social Security - Jim 31,824Fund All Goals 32,460 33,109 33,772 34,447 35,136 35,839 36,555
Variable Annuity with GMWB 10,000Fund All Goals 10,000 10,000 10,000 10,000 10,000 10,000 10,000
Total Retirement and StrategyIncome
226,099 227,241 228,406 229,594 230,806 232,042 233,303 234,589
Other Additions Assign To
AIG 10-Year Fixed Annuity 0Fund All Goals 0 0 130,000 0 0 0 0
Deferred Compensation 140,376Fund All Goals 140,376 140,376 140,376 0 0 0 0
Second to Die Policy 0Fund All Goals 0 0 0 0 0 0 0
Total Other Additions 140,376 140,376 140,376 270,376 0 0 0 0
Total Income 366,475 367,617 368,782 499,970 230,806 232,042 233,303 234,589
Cash Used To Fund GoalsEstimated %Funded
Health Care 18,938100.00% 20,003 21,150 22,382 23,700 25,104 26,596 28,152
Retirement - Living Expense 450,883100.00% 464,409 478,341 492,691 507,472 522,696 538,377 554,529
College - Daughter 56,117100.00% 58,923 61,869 64,963 0 0 0 0
New Vehicle 0100.00% 40,000 0 0 0 0 40,000 0
Annual Exclusion Gifts to Brian 14,853100.00% 15,298 15,757 16,230 16,717 17,218 17,735 18,267
Charitable Gifts 25,000100.00% 25,000 25,000 25,000 25,000 25,000 25,000 25,000
Total Goal Funding (565,790) (623,633) (602,118) (621,266) (572,888) (590,019) (647,708) (625,947)
Total Taxes and Tax Penalty (384,785) (384,398) (385,033) (388,040) (323,497) (411,175) (416,388) (422,452)
Total Outflows (950,576) (1,008,031) (987,151) (1,009,306) (896,386) (1,001,194) (1,064,096) (1,048,399)
Cash Surplus/Deficit (NetIncome)
(584,101) (640,414) (618,369) (509,336) (665,580) (769,152) (830,793) (813,810)
Portfolio Value
Scenario : Current Scenario using Average Returns
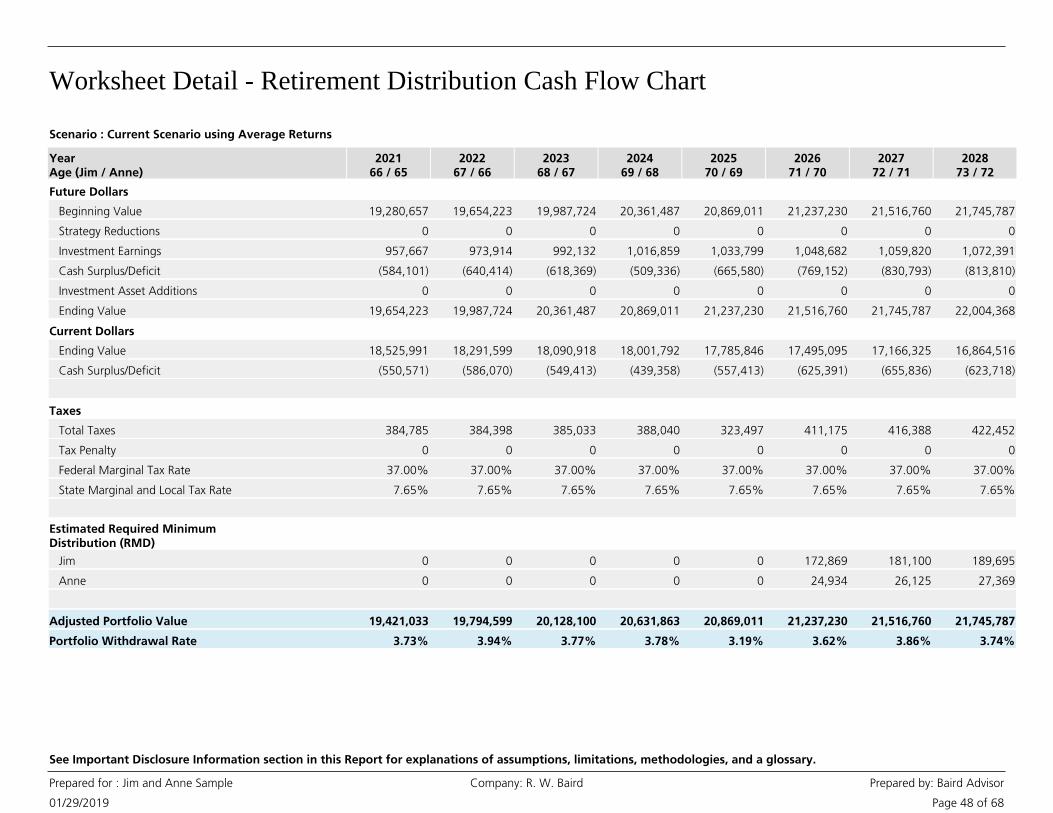
Worksheet Detail - Retirement Distribution Cash Flow Chart
01/29/2019
Prepared for : Jim and Anne Sample Company: R. W. Baird Prepared by: Baird Advisor
Page 48 of 68
See Important Disclosure Information section in this Report for explanations of assumptions, limitations, methodologies, and a glossary.
202166 / 65
202267 / 66
202368 / 67
202469 / 68
202570 / 69
202671 / 70
202772 / 71
202873 / 72
YearAge (Jim / Anne)
Future Dollars
Beginning Value 19,280,657 19,654,223 19,987,724 20,361,487 20,869,011 21,237,230 21,516,760 21,745,787
Strategy Reductions 0 0 0 0 0 0 0 0
Investment Earnings 957,667 973,914 992,132 1,016,859 1,033,799 1,048,682 1,059,820 1,072,391
Cash Surplus/Deficit (584,101) (640,414) (618,369) (509,336) (665,580) (769,152) (830,793) (813,810)
Investment Asset Additions 0 0 0 0 0 0 0 0
Ending Value 19,654,223 19,987,724 20,361,487 20,869,011 21,237,230 21,516,760 21,745,787 22,004,368
Current Dollars
Ending Value 18,525,991 18,291,599 18,090,918 18,001,792 17,785,846 17,495,095 17,166,325 16,864,516
Cash Surplus/Deficit (550,571) (586,070) (549,413) (439,358) (557,413) (625,391) (655,836) (623,718)
Taxes
Total Taxes 384,785 384,398 385,033 388,040 323,497 411,175 416,388 422,452
Tax Penalty 0 0 0 0 0 0 0 0
Federal Marginal Tax Rate 37.00% 37.00% 37.00% 37.00% 37.00% 37.00% 37.00% 37.00%
State Marginal and Local Tax Rate 7.65% 7.65% 7.65% 7.65% 7.65% 7.65% 7.65% 7.65%
Estimated Required MinimumDistribution (RMD)
Jim 0 0 0 0 0 172,869 181,100 189,695
Anne 0 0 0 0 0 24,934 26,125 27,369
Adjusted Portfolio Value 19,421,033 19,794,599 20,128,100 20,631,863 20,869,011 21,237,230 21,516,760 21,745,787
Portfolio Withdrawal Rate 3.73% 3.94% 3.77% 3.78% 3.19% 3.62% 3.86% 3.74%
Scenario : Current Scenario using Average Returns

Worksheet Detail - Retirement Distribution Cash Flow Chart
01/29/2019
Prepared for : Jim and Anne Sample Company: R. W. Baird Prepared by: Baird Advisor
Page 49 of 68
See Important Disclosure Information section in this Report for explanations of assumptions, limitations, methodologies, and a glossary.
202974 / 73
203075 / 74
203176 / 75
203277 / 76
203378 / 77
203479 / 78
203580 / 79
203681 / 80
YearAge (Jim / Anne)
Retirement and Strategy Income Assign To
Pension 155,000Fund All Goals 155,000 155,000 155,000 155,000 155,000 155,000 155,000
Pension 4,000Fund All Goals 4,000 4,000 4,000 4,000 4,000 4,000 4,000
Social Security - Anne 29,614Fund All Goals 30,206 30,810 31,427 32,055 32,696 33,350 34,017
Social Security - Jim 37,287Fund All Goals 38,032 38,793 39,569 40,360 41,167 41,991 42,831
Variable Annuity with GMWB 10,000Fund All Goals 10,000 10,000 10,000 10,000 10,000 10,000 10,000
Total Retirement and StrategyIncome
235,901 237,239 238,603 239,996 241,415 242,864 244,341 245,848
Other Additions Assign To
AIG 10-Year Fixed Annuity 0Fund All Goals 0 0 0 0 0 0 0
Deferred Compensation 0Fund All Goals 0 0 0 0 0 0 0
Second to Die Policy 0Fund All Goals 0 0 0 0 0 0 0
Total Other Additions 0 0 0 0 0 0 0 0
Total Income 235,901 237,239 238,603 239,996 241,415 242,864 244,341 245,848
Cash Used To Fund GoalsEstimated %Funded
Health Care 29,776100.00% 31,491 33,302 35,213 37,205 39,286 41,478 43,788
Retirement - Living Expense 571,164100.00% 588,299 605,948 624,127 642,851 662,136 682,000 702,460
College - Daughter 0100.00% 0 0 0 0 0 0 0
New Vehicle 0100.00% 0 0 40,000 0 0 0 0
Annual Exclusion Gifts to Brian 18,815100.00% 19,379 19,961 20,559 21,176 21,812 22,466 23,140
Charitable Gifts 25,000100.00% 25,000 25,000 25,000 25,000 25,000 25,000 25,000
Total Goal Funding (644,755) (664,170) (684,211) (744,899) (726,232) (748,234) (770,944) (794,388)
Total Taxes and Tax Penalty (428,560) (434,710) (440,899) (445,799) (453,230) (461,913) (467,275) (472,526)
Total Outflows (1,073,315) (1,098,880) (1,125,110) (1,190,698) (1,179,462) (1,210,147) (1,238,219) (1,266,914)
Cash Surplus/Deficit (NetIncome)
(837,414) (861,641) (886,507) (950,703) (938,046) (967,283) (993,878) (1,021,066)
Portfolio Value
Scenario : Current Scenario using Average Returns

Worksheet Detail - Retirement Distribution Cash Flow Chart
01/29/2019
Prepared for : Jim and Anne Sample Company: R. W. Baird Prepared by: Baird Advisor
Page 50 of 68
See Important Disclosure Information section in this Report for explanations of assumptions, limitations, methodologies, and a glossary.
202974 / 73
203075 / 74
203176 / 75
203277 / 76
203378 / 77
203479 / 78
203580 / 79
203681 / 80
YearAge (Jim / Anne)
Future Dollars
Beginning Value 22,004,368 22,251,346 22,485,469 22,705,404 22,869,069 23,054,391 23,218,456 23,362,894
Strategy Reductions 0 0 0 0 0 0 0 0
Investment Earnings 1,084,393 1,095,765 1,106,441 1,114,368 1,123,368 1,131,349 1,138,316 1,144,240
Cash Surplus/Deficit (837,414) (861,641) (886,507) (950,703) (938,046) (967,283) (993,878) (1,021,066)
Investment Asset Additions 0 0 0 0 0 0 0 0
Ending Value 22,251,346 22,485,469 22,705,404 22,869,069 23,054,391 23,218,456 23,362,894 23,486,068
Current Dollars
Ending Value 16,557,091 16,243,982 15,925,113 15,572,723 15,241,668 14,903,043 14,558,983 14,209,457
Cash Surplus/Deficit (623,115) (622,468) (621,778) (647,382) (620,159) (620,862) (619,352) (617,762)
Taxes
Total Taxes 428,560 434,710 440,899 445,799 453,230 461,913 467,275 472,526
Tax Penalty 0 0 0 0 0 0 0 0
Federal Marginal Tax Rate 37.00% 37.00% 37.00% 37.00% 37.00% 37.00% 37.00% 37.00%
State Marginal and Local Tax Rate 7.65% 7.65% 7.65% 7.65% 7.65% 7.65% 7.65% 7.65%
Estimated Required MinimumDistribution (RMD)
Jim 198,668 208,031 217,796 226,900 237,460 247,180 257,184 267,464
Anne 28,668 30,024 31,439 32,914 34,290 35,886 37,355 38,867
Adjusted Portfolio Value 22,004,368 22,251,346 22,485,469 22,705,404 22,869,069 23,054,391 23,218,456 23,362,894
Portfolio Withdrawal Rate 3.81% 3.87% 3.94% 4.19% 4.10% 4.20% 4.28% 4.37%
Scenario : Current Scenario using Average Returns

Worksheet Detail - Retirement Distribution Cash Flow Chart
01/29/2019
Prepared for : Jim and Anne Sample Company: R. W. Baird Prepared by: Baird Advisor
Page 51 of 68
See Important Disclosure Information section in this Report for explanations of assumptions, limitations, methodologies, and a glossary.
203782 / 81
203883 / 82
203984 / 83
204085 / 84
204186 / 85
204287 / 86
204388 / 87
204489 / 88
YearAge (Jim / Anne)
Retirement and Strategy Income Assign To
Pension 155,000Fund All Goals 155,000 155,000 155,000 155,000 155,000 155,000 155,000
Pension 4,000Fund All Goals 4,000 4,000 4,000 4,000 4,000 4,000 4,000
Social Security - Anne 34,698Fund All Goals 35,392 36,099 36,821 37,558 38,309 39,075 39,857
Social Security - Jim 43,687Fund All Goals 44,561 45,452 46,361 47,288 48,234 49,199 50,183
Variable Annuity with GMWB 10,000Fund All Goals 10,000 10,000 10,000 10,000 10,000 10,000 10,000
Total Retirement and StrategyIncome
247,385 248,953 250,552 252,183 253,846 255,543 257,274 259,040
Other Additions Assign To
AIG 10-Year Fixed Annuity 0Fund All Goals 0 0 0 0 0 0 0
Deferred Compensation 0Fund All Goals 0 0 0 0 0 0 0
Second to Die Policy 0Fund All Goals 0 0 0 0 0 0 0
Total Other Additions 0 0 0 0 0 0 0 0
Total Income 247,385 248,953 250,552 252,183 253,846 255,543 257,274 259,040
Cash Used To Fund GoalsEstimated %Funded
Health Care 46,221100.00% 48,748 51,362 54,118 57,028 60,098 63,325 66,694
Retirement - Living Expense 723,534100.00% 745,240 767,597 790,625 814,344 838,774 863,937 889,856
College - Daughter 0100.00% 0 0 0 0 0 0 0
New Vehicle 40,000100.00% 0 0 0 0 40,000 0 0
Annual Exclusion Gifts to Brian 23,834100.00% 24,549 25,286 26,044 26,825 27,630 28,459 29,313
Charitable Gifts 25,000100.00% 25,000 25,000 25,000 25,000 25,000 25,000 25,000
Total Goal Funding (858,589) (843,537) (869,245) (895,788) (923,198) (991,503) (980,721) (1,010,863)
Total Taxes and Tax Penalty (476,817) (481,751) (486,495) (490,047) (493,065) (494,796) (496,803) (498,213)
Total Outflows (1,335,406) (1,325,288) (1,355,740) (1,385,835) (1,416,263) (1,486,298) (1,477,525) (1,509,076)
Cash Surplus/Deficit (NetIncome)
(1,088,021) (1,076,336) (1,105,189) (1,133,652) (1,162,417) (1,230,755) (1,220,251) (1,250,037)
Portfolio Value
Scenario : Current Scenario using Average Returns

Worksheet Detail - Retirement Distribution Cash Flow Chart
01/29/2019
Prepared for : Jim and Anne Sample Company: R. W. Baird Prepared by: Baird Advisor
Page 52 of 68
See Important Disclosure Information section in this Report for explanations of assumptions, limitations, methodologies, and a glossary.
203782 / 81
203883 / 82
203984 / 83
204085 / 84
204186 / 85
204287 / 86
204388 / 87
204489 / 88
YearAge (Jim / Anne)
Future Dollars
Beginning Value 23,486,068 23,545,081 23,619,302 23,666,888 23,686,857 23,677,465 23,595,600 23,520,413
Strategy Reductions 0 0 0 0 0 0 0 0
Investment Earnings 1,147,034 1,150,558 1,152,774 1,153,621 1,153,025 1,148,890 1,145,064 1,139,502
Cash Surplus/Deficit (1,088,021) (1,076,336) (1,105,189) (1,133,652) (1,162,417) (1,230,755) (1,220,251) (1,250,037)
Investment Asset Additions 0 0 0 0 0 0 0 0
Ending Value 23,545,081 23,619,302 23,666,888 23,686,857 23,677,465 23,595,600 23,520,413 23,409,878
Current Dollars
Ending Value 13,830,253 13,469,758 13,103,782 12,732,853 12,357,092 11,955,696 11,570,485 11,180,688
Cash Surplus/Deficit (639,098) (613,819) (611,916) (609,394) (606,657) (623,613) (600,283) (597,025)
Taxes
Total Taxes 476,817 481,751 486,495 490,047 493,065 494,796 496,803 498,213
Tax Penalty 0 0 0 0 0 0 0 0
Federal Marginal Tax Rate 37.00% 37.00% 37.00% 37.00% 37.00% 37.00% 37.00% 37.00%
State Marginal and Local Tax Rate 7.65% 7.65% 7.65% 7.65% 7.65% 7.65% 7.65% 7.65%
Estimated Required MinimumDistribution (RMD)
Jim 278,007 288,798 299,816 308,931 317,997 326,956 335,744 344,281
Anne 40,420 42,014 43,645 45,310 46,687 48,057 49,411 50,739
Adjusted Portfolio Value 23,486,068 23,545,081 23,619,302 23,666,888 23,686,857 23,677,465 23,595,600 23,520,413
Portfolio Withdrawal Rate 4.63% 4.57% 4.68% 4.79% 4.91% 5.20% 5.17% 5.31%
Scenario : Current Scenario using Average Returns

Worksheet Detail - Retirement Distribution Cash Flow Chart
01/29/2019
Prepared for : Jim and Anne Sample Company: R. W. Baird Prepared by: Baird Advisor
Page 53 of 68
See Important Disclosure Information section in this Report for explanations of assumptions, limitations, methodologies, and a glossary.
204590 / 89
204691 / 90
204792 / 91
204893 / 92
204994 / 93
205095 / 94
2051- / 95
YearAge (Jim / Anne)
Retirement and Strategy Income Assign To
Pension 155,000Fund All Goals 155,000 155,000 155,000 155,000 155,000 0
Pension 4,000Fund All Goals 4,000 4,000 4,000 4,000 4,000 4,000
Social Security - Anne 40,654Fund All Goals 41,467 42,296 43,142 44,005 44,885 57,644
Social Security - Jim 51,187Fund All Goals 52,210 53,254 54,320 55,406 56,514 0
Variable Annuity with GMWB 10,000Fund All Goals 10,000 10,000 10,000 10,000 10,000 0
Total Retirement and StrategyIncome
260,840 262,677 264,551 266,462 268,411 270,399 61,644
Other Additions Assign To
AIG 10-Year Fixed Annuity 0Fund All Goals 0 0 0 0 0 0
Deferred Compensation 0Fund All Goals 0 0 0 0 0 0
Second to Die Policy 0Fund All Goals 0 0 0 0 0 643,771
Total Other Additions 0 0 0 0 0 0 643,771
Total Income 260,840 262,677 264,551 266,462 268,411 270,399 705,415
Cash Used To Fund GoalsEstimated %Funded
Health Care 70,254100.00% 74,019 77,931 82,008 86,253 90,655 47,272
Retirement - Living Expense 916,551100.00% 944,048 972,369 1,001,540 1,031,587 1,062,534 939,905
College - Daughter 0100.00% 0 0 0 0 0 0
New Vehicle 0100.00% 0 40,000 0 0 0 0
Annual Exclusion Gifts to Brian 30,192100.00% 31,098 32,031 32,992 33,982 35,001 36,051
Charitable Gifts 25,000100.00% 25,000 25,000 25,000 25,000 25,000 25,000
Total Goal Funding (1,041,998) (1,074,165) (1,147,331) (1,141,541) (1,176,821) (1,213,190) (1,048,229)
Total Taxes and Tax Penalty (497,518) (496,364) (493,472) (490,269) (484,107) (476,294) (465,270)
Total Outflows (1,539,516) (1,570,529) (1,640,804) (1,631,809) (1,660,927) (1,689,484) (1,513,499)
Cash Surplus/Deficit (NetIncome)
(1,278,676) (1,307,852) (1,376,253) (1,365,348) (1,392,516) (1,419,085) (808,084)
Portfolio Value
Scenario : Current Scenario using Average Returns

Worksheet Detail - Retirement Distribution Cash Flow Chart
01/29/2019
Prepared for : Jim and Anne Sample Company: R. W. Baird Prepared by: Baird Advisor
Page 54 of 68
See Important Disclosure Information section in this Report for explanations of assumptions, limitations, methodologies, and a glossary.
204590 / 89
204691 / 90
204792 / 91
204893 / 92
204994 / 93
205095 / 94
2051- / 95
YearAge (Jim / Anne)
Future Dollars
Beginning Value 23,409,878 23,263,355 23,078,449 22,811,955 22,543,042 22,231,526 21,875,838
Strategy Reductions 0 0 0 0 0 0 0
Investment Earnings 1,132,152 1,122,946 1,109,759 1,096,435 1,081,000 1,063,397 1,077,536
Cash Surplus/Deficit (1,278,676) (1,307,852) (1,376,253) (1,365,348) (1,392,516) (1,419,085) (808,084)
Investment Asset Additions 0 0 0 0 0 0 0
Ending Value 23,263,355 23,078,449 22,811,955 22,543,042 22,231,526 21,875,838 22,145,291
Current Dollars
Ending Value 10,787,095 10,389,665 9,970,575 9,566,058 9,159,094 8,750,054 8,599,837
Cash Surplus/Deficit (592,915) (588,781) (601,528) (579,380) (573,698) (567,616) (313,809)
Taxes
Total Taxes 497,518 496,364 493,472 490,269 484,107 476,294 465,270
Tax Penalty 0 0 0 0 0 0 0
Federal Marginal Tax Rate 37.00% 35.00% 35.00% 35.00% 35.00% 35.00% 35.00%
State Marginal and Local Tax Rate 7.65% 7.65% 7.65% 7.65% 7.65% 7.65% 7.65%
Estimated Required MinimumDistribution (RMD)
Jim 349,383 353,844 357,551 360,375 358,189 354,813 0
Anne 52,029 52,800 53,475 54,035 54,462 54,131 383,394
Adjusted Portfolio Value 23,409,878 23,263,355 23,078,449 22,811,955 22,543,042 22,231,526 22,519,609
Portfolio Withdrawal Rate 5.46% 5.62% 5.96% 5.99% 6.18% 6.38% 6.45%
Scenario : Current Scenario using Average Returns

Worksheet Detail - Retirement Distribution Cash Flow Chart
01/29/2019
Prepared for : Jim and Anne Sample Company: R. W. Baird Prepared by: Baird Advisor
Page 55 of 68
See Important Disclosure Information section in this Report for explanations of assumptions, limitations, methodologies, and a glossary.
Scenario : Current Scenario using Average Returns
• When married, if either Social Security Program Estimate or Use This Amount and EvaluateAnnually is selected for a participant, the program will default to the greater of the selectedbenefit or the age adjusted spousal benefit based on the other participant's benefit.
• The Income section includes Retirement Income, Strategy Income, Stock Options, RestrictedStock, Other Assets, proceeds from Insurance Policies, and any remaining asset value after72(t) distributions have been completed.
• Retirement Income includes the following: Social Security, pension, annuity, rental property,royalty, alimony, part-time employment, trust, and any other retirement income as entered in thePlan.
• Additions and withdrawals occur at the beginning of the year.
• Income from Other Assets and proceeds from Insurance Policies are after-tax values. Anyremaining asset value after 72(t) distributions have been completed is a pre-tax value.
Notes
• Investment Earnings are calculated on all assets after any withdrawals for funding goals, taxeson withdrawals, and tax penalties, if applicable, are subtracted.
• Shortfalls that occur in a particular year are denoted with an 'x' in the Cash Used to Fund Goalssection of the chart.
• Strategy Income is based on the particulars of the Goal Strategies selected. Strategy Incomefrom immediate annuities, 72(t) distributions, and variable annuities with a guaranteed minimumwithdrawal benefit (GMWB) is pre-tax. Strategy Income from Net Unrealized Appreciation (NUA)is after-tax.
• Stock Options and Restricted Stock values are after-tax.
• Portfolio Withdrawal Rate (%) is the percentage withdrawn from the investment portfolio tocover cash deficits.
• The Total Taxes are a sum of (1) taxes on retirement income, (2) taxes on strategy income, (3)taxes on withdrawals from qualified assets for Required Minimum Distributions, (4) taxes onwithdrawals from taxable assets' untaxed gain used to fund Goals in that year, (5) taxes onwithdrawals from tax-deferred or qualified assets used to fund goals in that year, and (6) taxes onthe investment earnings of taxable assets. Tax rates used are detailed in the Tax and InflationOptions page. (Please note, the Total Taxes do not include any taxes owed from the exercise ofStock Options or the vesting of Restricted Stock.)
• Tax Penalties can occur when Qualified and Tax-Deferred Assets are used prior to age 59½. Ifthere is a value in this row, it illustrates that you are using your assets in this Plan in a mannerthat may incur tax penalties. Generally, it is better to avoid tax penalties whenever possible.
• The Cash Surplus/Deficit is the net change in the Portfolio Value for the specified year. Thisvalue is your income and earnings minus what was spent to fund goals minus taxes.
• The Ending Value of the Portfolio in Current Dollars is calculated by discounting the EndingValue of the Portfolio in Future Dollars by the Base Inflation Rate for this Plan.
• The Cash Surplus/Deficit in Current Dollars is calculated by discounting the Cash Surplus/Deficitin Future Dollars by the Base Inflation Rate for this Plan.
• These calculations do not incorporate penalties associated with use of 529 Plan withdrawals fornon-qualified expenses.
• When married, ownership of qualified assets is assumed to roll over to the surviving co-client atthe death of the original owner. It is also assumed the surviving co-client inherits all assets of theoriginal owner.

Risk Management

Life Insurance Needs Analysis
01/29/2019
Prepared for : Jim and Anne Sample Company: R. W. Baird Prepared by: Baird Advisor
Page 56 of 68
See Important Disclosure Information section in this Report for explanations of assumptions, limitations, methodologies, and a glossary.
Life insurance can be an important source of funds for your family in the event of your premature death. In this section, we analyzewhether there are sufficient investment assets and other resources to support your family if you were to die this year and, if there is adeficit, what additional life insurance may be required to provide the income needed by your survivors.
If Jim Dies
Living Expenses covered until Anne is 95
If Anne Dies
Living Expenses covered until Jim is 95
Life Insurance Needed
Existing Life Insurance
Additional Needed
$4,183,429
$0
$4,183,429
$0
$100,000
$0
Scenario : Current Scenario

Disability Needs Analysis - Jim
01/29/2019
Prepared for : Jim and Anne Sample Company: R. W. Baird Prepared by: Baird Advisor
Page 57 of 68
See Important Disclosure Information section in this Report for explanations of assumptions, limitations, methodologies, and a glossary.
Disability Insurance can provide an important source of funds during the time when you are unable to work due to a prolonged illness orinjury. This section compares your income needs to your income sources for various disability periods. If there is an Income Shortfall, youmay want to consider the purchase of a Disability Insurance Policy.
IncomeNeeded
EmploymentIncome
Other Income Social SecurityBenefit
Group*Insurance
PersonalInsurance
Surplus or(Shortfall)
Length ofDisability
1 year(s) $600,000 $200,000 $0 $0 $0 $0 -$400,000
2 year(s) $618,000 $206,000 $0 $0 $0 $0 -$412,000
3 year(s) $636,540 $212,180 $0 $0 $0 $0 -$424,360
* The benefit amount may include an after-tax portion that has been grossed up to reflect its pre-tax value.
If Jim is Disabled

Disability Needs Analysis - Jim
01/29/2019
Prepared for : Jim and Anne Sample Company: R. W. Baird Prepared by: Baird Advisor
Page 58 of 68
See Important Disclosure Information section in this Report for explanations of assumptions, limitations, methodologies, and a glossary.
Do you want to include Social Security Disability Benefits in the analysis?
Social Security
No
Refine Needs Analysis
Income Needed (pre-tax, current dollars)
During the first year During these years
Month 1
Month 2 & 3
Month 4 & 5
Month 6 - 12
Year 2
Year 3 - 5
Year 6 to Age 65
$50,000 per month
$50,000 per month
$50,000 per month
$50,000 per month
$50,000 per month
$50,000 per month
$50,000 per month
$600,000 per year
$600,000 per year
$600,000 per year
All amounts in this table are monthly, pre-tax amounts.
Surplus or Shortfall During First Year
IncomeNeeded
EmploymentIncome
Other Income Social SecurityBenefit
Group*Insurance
PersonalInsurance
Surplus or(Shortfall)
First Year -Month
1 $50,000 $16,667 $0 $0 $0 $0 -$33,333
2 $50,000 $16,667 $0 $0 $0 $0 -$33,333
3 $50,000 $16,667 $0 $0 $0 $0 -$33,333
4 $50,000 $16,667 $0 $0 $0 $0 -$33,333
5 $50,000 $16,667 $0 $0 $0 $0 -$33,333
6 $50,000 $16,667 $0 $0 $0 $0 -$33,333
7 $50,000 $16,667 $0 $0 $0 $0 -$33,333
8 $50,000 $16,667 $0 $0 $0 $0 -$33,333
9 $50,000 $16,667 $0 $0 $0 $0 -$33,333
10 $50,000 $16,667 $0 $0 $0 $0 -$33,333
11 $50,000 $16,667 $0 $0 $0 $0 -$33,333
12 $50,000 $16,667 $0 $0 $0 $0 -$33,333
* The benefit amount may include an after-tax portion that has been grossed up to reflect its pre-tax value.
If Jim is Disabled

Disability Needs Analysis - Jim
01/29/2019
Prepared for : Jim and Anne Sample Company: R. W. Baird Prepared by: Baird Advisor
Page 59 of 68
See Important Disclosure Information section in this Report for explanations of assumptions, limitations, methodologies, and a glossary.
All amounts in this table are annual, pre-tax amounts.
Surplus or Shortfall by Age
IncomeNeeded
EmploymentIncome
Other Income Social SecurityBenefit
Group*Insurance
PersonalInsurance
Surplus or(Shortfall)
Age
64 $618,000 $206,000 $0 $0 $0 $0 -$412,000
65 $636,540 $212,180 $0 $0 $0 $0 -$424,360
* The benefit amount may include an after-tax portion that has been grossed up to reflect its pre-tax value.
• Disability benefits may be subject to an elimination period or benefit age cap.
• Income Needed is the amount you have indicated is necessary to maintain your standard of living during the disability period.
Notes
If Jim is Disabled

Long-Term Care Needs Analysis - Jim
01/29/2019
Prepared for : Jim and Anne Sample Company: R. W. Baird Prepared by: Baird Advisor
Page 60 of 68
See Important Disclosure Information section in this Report for explanations of assumptions, limitations, methodologies, and a glossary.
This graph shows what would happen to your portfolio if Jim enters a Nursing Home at age 80 for 3 years at an annual cost, in CurrentDollars, of $97,455 inflating at 5.00%.
Total Cost of Long-Term Care : $670,638
Scenario : Baird Model
Total of Existing Long-Term Care PolicyBenefits :
$0
Total Benefits from purchasing a newLong-Term Care Policy :
$0
Amount offset by expense reductionduring care period :
$495,999
Net Cost of care to be paid fromPortfolio :
$174,639
One of the greatest threats to the financial well-being of many people over 50 is the possible need for an extended period of Long-TermCare, either at home, in an Assisted Living Facility or in a Nursing Home. This Section demonstrates how these expenses could adverselyaffect your Investment Portfolio and how you might protect it with a Long-Term Care policy.

Estate Analysis

Estate Analysis Results Combined Summary
01/29/2019
Prepared for : Jim and Anne Sample Company: R. W. Baird Prepared by: Baird Advisor
Page 61 of 68
See Important Disclosure Information section in this Report for explanations of assumptions, limitations, methodologies, and a glossary.
Other Previous Gifts : $0
Amount to Heirs : $16,645,328
Federal Estate Tax : -$3,830,219
Estate Expenses : -$1,378,750
Amount to Heirs
Net Estate Value : $16,645,328
Bypass Trust : $0
Life Insurance in Trust : $0
Total Transfer to Heirs : $16,645,328
Cash Needed to Pay Tax and Expenses
Shortfall at First Death : $0
Current Estate
Other Life Insurance : $0
State Estate Tax : $0
Will without BypassTrust
Life Insurance To Charity : $0
Shortfall at Second Death : $0
Bypass Trust Funding
Funding Shortfall : $5,450,000
• Prior gifts are not included in the amount to heirs.
Notes
Using Baird Model - Both Die today - Jim Predeceases Anne, Both Dying in Wisconsin

Estate Analysis Results Flowchart
01/29/2019
Prepared for : Jim and Anne Sample Company: R. W. Baird Prepared by: Baird Advisor
Page 62 of 68
See Important Disclosure Information section in this Report for explanations of assumptions, limitations, methodologies, and a glossary.
Coverdell ESAs$0
Using Baird Model - Both Die today - Jim Predeceases Anne, Current Estate - Will without Bypass Trust
Qualified Assets$3,169,297
Roth Assets$0
Tax-DeferredAssets
$130,000
Taxable Assets$4,987,500
Tax-Free Assets$0
State TaxableTax-Free Accounts
$0
Other Assets$11,375,000
Life Insurance$250,000
1st Death Probate$305,000
1st DeathAdmin/Fixed Cost
$0
1st Death EstateTaxes
$0
1st Death FuneralExpenses$10,000
Gross Estate$19,911,797
Other LifeInsurance
$0
Marital Deduction$19,596,797
Coverdell ESAs$0
Qualified Assets$3,649,297
Roth Assets$0
Tax-DeferredAssets
$130,000
Taxable Assets$5,410,000
Tax-Free Assets$0
State TaxableTax-Free Accounts
$0
Other Assets$12,250,000
Life Insurance$100,000
2nd DeathProbate
$903,750
2nd Death EstateTaxes
$3,830,219
2nd DeathAdmin/Fixed Cost
$0
2nd DeathFuneral Expenses
$10,000
Gross Estate$21,539,297
Other LifeInsurance
$0
Net Estate Value$16,645,328
Lifetime PreviousGifts$0
Other LifeInsurance
$0+ +
Liabilities$150,000
Total Amount to Heirs$16,645,328
Jim
Anne
Notes
• Gross Estate amounts may include the value of reverted gifts. • Gross Estate amounts do not include the value of prior gifts.
• Other Life Insurance includes policies where the first person to die is the owner andinsured and the beneficiary of the policy is not the co-client or estate.
• The Bypass Trust may not be fully funded to the available estate exemption equivalentamount due to prior gifts, titling of assets, insufficient resources, and/or other bequests.

Estate Analysis Results Flowchart
01/29/2019
Prepared for : Jim and Anne Sample Company: R. W. Baird Prepared by: Baird Advisor
Page 63 of 68
See Important Disclosure Information section in this Report for explanations of assumptions, limitations, methodologies, and a glossary.
Coverdell ESAs$0
Using Baird Model - Both Die today - Jim Predeceases Anne, Current Estate - Will with Bypass Trust
Qualified Assets$3,169,297
Roth Assets$0
Tax-DeferredAssets
$130,000
Taxable Assets$4,987,500
Tax-Free Assets$0
State TaxableTax-Free Accounts
$0
Other Assets$11,375,000
Life Insurance$250,000
1st Death Probate$305,000
1st DeathAdmin/Fixed Cost
$0
1st Death EstateTaxes
$0
1st Death FuneralExpenses$10,000
Gross Estate$19,911,797
Other LifeInsurance
$0
Bypass Trust$4,435,000
Marital Deduction$15,161,797
Coverdell ESAs$0
Qualified Assets$3,649,297
Roth Assets$0
Tax-DeferredAssets
$130,000
Taxable Assets$1,225,000
Tax-Free Assets$0
State TaxableTax-Free Accounts
$0
Other Assets$11,750,000
Life Insurance$100,000
2nd DeathProbate
$669,500
2nd Death EstateTaxes
$3,823,919
2nd DeathAdmin/Fixed Cost
$0
2nd DeathFuneral Expenses
$10,000
Gross Estate$16,854,297
Other LifeInsurance
$0
Bypass Trust$0
Net Estate Value$12,200,878
Lifetime PreviousGifts$0
Other LifeInsurance
$0
Bypass Trust$4,435,000
+ + +
Liabilities$150,000
Total Amount to Heirs$16,635,878
Jim
Anne
Notes
• Gross Estate amounts may include the value of reverted gifts. • Gross Estate amounts do not include the value of prior gifts.
• Other Life Insurance includes policies where the first person to die is the owner andinsured and the beneficiary of the policy is not the co-client or estate.
• The Bypass Trust may not be fully funded to the available estate exemption equivalentamount due to prior gifts, titling of assets, insufficient resources, and/or other bequests.

Star Track

Star Track
01/29/2019
Prepared for : Jim and Anne Sample Company: R. W. Baird Prepared by: Baird Advisor
Page 64 of 68
See Important Disclosure Information section in this Report for explanations of assumptions, limitations, methodologies, and a glossary.
Star Track History
The Star Track History graph illustrates the progress you’ve made towardattaining your Goals over time. Each bar reflects the projected results ofyour Recommended Plan, as recorded on the date indicated. Data in eachbar can differ substantially in assets included, goal values, and otherunderlying data. Patterned bars, if shown, were created automatically andmay reflect asset values that were not fully updated.
The shows the Probability of Success for your Recommended Scenario.
The shows the Probability of Success for your Current Scenario.
Total Goal Spending
The Total Goal Spending graph provides a quick view of how your Goalshave changed over time. The graph plots the Total Goal Spendingrequired to fund all of your Goals. Each set of data points corresponds toa bar in the Star Track History graph above.
The shows the Total Goal Spending for your Recommended Scenario.
The shows the Total Goal Spending for your Current Scenario.
Net Worth and Investment Portfolio
This graph shows your Net Worth and Investment Portfolio values at eachdate recorded.
Star Track is not intended to track the performance of assets included inyour Plan. Refer to official statements you receive from the productsponsor for accurate account values.

Glossary
01/29/2019
Prepared for : Jim and Anne Sample Company: R. W. Baird Prepared by: Baird Advisor
Page 65 of 68
Aspirational Cash Reserve Strategy
This optional strategy simulates setting aside funds to establish an account to fund goalsoutside of your plan. These funds are segmented out of the investment portfolio and arenever spent. Rather, the assets are grown based on the specified investment option and thepotential balances are displayed. Generally, this strategy is included when you have excessfunds after fulfilling your financial goals and used to create a legacy or to fund discretionaryobjectives.
Asset Allocation
Bonds are either domestic (U.S.) or global debt securities issued by either privatecorporations or governments. (See the “Risks Inherent in Investing” section in thisImportant Disclosure Information for a summary of the risks associated with investing inbonds. Bonds are also called “fixed income securities.”)
Bonds
Cash typically includes bank accounts or certificates of deposit, which are insured by theFederal Deposit Insurance Corporation up to a limit per account. Cash Alternatives typicallyinclude money market securities, U.S. treasury bills, and other investments that are readilyconvertible to cash, have a stable market value, and a very short-term maturity. U.S.Treasury bills are backed by the full faith and credit of the U.S. Government and, whenheld to maturity, provide safety of principal. (See the “Risks Inherent in Investing” sectionin this Important Disclosure Information for a summary of the risks associated withinvesting in cash alternatives.)
Asset Class
Asset Class is a standard term that broadly defines a category of investments. The threebasic asset classes are Cash, Bonds, and Stocks. Bonds and Stocks are often furthersubdivided into more narrowly defined classes. Some of the most common asset classes aredefined below.
Cash and Cash Alternatives
Asset Allocation is the process of determining what portions of your portfolio holdings areto be invested in the various asset classes.
Glossary Domestic government bonds are backed by the full faith and credit of the U.S.Government and have superior liquidity and, when held to maturity, safety of principal.Domestic corporate bonds carry the credit risk of their issuers and thus usually offeradditional yield. Domestic government and corporate bonds can be sub-divided basedupon their term to maturity. Short-term bonds have an approximate term to maturity of 1to 5 years; intermediate-term bonds have an approximate term to maturity of 5 to 10years; and, long-term bonds have an approximate term to maturity greater than 10 years.
Stocks
Stocks are equity securities of domestic and foreign corporations. (See the “Risks Inherentin Investing” section in this Important Disclosure Information for a summary of the risksassociated with investing in stocks.)
Domestic stocks are equity securities of U.S. corporations. Domestic stocks are oftensub-divided based upon the market capitalization of the company (the market value of thecompany's stock). "Large cap" stocks are from larger companies, "mid cap" from themiddle range of companies, and "small cap" from smaller, perhaps newer, companies.Generally, small cap stocks experience greater market volatility than stocks of companieswith larger capitalization. Small cap stocks are generally those from companies whosecapitalization is less than $500 million, mid cap stocks those between $500 million and $5billion, and large cap over $5 billion.
Large cap, mid cap and small cap may be further sub-divided into "growth" and "value"categories. Growth companies are those with an orientation towards growth, oftencharacterized by commonly used metrics such as higher price-to-book andprice-to-earnings ratios. Analogously, value companies are those with an orientationtowards value, often characterized by commonly used metrics such as lower price-to-bookand price-to-earnings ratios.
International stocks are equity securities from foreign corporations. International stocks areoften sub-divided into those from "developed" countries and those from "emergingmarkets." The emerging markets are in less developed countries with emerging economiesthat may be characterized by lower income per capita, less developed infrastructure andnascent capital markets. These "emerging markets" usually are less economically andpolitically stable than the "developed markets." Investing in international stocks involvesspecial risks, among which include foreign exchange volatility and risks of investing underdifferent tax, regulatory and accounting standards.
Asset Mix
Asset Mix is the combination of asset classes within a portfolio, and is usually expressed as apercentage for each asset class.

Glossary
01/29/2019
Prepared for : Jim and Anne Sample Company: R. W. Baird Prepared by: Baird Advisor
Page 66 of 68
Base Inflation Rate
The Base Inflation Rate is the default inflation rate in the Program. You can adjust this ratein financial goal expenses, retirement income sources, savings rates, and in each What Ifscenario. Also see “Inflation Rate.”
Bear Market Test
The Bear Market Test, included in the Stress Tests, examines the impact on your Plan resultsif a Bear Market Loss occurred this year. The Bear Market Test shows the likelihood that youcould fund your Needs, Wants and Wishes after experiencing such an event. See BearMarket Loss.
Bond Bear Market Return
The Bond Bear Market Return is the rate of return for a cash-bond-stock-alternativeportfolio during the Bond Bear Market (July 1979 through February 1980), the worst bearmarket for bonds since the Great Depression. MoneyGuidePro shows a Bond Bear MarketReturn for your Current, Risk-based, and Target Portfolios, calculated using historical returnsof four broad-based asset class indices. See Great Recession Return.
Cash Receipt Schedule
A Cash Receipt Schedule consists of one or more years of future after-tax amounts receivedfrom the anticipated sale of an Other Asset, exercising of Stock Options grants, or proceedsfrom Restricted Stock grants.
Bear Market Loss
The Bear Market Loss shows how a portfolio would have been impacted during the GreatRecession (November 2007 through February 2009) or the Bond Bear Market (July 1979through February 1980). The Bear Market Loss shows: 1) either the Great Recession Returnor the Bond Bear Market Return, whichever is lower, and 2) the potential loss, if you hadbeen invested in this cash-bond-stock-alternative portfolio during the period with the lowerreturn. See Bear Market Test, Great Recession Return, and Bond Bear Market Return.
Composite Portfolio
The Composite Portfolio provides an aggregated view of your Target Portfolio along withany assets that are considered to be unavailable for reallocation.
Concentrated Position
A Concentrated Position is when your portfolio contains a significant amount (as apercentage of the total portfolio value) in individual stock or bonds. Concentrated Positionshave the potential to increase the risk of your portfolio.
Confidence Zone
See Monte Carlo Confidence Zone.
Current Dollars
The Results of MoneyGuidePro calculations are in Future Dollars. To help you comparedollar amounts in different years, we also express the Results in Current Dollars, calculatedby discounting the Future Dollars by the sequence of inflation rates used in the Plan.
Current Portfolio
Your Current Portfolio is comprised of all the investment assets you currently own (or asubset of your assets, based on the information you provided for this Plan), categorized byAsset Class and Asset Mix.
Fund All Goals
Fund All Goals is one of two ways for your assets and retirement income to be used to fundyour goals. The other is Earmark, which means that an asset or retirement income isassigned to one or more goals, and will be used only for those goals. Fund All Goals meansthat the asset or income is not earmarked to fund specific goals, and can be used to fundany goal, as needed in the calculations.
Expense Adjustments
When using historical returns, some users of MoneyGuidePro include Expense Adjustments.These adjustments (which are specified by the user) reduce the return of the affected AssetClasses and are commonly used to account for transaction costs or other types of feesassociated with investing. If Expense Adjustments have been used in this Report, they willbe listed beside the historical indices at the beginning of this Report.
Future Dollars
Future Dollars are inflated dollars. The Results of MoneyGuidePro calculations are in FutureDollars. To help you compare dollar amounts in different years, we discount the FutureDollar amounts by the inflation rates used in the calculations and display the Results in theequivalent Current Dollars.
Great Recession Return
The Great Recession Return is the rate of return for a cash-bond-stock-alternative portfolioduring the Great Recession (November 2007 through February 2009), the worst bearmarket for stocks since the Great Depression. MoneyGuidePro shows a Great RecessionReturn for your Current, Risk-based, and Target Portfolios, calculated using historical returnsof four broad-based asset class indices. See Bond Bear Market Return.

Glossary
01/29/2019
Prepared for : Jim and Anne Sample Company: R. W. Baird Prepared by: Baird Advisor
Page 67 of 68
Inflation Rate
Inflation is the percentage increase in the cost of goods and services for a specified timeperiod. A historical measure of inflation is the Consumer Price Index (CPI). InMoneyGuidePro, the Inflation Rate is selected by your advisor, and can be adjusted indifferent scenarios.
Liquidity
Liquidity is the ease with which an investment can be converted into cash.
Locked Asset
An asset is considered to be locked by the software if it is unavailable to be reallocated tothe Target Portfolio. Any account that has been indicated as locked, as well as specificaccount types such as Variable Annuity with a Guaranteed Minimum Withdrawal Benefit areconsidered locked.
Model Portfolio Table
The Model Portfolio Table is the portfolio(s) that could be appropriate for you, basedupon the risk-based portfolio.
Monte Carlo Confidence Zone
The Monte Carlo Confidence Zone is the range of probabilities that you (and/or youradvisor) have selected as your target range for the Monte Carlo Probability of Success inyour Plan. The Confidence Zone reflects the Monte Carlo Probabilities of Success withwhich you would be comfortable, based upon your Plan, your specific time horizon, riskprofile, and other factors unique to you.
Monte Carlo Probability of Success / Probability of Failure
The Monte Carlo Probability of Success is the percentage of trials of your Plan that weresuccessful. If a Monte Carlo simulation runs your Plan 1,000 times, and if 600 of those runsare successful (i.e., all your goals are funded and you have at least $1 of Safety Margin),then the Probability of Success for that Plan, with all its underlying assumptions, would be60%, and the Probability of Failure would be 40%.
Monte Carlo Simulations
Monte Carlo simulations are used to show how variations in rates of return each year canaffect your results. A Monte Carlo simulation calculates the results of your Plan by runningit many times, each time using a different sequence of returns. Some sequences of returnswill give you better results, and some will give you worse results. These multiple trialsprovide a range of possible results, some successful (you would have met all your goals) andsome unsuccessful (you would not have met all your goals).
Needs / Wants / Wishes
In MoneyGuidePro, you choose an importance level from 10 to 1 (where 10 is the highest)for each of your financial goals. Then, the importance levels are divided into three groups:Needs, Wants, and Wishes. Needs are the goals that you consider necessary for yourlifestyle, and are the goals that you must fulfill. Wants are the goals that you would reallylike to fulfill, but could live without. Wishes are the “dream goals” that you would like tofund, although you won’t be too dissatisfied if you can’t fund them. In MoneyGuidePro,Needs are your most important goals, then Wants, then Wishes.
Portfolio Set
A Portfolio Set is a group of portfolios that provides a range of risk and return strategies fordifferent investors.
Portfolio Total Return
A Portfolio Total Return is determined by weighting the return assumption for each AssetClass according to the Asset Mix. Also see “Expense Adjustments.”
Probability of Success / Probability of Failure
See Monte Carlo Probability of Success / Probability of Failure.
Real Return
The Real Return is the Total Return of your portfolio minus the Inflation Rate.
Recommended Scenario
The Recommended Scenario is the scenario selected by your advisor to be shown on theResults page and in Play Zone.
Retirement Start Date
For married couples, retirement in MoneyGuidePro begins when both the client and spouseare retired. For single, divorced, or widowed clients, retirement begins when the clientretires.
Retirement Cash Reserve Strategy
This optional strategy simulates creating a cash account to provide funding for near-termgoal expenses. You select the number of years of Needs, Wants, and Wishes to be includedin the cash account. The Program then funds the Retirement Cash Reserve with thedesignated amounts, and simulates rebalancing your remaining investments to match theselected Target Portfolio.

Glossary
01/29/2019
Prepared for : Jim and Anne Sample Company: R. W. Baird Prepared by: Baird Advisor
Page 68 of 68
Risk
Risk is the chance that the actual return of an investment, asset class, or portfolio will bedifferent from its expected or average return.
Risk-based Portfolio
The risk-based portfolio is the Model Portfolio associated with the risk score you selected.
Safety Margin
The Safety Margin is the hypothetical portfolio value at the end of the Plan, based on all theinputs and assumptions included in this Report. A Safety Margin of zero indicates theportfolio was depleted before the Plan ended. The Safety Margin does not protect you oryour Target Portfolio from investment losses, and, as with all other results in the Plan, is notguaranteed.
Standard Deviation
Standard Deviation is a statistical measure of the volatility of an investment, an asset class,or a portfolio. It measures the degree by which an actual return might vary from theaverage return, or mean. Typically, the higher the standard deviation, the higher thepotential risk of the investment, asset class, or portfolio.
Star Track
Star Track provides a summary of your Plan results over time, using a bar graph. Each barshows the Monte Carlo Probability of Success for your Recommended Scenario, on the datespecified, compared to the Monte Carlo Probability of Success for a scenario using all Targetvalues.
Target Portfolio
Target Portfolio is the portfolio you have selected based upon your financial goals and yourrisk tolerance.
Target Retirement Age
Target Retirement Age is the age at which you would like to retire.
Target Goal Amount
The Target Goal Amount is the amount you would expect to spend, or the amount youwould like to spend, for each financial goal.
Target Savings Amount
In the Resources section of MoneyGuidePro, you enter the current annual additions beingmade to your investment assets. The total of these additions is your Target SavingsAmount.
Time Horizon
Time Horizon is the period from now until the time the assets in this portfolio will begin tobe used.
Total Return
Total Return is an assumed, hypothetical growth rate for a specified time period. The TotalReturn is either (1) the Portfolio Total Return or (2) as entered by you or your advisor. Alsosee “Real Return.”
Wants
See "Needs / Wants / Wishes".
Willingness
In MoneyGuidePro, in addition to specifying Target Goal Amounts, a Target SavingsAmount, and Target Retirement Ages, you also specify a Willingness to adjust these Targetvalues. The Willingness choices are Very Willing, Somewhat Willing, Slightly Willing, andNot at All.
Wishes
See "Needs / Wants / Wishes".
Worst One-Year Loss
The Worst One-Year Loss is the lowest annual return that a portfolio with the specified assetmix and asset class indices would have received during the historical period specified.