Prepared for SWAWWA · Clarifier Improvements Engineer and Operator Viewpoints Prepared for SWAWWA...
49
A.B. Jewell WTP Clarifier Improvements Engineer and Operator Viewpoints Prepared for SWAWWA Prepared By City of Tulsa and 14 October 2014
Transcript of Prepared for SWAWWA · Clarifier Improvements Engineer and Operator Viewpoints Prepared for SWAWWA...

A.B. Jewell WTP Clarifier Improvements
Engineer and Operator Viewpoints
Prepared forSWAWWA
Prepared By
City of Tulsaand
14 October 2014

Purpose
Provide overview of the A.B. Jewell WTP Clarifier Improvements project from the Engineer and Operator Perspectives.

Agenda
•Overview•Evaluation•Improvements•Operations

Agenda
•Overview•Evaluation•Improvements•Operations

A.B. Jewell WTP
Background• Initially constructed in 1970s as a 20 MGD facility.• Expanded in 1980s to 90 MGD and currently a 120
MGD facility. Annual Average of 60 MGD.
Source Water and Storage• Lake Oologah• Lynn Lane Reservoir, 1.25 billion gallons
Conventional Water Treatment Plant• Clarification, Filtration, Disinfection• Four (4) Clarifiers of 30 MGD each

AB Jewell WTP Site Plan – 1969
Clarifier No. 1
High Service Pump Station
Clearwell Lagoons
Filters

AB Jewell WTP Overview – 2014

Plant Operations
Operations Staff–Total Operations Staff: 13–4 shifts – 24/7 operation–8 Shift Operators (including 4 Leads)–5 Relief Operators spread out through the week.
Experience–Ranges from 1 to 15 years–4 staff with less than three years experience

Project Drivers
•Lifecycle–Equipment in Clarifier No. 1 in service 40
years–Replacement parts unavailable–Clarifier basin showing deterioration
•Expansion–Increased rated design capacity from 30 MGD
to 40 MGD
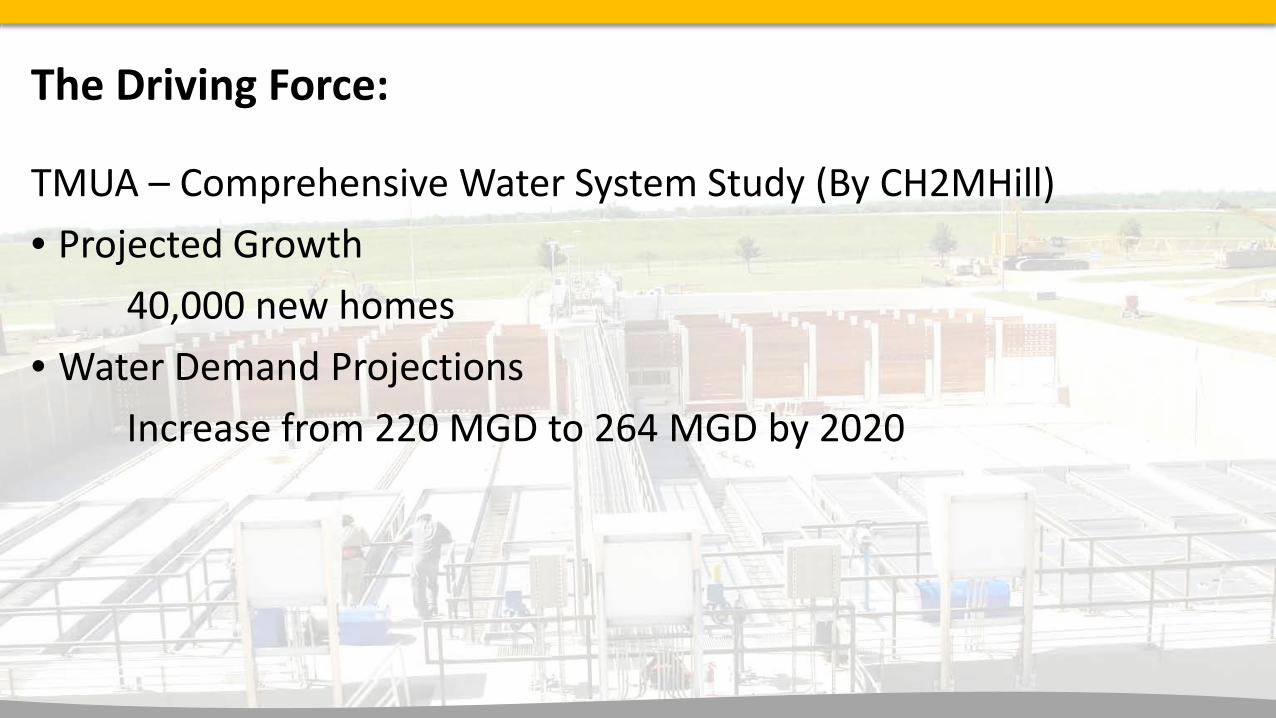
The Driving Force:
TMUA – Comprehensive Water System Study (By CH2MHill)• Projected Growth
40,000 new homes• Water Demand Projections
Increase from 220 MGD to 264 MGD by 2020

Historical Peak Demand

Operations Drivers
Why change?
What are the drawbacks?
Unknowns – (Reliability)• New Processes• New Sludge Removal System• Additional Maintenance Req’d

Operations Drivers
Benefits What are the benefits?• New Equipment• Increased Automation• Increased Safety
– Removal of Permit Required Confined Space
– Accessibility• Increased Capacity• Increased Flexibility
–New sludge line

Agenda
•Overview•Evaluation•Improvements•Operations

Evaluation

Technology Evaluation
•Flocculation–Mechanical - Paddle Wheel–Mechanical - Impeller–Hydraulic

Technology Evaluation
•Settling–Conventional Clarification (existing condition)–Upflow Solids Contact Units–Sand-Ballasted Sedimentation–Inclined Plate and Tube Setters

Evaluation
•Criteria –Production Reliability– Flexibility–Operability–Capacity Increases–Maintenance
–Operator Safety–Pathogen Removal–Disinfection By-Product Formation–Construction Period–Space Requirements–Costs
Evaluation
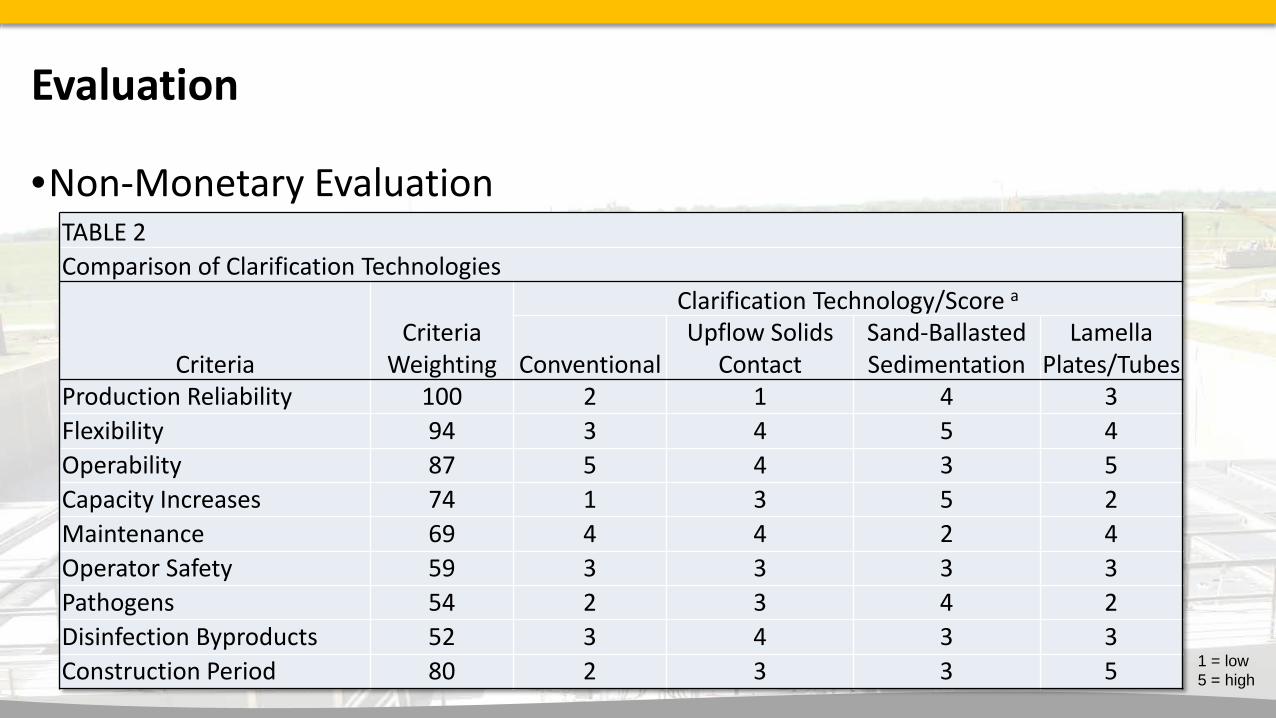
•Non-Monetary EvaluationTABLE 2Comparison of Clarification Technologies
CriteriaCriteria
Weighting
Clarification Technology/Score a
ConventionalUpflow Solids
ContactSand-Ballasted Sedimentation
Lamella Plates/Tubes
Production Reliability 100 2 1 4 3Flexibility 94 3 4 5 4Operability 87 5 4 3 5Capacity Increases 74 1 3 5 2Maintenance 69 4 4 2 4Operator Safety 59 3 3 3 3Pathogens 54 2 3 4 2Disinfection Byproducts 52 3 4 3 3Construction Period 80 2 3 3 5 1 = low
5 = high

Clarifier Evaluation
•CostsTABLE 3Cost Estimates for Clarifier Alternatives($ millions)
Alternative Total Present WorthPlate Settlers $6.79Tube Settlers $6.17Actiflo $9.76SuperPulsator $8.45Conventional $1.94(1) Markups = 21.23% (7% OH + 10% profit + 3% mob/bonds/ins)(2) Contingency = 30%

Clarifier Evaluation
•Conclusion: Plate Settlers• Increased settling capacity• Expanded coverage through a hoseless-vac sludge collection system• Minimized Construction Period• No Mechanical Parts• Minimized Operational Effort• Low Maintenance

Operations Benefits
• Same Footprint• Reduced Capital Cost• Sludge Draw Flexibility• Easier Clean-out

Regulatory Considerations
–Plate Settlers • Not included in ODEQ standards
–Flocculation• Area expanded to meet minimum detention time at 40 MGD
–Variance Request (2011)–Approved In Principle (2012)–Construction Permit (2013)–Additional Requirement
• One Year Monitoring and Testing (2014-2015)

Regulatory Considerations
• Monitoring and TestingClarifier No. 1 and Clarifier No. 2 effluent– Turbidity, pH– Total Organic Carbon, Dissolved Organic Carbon– Specific UV absorbance– Total trihalomethane formation potential– Haloacetic acid formation potential

Agenda
•Overview•Evaluation•Improvements•Operations

Clarifier Improvements
•Rapid Mix– Enlarged Flow Path for hydraulic considerations
•Flocculation– Additional fourth stage, 33% increase
•Sludge Collection– Hoseless-Vac Collection System
•Plate Settlers
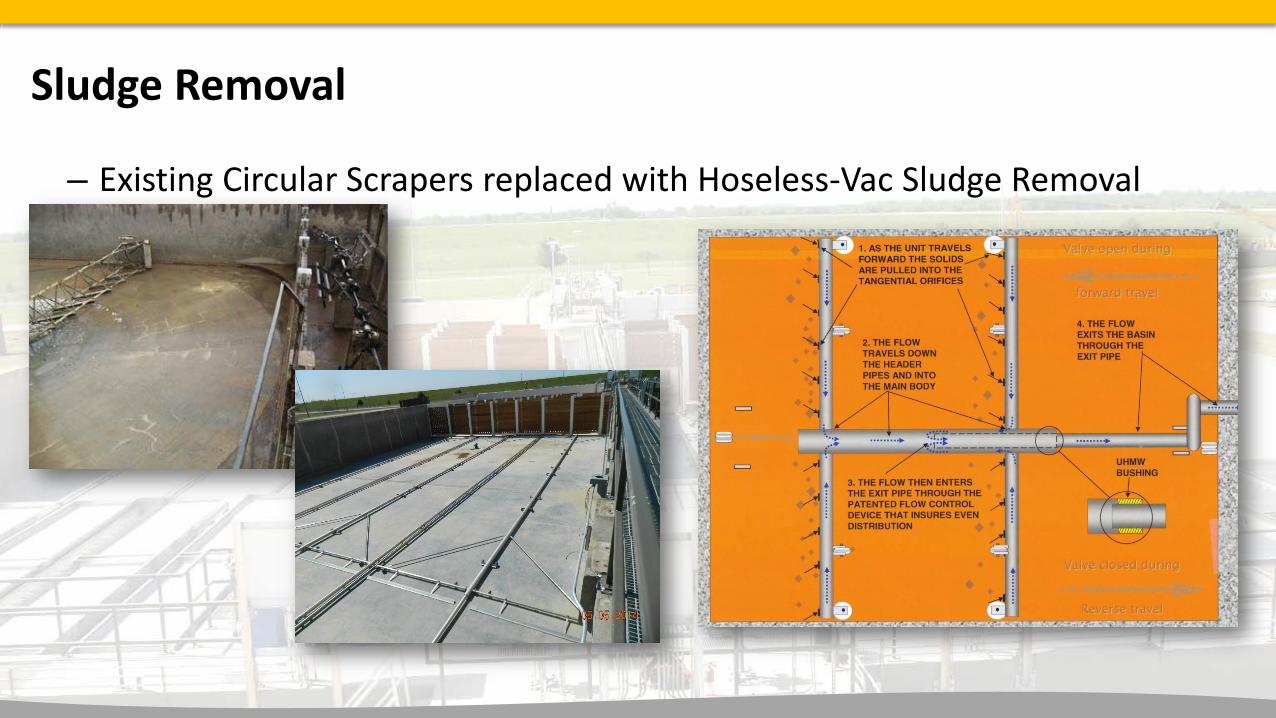
Sludge Removal
– Existing Circular Scrapers replaced with Hoseless-Vac Sludge Removal

Flocculation
– Flocculation Area expanded with additional Stage– New redwood baffle walls and new flocculator equipment

Plate Settlers

Plate Settlers

Collaboration of CH2MHILL and AB Jewell Staff
Design Review Meetings• 35%, 65%, 95% DesignTechnology Meeting with Major Equipment SupplierProgress meetings throughout Construction• Monthly• At times more frequentlyPersonal cell phone contactImpromptu MeetingsCH2MHILL showed flexibility/customer service

Operations Engagement
Methods• Brought in on Design Meetings
- Asked for input- Welcomed and valued ideas, listened- Implemented ideas, action
• Leads assisted with final inspections• Color choices

Operations Engagement
Touring Construction – Daily, continuous• Ideas flowed• More ideas implemented• Buy-in• Embrace the change

Operations Engagement
Ideas for Improvements • Additional sludge line, reduced complexity of overall sludge handling• Mechanism to hold hinged flocculator walls/access door• Leaving old sumps for draining/cleaning• Back-flushing connection for sludge line• Formatting of local control screens
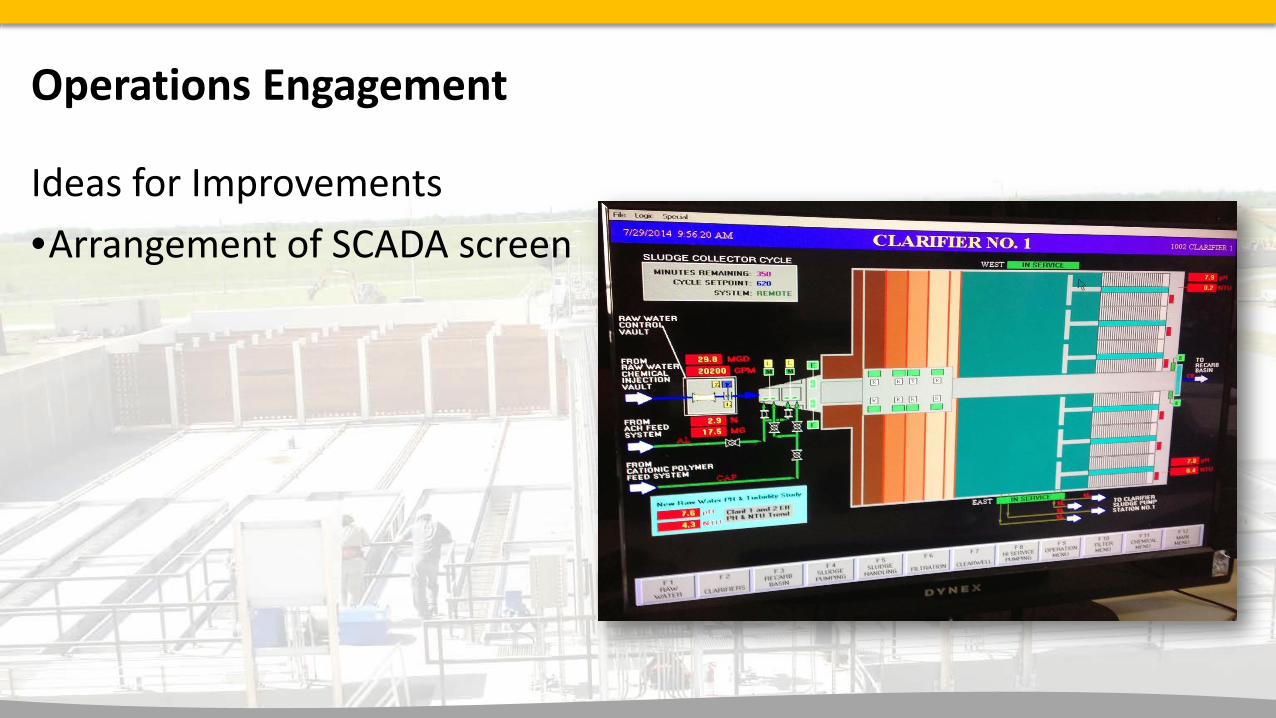
Operations Engagement
Ideas for Improvements •Arrangement of SCADA screen

Operations Engagement
Ideas for Improvements • Tee –Sludge Line
Agenda
•Overview•Evaluation•Improvements•Operations

Operational Differences at Clarifier No. 1
• Clarifier No. 1– Sludge Blanket Measurements
• Twice a day
– Change from 4 to 8 cycles a day to one cycle every 14 hours
–Monitor Sludge Collection System from SCADA

Differences at Clarifier No. 1
Increased Automation–From SCADA we can control
• Flow (previously existed)• Flocculator speed• Sludge pump speed (VFD)• Sludge valves• Sludge cycle timing• Hose-less vac sweep speed

Differences at Clarifier No. 1
Improvements:– Decrease in operational demand (↑ Reliability)– Less upsets/steady quality (↓ Wind effect)
• We believe due to plate settlers• Essentially same turbidity at 14 MGD as 40 MGD
– LCD screens provided additional information locally– Much more Flexibility
• Flocculator speed• Sludge draw
– Increased Solids % to thickeners– Simplistic cycle timing
• New sludge line

Clarifier Operations
Typical Day• 10-15 walk-thru twice daily
– Few minutes to check sludge depth– Few minutes to grab samples
Most time spent on a shift: 1 hour – Investigating a sheared pin Several hours cleaning algal growth on top of plate settlers

Clarifier Operations
• Chemical Use– Remained un-changed– Filter Run Time Extended
• Sludge Production– Remained un-changed, proportional to flow
• Sludge Handling– Increased efficiency
• One cycle every 14 hours• Covered greater clarifier area
Maintenance
Anticipated:• ↑ due to additional equip.• ↑ due to PLC’s and LCD screens stationed outside
• ↑ in adjustments to sludge system – fine tuning after flow changes
Experienced:• ↑ in routine maintenance associated with control panels
• Sludge system has been rather “hands-off”

Clarifier Operations
Lessons Learned:• Include influent/effluent valves next time• Integration of existing Symax PLC with new MicroLogix PLC• Ways to prevent algal growth or better access to remove• New Red-woods leach tannic acid for first few weeks

ODEQ Study – Turbidity Results
Clarifier No. 1
Clarifier No. 2

0.00
0.20
0.40
0.60
0.80
1.00
1.20
1.40
1.60
1.80
0.00 5.00 10.00 15.00 20.00 25.00 30.00 35.00 40.00 45.00
Aver
age
Daily
Cla
rifie
r Effl
uent
Tur
bidi
ty (N
TU
Average Daily Clarifier Flow (MGD)
Turbidity at Clarifer No. 1 and No. 2
Clarifier No. 1 East Clarifier No. 1 West Clarifier No. 2 North Clarifier No. 2 South
Clarifier Operations
• Lower Turbidity at Clarifier No. 1 across all flows

Clarifier Operations
•Lower Turbidity at Clarifier No. 1 with limited influence fromraw water turbidity
0.00
0.20
0.40
0.60
0.80
1.00
1.20
1.40
1.60
1.80
0.00 2.00 4.00 6.00 8.00 10.00 12.00 14.00Da
ily A
vera
ge C
larif
ier E
fflue
nt T
urbi
dity
(NTU
)
Daily Average Raw Water turbidity (NTU))
Turbidity at Clarifer No. 1 and No. 2
Clarifier No. 1 East Clarifier No. 1 West Clarifier No. 2 North Clarifier No. 2 South

Thank you
Lynn ScofieldEngineerCH2M [email protected]
Dustin DavisOperations SupervisorAB Jewell [email protected]

A.B. Jewell WTP Clarifier Improvements
Engineer and Operator Viewpoints
Prepared forSWAWWA
Prepared By
City of Tulsaand
14 October 2014