Prepared for Bay County Employees’ Retirement System County 4.24.14.pdfSection 3 Update on Bay...
29
April 24, 2014 Prepared for Bay County Employees’ Retirement System
Transcript of Prepared for Bay County Employees’ Retirement System County 4.24.14.pdfSection 3 Update on Bay...

1
April 24, 2014
Prepared for Bay County Employees’ Retirement System

2
Representing Baird Advisors
M. Sharon deGuzman Senior Vice President Senior Portfolio Manager Jeffrey L. Schrom, CFA Senior Vice President Senior Portfolio Manager

3
Table of Contents
Section 1 Firm Overview
Section 2 Market Update
Section 3 Update on Bay County Employees’ Retirement System

4
Section 1 Firm Overview

5
Overview of Baird Baird has been helping clients achieve their asset management, investment banking and private equity goals for over 90 years.
1919 Founded in Milwaukee
2004 Baird becomes employee-owned
$110 billion Assets under management
$1 billion Revenue
2,900 Employees
100+ Office locations on three continents*
11 Number of consecutive years Baird has been recognized as one of the FORTUNE 100 Best Companies to Work For®
1 Ranked No. 1 “most trusted” research in Greenwich Associates survey 2004-2013 “Cross Border Deal of the Year” for 2012 - The M&A Advisor
Baird’s International Presence
United States Europe Asia
Milwaukee Chicago New York London Frankfurt Hamburg Hong Kong San Francisco Palo Alto Atlanta Boston Philadelphia Tampa Washington, D.C. Beijing Shanghai Stamford Charlotte
Greenwich Associates U.S. Equity Investors – Small/Mid-Cap Funds, 2004-2013. Surveys conducted with 94 U.S. small-cap and mid-cap fund managers. Rankings based on top 10 research firms in survey. Baird ranked No. 1 for “Most Trusted” Research and No. 1 for “Top Five” Research Firms for Importance. * Baird and its operating affiliates have offices in the United States, Europe and Asia. Robert W. Baird Ltd. and Baird Capital Partners Europe are authorized and regulated in the UK by the Financial Conduct Authority.
A Comprehensive Financial Services Firm
Dedicated team focused on fixed income
Over $21.1 billion of assets under management as of March 31, 2014
Disciplined, research driven approach
Focus on superior customer service
Baird Advisors Highlights
Baird’s Complementary
Balance of Businesses
Asset Management
Equity Capital Markets
Private Equity
Fixed Income Capital Markets
Private Wealth
Management
6
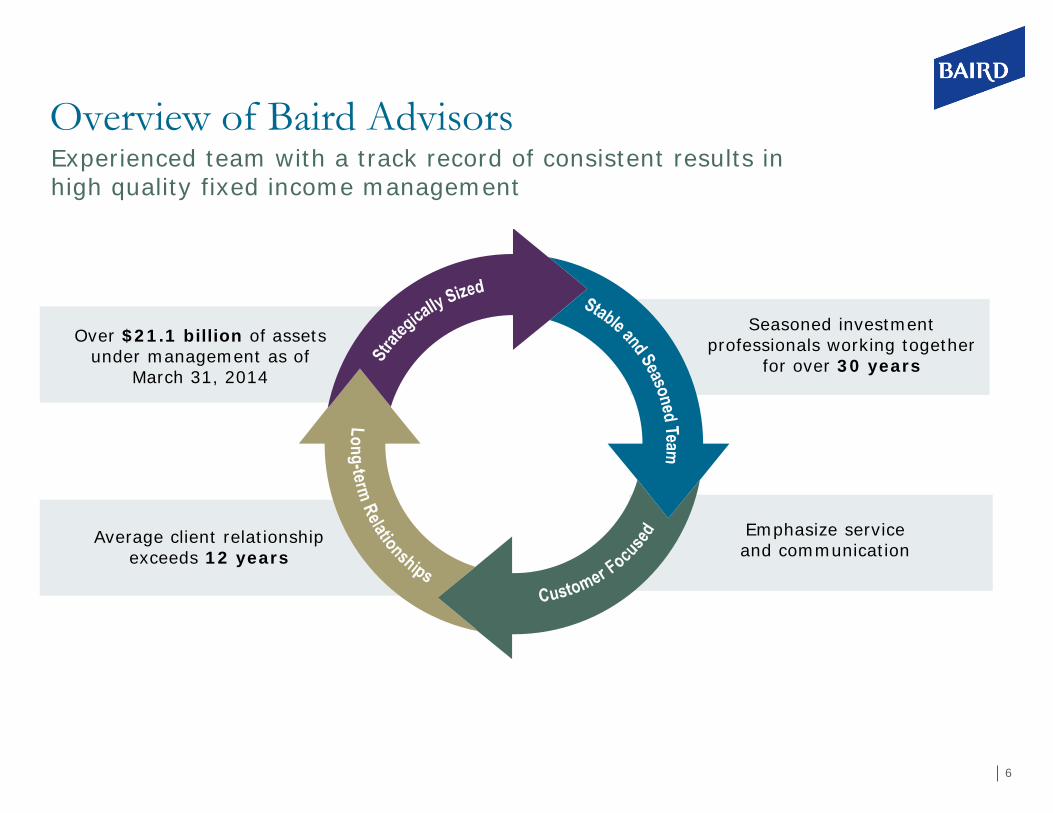
Over $21.1 billion of assets under management as of
March 31, 2014
Emphasize service and communication
Average client relationship exceeds 12 years
Seasoned investment professionals working together
for over 30 years
Overview of Baird Advisors Experienced team with a track record of consistent results in high quality fixed income management

7
Baird Advisors - Representative Clients
_____________________ Note: The clients listed above represent various industry groups and geographic locations and were not selected based upon performance. Their appearance is not an indication of approval or disapproval of the investment management services provided.
Client relationships average 12 years
PUBLIC MEDIA FOR NORTH TEXAS

8
Structured, Risk-controlled Portfolio Management Consistent approach applied across risk spectrum
Risk (Duration Years)
Expe
cted
Ret
urn
(%)
Baird Short-Term Bond Fund
Barclays 1-3 yr Govt/Credit
Baird Intermediate Bond Fund
Barclays Intermediate Govt/Credit
Baird Core Plus Bond Fund
Barclays Universal/Aggregate
Barclays L-T G/C and Custom
Long Duration LDI Strategies
Baird Intermediate Municipal Bond Fund
Barclays 7/year G.O.
Baird Aggregate Bond Fund
Barclays Short-Term Govt/Corporate
Baird Ultra Short Bond Fund
9
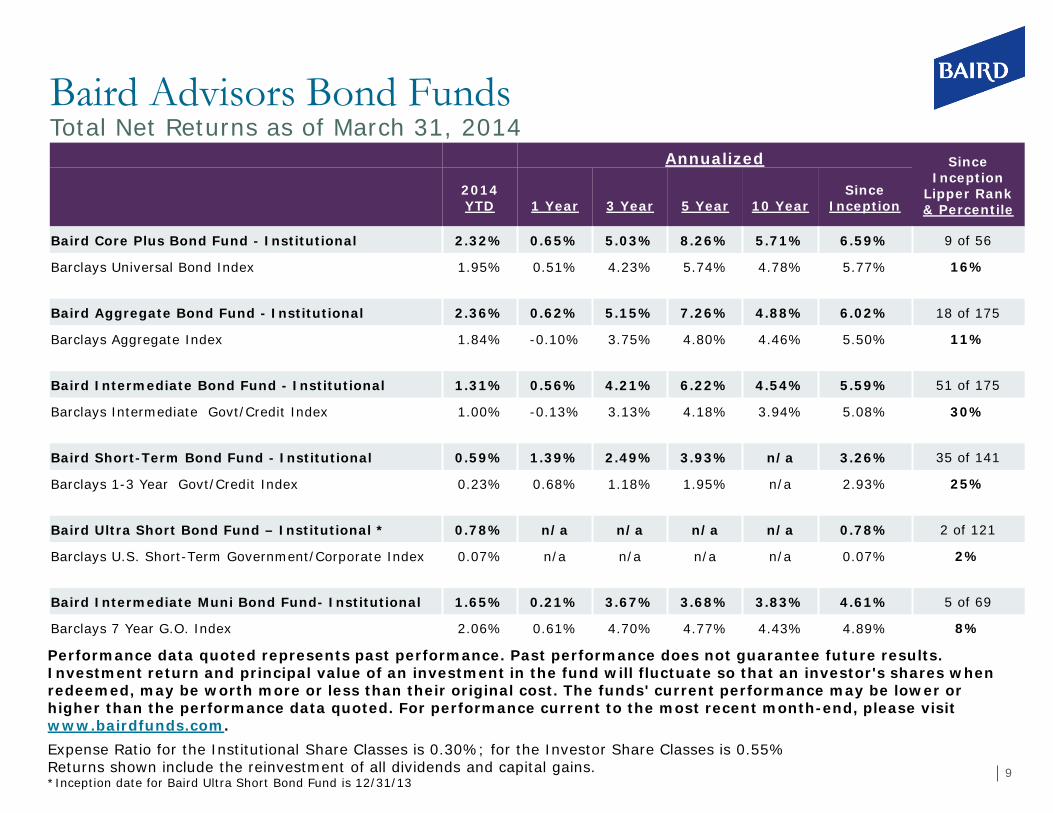
Baird Advisors Bond Funds Total Net Returns as of March 31, 2014
Performance data quoted represents past performance. Past performance does not guarantee future results. Investment return and principal value of an investment in the fund will fluctuate so that an investor's shares when redeemed, may be worth more or less than their original cost. The funds' current performance may be lower or higher than the performance data quoted. For performance current to the most recent month-end, please visit www.bairdfunds.com.
Expense Ratio for the Institutional Share Classes is 0.30%; for the Investor Share Classes is 0.55% Returns shown include the reinvestment of all dividends and capital gains. *Inception date for Baird Ultra Short Bond Fund is 12/31/13
Annualized Since Inception
Lipper Rank & Percentile
2014 YTD
1 Year
3 Year
5 Year
10 Year
Since Inception
Baird Core Plus Bond Fund - Institutional 2.32% 0.65% 5.03% 8.26% 5.71% 6.59% 9 of 56
Barclays Universal Bond Index 1.95% 0.51% 4.23% 5.74% 4.78% 5.77% 16%
Baird Aggregate Bond Fund - Institutional 2.36% 0.62% 5.15% 7.26% 4.88% 6.02% 18 of 175
Barclays Aggregate Index 1.84% -0.10% 3.75% 4.80% 4.46% 5.50% 11%
Baird Intermediate Bond Fund - Institutional 1.31% 0.56% 4.21% 6.22% 4.54% 5.59% 51 of 175
Barclays Intermediate Govt/Credit Index 1.00% -0.13% 3.13% 4.18% 3.94% 5.08% 30%
Baird Short-Term Bond Fund - Institutional 0.59% 1.39% 2.49% 3.93% n/a 3.26% 35 of 141
Barclays 1-3 Year Govt/Credit Index 0.23% 0.68% 1.18% 1.95% n/a 2.93% 25%
Baird Ultra Short Bond Fund – Institutional * 0.78% n/a n/a n/a n/a 0.78% 2 of 121
Barclays U.S. Short-Term Government/Corporate Index 0.07% n/a n/a n/a n/a 0.07% 2%
Baird Intermediate Muni Bond Fund- Institutional 1.65% 0.21% 3.67% 3.68% 3.83% 4.61% 5 of 69
Barclays 7 Year G.O. Index 2.06% 0.61% 4.70% 4.77% 4.43% 4.89% 8%

10
Source: Morningstar Direct as of March 31, 2014 Performance numbers used are through each month end period from each fund’s inception date. All supporting information available upon request. Past performance does not guarantee future results.
Percentage of Time the Funds Outperform their Morningstar Category Average
Rolling Time Periods
Baird Short-Term
Bond
Baird Intermediate
Bond
Baird Aggregate
Bond
Baird Core Plus
Bond
Baird Intermediate Muni Bond
1 Year 89 % 62 % 93 % 89 % 61 %
2 Year 94 % 73 % 95 % 93 % 55 %
3 Year 99 % 83 % 99 % 100 % 65 %
5 Year 100 % 94 % 100 % 100 % 92 %
Consistency is Key Baird Bond Funds – Institutional Shares

11 Analysis for 10 years through 12/31/13, using quarterly data Source: Callan Investments Institute
0.76
0.68
0.51
0.28
0.12
(0.24)
(0.26)
(0.60)
(1.0) (0.5) 0.0 0.5 1.0
Intermediate Credit
Emerging Market Debt (Sovereign US$)
High Yield
U.S. Fixed Income Barclays U.S. Aggregate Index
Short Duration Barclays U.S. 1-3 Yr Govt/Credit Index
Global Fixed (Barclays Global Aggregate)
Bank Loans
Long Treasury
Correlation to S&P 500
Diversification Benefits of High Quality Bonds
12
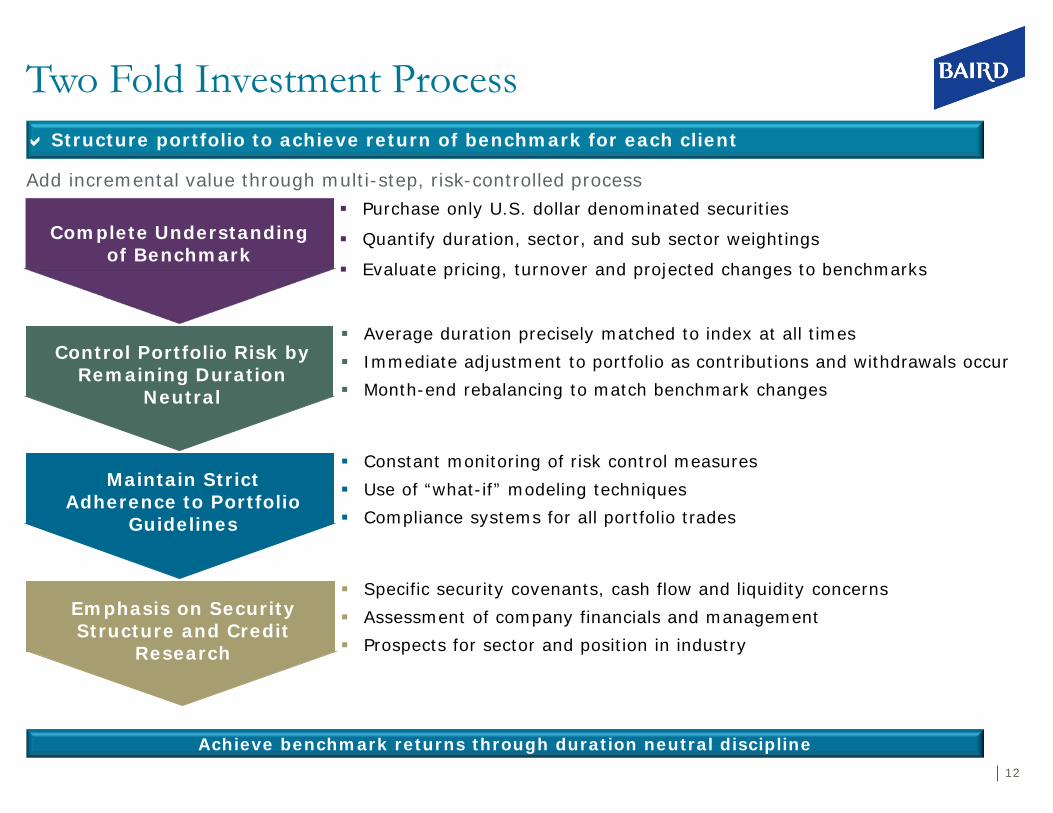
Two Fold Investment Process
Purchase only U.S. dollar denominated securities
Quantify duration, sector, and sub sector weightings
Evaluate pricing, turnover and projected changes to benchmarks
Average duration precisely matched to index at all times Immediate adjustment to portfolio as contributions and withdrawals occur Month-end rebalancing to match benchmark changes
Constant monitoring of risk control measures Use of “what-if” modeling techniques Compliance systems for all portfolio trades
Structure portfolio to achieve return of benchmark for each client
Add incremental value through multi-step, risk-controlled process
Specific security covenants, cash flow and liquidity concerns Assessment of company financials and management Prospects for sector and position in industry
Achieve benchmark returns through duration neutral discipline
Emphasis on Security Structure and Credit
Research
Maintain Strict Adherence to Portfolio
Guidelines
Control Portfolio Risk by Remaining Duration
Neutral
Complete Understanding of Benchmark

13
Two Fold Investment Process
Security Selection Attributes
Structure
Our goal is to add incremental return of 15-50 basis points through multiple investment strategies
Focus on relative value of different sectors
Yield spreads and underlying risks change constantly
Dynamic process
Analyze yield curve on a continual basis
Optimize yield and “rolldown”
Long-standing dealer relationships
Yield Curve Positioning
Sector Allocation
Competitive Execution
Long-term decisions to overweight and underweight
Liquidity
Timely market information
Capitalize on market inefficiencies
Performance is consistent and competitive over complete market cycles
Structure portfolio to achieve return of benchmark for each client Add incremental value through multi-step, risk-controlled process
14
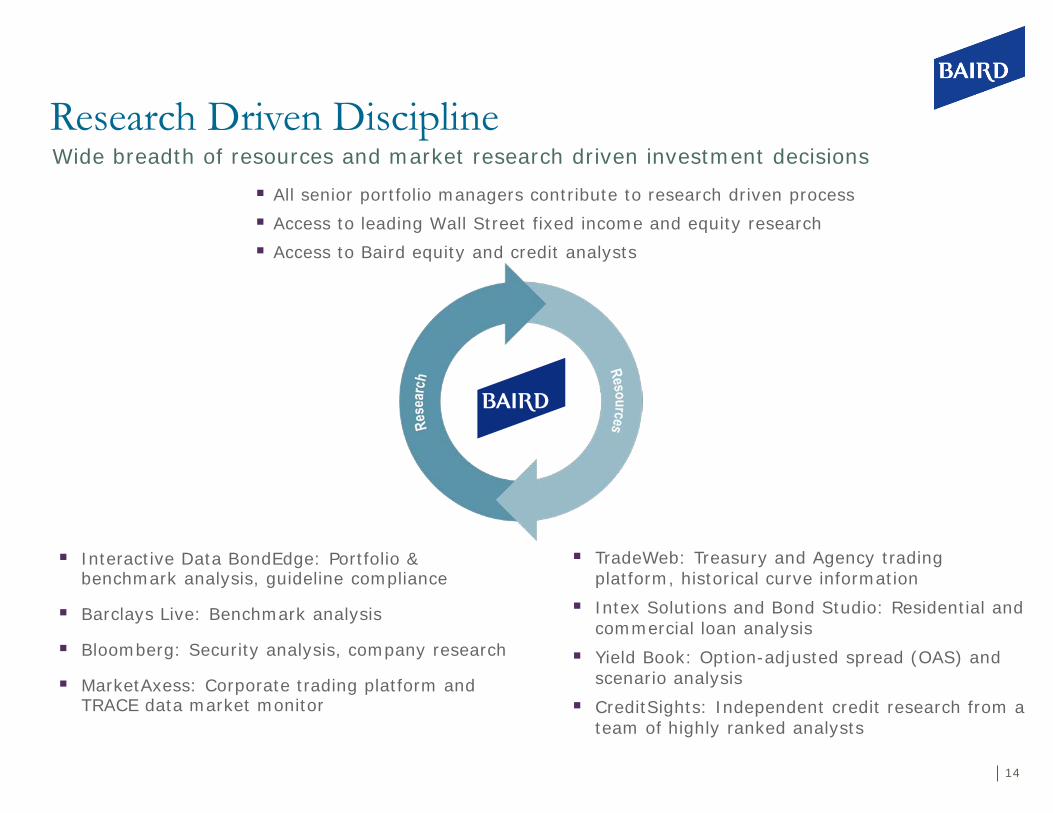
Research Driven Discipline
All senior portfolio managers contribute to research driven process Access to leading Wall Street fixed income and equity research Access to Baird equity and credit analysts
Interactive Data BondEdge: Portfolio & benchmark analysis, guideline compliance
Barclays Live: Benchmark analysis
Bloomberg: Security analysis, company research
MarketAxess: Corporate trading platform and TRACE data market monitor
Wide breadth of resources and market research driven investment decisions
TradeWeb: Treasury and Agency trading platform, historical curve information
Intex Solutions and Bond Studio: Residential and commercial loan analysis
Yield Book: Option-adjusted spread (OAS) and scenario analysis
CreditSights: Independent credit research from a team of highly ranked analysts

15
Section 2 Market Update
16
Economic Outlook & Market Update
U.S. Economy: Better in 2014 though growth still moderate with continued headwinds
Inflation: Wages remain benign with consumer inflation below Fed’s target
Fed Policy: Despite QE Taper, extraordinarily accommodative policy continues
Fiscal Policy: Small budget deals hide continued gridlock though deficits have improved
Positive Developments: Broad signs growth may be modestly accelerating
Risk Environment: Improved overall though continues to remain elevated with shift in “risk mix”
Fed exit plan
Outlook for economic growth
Geopolitical “hot spots”
Fiscal policy gridlock
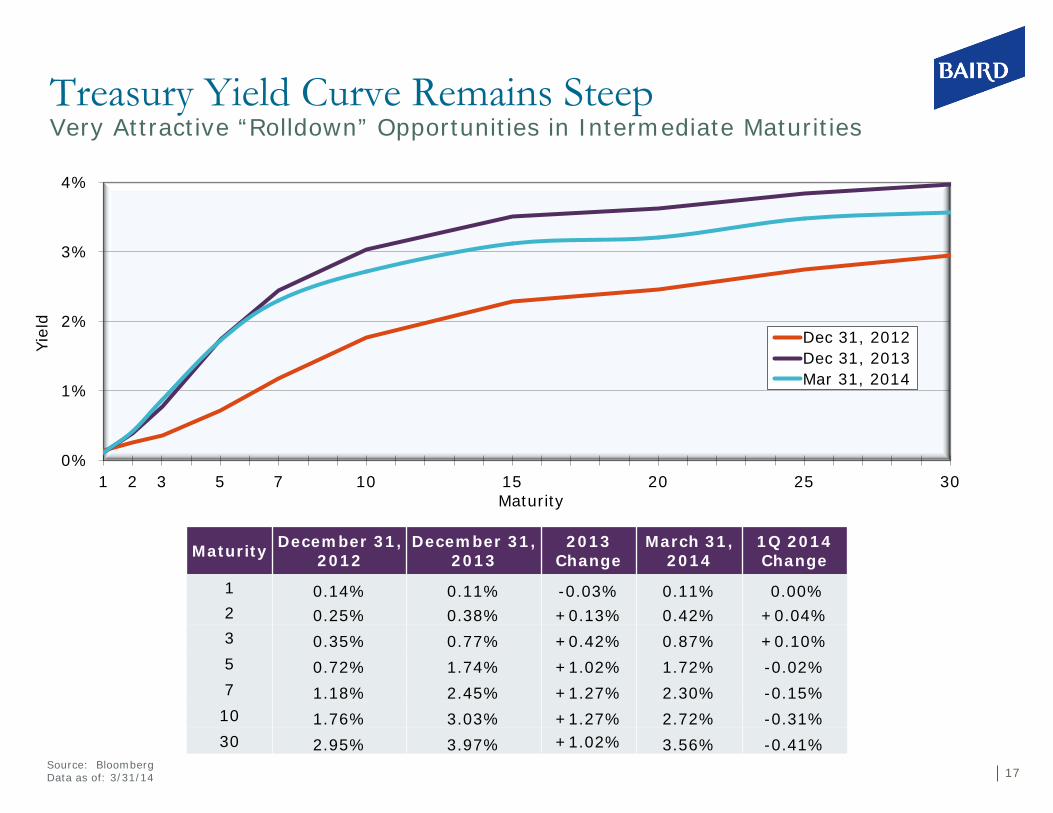
17 Source: Bloomberg Data as of: 3/31/14
Treasury Yield Curve Remains Steep Very Attractive “Rolldown” Opportunities in Intermediate Maturities
0%
1%
2%
3%
4%
1 2 3 5 7 10 15 20 25 30
Dec 31, 2012Dec 31, 2013Mar 31, 2014
Yiel
d
Maturity
Maturity December 31, 2012
December 31, 2013
2013 Change
March 31, 2014
1Q 2014 Change
1 0.14% 0.11% -0.03% 0.11% 0.00% 2 0.25% 0.38% +0.13% 0.42% +0.04% 3 0.35% 0.77% +0.42% 0.87% +0.10% 5 0.72% 1.74% +1.02% 1.72% -0.02% 7 1.18% 2.45% +1.27% 2.30% -0.15% 10 1.76% 3.03% +1.27% 2.72% -0.31% 30 2.95% 3.97% +1.02% 3.56% -0.41%

18
2013: A Tale of Two Treasury Curves Short End Steepens, Long End Flattens
Source: Bloomberg Data as of: 3/31/14
75
100
125
150
175
200
225
250
275
Dec Jan Feb Mar Apr May Jun Jul Aug Sep Oct Nov Dec Jan Feb Mar
Bas
is P
oint
s
2 to 10-year spread
10 to 30-year spread
2013 Change 2 to 10 yr: +114 bps 10 to 30 yr: -25 bps
‘12
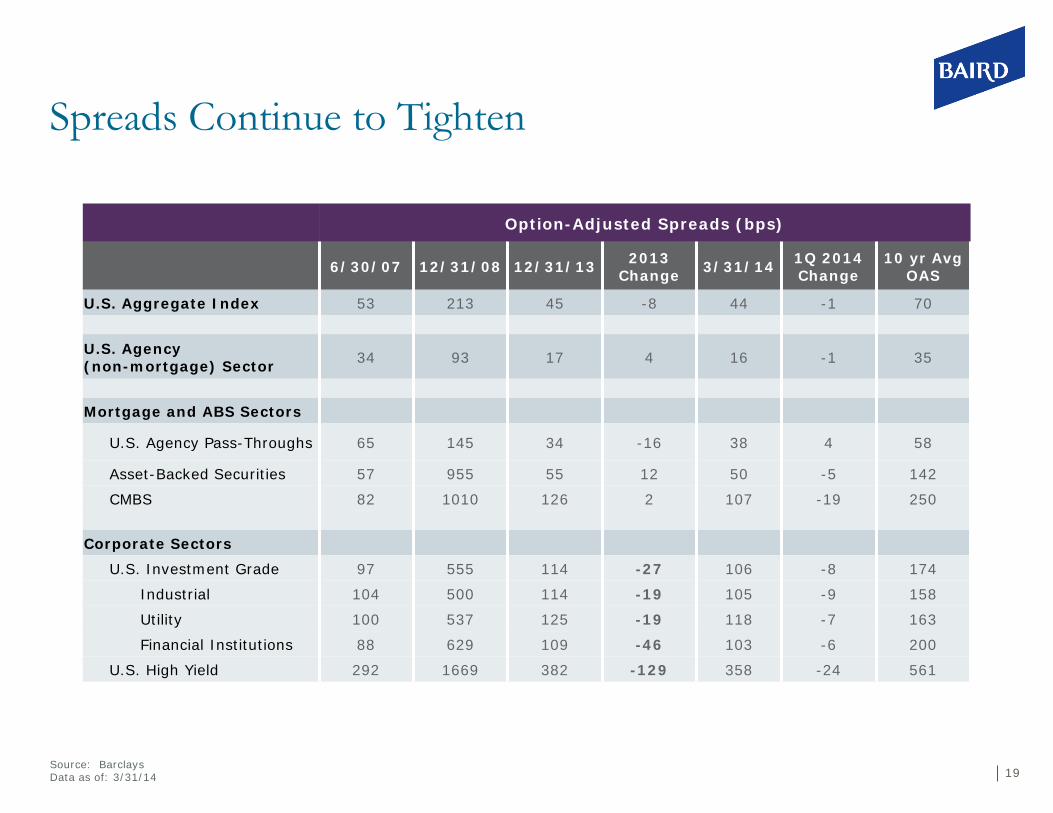
19 Source: Barclays Data as of: 3/31/14
Option-Adjusted Spreads (bps)
6/30/07 12/31/08 12/31/13 2013 Change 3/31/14 1Q 2014
Change 10 yr Avg
OAS
U.S. Aggregate Index 53 213 45 -8 44 -1 70
U.S. Agency (non-mortgage) Sector 34 93 17 4 16 -1 35
Mortgage and ABS Sectors
U.S. Agency Pass-Throughs 65 145 34 -16 38 4 58
Asset-Backed Securities 57 955 55 12 50 -5 142
CMBS 82 1010 126 2 107 -19 250
Corporate Sectors
U.S. Investment Grade 97 555 114 -27 106 -8 174
Industrial 104 500 114 -19 105 -9 158
Utility 100 537 125 -19 118 -7 163
Financial Institutions 88 629 109 -46 103 -6 200
U.S. High Yield 292 1669 382 -129 358 -24 561
Spreads Continue to Tighten
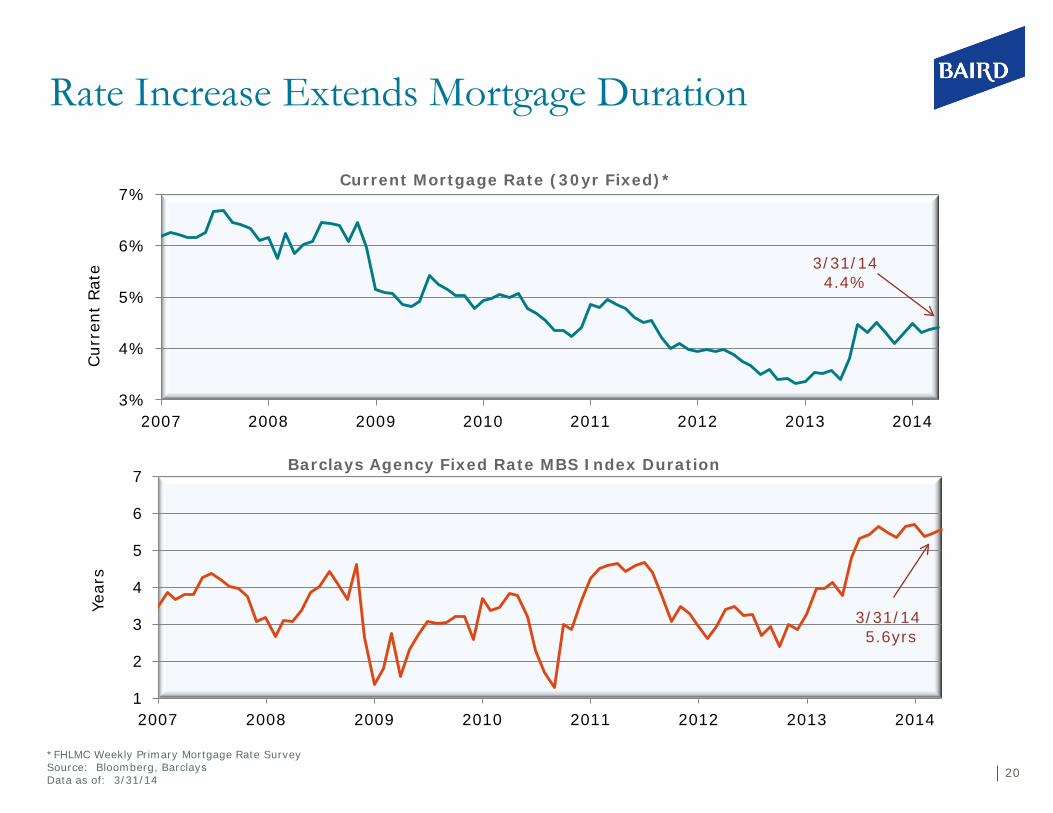
20 *FHLMC Weekly Primary Mortgage Rate Survey Source: Bloomberg, Barclays Data as of: 3/31/14
3/31/14 4.4%
3%
4%
5%
6%
7%
2007 2008 2009 2010 2011 2012 2013 2014
Cur
rent
Rat
e
Current Mortgage Rate (30yr Fixed)*
Rate Increase Extends Mortgage Duration
3/31/14 5.6yrs
1
2
3
4
5
6
7
2007 2008 2009 2010 2011 2012 2013 2014
Year
s
Barclays Agency Fixed Rate MBS Index Duration

21
FHMS K003-A4 (4.5 year average life) 2.1% yield (+55 bps over comparable Treasury) $290 million tranche size Buy Rationale:
Senior in the capital structure (20% subordination and FHLMC guarantee)
76% of loans defeased to maturity with U.S. Treasuries, limiting prepayment uncertainty
Very liquid asset class
Attractive valuation versus Agency Pass-Throughs and Agency Debentures
Fundamentals remain strong:
1.5x Debt Service Coverage Ratio (DSCR)
66% Loan-to-Value (LTV)
Conduit structure – well diversified with 60 loans across 22 states
Adding Value Through Security Selection Senior Class Agency CMBS Attractive Versus Agency Pass-Throughs & Debentures

22
Section 3 Update on Bay County Employees’ Retirement System

23
Risk Control Discipline
Risk control is the foundation of our investment discipline
Duration neutral to benchmark
U.S. Treasuries and Government Agencies Securities Emphasized for long duration exposures Used to match duration
Credit Securities Limited credit exposure in more volatile sectors with continuous review of credit allocation Focus on financial industry with higher priority given to credit rating Diversification increases as quality decreases
Mortgage-Backed and Asset-Backed Securities Focus on fixed-rate collateral vs. ARMs Seasoned, more stable mortgage-backed securities Safety of senior tranches if not U.S. Government Guaranteed Use Bloomberg, Intex, Real Point and Yield Book for residential and commercial loans

24
Portfolios positioned to benefit from steep yield curve
Duration neutral overall
Emphasize securities with attractive “rolldown”
Portfolios positioned to benefit from continued spread sector outperformance
Maintain underweight to U.S. Treasury sector
Opportunities across spread sectors more selective
Continued Focus on Risk Control
Strategy evolving to less spread sector overweight
Maintaining coupon advantage
Investment on floating rate holdings
Increased diversification
Experienced team and risk controlled process key to long-term success
Investment Outlook
25
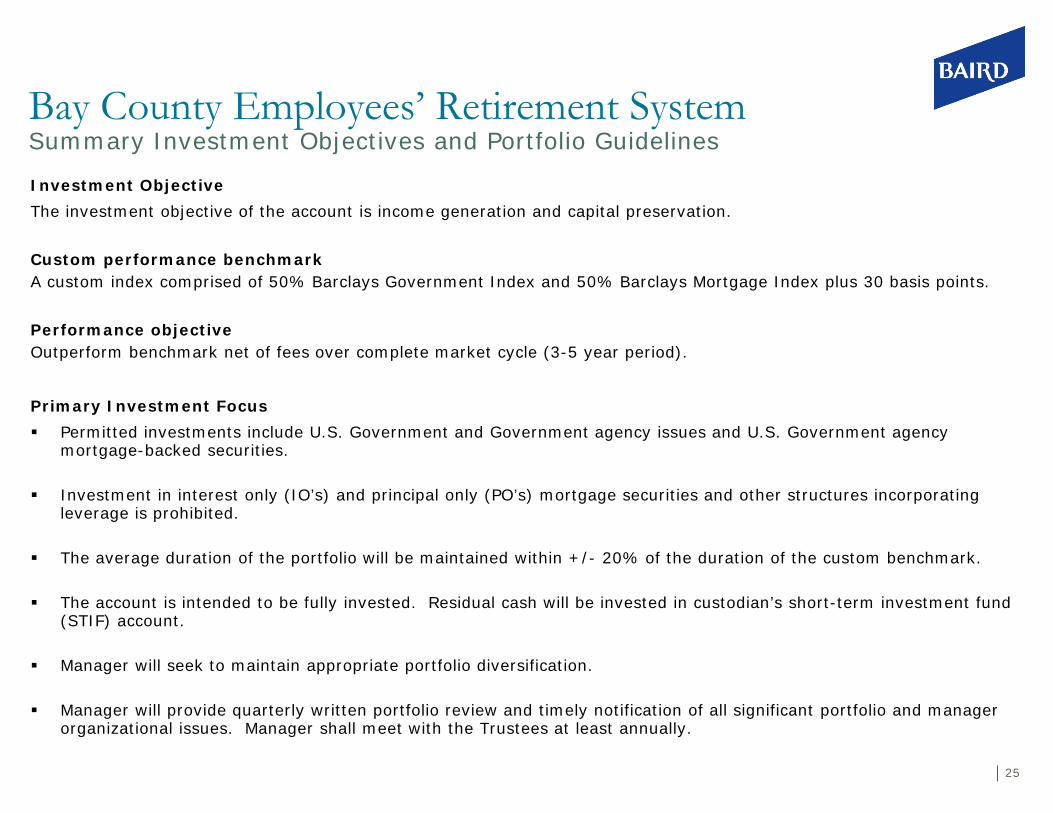
Bay County Employees’ Retirement System Summary Investment Objectives and Portfolio Guidelines
Investment Objective The investment objective of the account is income generation and capital preservation. Custom performance benchmark A custom index comprised of 50% Barclays Government Index and 50% Barclays Mortgage Index plus 30 basis points. Performance objective Outperform benchmark net of fees over complete market cycle (3-5 year period).
Primary Investment Focus Permitted investments include U.S. Government and Government agency issues and U.S. Government agency
mortgage-backed securities.
Investment in interest only (IO’s) and principal only (PO’s) mortgage securities and other structures incorporating leverage is prohibited.
The average duration of the portfolio will be maintained within +/- 20% of the duration of the custom benchmark.
The account is intended to be fully invested. Residual cash will be invested in custodian’s short-term investment fund (STIF) account.
Manager will seek to maintain appropriate portfolio diversification.
Manager will provide quarterly written portfolio review and timely notification of all significant portfolio and manager organizational issues. Manager shall meet with the Trustees at least annually.
26
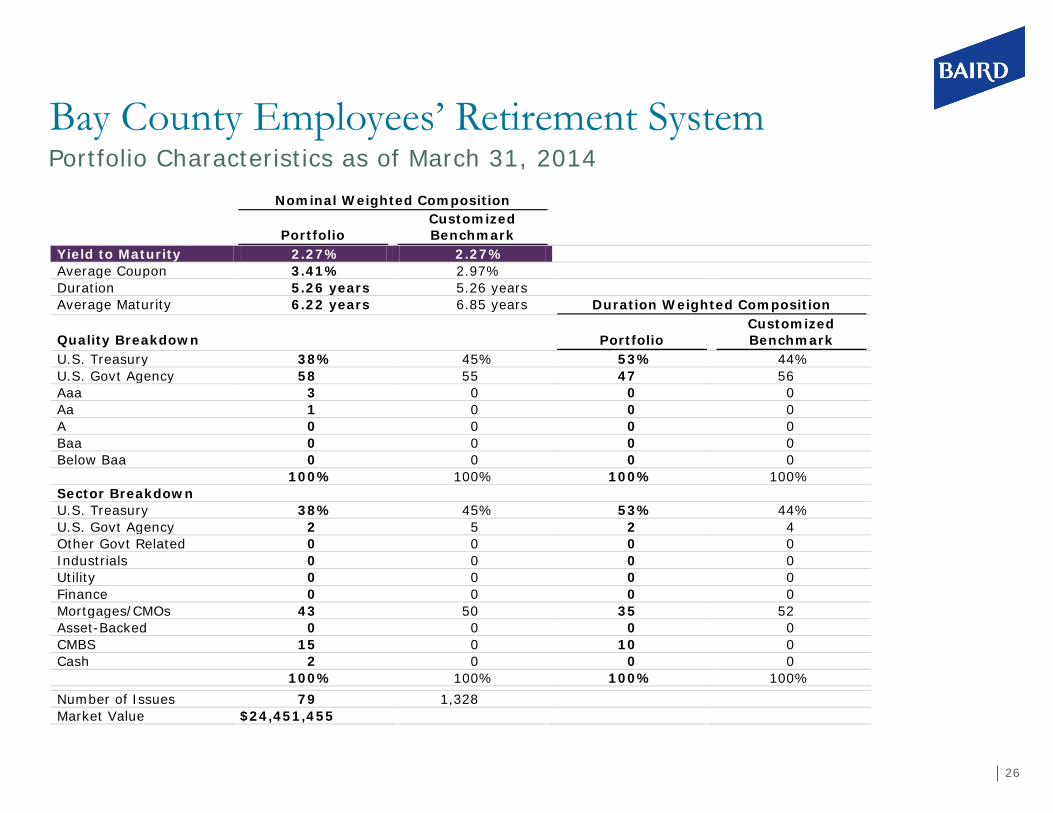
Nominal Weighted Composition
Portfolio Customized Benchmark
Yield to Maturity 2.27% 2.27% Average Coupon 3.41% 2.97% Duration 5.26 years 5.26 years Average Maturity 6.22 years 6.85 years Duration Weighted Composition Quality Breakdown
Portfolio
Customized Benchmark
U.S. Treasury 38% 45% 53% 44% U.S. Govt Agency 58 55 47 56 Aaa 3 0 0 0 Aa 1 0 0 0 A 0 0 0 0 Baa 0 0 0 0 Below Baa 0 0 0 0 100% 100% 100% 100% Sector Breakdown U.S. Treasury 38% 45% 53% 44% U.S. Govt Agency 2 5 2 4 Other Govt Related 0 0 0 0 Industrials 0 0 0 0 Utility 0 0 0 0 Finance 0 0 0 0 Mortgages/CMOs 43 50 35 52 Asset-Backed 0 0 0 0 CMBS 15 0 10 0 Cash 2 0 0 0 100% 100% 100% 100% Number of Issues 79 1,328 Market Value $24,451,455
Bay County Employees’ Retirement System Portfolio Characteristics as of March 31, 2014

27
Bay County Employees’ Retirement System
Fixed Income Portfolio
Gross of Fees Customized Benchmark
2006 (Apr-Dec) 5.04% 4.85%
2007 7.20% 7.78%
2008 9.13% 10.36%
2009 3.72% 1.79%
2010 5.63% 5.46%
2011 7.91% 7.62%
2012 3.05% 2.32%
2013 -2.59% -2.00%
2014 1st Qtr 1.56% 1.45%
Since Inception
Cumulative Return 48.10% 46.54%
Annualized Return 5.03% 4.89%
The performance is presented on a cumulative basis and does not reflect the deduction of investment advisory fees. Return would be reduced by advisory fee and other fees such as custodial expenses. The maximum fee found in Baird Advisors form ADV is 30 basis points. All returns are calculated on a time weighted, total return basis. The results shown should not be considered representative of future investment returns. The 50% Barclays Government & 50% Barclays MBS Index is an unmanaged portfolio of specific securities. The portfolio does not invest in all the securities traded in the index. Direct investment in the index is not available. Client should review all account statements provided by its custodian and compare those account statements to any account statement provided by Baird Advisors. Baird Advisors relies on securities valuations provided by client's custodian for purposes of performance reports.
Client should review all account statements provided by its custodian and compare those account statements to any account statement provided by Baird Adivsors. Baird Advisors relies on security valuations provided by client's custodian for purposes of performance reports. The Baird Advisors Brochure, which serves as a substitute for Form ADV Part II, is available upon request.

28
Bay County Employees’ Retirement System
Fixed Income Portfolio
Net of Fees Customized Benchmark
2006 (Apr-Dec) 4.80% 4.85%
2007 6.89% 7.78%
2008 8.81% 10.36%
2009 3.41% 1.79%
2010 5.31% 5.46%
2011 7.59% 7.62%
2012 2.74% 2.32%
2013 -2.88% -2.00%
2014 1st Qtr 1.48% 1.45%
Since Inception
Cumulative Return 44.61% 46.54%
Annualized Return 4.72% 4.89%
The performance is presented on a cumulative basis. All returns are calculated on a time weighted, total return basis. The results shown should not be considered representative of future investment returns. The 50% Barclays Government & 50% Barclays MBS Index is an unmanaged portfolio of specific securities. The portfolio does not invest in all the securities traded in the index. Direct investment in the index is not available. Client should review all account statements provided by its custodian and compare those account statements to any account statement provided by Baird Advisors. Baird Advisors relies on securities valuations provided by client's custodian for purposes of performance reports. Client should review all account statements provided by its custodian and compare those account statements to any account statement provided by Baird Adivsors. Baird Advisors relies on security valuations provided by client's custodian for purposes of performance reports. The Baird Advisors Brochure, which serves as a substitute for Form ADV Part II, is available upon request.

29
Benefits for Bay County Employees’ Retirement System Long-term relationships focused on client and direct communication
Experienced management team implementing proven investment discipline
Structured, risk controlled process
No derivatives, no non-$ currency exposure
Focus on bottom-up added value from sector allocation and security selection
Total focus on fixed income management
Culture and resources key to future success
Importance of the relationship to Baird Advisors
We believe our team, our entrepreneurial environment and substantial resources enable us to provide our clients with the best possible fixed income investment management services available