Prepared by the North Dakota State Data Center July 20081 Using the American Community Survey for...
33
Prepared by the North Dakota State Data Center July 2008 1 Using the American Community Survey for Rural Research Dr. Richard Rathge Professor and Director North Dakota State Data Center Rural Sociological Society Annual Meeting Manchester, NH July 31, 2008
-
Upload
silas-lambert -
Category
Documents
-
view
213 -
download
0
Transcript of Prepared by the North Dakota State Data Center July 20081 Using the American Community Survey for...

Prepared by the North Dakota State Data Center July 2008
1
Using the American Community Surveyfor Rural Research
Dr. Richard RathgeProfessor and Director
North Dakota State Data Center
Rural Sociological Society Annual Meeting
Manchester, NH
July 31, 2008
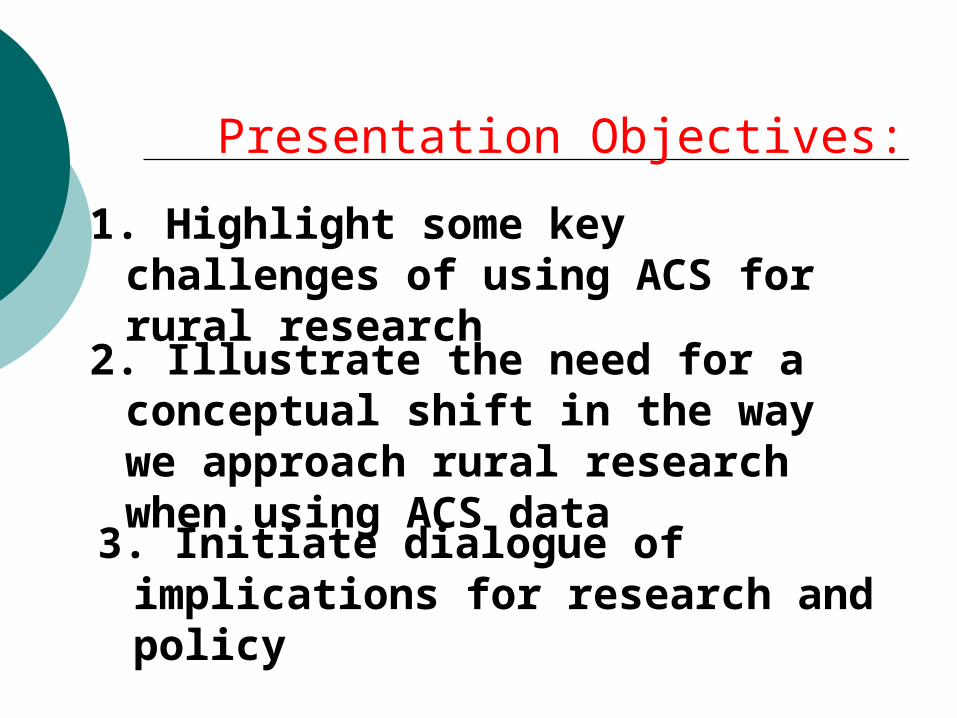
Presentation Objectives:
1. Highlight some key challenges of using ACS for rural research
2. Illustrate the need for a conceptual shift in the way we approach rural research when using ACS data
3. Initiate dialogue of implications for research and policy
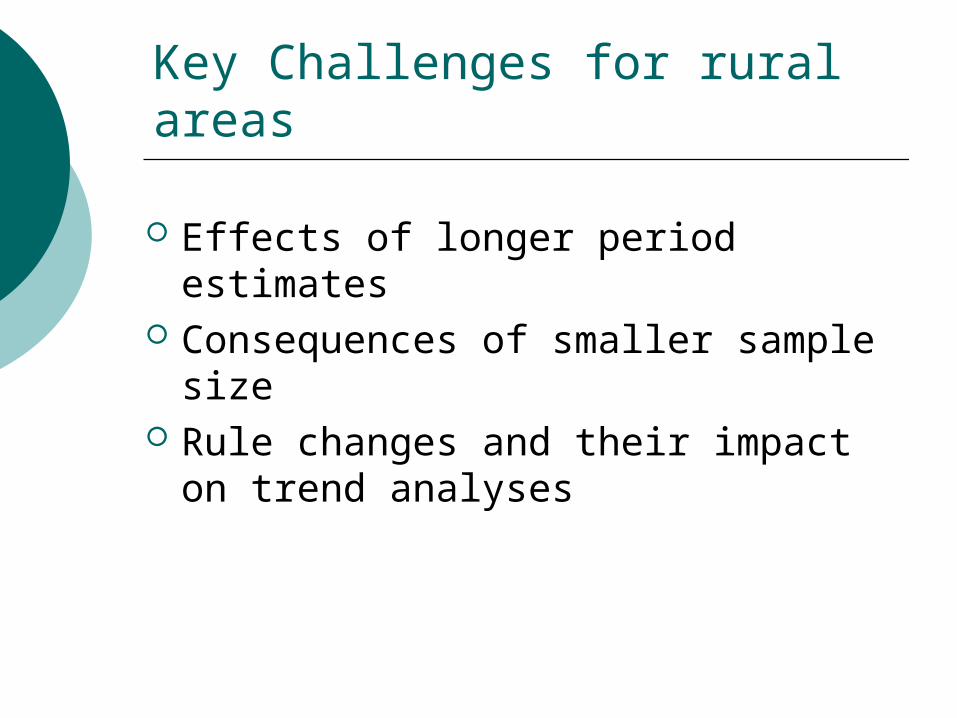
Key Challenges for rural areas
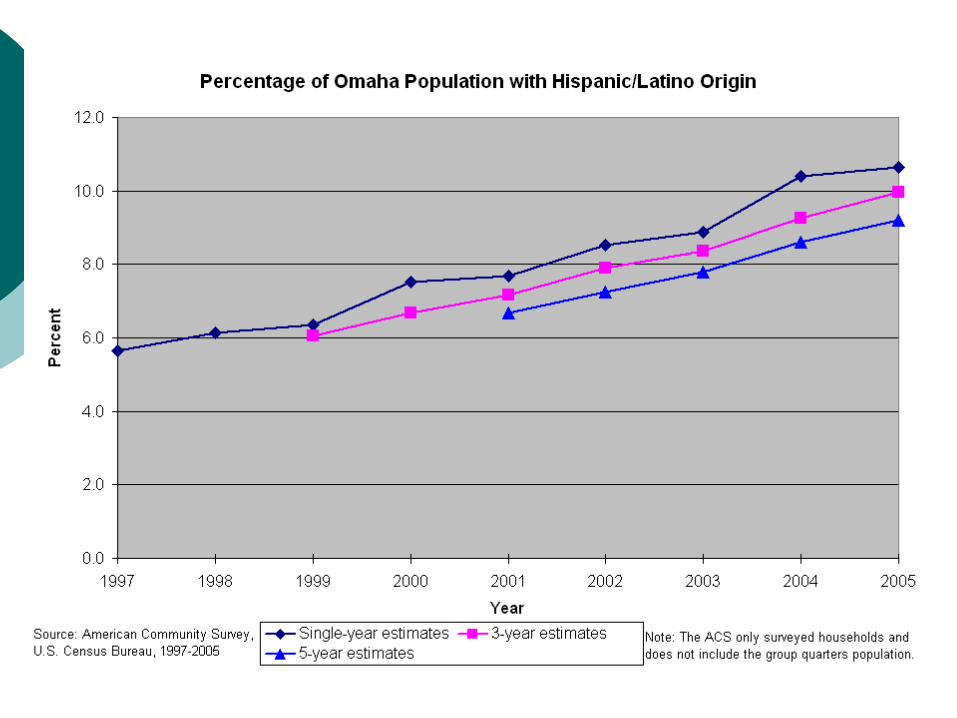
Effects of longer period estimates Consequences of smaller sample
size Rule changes and their impact on
trend analyses
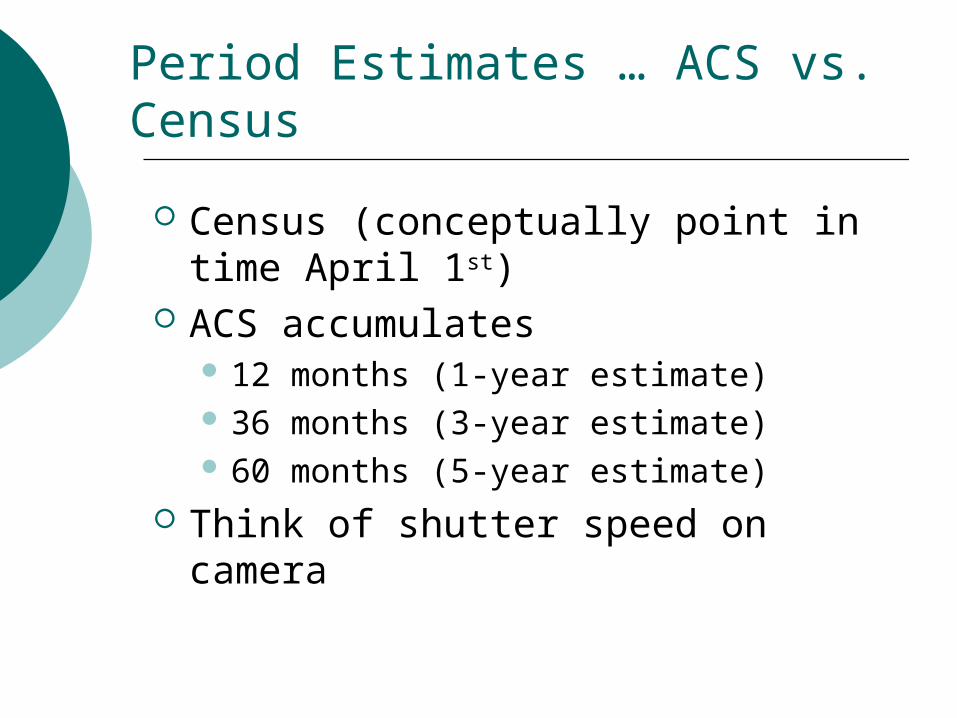
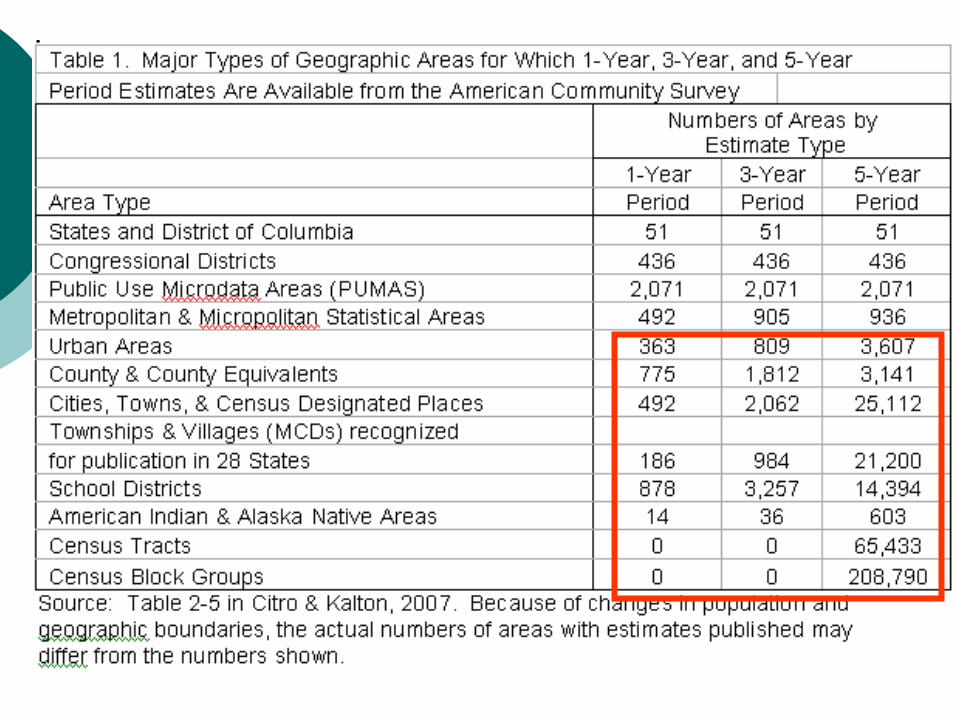
Period Estimates … ACS vs. Census
Census (conceptually point in time April 1st)
ACS accumulates 12 months (1-year estimate) 36 months (3-year estimate) 60 months (5-year estimate)
Think of shutter speed on camera

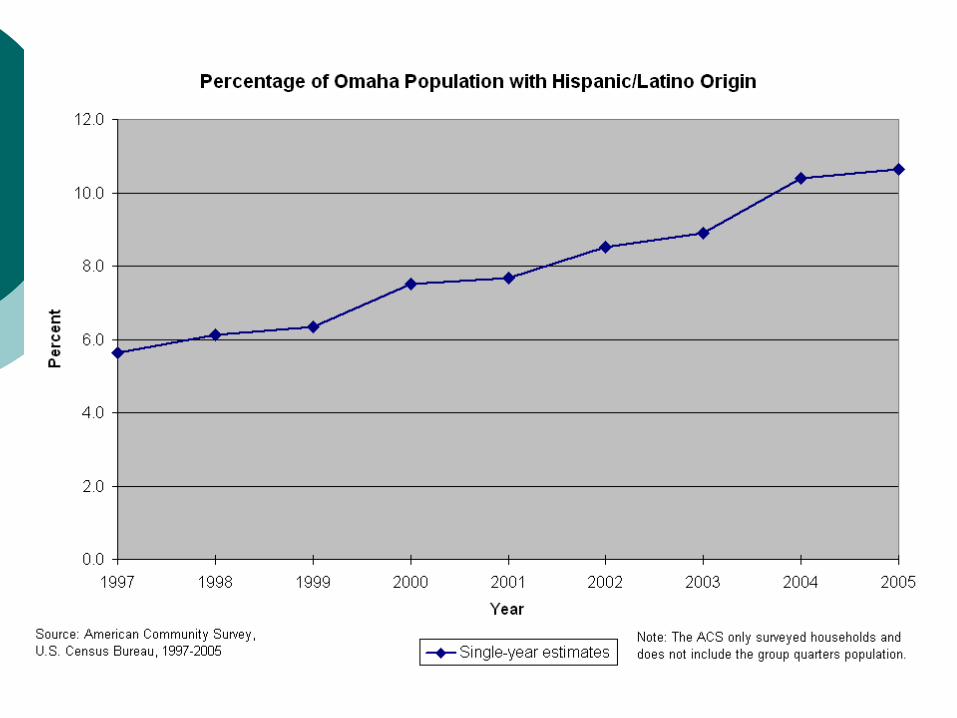
Rural Statistical Areas Joint Project

Nebraska ACS Data
Thanks to Jerry Deichert for data
Omaha city was an ACS test sites: 1997-2004 Can examine 1, 3, 5-year data

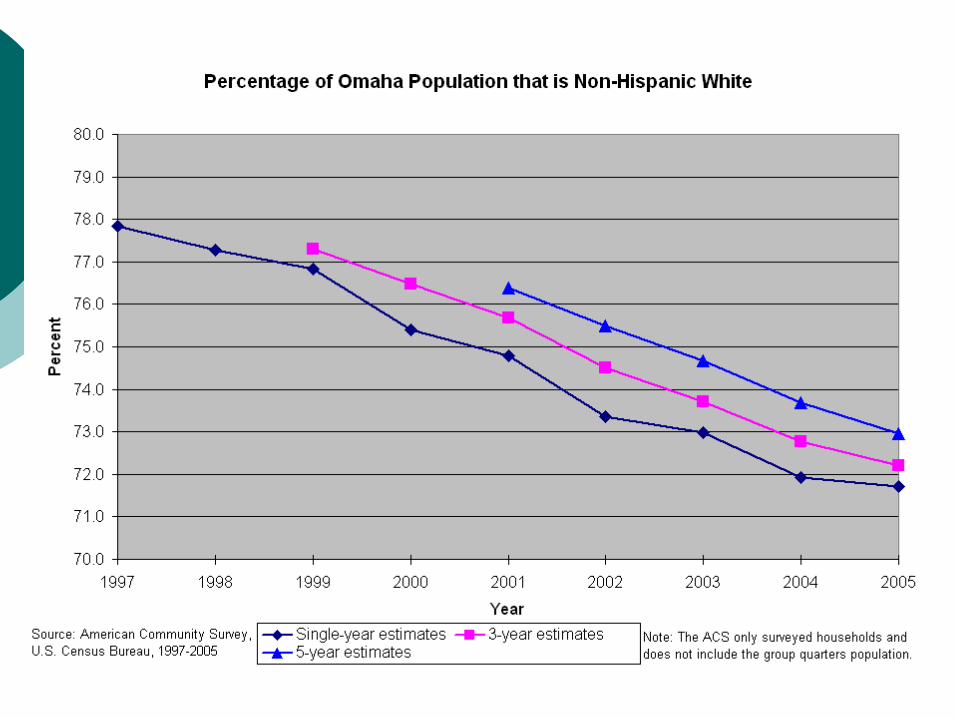

Key Challenges for rural areas
Effects of longer period estimates Consequences of smaller
sample size Rule changes and their impact on
trend analyses

ACS sample size is smaller than Census
One-year sample is 2.5 % of HHs vs 16.7% for Census long form Over five-year period, ACS sample size
is 12.5 percent
Therefore ACS sampling error will be larger

Cass County, North Dakota (population 132,585)

Grand Forks County, North Dakota
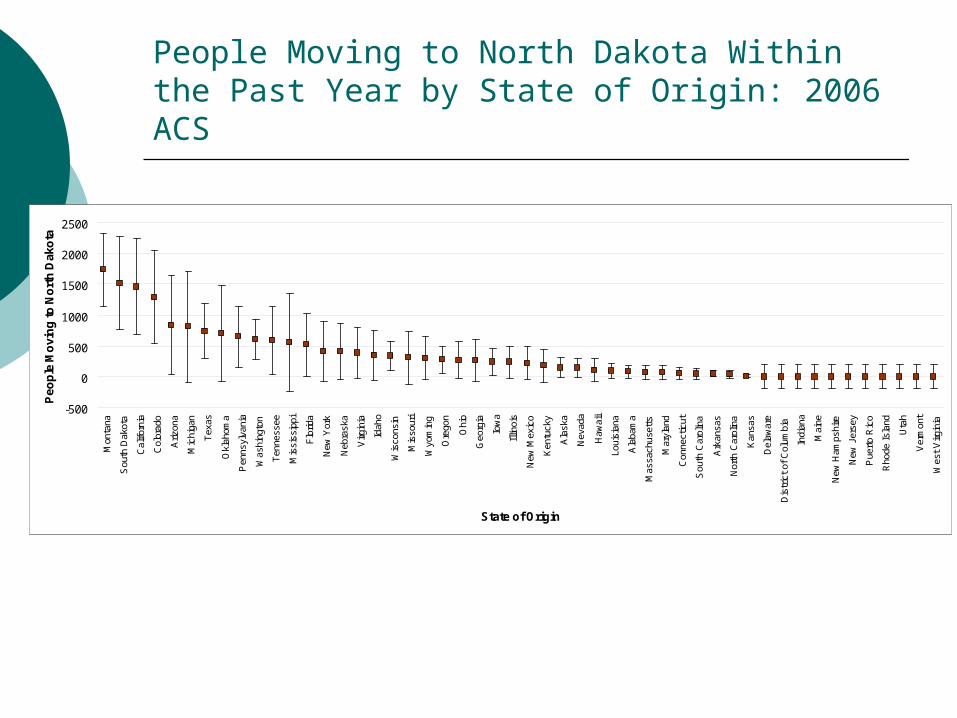
People Moving to North Dakota Within the Past Year by State of Origin: 2006 ACS
-500
0
500
1000
1500
2000
2500
Mon
tana
Sou
th D
akot
a
Cal
iforn
ia
Col
orad
o
Ariz
ona
Mic
higa
n
Tex
as
Okl
ahom
a
Pen
nsyl
vani
a
Was
hing
ton
Ten
ness
ee
Mis
siss
ippi
Flo
rida
New
Yor
k
Neb
rask
a
Virg
inia
Idah
o
Wis
cons
in
Mis
sour
i
Wyo
min
g
Ore
gon
Ohi
o
Geo
rgia
Iow
a
Illin
ois
New
Mex
ico
Ken
tuck
y
Ala
ska
Nev
ada
Haw
aii
Loui
sian
a
Ala
bam
a
Mas
sach
uset
ts
Mar
ylan
d
Con
nect
icut
Sou
th C
arol
ina
Ark
ansa
s
Nor
th C
arol
ina
Kan
sas
Del
awar
e
Dis
tric
t of
Col
umbi
a
Indi
ana
Mai
ne
New
Ham
pshi
re
New
Jer
sey
Pue
rto
Ric
o
Rho
de I
slan
d
Uta
h
Ver
mon
t
Wes
t V
irgin
ia
State of Origin
Peo
ple
Mo
vin
g to
No
rth
Dak
ota
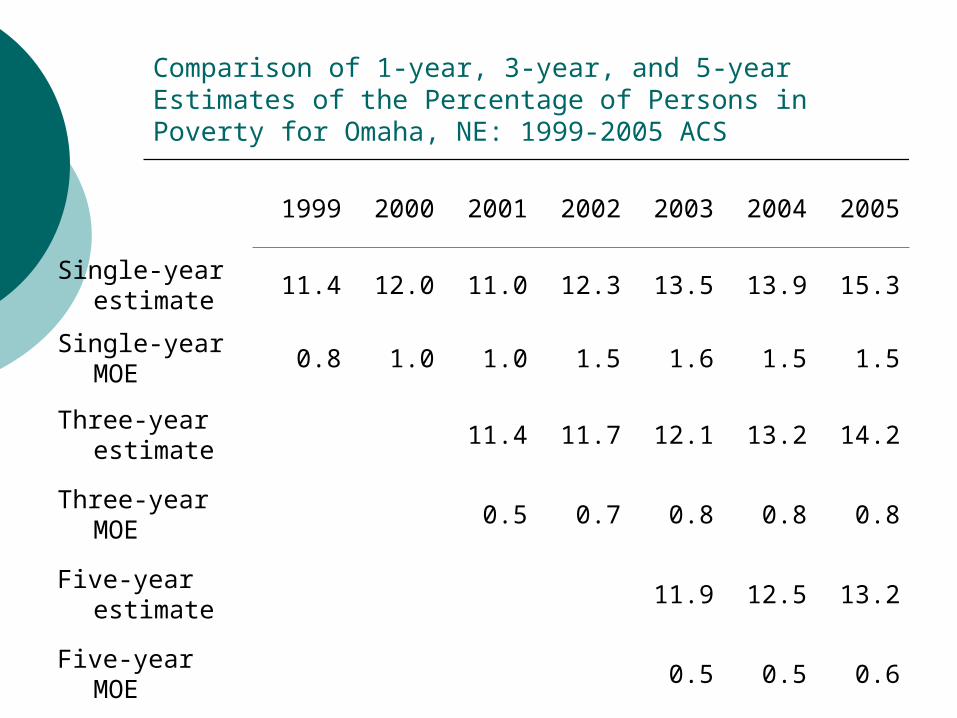
Comparison of 1-year, 3-year, and 5-year Estimates of the Percentage of Persons in Poverty for Omaha, NE: 1999-2005 ACS
1999 2000 2001 2002 2003 2004 2005
Single-year estimate
11.4 12.0 11.0 12.3 13.5 13.9 15.3
Single-year MOE
0.8 1.0 1.0 1.5 1.6 1.5 1.5
Three-year estimate
11.4 11.7 12.1 13.2 14.2
Three-year MOE
0.5 0.7 0.8 0.8 0.8
Five-year estimate
11.9 12.5 13.2
Five-year MOE 0.5 0.5 0.6
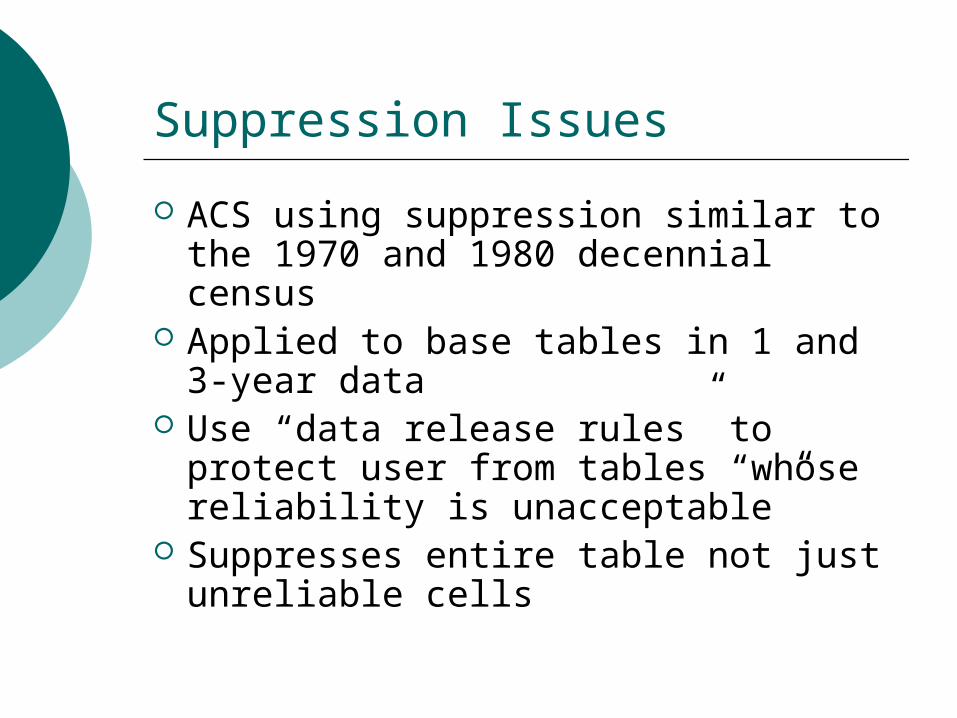
Suppression Issues
ACS using suppression similar to the 1970 and 1980 decennial census
Applied to base tables in 1 and 3-year data
Use “data release rules” to protect user from tables “whose reliability is unacceptable”
Suppresses entire table not just unreliable cells
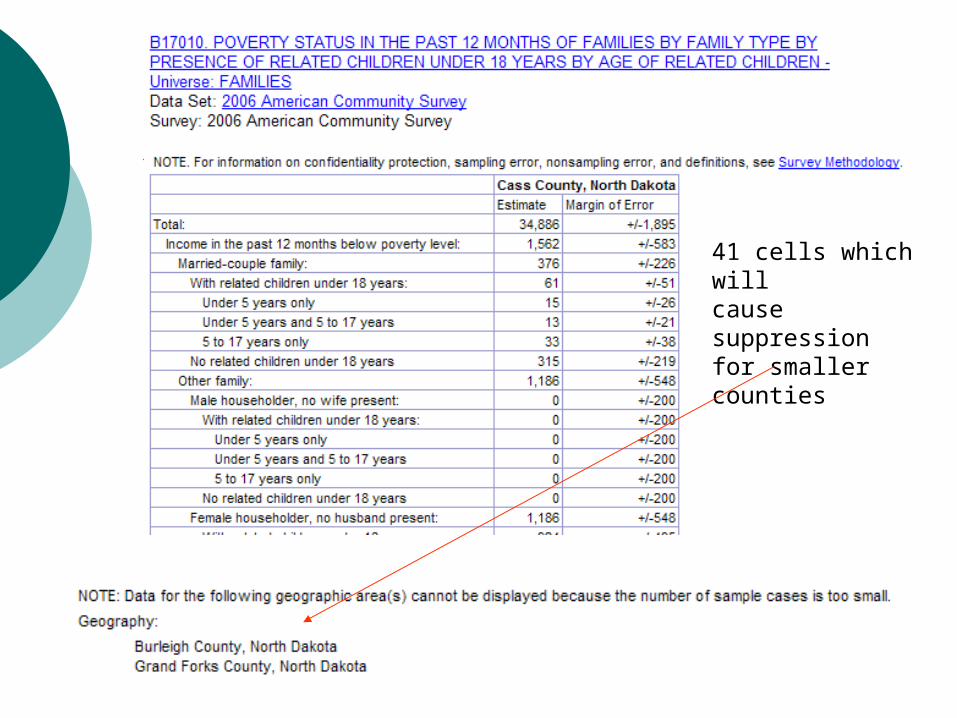
41 cells which willcause suppressionfor smaller counties
Key Challenges for rural areas
Effects of longer period estimates Consequences of smaller sample
size Rule changes and their impact
on trend analyses

ACS income not compatible with decennial census data
Decennial census asks income in previous calendar year
ACS asks income in previous 12 months Both are inflation adjusted However, Bureau test results show decennial
income consistently lower than ACS (4.4% nationwide)
Bureau suggests users “exercise caution”
Residency rules very different
Decennial census- “usual place of residence “using 6+ month” rule.
ACS – current residence during the last 2-months. Attempting to better count seasonal
residents
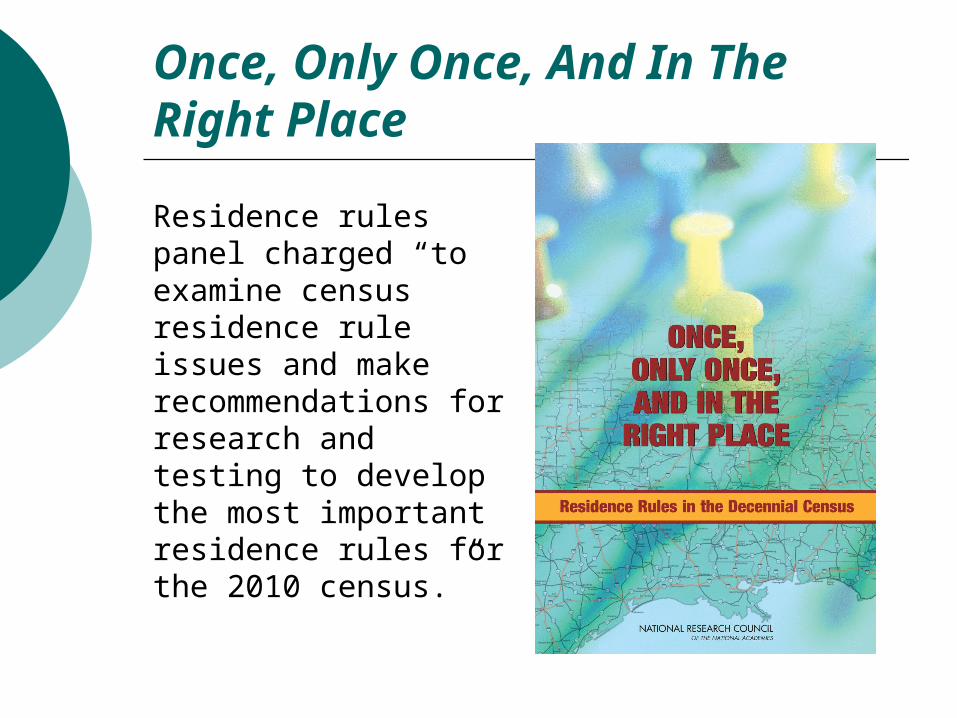
Once, Only Once, And In The Right Place
Residence rules panel charged “to examine census residence rule issues and make recommendations for research and testing to develop the most important residence rules for the 2010 census.”
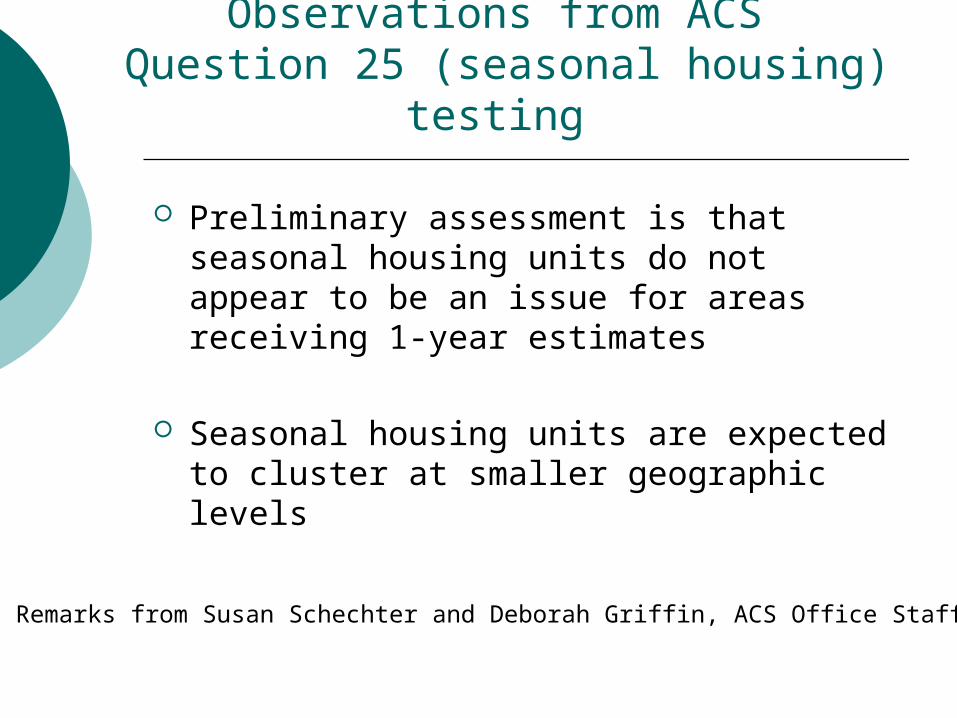
Observations from ACS Question 25 (seasonal housing) testing
Preliminary assessment is that seasonal housing units do not appear to be an issue for areas receiving 1-year estimates
Seasonal housing units are expected to cluster at smaller geographic levels
Remarks from Susan Schechter and Deborah Griffin, ACS Office Staff

1999-2001 Wisconsin test counties Michael Starsinic, Census Bureau

What lessons have we learned thus far?
Need to be more mindful of our data users
Rethink how we interpret and disseminate data to the public
Examine ways in which we can better educate ourselves and data user

The Message and the Media:The 2005 ACS Rollout
We reviewed 57 articles in 44 newspapers around the nation that appeared August 15-16 First availability of estimates for all areas
greater than 65,000 population Not just the NY Times and Washington
Post; other major metros (Seattle Post-Intelligencer, Houston Chronicle) and smaller papers (Toledo Blade, Lexington Herald-Leader, Anchorage Daily News. . .)
Research from the Committee on National Statistics, National Research Council

Key Interest: Change Over Time
Three-fourths of articles featured estimates of change from 2000 to 2005, mostly using the long-form sample for 2000
But only 2 articles expressed caution about comparing the long-form sample and the ACS
Research from the Committee on National Statistics, National Research Council
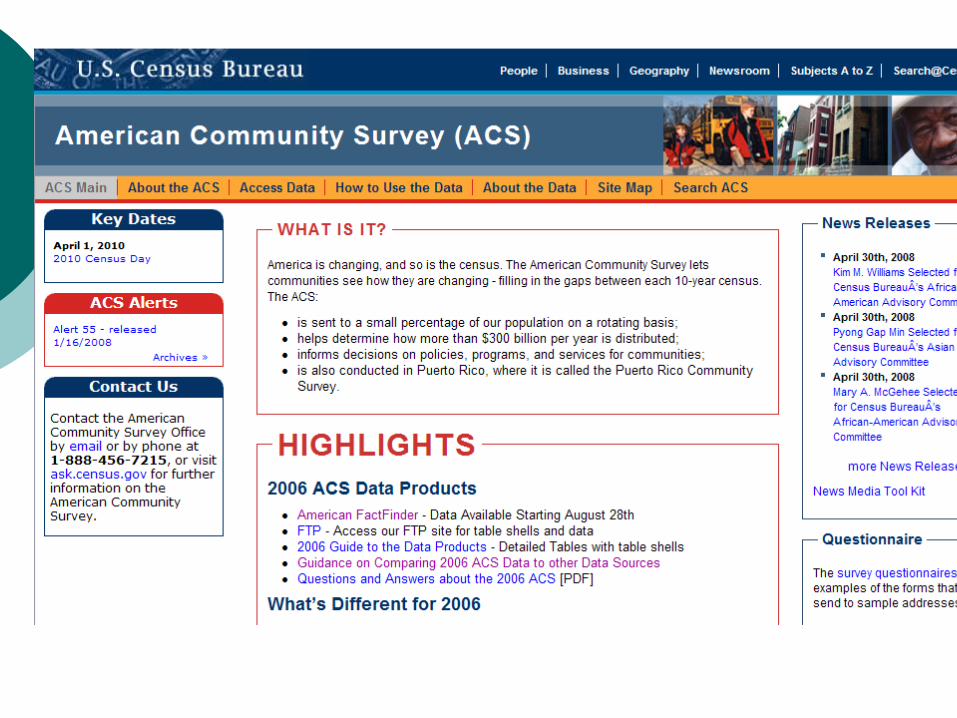
Census Bureau Resources
ACS website on Census Homepage
Technical documents/user guides being produced by Census Bureau
State Data Center websites
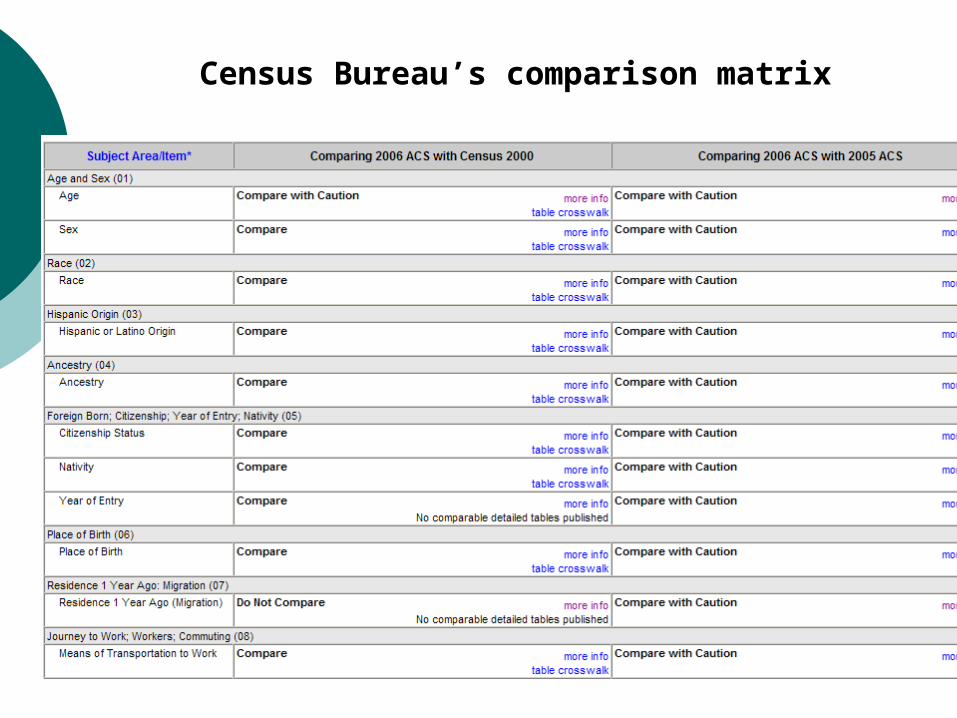
Census Bureau’s comparison matrix

Demographic Presentation 2008
Dr. Richard Rathge, Director North Dakota State Data Center, Fargo,
ND NDSU, IACC 424, Fargo, ND 58105 [email protected] Phone: (701) 231-8621 Fax: (701) 231-
9730 URL: www.ndsu.edu/sdc