prepared by Lorenzo Figliuoli, Bogdan Lissovolik, Ihor ... · Lorenzo Figliuoli, Bogdan Lissovolik,...
44
Ukraine, 1991 - 2002 Presentation prepared by Lorenzo Figliuoli, Bogdan Lissovolik, Ihor Shpak, Maxim Kryshko and Olga Tkachuk Resident Representative Office in Ukraine
Transcript of prepared by Lorenzo Figliuoli, Bogdan Lissovolik, Ihor ... · Lorenzo Figliuoli, Bogdan Lissovolik,...

Ukraine, 1991 - 2002
Presentation prepared by
Lorenzo Figliuoli, Bogdan Lissovolik,Ihor Shpak, Maxim Kryshko and
Olga Tkachuk
Resident Representative Office in Ukraine
Section I
“OVERVIEW OF UKRAINE’S ECONOMY SINCE INDEPENDENCE”

I. Overview of Economic Developments in Ukraine, 1991-2001
• Ukraine has been for the most part a typical transition economy which had to adjust to the requirements of a market economy. We can observe from the charts:
– (i) the characteristic U-shaped output path (across all sectors: Section II); – (ii) an initial upsurge in prices, followed by declining inflation and, on this basis, remonetization
(see also Sections III and IV); – (iii) growth of exports and reserves (with some slippages and from very low levels: Sections IV
and VI).• However, the process of recovery and stabilization was slower than in most transition countries, resulting
in an output U curve skewed to the right.• The goals and role of the IMF in the process. The Fund:
– (i) assesses economic developments; – (ii) formulates the main objectives; – (iii) provides policy advice to reach those goals (with or without supporting the program with
financial resources). The Fund has supported Ukraine with seven facilities so far.• General advice for transition economies:
– (i) liberalization; – (ii) stabilization; – (iii) privatization and other structural and institutional reforms; – (iv) sustainable social safety net.
• Specific short term advice would depend on the particular circumstances in each country, and the Fund does not believe in “one size fits all”.

Real GDP Growth in Transition Economies, 1991 -2001
-30
-25
-20
-15
-10
-5
0
5
10
15
1991 1992 1993 1994 1995 1996 1997 1998 1999 2000 2001
Perc
ent c
hang
e ov
er p
revi
ous
year
Central and Eastern Europe - average Hungary Poland Romania Baltics - average CIS - average Russia Ukraine
Ukraine
CIS
CEE

Twelve-Month Inflation Rates in Transition Economies, 1992 - 2001
0.1
1
10
100
1000
10000
100000
1992 1993 1994 1995 1996 1997 1998 1999 2000 2001
Perc
ent
Hungary Poland Romania Russia Ukraine Estonia Latvia Lithuania
Ukraine

Ukraine and the IMF
91 92 93 94 95 96 97 98 99 2000 2001 2002
Independence of Ukraine
Member since Sep-1992
STF
3 Stand-by programs
EFFAs of end-October 2002, Outstanding IMF loans: 1.84 bn USD

II. Chronological Categorization
The recent economic history in Ukraine could be roughly divided into 3 periods: – the period of economic decline in the aftermath of the inception of
transition 1991-1994;– the period of serious stabilization and lackluster structural reform,
during which output stagnated 1995-1999;
– the period of market-based economic growth, from 2000.
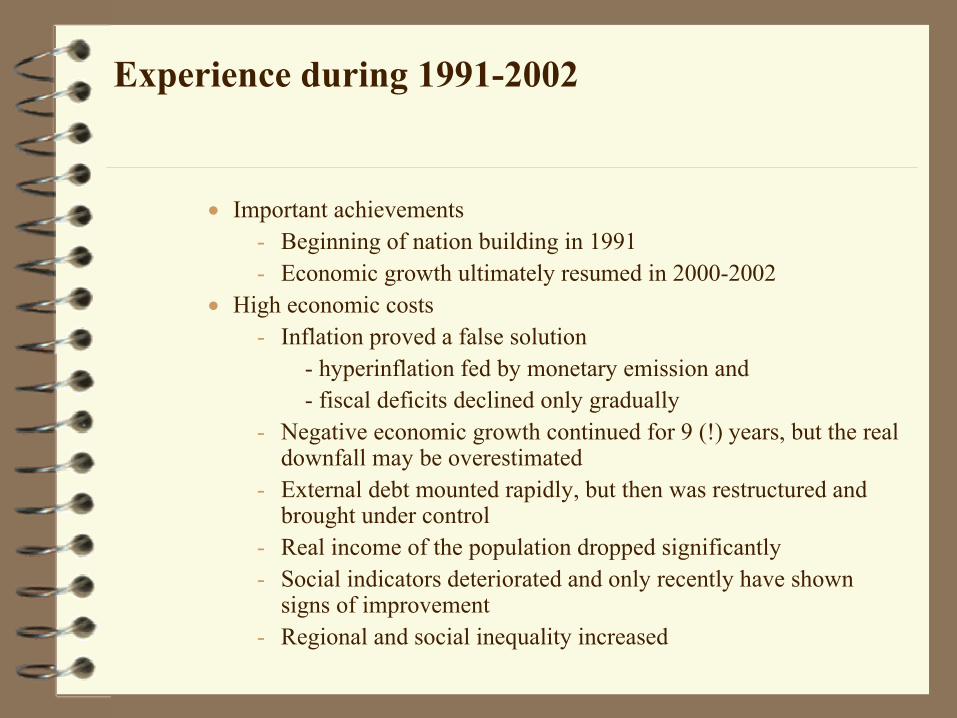
Experience during 1991-2002
• Important achievements- Beginning of nation building in 1991- Economic growth ultimately resumed in 2000-2002
• High economic costs- Inflation proved a false solution
- hyperinflation fed by monetary emission and - fiscal deficits declined only gradually
- Negative economic growth continued for 9 (!) years, but the realdownfall may be overestimated
- External debt mounted rapidly, but then was restructured and brought under control
- Real income of the population dropped significantly- Social indicators deteriorated and only recently have shown
signs of improvement- Regional and social inequality increased
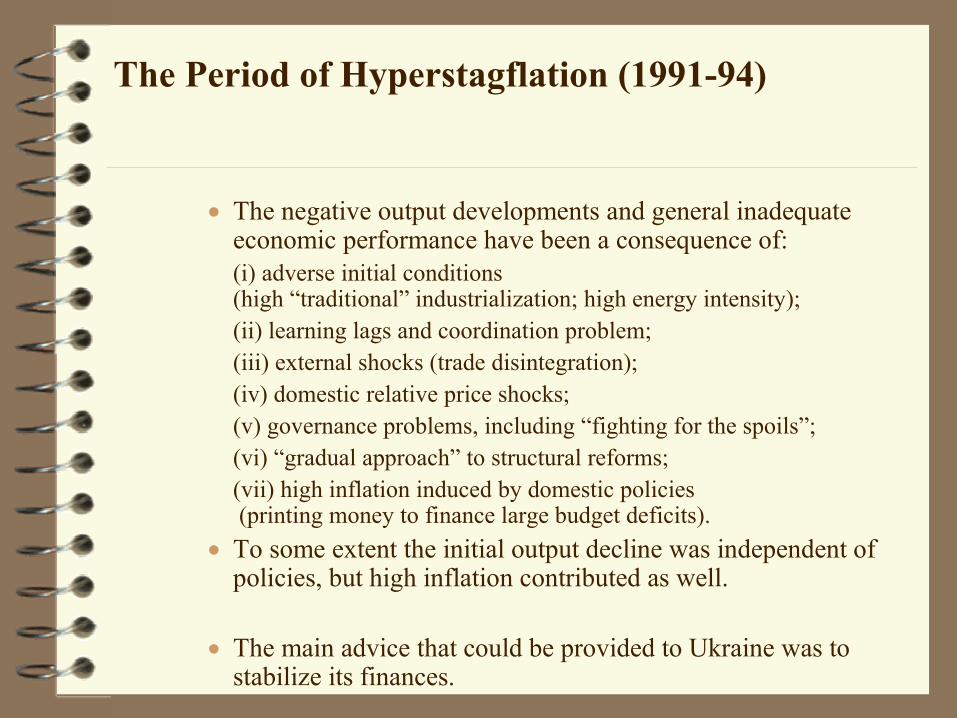
The Period of Hyperstagflation (1991-94)
• The negative output developments and general inadequate economic performance have been a consequence of: (i) adverse initial conditions (high “traditional” industrialization; high energy intensity);(ii) learning lags and coordination problem; (iii) external shocks (trade disintegration); (iv) domestic relative price shocks; (v) governance problems, including “fighting for the spoils”; (vi) “gradual approach” to structural reforms;(vii) high inflation induced by domestic policies(printing money to finance large budget deficits).
• To some extent the initial output decline was independent of policies, but high inflation contributed as well.
• The main advice that could be provided to Ukraine was to stabilize its finances.

The Period of Stagnation and Stabilization(1995-99)
• There was some fiscal adjustment that allowed the economy to stabilize, but growth did not resume, in part because of lackluster structural reform.
- Insufficient institution building in support of well-functioning markets
- Lack of genuine structural changes at the level of enterprises - Slow privatization- Heavy administrative intervention in economic operations
• With no growth, stabilization was precarious as well. • The mix of macroeconomic policies was a bit inconsistent:
monetary policy was broadly appropriate and occasionally too tight in order to support the fixed exchange rate, while fiscal policy was often lax and at times overly loose (1997) and structurally deficient (sequestration, etc.).

The Recovery (2000 - )
Year 2000 – a watershed- Real GDP and industrial output
increased - Recovery - mainly exports-led- Less barter and better transparency in key
markets- Stable hryvnia exchange rate- But inflation accelerated (25.8%)
Year 2001 – boom time (!)- Real GDP – 9.1%
(domestic demand accelerated, foreign –slowed down)
- Industrial output - 14.2% - Agricultural output - 9.9%- Inflation – surprisingly low (6.1%)- External sector – CA surplus shrank- Hryvnia revaluation continued but still
competitive
Year 2002 – sustainable growth?- Output and real GDP growth
moderated- Primarily, growth was driven
by domestic consumption, but lately by foreign demand too
- In 10m, industrial production grew by a hefty 6%, while agricultural output growth decelerated considerably (3%)
- The CPI recorded a “deflation”- External conditions improved,
as the Hryvnia REER slightly devalued and foreign demand strengthened
- Yet, structural reforms nearly stalled

III. Issues
• Fiscal sustainability. Does Ukraine need to tighten the budget?
• External sustainability: is competitiveness adequate?
• An interpretation of the recovery.• Growth Sustainability. The current policy dilemma:
will non-inflationary growth continue and on what basis?

The Period of Economic Growth (2000 - ) An Interpretation
• It appears that a confluence of factors specific to Ukraine created a situation whereby economic activity in a number of sectors became finally profitable.
• Foreign demand picked up noticeably in 2000, particularly in Russia, which proved a ready market for Ukrainian goods.
• By this time, Ukraine’s real wages had fallen and the exchange rate had depreciated considerably, leading to a significant boost in competitiveness of Ukrainian firms.
• These developments coincided with the presence of substantial idle capacity in the industrial sector, which was inherited from the Soviet period, a factor magnified by the enormous output collapse experienced earlier.
• When relative prices shifted sufficiently, a range of economic activities was finally profitable without requiring large new investments.

The Period of Economic Growth (2000 - ) In Interpretation (contd.)
• While, as noted above, there is sound evidence of restructuring in terms of labor shedding and introducing modern technology, therewas undoubtedly plenty of learning going on of how to make traditional industrial products marketable (e.g., marketing, packaging, advertising).
• These developments rendered output growth possible and produced a surge in exports.
• On the macroeconomic side, the presence of reasonable prudent fiscal and monetary policies ensured a stable environment that was at least not inimical to output growth.
• At the firm level, the improved payments discipline and diminishing recourse to noncash transactions in the economy likely boosted efficiency through the use of better payment methods.

The Period of Economic Growth (2000 - ) An Interpretation (contd.)
• Another possible interpretation is that the policy environment had stabilized somewhere around 1995-1997 (in the sense of not deteriorating anymore) and, in selected areas, it has improved since then. Thus, firms may have learned to operate under conditions of stability. In such a situation, policy improvements, even if notpervasive, could have had significant impact.
• The extent of recovery was unexpected and very vigorous. Improvement in international reserves and external performance, in general, was very good. Inflation performance was somewhat puzzling.
12/19/2002
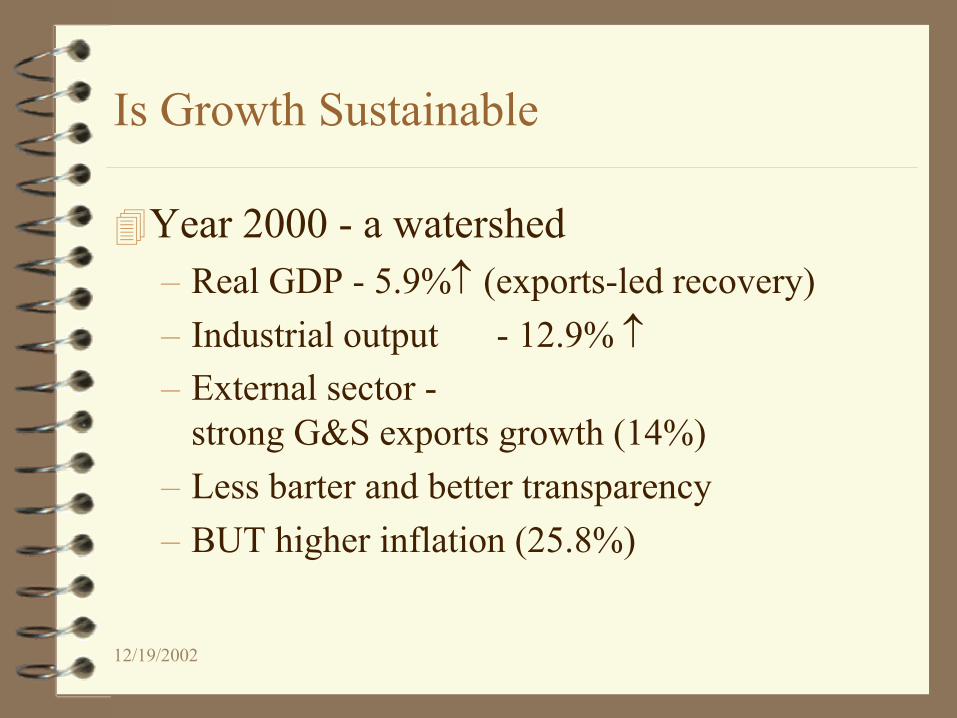
Is Growth Sustainable
Year 2000 - a watershed– Real GDP - 5.9%↑ (exports-led recovery)– Industrial output - 12.9% ↑– External sector -
strong G&S exports growth (14%)– Less barter and better transparency– BUT higher inflation (25.8%)

12/19/2002
Is Growth Sustainable
Year 2001– Real GDP - 9.1%↑
– foreign demand faded off, domestic demand gained momentum
– Outstanding performance of industry and agriculture (output ↑ by 14.2 and 9.9 percent respectively)
– Surprisingly low inflation (6.1%)– Worsened external sector conditions
» CA surplus shrank by 5.3 precent
– Hryvnia: revaluation continued, albeit decelerated, currency remained competitive.

12/19/2002
Is Growth Sustainable
Ten Months of 2002 - Summary– real GDP +4.1% ↑
– domestic demand stable, foreign – initially weakened, recently picked up
– industrial output +6.0% ↑– production of petroleum products takes a lead, metallurgy recovered
– agricultural output +3.0% ↑– high base in 2001 and overall slowdown in non-grains
– deflation totaled 2.6% – ↓ food prices, stable ER, delay in adm price & utility tariff increases
– external sector - CA surplus is growing – due to ↑ transfers and services
– hryvnia real ER posted slight devalution, terms of trade improved
12/19/2002
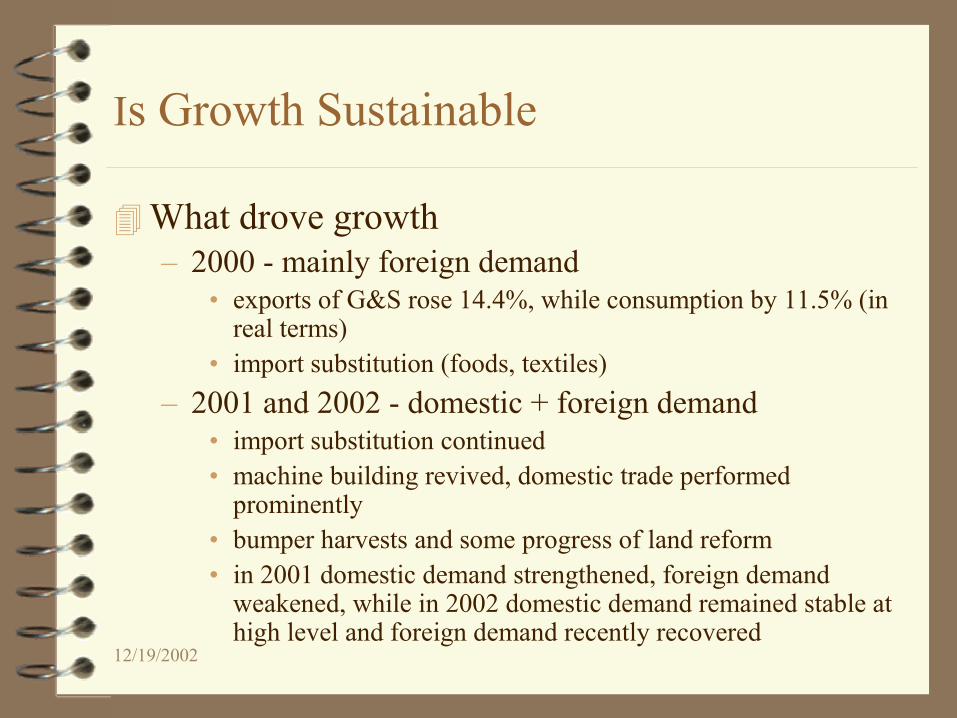
Is Growth Sustainable
What drove growth– 2000 - mainly foreign demand
• exports of G&S rose 14.4%, while consumption by 11.5% (in real terms)
• import substitution (foods, textiles)– 2001 and 2002 - domestic + foreign demand
• import substitution continued• machine building revived, domestic trade performed
prominently• bumper harvests and some progress of land reform• in 2001 domestic demand strengthened, foreign demand
weakened, while in 2002 domestic demand remained stable at high level and foreign demand recently recovered
12/19/2002
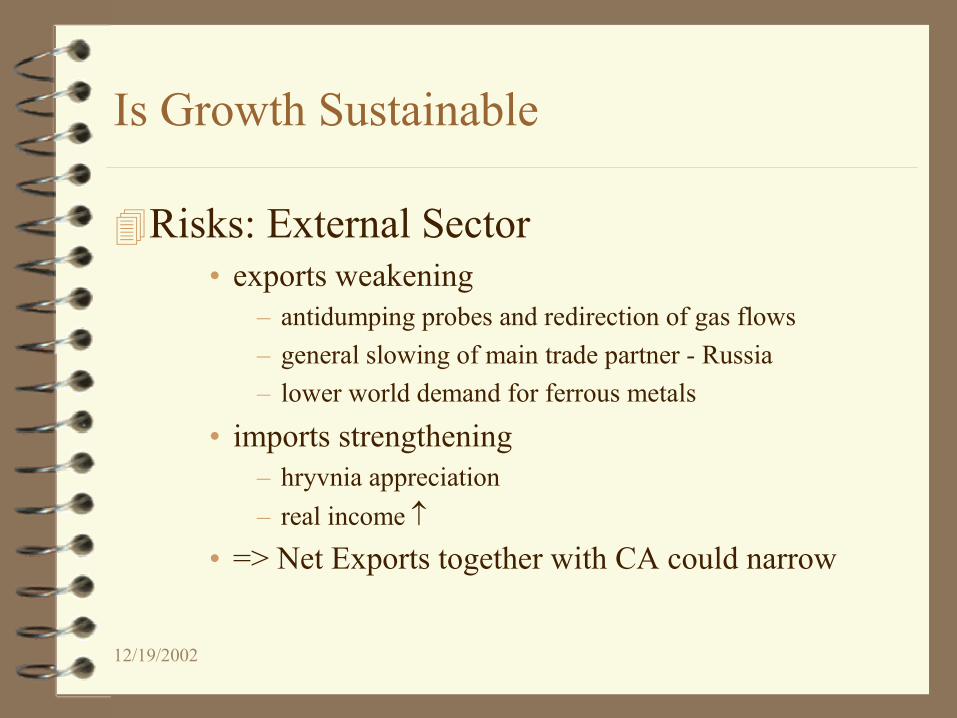
Is Growth Sustainable
Risks: External Sector• exports weakening
– antidumping probes and redirection of gas flows– general slowing of main trade partner - Russia– lower world demand for ferrous metals
• imports strengthening– hryvnia appreciation– real income ↑
• => Net Exports together with CA could narrow
12/19/2002
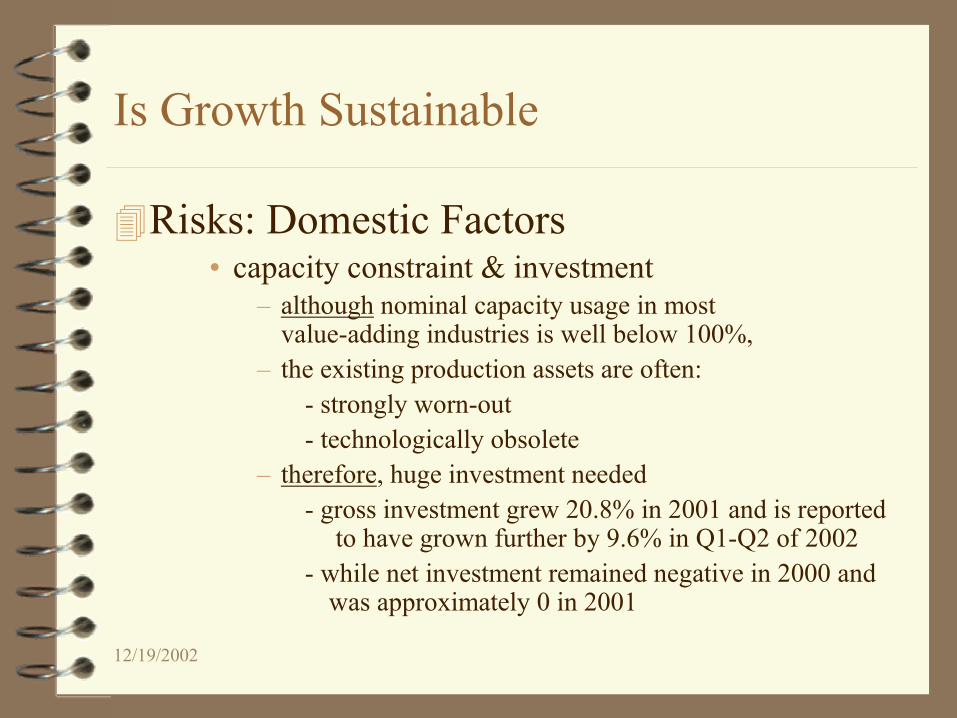
Is Growth Sustainable
Risks: Domestic Factors• capacity constraint & investment
– although nominal capacity usage in most value-adding industries is well below 100%,
– the existing production assets are often:- strongly worn-out- technologically obsolete
– therefore, huge investment needed- gross investment grew 20.8% in 2001 and is reported
to have grown further by 9.6% in Q1-Q2 of 2002 - while net investment remained negative in 2000 and
was approximately 0 in 2001
12/19/2002
Is Growth Sustainable
What to do?• maintain macro stability
– fiscal policy to support monetary policy– prudent money expansion
• promote privatization– to stimulate structural changes– to bolster private investment
• improve discipline and transparency in energy sector• reduce government intervention• strengthen agricultural reforms• rationalize the provision of social benefits

Section II
OUTPUT DEVELOPMENTS AND
SOCIAL CONDITIONS

Real Sector Developments
• Real GDP growth exhibited the U-curve pattern observed in other transition economies, but the resumption of economic growth was much delayed and it rather resembled a V-curve with the upward segment crossing into positive territory. The “pointed” shape reflects the depth of the output collapse (“overshooting”). The output was set to recover already in 1998, but the Russian crisis held the recovery back for about 1.5 years.
• Much of the contraction of industrial output was in the first two years after price liberalization, i.e. in 1992-1993, after which industrial output was roughly stable through 1999. The recovery of industrial output preceded the recovery in real GDP and has been the main source of GDP growth throughout the upturn.
• The distribution of industrial output by industry reflected in shift in the relative weights of the sectors, due to price liberalization in the initial years after independence. It also reflected the difference in real growth rates of the various sectors, which were themselves associated with the change in relative prices. This appears to have been the dominant factor more recently. The shift has occurred in favor of metals, fuel and electricity and at the expense of machine building and light industry.
• Agricultural production declined less than GDP in the first few years of independence, but the cumulative decline was almost as pronounced and protracted as that for real GDP. It is likely that the demand for agricultural output declined by relatively less in the first years of reform than that for industrial goods (the military industry, for example, underwent a major retrenchment). However, lack of structural reforms, delays in developing land market, government interference, and underinvestment have deprived the sector of its potential and output continued to sag. The recent upswing has culminated in a bumper grain harvest in 2001 and a very good outcome in 2002 too.
• Production of grain has been on a declining trend since early 90s, although its dependence on weather conditions introduced a significant random component into the time series. Wheat has been the main culture and has been therefore highly correlated with the year-to-year grain output changes. The upturn in grain production in 2001 and 2002 is partly a result of good weather and may have benefited from recent reforms.

Real GDP Growth Rate, % change over the previous year
-4
-8.7-9.9
-14.2
-22.9
-12.2
-10
-3-1.9
-0.2
5.9
9.1
4.5
-25
-20
-15
-10
-5
0
5
10
perc
ent
1990 1991 1992 1993 1994 1995 1996 1997 1998 1999 2000 2001 2002 est

Economic Recovery in Post-Socialist Countries, 2001
0 20 40 60 80 100 120 140 160
Poland
Hungary
Czech Republic *
Estonia
Belarus
Kyrgyz Republic
Latvia
Russia
Ukraine
Georgia
Moldova
Real GDP index, 1990=100
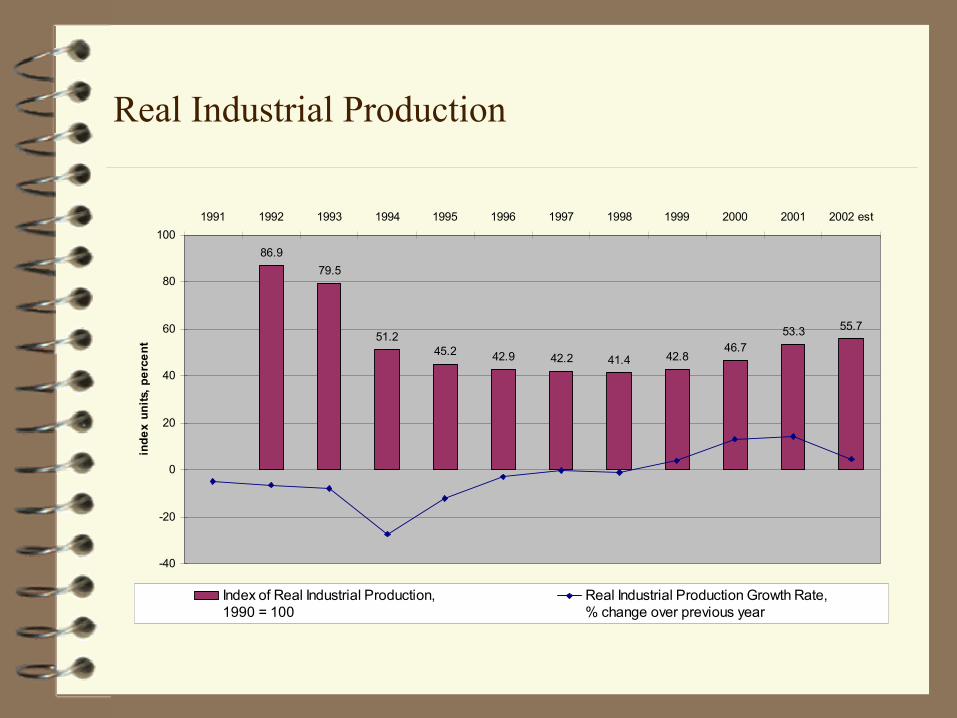
Real Industrial Production
86.979.5
51.245.2 42.9 42.2 41.4 42.8
46.753.3 55.7
-40
-20
0
20
40
60
80
100
inde
x un
its, p
erce
nt
1991 1992 1993 1994 1995 1996 1997 1998 1999 2000 2001 2002 est
Index of Real Industrial Production, 1990 = 100
Real Industrial Production Growth Rate, % change over previous year

Distribution of Industrial Output, by industry
0
10
20
30
40
50
60
70
80
90
100
1990 1993 1995 1996 1997 1998 1999 2000
perc
ent
Electric energy
Fuel
Ferrous metalls
Non-ferrous metalls
Chemicals
Machine building
Wood and paper industries
Construction materials
Light industry
Food
Other

Distribution of Industrial Output in 2000 and 2001, by industry
Ferrous metalls27%
Food17%
Other5%
Non-ferrous metalls3%
Chemicals6%
Machine building13%
Wood and paper industries
2%
Fuel10%
Electric energy12%
Construction materials3%
Light industry2%
Food and agricultural goods processing
18%
Metallurgy and processing of metals
23%
Machine building12%
Light industry2%
Wood production1%
Pulp and paper industry, publication
2%Production of coke and
refined petroleum products
4%
Extraction of non-energy materials
4%
Extraction of energy carriers
8%
Chemicals7%
Production of non-metal mineral goods
(construction materials, etc.)3%
Production and distribution of electricity,
gas and water16%
2000
2001

Ownership and Profitability
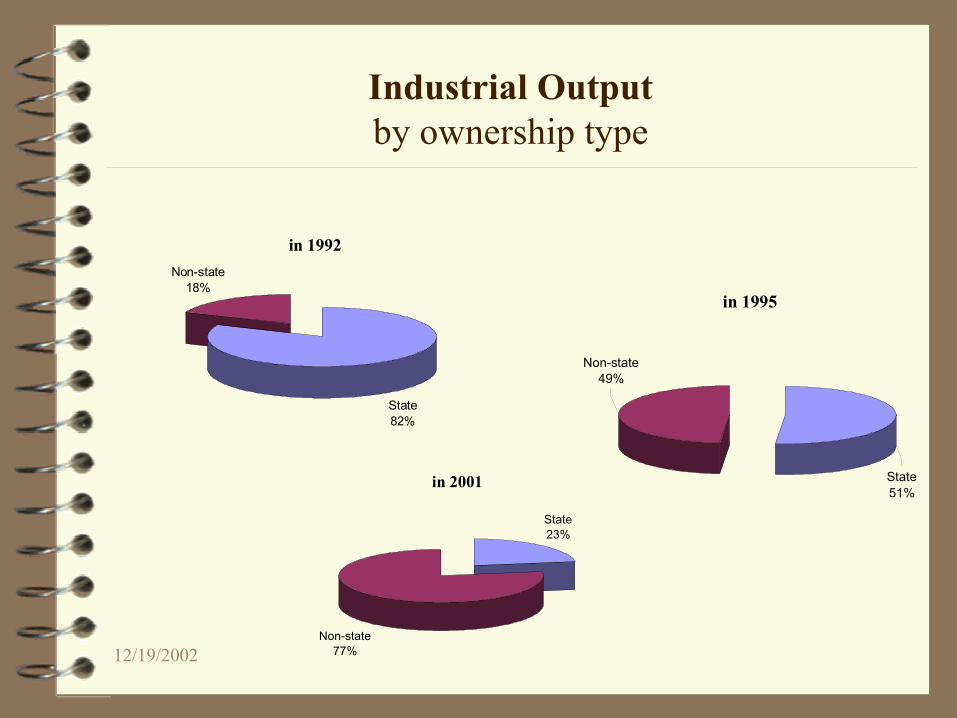
• The ownership of industrial output shifted from over 80 percent public in 1992 to 76 percent private in 2000. However, the data have to be interpreted with caution because of the definition of private as everything not 100 percent public. According to the EBRD, the role of public sector ownership continued to be high in 2000, at 40-45 percent.
• Profitability of the enterprise sector was deceptively high in early years of independence, most likely because of the pervasive subsidies, but this did not help contain the output slump. In later years, profitability worsened sharply as subsidies were cut. With the beginning of marked-based economic growth in 2000, the share of loss-making enterprises declined substantially.

Agriculture
New Land Code adopted, but reform of land ownership should be finalizedExpansion of private sector role in well functioning input markets – competition in input markets should be ensured (to minimize costs)– lending to agricultural enterprises should be prudent (to avoid bad
debts in future)
Need for: – application of market rather than administrative mechanisms in
regulation of agricultural product markets – more liberalized international trade in agricultural products

Agricultural Production
86.8%79.6% 80.8%
67.5% 65.1%58.9% 57.8%
52.1%48.5%
53.3% 55.3%
-40.0%
-20.0%
0.0%
20.0%
40.0%
60.0%
80.0%
100.0%
perc
ent
1991 1992 1993 1994 1995 1996 1997 1998 1999 2000 2001
Index of Agricultural Production,1900=100
Agricultural Production Growth Rate,% change over prev year

Production of Grains
0
10,000
20,000
30,000
40,000
50,000
60,000
1990 1991 1992 1993 1994 1995 1996 1997 1998 1999 2000 2001 2002 est
thou
sand
tons
Grains Wheat
Large Scale Privatization
• In transparent manner• Balance between attracting strategic investor and
amount of budgetary receipts• SPF should be the sole responsible agency• Asset stripping for the enterprises to be privatized
should be banned

Energy Sector
• 2001 - Rising trend in collections for:• electricity (total – 81%, cash – 65%)• gas (total – 89%, cash – 87%)
• 2002 – Collections continued to improve, but tax discipline remained poor
• Burden on balance of payments• Poor metering system that favors inefficient
enterprises and non-payers• Need for:
- maintaining and strengthening payment discipline to support increasing collections
- huge investments in gas transmission system and energy infrastructure
- comprehensive debt restructuring

12/19/2002
Energy Sector
Primary Energy Consumption, 2000Ukraine
Coal24%
Natural Gas42%
Oil18%
Nuclear & Other
16%
World
Coal29%
Natural Gas22%
Oil38%
Nuclear & Other
11%
European Union
Coal16%
Natural Gas22%
Oil42%
Nuclear & Other
20%
12/19/2002
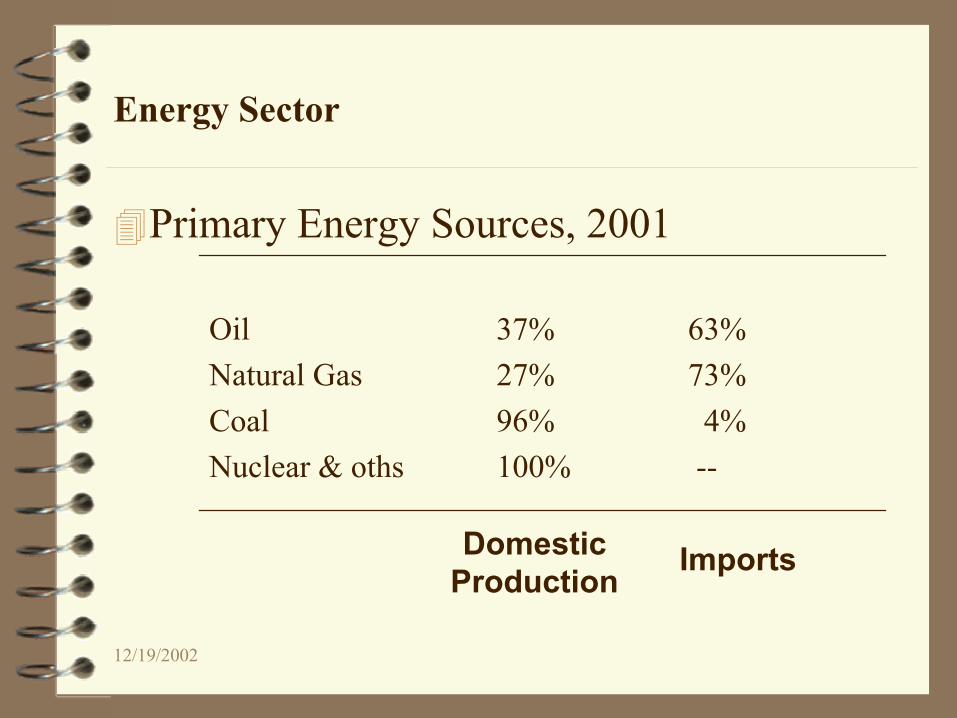
Energy Sector
Primary Energy Sources, 2001
Oil 37% 63%Natural Gas 27% 73%Coal 96% 4%Nuclear & oths 100% --
Domestic Production
Imports
12/19/2002
Energy Sector
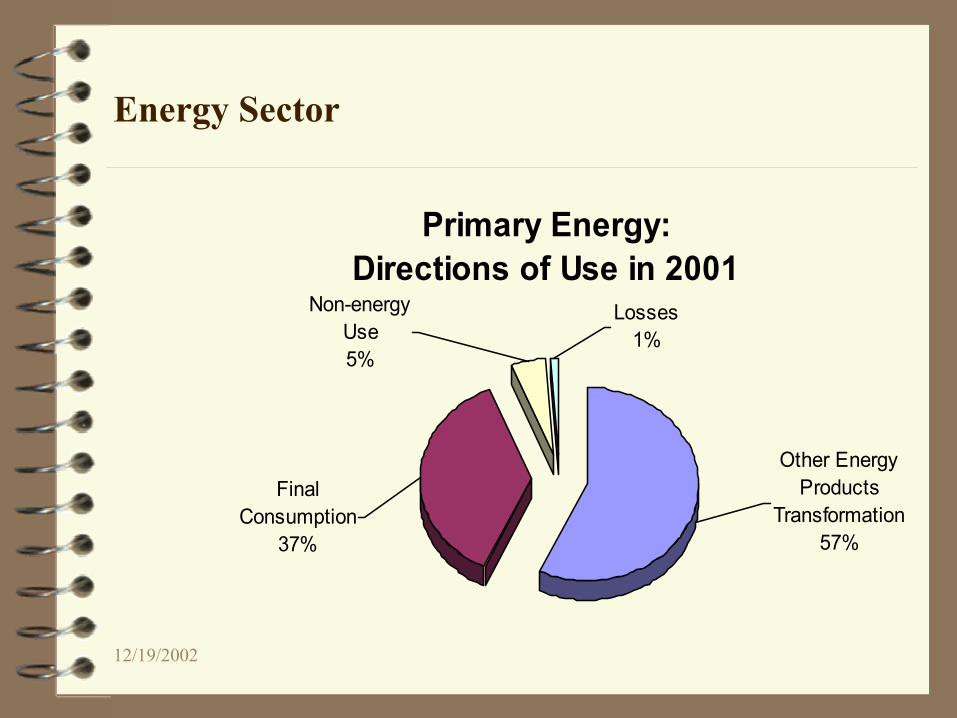
Primary Energy: Directions of Use in 2001
Non-energy Use5%
Other Energy Products
Transformation57%
Final Consumption
37%
Losses1%

Ukraine: Cash Collection Rate for Electricity(% of the total bill, cumulative)
0
20
40
60
80
100
Q1,
200
0
Q2,
200
0
Q3,
200
0
Q4,
200
0
Q1,
200
1
Q2,
200
1
Q3,
200
1
Q4,
200
1
Q1,
200
2
Q2,
200
2
Q3,
200
2

Ukraine: Cash Collection Rate for Gas by Naftogaz Ukrayiny(% of the total bill, cumulative)
0
10
20
30
40
50
60
70
80
90
100
Q1,
200
0
Q2,
200
0
Q3,
200
0
Q4,
200
0
Q1,
200
1
Q2,
200
1
Q3,
200
1
Q4,
200
1
Q1,
200
2
Q2,
200
2
Q3,
200
2
12/19/2002
Industrial Output by ownership type
in 1992
State 82%
Non-state18%
in 1995
Non-state49%
State 51%
in 2001
State 23%
Non-state77%
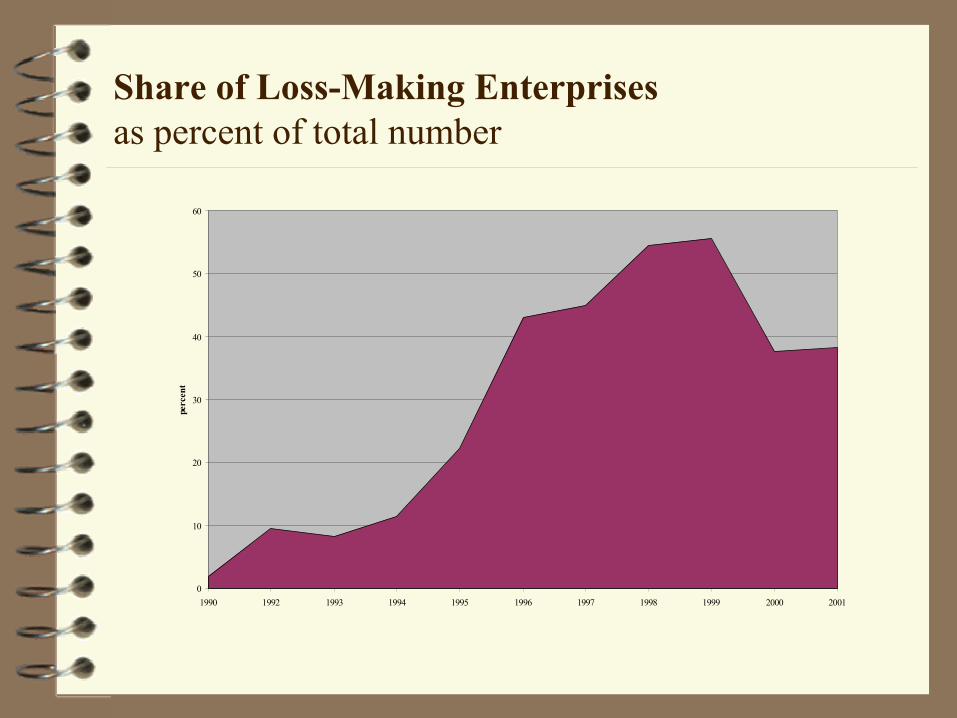
Share of Loss-Making Enterprisesas percent of total number
0
10
20
30
40
50
60
1990 1992 1993 1994 1995 1996 1997 1998 1999 2000 2001
perc
ent
12/19/2002
Human Development
– The UNDP Human Development Report shows a decline of about 5 percent in the Human Development Index (New Series) between 1992 and 1997, when it touched its minimum. A slow recuperation since then has implied an improvement of about 2 percent by end-2000.

Ukraine's Human Development Index, 1992-2000
0.660
0.680
0.700
0.720
0.740
0.760
0.780
1992 1993 1994 1995 1996 1997 1998 1999 2000
According to UNDP Ukraine Human Development Report, 1997According to UNDP Ukraine Human Development Report, 2000-2001