Prepared by J. P. Singh & Associates in association with Mohamed Ashour, Ph.D., PE West Virginia...
43
Prepared by J. P. Singh & Associates in association with Mohamed Ashour, Ph.D., PE West Virginia University Tech and Gary Norris Ph.D., PE University of Nevada, Reno APRIL 3/4, 2006 Computer Program DFSAP D eep F oundation S ystem A nalysis P rogram Based on Strain Wedge Method W ashington S tate D epartm ent of T ransportation
-
Upload
ashlie-obrien -
Category
Documents
-
view
213 -
download
0
Transcript of Prepared by J. P. Singh & Associates in association with Mohamed Ashour, Ph.D., PE West Virginia...

Prepared byJ. P. Singh & Associates
in association with
Mohamed Ashour, Ph.D., PE West Virginia University Tech
andGary Norris Ph.D., PE
University of Nevada, Reno
APRIL 3/4, 2006
Computer Program DFSAPDeep Foundation System Analysis Program
Based on Strain Wedge Method
Washington StateDepartment of Transportation

PHASE I • S-SHAFT PROGRAM FOR SHORT SHAFTS• ONE-ROW SHAFT GROUP (AVE. SHAFT)• SHAFT CAP (for one row of shafts)• SOIL LIQUEFACTION
WORK PROGRESS
PHASE II• INTERMEDIATE / LONG PILE/SHAFT• SHAFT/PILE GROUP• ISOLATED SHAFT AND SHAFT GROUP
IN LIQUEFIABLE SOIL• LATERAL SOIL SPREAD• PILES/SHAFTS IN SLOPING GROUND• ROTATION & DISPLACEMENT
FOUNDATION STIFFNESSES (K11, K22,.......)
Linear and Nonlinear Equivalent Stiffness Matrix for Bridge Foundations
PRESENTATION PROGRAM
Comparison between Current Practice and the Strain Wedge Model Technique Used in Program DFSAP
Soil Liquefaction and Anticipated Lateral Spread, and their Effect on Pile/Shaft Response
Short/Intermediate/Long Pile/Shaft in Liquefied & Nonliquefied Soil Profiles, and Pile Cap Effect
DFSAP Program Demonstration (Input and Output Data)
Axially Loaded Piles and Piles in Sloping Ground

Y
X X
Z
Z
Y
Foundation Springs in the Longitudinal Direction
K11
K22K66
Column Nodes
Longitudinal
Transvers
e

y
p(Es)1
(Es)3
(Es)4
(Es)2p
p
p
y
y
y
(Es)5
p
y
Mo
Po
Pv
Laterally Loaded Pile as a Beam on Elastic Foundation (BEF)

Traditional p-y Curve Does Not Account for the Following:
• Pile Bending Stiffness (EI)• Pile Head Conditions (Free/Fixed)• Pile Cross-Section Shape (Square/Circular/H-Shape)• Pile-Head Embedment Below Ground• Soil Profile Continuity (Winkler Springs)• It was developed for Long Piles• Empirical Parameters
• Soil Liquefaction and Lateral Soil Spread
• Pile Group
• Vertical Side Shear Resistances (Large Diameter Shaft)
DIFFERENCES BETWEEN THE TRADITIONAL P-Y CURVE AND PROGRAM DFSAP

y
p(Es)1
P o
(Es)3
(Es)4
(Es)2p
p
p
y
y
y
(Es)5
p
y
Laterally Loaded Pile as a Beam on Elastic Foundation (BEF)
P P
K1 K2
4 ft4 ft
Effect of Structure Cross-Sectional Shape on Soil Reaction

Effect of the Footing Flexural Rigidity (EI) on the Distribution of the Soil Reaction
q per unit area
B
CL
q
0.5q
Kr =
Kr = 0
Rigid Footing, Kr =
Flexible Footing, Kr = 0
Footing
H
(1-2s) EP H3
6 (1-2P) Es B3
Kr =
As presented by Terzaghi (1955) and Vesic (1961)

The traditional p-y curve (in LPILE) does not account for the pile/shaft EI variationB
ased
on
th
e S
trai
n
Wed
ge M
odel
An
alys
isS tif f P ile F lex ib le P ile
p -y C u rv e a t a D ep th o f 1 .2 2 m
D en se S an d
L o o se S an d
E f f ec t o f P ile B en d in g S tif f n e ss o n th e p -y C u rv e in S an d
0 4 0 8 0 1 2 0
P ile D e f le c tio n , y , m m
0
1 0 0
2 0 0
3 0 0
4 0 0
Soi
l-P
ile
Rea
ctio
n, p
, kN
/ m EI
0.1 EI

F ree -H ea d P ileF ix ed -H ea d P ile
E ffect o f P ile -H ea d C o n d itio n s o n th e p -y C u rv e in S a n d
p -y C u rv es a t 1 .2 2 -m D ep th
D en se S a n d
L o o se S a n d
0 40 80 120P ile D eflec tio n , y , m m
0
200
400
600
Soi
l-P
ile R
eact
ion,
p, k
N /
m
Kim et al. (ASCE J., 2004)

LARGE DIAMETER SHAFT
z
T
y
p
Soil-Shaft Horizontal Resistance
Soil-Shaft Shear Resistance
Neglected with Long Shafts
PoMo
PvPoo
Moo
Pvy
FP
v
Mt
Fv
FP
FP
Fv
Fv
Vt
Ft

The Basic Strain Wedge Model in Uniform Soil
SAND
CLAY
C-
ROCK
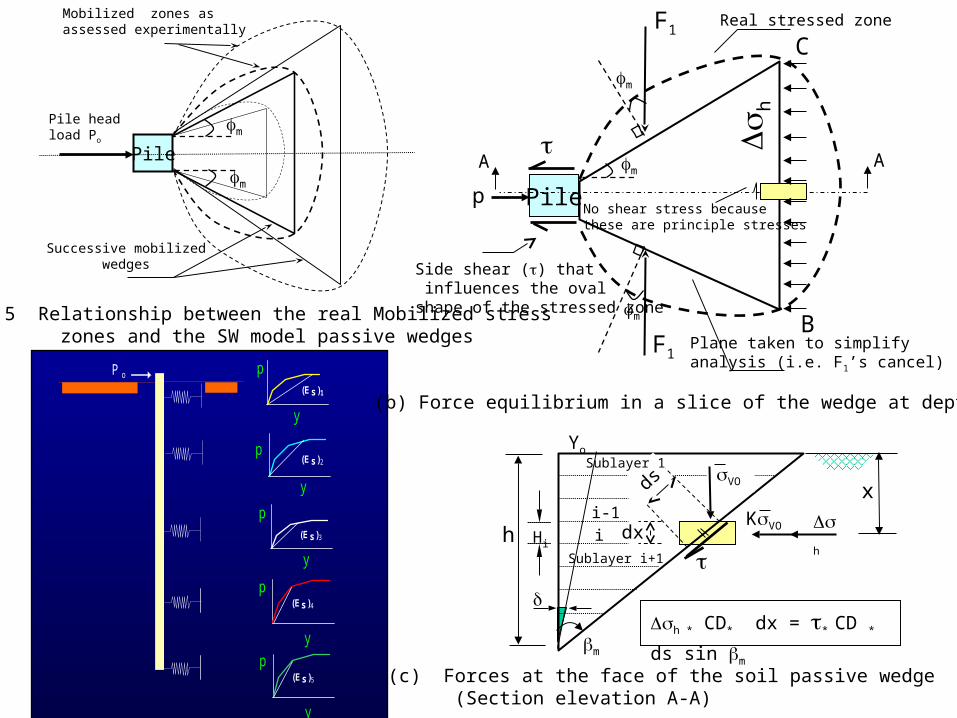
Fig. 5 Relationship between the real Mobilized stress zones and the SW model passive wedges
Mobilized zones asassessed experimentally
m
Pile
Pile head load Po
Successive mobilizedwedges
m
(c) Forces at the face of the soil passive wedge (Section elevation A-A)
m
m
m
Pile
Real stressed zone
F1
F1
No shear stress because these are principle stresses
ds
dx
h
h * CD* dx = * CD * ds sin m
A
VO
Side shear () that influences the oval shape of the stressed zone
(b) Force equilibrium in a slice of the wedge at depth x
m
KVO
p
Yo
h
x
Hii
i-1
Sublayer i+1
Sublayer 1
Plane taken to simplify analysis (i.e. F1’s cancel)
C
B
A
h
y
p(Es)1
P o
(Es)3
(Es)4
(Es)2p
p
p
y
y
y
(Es)5
p
y

Stre
ss
Strain
fs
s
y
Yield Stress (f )y
soE
Uniaxial Elastic-Perfectly PlasticNumerical Steel Model
E sE s E s
Stress-Strain Model for ConfinedConcrete in Compression
fccEc
Ecc
cc
cuCompressive Strain, c
Com
pres
sive
str
ess,
fc
Pile/Shaft Nonlinear Material Modeling

Validation Example (Chapter 6)
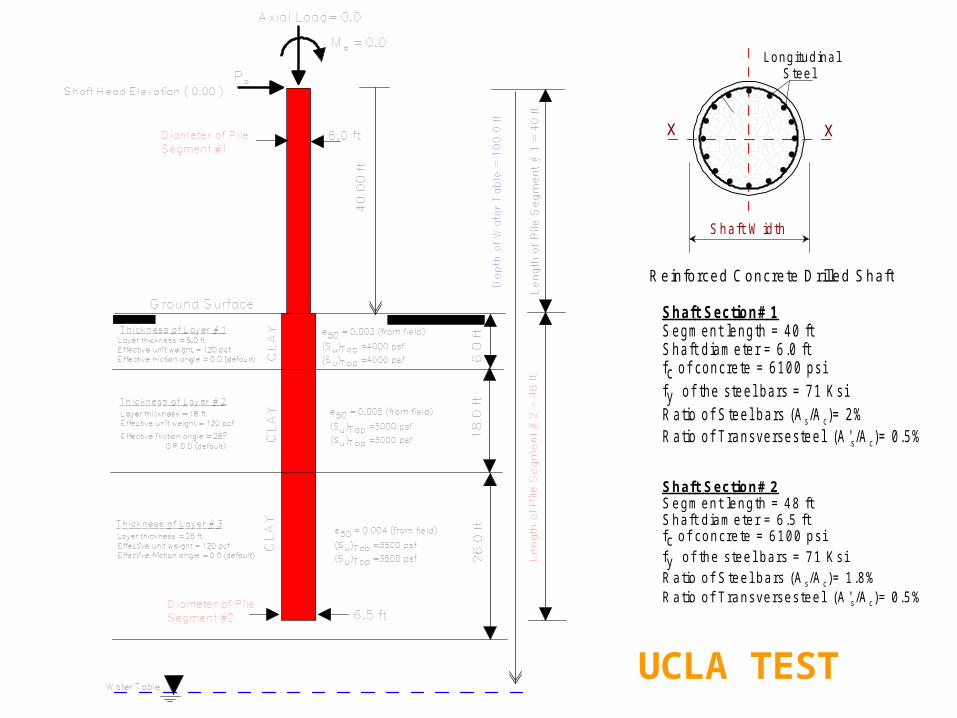
Shaft W idth
Reinforced C oncrete D rilled Shaft
x x
Longitudinal S tee l
Shaft Section# 1Segm ent length = 40 ftShaft d iam eter = 6 .0 ftfc o f concrete = 6100 psify o f the stee l bars = 71 KsiR atio of S teel bars (A s/A c)= 2%R atio of Transversesteel (A 's/A c)= 0.5%
Shaft Section# 2Segm ent length = 48 ftShaft d iam eter = 6.5 ftfc o f concrete = 6100 psify o f the stee l bars = 71 KsiR atio of S teel bars (A s/A c)= 1.8%R atio of T ransversesteel (A 's/A c)= 0.5%
UCLA TEST

0
2000
4000
6000
8000
10000
12000
14000
16000
18000
0.0000 0.0001 0.0002 0.0003 0.0004 0.0005 0.0006 0.0007 0.0008
Curvature (1/in)
Mo
me
nt
(kip
-ft)
Experimental
X_Section
swm

0
50000
100000
150000
200000
250000
300000
350000
0 5 10 15 20
Lateral Deflection, inches
Lo
ad, l
bs
Experiment SWM
Shaft Head Response at the UCLA Test

0 4 8 12 16Top d isp lacement (in )
0
10
20
30
La
tera
l L
oa
d (
kip
s)
0 100 200 300 400
Top d isp lacement (mm)
0
50
100
150
La
tera
l L
oa
d (
kN
)
FEMp-y (E xp.)p-y (A P I)SW MM easured
2-ft-Diameter Free-Head Shaft Response at the UCLA Test
Shaft Length = 25 ft (Bridge Conference, Oct. 2005)
Pile H ead Shaft
P o
2-ft Diameter Shaft
CLA
YS
and
C lay
G round Surface
20 ft
5 ft
Su = 3900 psf
e50 = 0 .007
f = 38 o
e50 = 0 .003

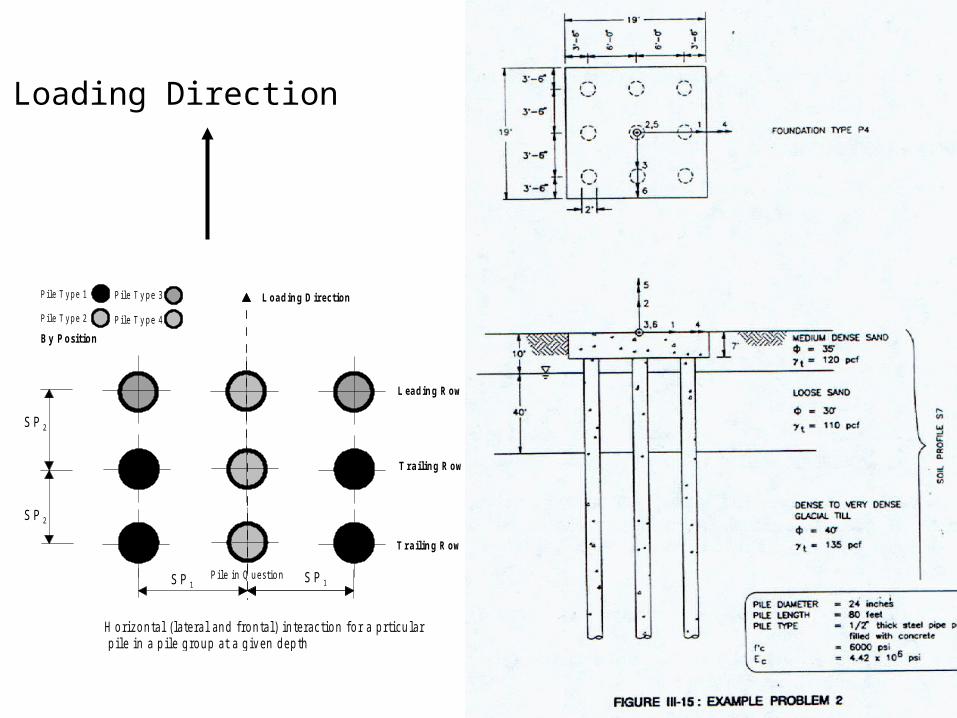
PILE GROUP

PILE GROUPPo
Pv
P-multiplier (fm) concept for pile group (Brown et al. 1988)
y
p
pgroup = fm psingle
psingle
Pile in a group
Single pile

PILE GROUP
Configuration of the Mobilized Passive Wedges, and Associated Pile Group Interference

D ev e lo p in g P ass iv e S o il W ed g e s
P ile in Q u e stio n
F ig . 7 H o rizo n ta l ( la te ra l an d fro n ta l) in te rac tio n fo r a p rticu la r p ile in a p ile g ro u p a t a g iv en d e p th
P ile T y p e 1
P ile T y p e 2 L o a d in g D irectio n
L ea d in g R o w
T ra ilin g R o w
S P 1S P 1
P ile T yp e 3
P ile T yp e 4
B y P o sitio n
S P 2
S P 2
T ra ilin g R o w

Horizontal passive wedge interference in pile group response
Pile Pile
Overlap of stresses based on elastic theory (and nonuniform shaped deflection at pile face)
Overlap employed in SW model based on uniform stress and pile face deflection
(Po)g (Po)gUniform pile face movement

Validation Examples (Report, Chapter 6)
• Lateral response of pile-group (P vs. Yo)• Response of individual piles in a group• p-y curves of individual piles

0 25 50 75P ile D eflection, y, m m
0
40
80
120
160
200
Soi
l-Pile
Rea
ctio
n, p
, kN
/m
0 25 50 75P ile D eflection, y, m m
0
0.2
0.4
0.6
0.8
1
P-M
ultip
lier
= (
p Sin
gle
/pP
ile in
a g
rou
p)
P ile Type 4 (Inside P ile)
P ile Type 3 (O utside P ile )
Ind iv idual P ile in the Leading R owAverage Leading R ow
Pile Type 3
P ile Type 4
S ingle P ile
P-m ultip lier a t 0.9 m below p ile head
p-y curve at 0 .9 m be low p ile head
S ing le Pile
G ro u p
0 20 40 60D e fle c tio n a t L o a d P o in t, Y o, m m .
0
25
50
75
100
Ave
rage
Loa
d pe
r P
ile, P
o, k
N
C om p ress ion S trok e
T en sio n S tro k e
S W M o d e lM easu red(C o m p ress io n S tro k e )(T en sio n S tro k e )
Fig. 15. Latera l p ile -head la teral load vs. deflection for an iso lated p ile and an average p ile in a 3 x 3 group in sand (a fter M orrison and R eese, 1986)
D e v e lo p in g P a ss iv e S o il W e d g e s
P ile in Q u e stio n
F ig . 7 H o rizo n ta l ( la te ra l an d fro n ta l) in te rac tio n fo r a p rticu la r p ile in a p ile g ro u p a t a g iv en d ep th
P ile T y p e 1
P ile T y p e 2
L oad in g D irection
L ea d in g R ow
T ra ilin g R ow
T ra ilin g R ow
S P 1S P 1
P ile T y p e 3
P ile T y p e 4
B y P o sitio n
S P 2
S P 2
Morrison and Reese Pile Group Test in Sands (1986)

S W M o d e lM e asu re d
0 2 0 4 0 6 0 8 0D e fle c tio n a t L o a d P o in t, Y o, m m .
0
40
80
120
160
200
Ave
rage
Loa
d pe
r P
ile,
Po
, kN
L ay e red C lay S o il (R o llin s e t a l. 1 9 9 8 )

Validation Example (Report, Chapter 6)
• Limitations of traditional p-y curves• Lateral response of isolated shaft
and shaft-group• Vertical shear side resistance effect on
diameter shafts

-0 .5 m0.0 m
3.0 m
8.0 m
12.0 m
17.0 m
25.0 m
32.0 m
= 35 o
= 19 kN /m 3
= 35 o
= 9.2 kN /m 3
= 34o
= 9.4 kN /m 3
= 34o
= 9.2 kN /m 3
S u=121.3 kN /m 2
= 9.2 kN /m 3
50 = 0.005
S u=115 kN /m 2
= 9.2 kN /m 3
50= 0.005
S u=60 kN /m 2
= 9.2 kN /m 3
50= 0.007
Sand
S and
Sand
Sand
C lay
C lay
C lay
Free head shaft
a) O rig inal so il p ro file
4.5 m
Loading D irection
b) S ix 1 .5-m -D iam eter Shaft G roup (F ixed H ead)
Shaft B1
Shaft B2
The Taiwan Test by Brown et al. 2001

In order to match the measured data using LPILE, the traditional p-y curves were modified as shown above (Brown et al. 2001)

0 40 80 120 160 200Pile Head Deflection, Yo, mm
0
1000
2000
3000
4000
Pile
He
ad
Lo
ad
, Po,
kN
Measured (Brown et al. 2001)Predicted (SW Model)No V. Side ShearWith V. Side Shear
Single 1.5-m-Diameter Shaft (B1)
Free-head

0 10 20 30 40C ap D eflection, Y g, m m
0
4000
8000
12000
Pile
Gro
up
Lat
era
l Loa
d, k
N
Measured (Brown et al. 2001)Predicted (SW Model)
Latera l R esponse of a (3 x2) P ile G roup
Fixed head

Validation Example (Treasure Island Test)
• Validation of pile classification in DFSAP• Response of individual piles in a group
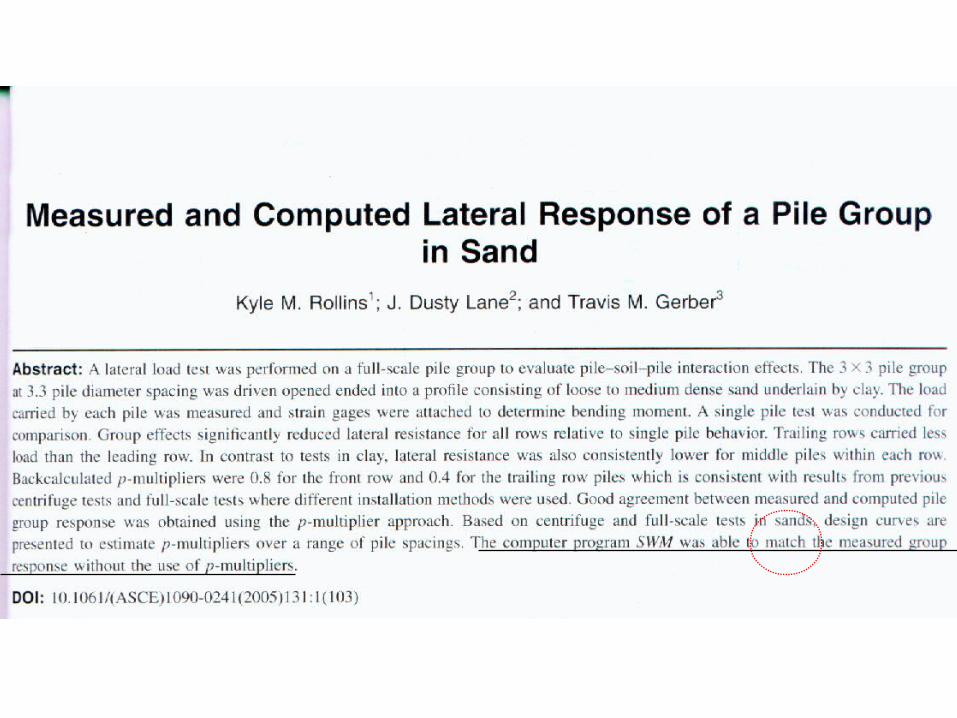

Treasure Island 3 x 3 Pile Group Test (Rollins et al., ASCE J., No. 1, 2005)

(Rollins et al. 2005, ASCE Journal)

Validation Example Report, Chapter 5
• 3 x 3 Pile group in soil Profile-S5 from WSDOT Design Manual
• Pile Cap Contribution• Pile-head effect (free and fixed)
Loading Direction
P ile in Q u e stio n
H o rizo n ta l (la te ra l an d fro n ta l) in te rac tio n fo r a p rticu la r p ile in a p ile g ro u p a t a g iv en d ep th
P ile T y p e 1
P ile T y p e 2
L oad in g D irection
L ea d in g R ow
T ra ilin g R ow
T ra ilin g R ow
S P 1S P 1
P ile T y p e 3
P ile T y p e 4
B y P o sitio n
S P 2
S P 2

3 x 3 SHAFT GROUP OF 2-FT LENGTH IN SOIL PROFILE S-7 FREE-HEAD, EXAMPLE 2
0 2 4 6 8Shaft D eflection, Y o, in
0
100
200
300
400
Sha
ft-H
ead
Load
, Po, k
ips
Pile Type 1Pile Type 2Pile Type 3Pile Type 4
Isolated Shaft
0 2 4 6 8Shaft D eflection, Y o, in
0
100
200
300
400
Sha
ft-H
ead
Loa
d, P
o, k
ips
Isolated Shaft
Average Shaft

0 0.4 0.8 1.2 1.6Shaft D eflection, Y o, in
0
100
200
300
400
500
Sha
ft-H
ead
Load
, Po, k
ips
Pile Type 1Pile Type 2Pile Type 3Pile Type 4
Iso la ted Shaft
0 0.4 0.8 1.2 1.6Shaft D eflection, Y o, in
0
100
200
300
400
500
Sha
ft-H
ead
Loa
d, P
o, k
ips
Isolated Shaft
Average Shaft
3 x 3 SHAFT GROUP OF 2-FT LENGTH IN SOIL PROFILE S-7 FIXED-HEAD, EXAMPLE 2

FIXED-HEADFREE-HEAD
0 2 4 6 8Shaft D eflection, Y o, in
0
400
800
1200
1600
2000
Sha
ft-H
ead
Load
, Po,
kip
s
Cap + Shafts
Cap
Shafts
FR EE H EAD
0 0.4 0.8 1.2 1.6Shaft D eflection, Y o, in
0
400
800
1200
1600
2000
Sha
ft-H
ead
Load
, Po,
kip
s
Cap + Shafts
Cap
Shafts

QUESTIONS ????•