Prepared by DIRECTORATE-GENERAL...
26
THE COSTS AND BENEFITS OF LOWERING THE SULPHUR CONTENT OF PETROL & DIESEL TO LESS THAN 10 PPM Prepared by DIRECTORATE-GENERAL ENVIRONMENT Sustainable Development Unit and Air and Noise Unit 9 September 2001
Transcript of Prepared by DIRECTORATE-GENERAL...

THE COSTS ANDBENEFITS OF LOWERING THE SULPHUR CONTENT OF
PETROL & DIESEL TO LESS THAN 10 PPM
Prepared by
DIRECTORATE -GENERAL ENVIRONMENT
Sustainable Development Unit
and
Air and Noise Unit
9 September 2001

i
CONTENTS
1. INTRODUCTION .................................................................................................... 1
2. SCENARIO DESCRIPTION .................................................................................. 2
2.1. “Main Scenario 2005”: Introduction of sulphur-free fuel in 2005 ......................... 22.2. “Main Scenario 2007”: Introduction of sulphur-free fuel in 2007 ......................... 32.3. “Phased-In” Scenario: Phased introduction for all vehicle types in 2007 .............. 32.4. “100% Switch for Passenger Cars in 2007” Scenario ............................................ 32.5. "Phased Introduction for Passenger Cars from 2007" Scenario ............................. 3
3. ASSUMPTIONS ....................................................................................................... 4
3.1. Emissions reductions.............................................................................................. 43.2. Additional Refinery Emissions of CO2 .................................................................. 53.3. Additional Refinery Costs ...................................................................................... 53.4. Reductions in operating costs of vehicles............................................................... 63.5. Other Assumptions ................................................................................................. 7
3.5.1. Treatment of fuel taxation .............................................................................. 73.5.2. “Homologation effect”................................................................................... 73.5.3. Representative years....................................................................................... 73.5.4. EU-9 vs whole Community ............................................................................. 83.5.5. Fate of removed sulphur................................................................................. 83.5.6. Other greenhouse gases ................................................................................. 8
4. ANALYSIS OF A PHASED-IN INTRODUCTION OF ULTRA SULPHUR-FREE FUEL TO PASSENGER VEHICLES FROM 2005 OR 2007 ONWARDS .... 8
4.1. “Main Scenario 2005” : Introduction of sulphur-free fuel in 2005 ........................ 84.2. “Main Scenario 2007”: Introduction of sulphur-free fuel in 2007 ....................... 104.3. “Phased-In” Scenario: Phased introduction for all vehicle types in 2007 ............ 114.4. “100% Switch for Passenger Cars in 2007” Scenario .......................................... 134.5. "Phased Introduction for Passenger Cars from 2007” Scenario ........................... 15
5. SUMMARY............................................................................................................. 16
Annex 1 - Assumptions regarding vehicle emissions
Annex 2 – Results per Member State (“Main 2005” Scenario)
Annex 3 – Monetary Valuation of Reductions in Non-Co2 Pollutants
1. INTRODUCTION
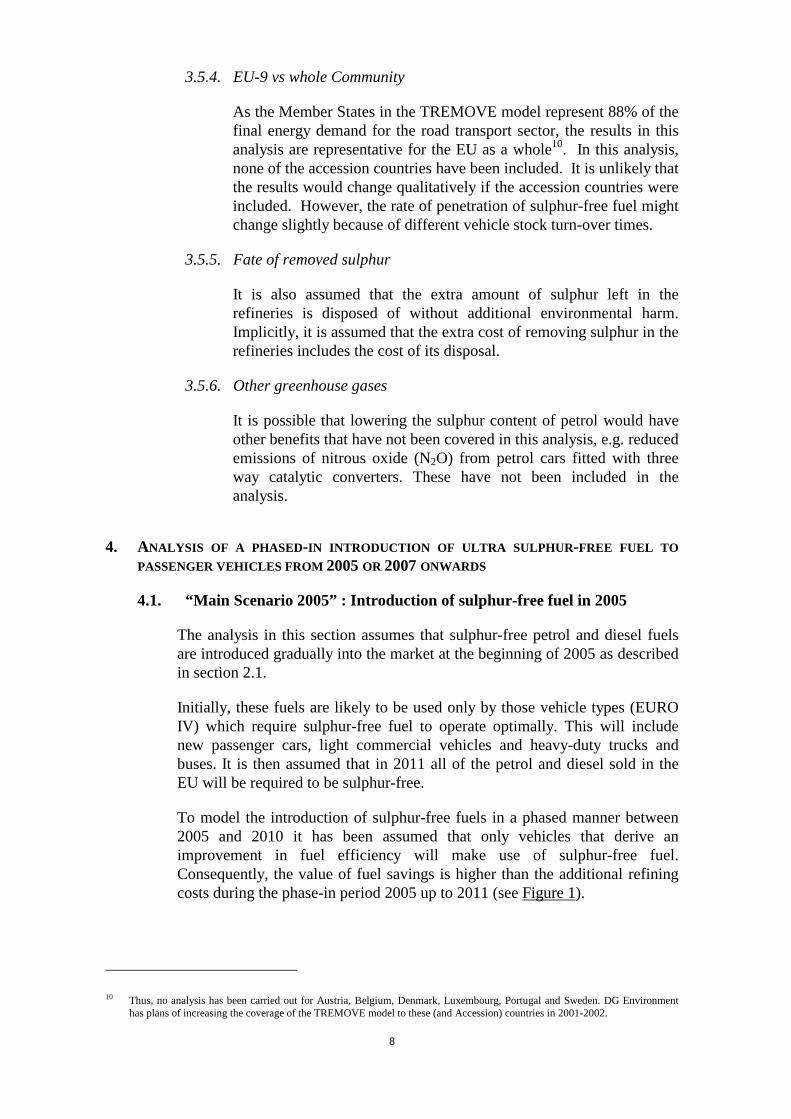
The European Commission has recently adopted a proposal to amend Directive98/70/EC on petrol and diesel quality1. The preparatory work for this proposalincluded a consultation on the need to reduce further the sulphur content of petroland diesel to below 50 parts per million (ppm). The information received wassummarised and subjected to peer-review by independent experts. The summaryreport prepared by AEA Technology and the original submissions can be found atthe Commission’s website2.
To complement this work, DG Environment also undertook an economic analysis ofthe benefits and costs of introducing sulphur-free fuels3. This note reports the mainfindings.
The “Main” scenarios considered here correspond closely to the situation containedin the Commission’s proposal. Sections 2 and 3 of the paper provide more detail onthe scenarios and assumptions used in the modelling. Section 4 provides the resultsof the analysis in terms of costs and effects on total emissions. Section 5 provides abrief summary of results. Annex 1 provides more detail on the rationale for theassumptions made concerning the effects of sulphur-free fuel on vehicle emissions.Annex 2 provides more detailed results by Member State. Annex 3gives theassumptions made in the benefit estimates for conventional (non-CO2) pollutants.
The effects of sulphur-free fuels depend on the types of vehicle in which they areused. For example, they are expected to improve the fuel efficiency of EURO IVcars (all new cars coming onto the market from 1st January 2006) but not that ofolder cars. Other EURO IV vehicle types including light commercial diesel vehiclesand heavy duty vehicles are also expected to improve their fuel economy. On theother hand, the production of sulphur-free fuels may require more energy and so thenet effect on CO2 emissions depends on the relative magnitude of these two effects.
The use of sulphur-free fuel is expected to reduce emissions of carbon monoxide(CO), nitrogen oxides (NOx) and volatile organic compounds (VOCs) from theexisting fleet of petrol light duty vehicles. In addition, sulphur-free fuel reduces theemissions of particulate matter from existing (EURO I-III) diesel cars, diesel light-duty vehicles and heavy-duty vehicles. It is possible that use of sulphur-free fuelwill reduce conventional emissions from EURO IV petrol vehicles as well, but forthe purposes of this paper no reduction has been assumed.
The production of sulphur-free fuel may require additional refinery processing andmay, therefore, be more expensive to manufacture due to additional investment andoperating costs for refineries. This additional expense has to be weighed against the
1 COM(2001) 241 final. Adopted on 11 May 2001.
2 http://www.europa.eu.int/comm/environment/sulphur/index.htmConsultation on the need to reduce the sulphur content of petrol and diesel fuels below 50 ppm – A policy maker’s summary.George Marsh, Nikolas Hill, Jessica Sully, AEA technology November 2000.
3 In this context “sulphur-free” refers to a sulphur content of less tan 10 mg/kg (ppm). These fuels are also referred to as “near-zero sulphur” or “ultra-low sulphur”.

2
reduced fuel costs for operators of vehicles that run more efficiently with sulphur-free fuel.
2. SCENARIO DESCRIPTION
During the Auto-Oil II program (AOP II) a comprehensive transport "base-case" wasconstructed for nine EU Member States4 using the TREMOVE model, withextensive data on vehicle stocks, vehicle-kilometres travelled, and aggregateemissions. The AOP II base case assumed that all fuel used from 2006 contains amaximum of 50ppm sulphur. The TREMOVE base case was used as the startingpoint5 to analyse the following scenarios.
2.1. “Main Scenario 2005”: Introduction of sulphur-free fuel in 2005
2005: Introduction of sulphur-free diesel & petrol to new vehicles2011: 100% Sulphur-free petrol & diesel made compulsory
The analysis assumes that sulphur-free petrol and diesel fuels are introducedinto the market at the beginning of 2005. Initially, it is assumed that only newvehicle types (EURO IV) which are able to derive an improvement in fuelefficiency will use sulphur-free fuels. This will include new passenger cars,light commercial vehicles and heavy duty trucks and buses. It is then assumedthat in 2011 all of the petrol and diesel fuel sold in the EU will be required tobe sulphur-free.
It has been also assumed that all new heavy duty vehicles sold post-2005 willexperience a fuel economy improvement when using sulphur-free diesel fuel.However, only 20% of new passenger cars and light duty vehicles sold in2005 will experience such an improvement. This is because while cars need tofollow EURO IV norms, only 20% are assumed to reap the fuel efficiencybenefit. This proportion is assumed to rise to 45% in 2006, 65% in 2007 and90% in 2008 in line with estimates given by the European Car ManufacturersAssociation in the framework of their voluntary commitment to reduce theCO2 emissions of new cars.
From 2011 existing petrol and diesel vehicles (EURO I, II,III) will also berequired to use sulphur-free fuel. The use of sulphur-free fuels by oldervehicles will produce an increase in emissions of CO2 at refineries (and resultin higher refinery costs) which will not be offset by improvements in newvehicle fuel economy. However, it will lead to benefits in terms of reducedemissions of conventional regulated pollutants from these older vehicle types.
4 These were Finland, France, Germany, Greece, Ireland, Italy, the Netherlands, Spain and the UK. According to Eurostat Sirenedatabase in 1998, transport fuel consumption in these Member States is 88% of total final energy demand of road transportsector in the EU. Thus, these Member States are considered representative for the purposes of this analysis.
5 The TREMOVE bases case includes the expected effects of the voluntary agreement with ACEA, JAMA and JAMA to improvethe fuel efficiency of new vehicles. The base case files can be found athttp://europa.eu.int/comm/environment/enveco/auto-oil/index.htm.

3
2.2. “Main Scenario 2007”: Introduction of sulphur-free fuel in 2007
2007: Introduction of sulphur-free diesel & petrol2011: 100% Sulphur-free petrol & diesel made compulsory
This is precisely the same as the scenario above except that the date ofintroduction of sulphur-free fuels is postponed by two years to 1 January2007. The date for 100% sulphur-free fuels is 2011, the same as in the “MainScenario 2005”.
As above, it has been assumed that 65% of new cars and vans sold willexperience a fuel economy improvement when using sulphur-free fuels in2007. ) This share rises to 90% in 2008. All heavy-duty vehicles sold in 2007and thereafter are assumed to experience a fuel economy benefit when usingsulphur-free diesel.
2.3. “Phased-In” Scenario: Phased introduction for all vehicle types in 2007
2007: Sulphur-free fuels introduced at a rate required by new EURO IV vehicles
In this scenario it is assumed that both petrol and diesel fuels are introducedinto the market in the quantities that are required by the fleet of new EURO IVvehicles. It is also assumed that the existing fleet of (pre-EURO IV) vehiclesdo not use sulphur-free fuel but continue to use fuel with a maximum sulphurcontent of 50 ppm. Therefore, there are no reductions in emissions ofconventional pollutants in this scenario. Costs of producing the sulphur-freefuels at the refinery are calculated as a proportion of the cost that would beassociated with producing sulphur-free fuels for the whole fleet.
2.4. “100% Switch for Passenger Cars in 2007” Scenario
2007: Sulphur-free fuels introduced for compulsory use by all passenger cars
In this scenario it is assumed that the sale of sulphur-free petrol and diesel fuelis mandatory from 2007 for all passenger cars. The refinery costs andadditional refinery emissions of CO2 are calculated as a proportion of theoverall cost and emissions associated with 100% production of sulphur-freefuels for use by all vehicle types.
2.5. "Phased Introduction for Passenger Cars from 2007" Scenario
2007: Sulphur-free fuels introduced at rate required by EURO IV passenger cars
This scenario is identical to the "phased-in" scenario at Section 2.3 above,except that the use of sulphur-free fuels is restricted to passenger cars. Vans,trucks and buses are assumed to continue to use fuel with a maximum sulphurcontent of 50 ppm. The difference between this scenario and that above is ofinterest because the proportion of cars which run on diesel is low compared toother vehicle types (vans, trucks and buses). This matters because the CO2
savings from sulphur free fuel are assumed to be slightly higher from petrolthan from diesel.

4
3. ASSUMPTIONS
Modelling the precise costs and effects of the availability of sulphur-free fuels is apotentially complicated exercise. First, sulphur-free fuel has different effects ondifferent vehicle types, and these effects are not known with certainty. Secondly, thetake up and use of sulphur-free fuels depends not only on market prices but alsoother determinants of consumer behaviour and this is difficult to predict withconfidence. Thirdly, the additional costs of producing lower sulphur fuels may varyfrom place to place depending on the refinery configuration and crude oil used. Anumber of simplifying assumptions have therefore been made and these are set outin the rest of this section.
3.1. Emissions reductions
The relative reductions in emissions of CO2 and conventional pollutants fromvehicles using fuels with less than 10 ppm sulphur (compared to fuels withless than 50 ppm) are given in Table 1 below.
Table 1: Assumptions on vehicle emissions changes
Emissions Reduction on 10 ppm sulphur fuelsrelative to fuels with 50 ppmVehicle type
CO2 NOx HCs PM
Petrol 3% (1-5%) 0% 0% 0%EURO IV cars
Diesel 2% (1-3%) 0% 0% 0%
Petrol 0% 10% 10% 0%EURO I,II,III cars
Diesel 0% 0% 0% 5%
Petrol 0% 0% 0% 0%EURO IV vans
diesel 2% (1-3%) 0% 0% 0%
petrol 0% 10% 10% 0%EURO I,II,III vans
diesel 0% 0% 0% 5%
EURO IV/+ HDVs diesel 2% (1-3%) 0% 0% 0%
EURO I,II,III HDVs diesel 0% 0% 0% 5%
A more detailed description of these figures can be found in Annex 1.
There is some uncertainty about the precise effects of sulphur-free fuel on fuelefficiency for EURO IV petrol vehicles. The figures submitted to theCommission’s “Call for Evidence” lie in the range 1% to 5%. The mean ofthese two numbers (3%) has been used in this paper. For EURO IV dieselvehicles figures from the submissions to the “Call for Evidence” lie in therange 1% to 3% and so 2% has been used.
Concerning EURO I, II and III petrol vehicles using sulphur-free fuel, a flatreduction in emissions of 10% for conventional (non-CO2) emissions (CO,NOx and VOCs) has been assumed. For existing diesel vehicles a reductionin emissions of particulate matter of 5% has been assumed. The rationale forchoosing these numbers rather than others in set out in Annex 1 whichprovides more information on technical aspects of emissions control.

5
When estimating the reduction in conventional emissions from existingvehicles a simple percentage reduction factor was applied to estimate thereduction. For example, suppose emissions of NOx from a conventionalEURO I-III petrol car are expected to fall by 10% when sulphur-free fuel isused. This is simulated by reducing the aggregate emissions of NOx forpassenger vehicles entering the stock before 2007 by 10%, relative to theTREMOVE base case6.
3.2. Additional Refinery Emissions of CO2
The production of sulphur-free fuel may be more energy intensive. In suchcases there will be additional CO2 emissions at the refinery in line with thevolume of sulphur-free fuel refined and produced. Volumes of fuel used canbe derived from the TREMOVE base case. The size of the CO2 emissionspenalty per unit of fuel refined is open to question, but for the purposes of thisanalysis CONCAWE/EUROPIA figures taken from the Consultation reporthave been used. These are reproduced in Table 2 below.
CONCAWE estimate that there will be additional emissions of 25 kt of CO2
for each additional Mt of sulphur-free petrol produced, and 27 kt of CO2 foreach additional Mt of diesel. If all fuel (both for passenger cars, as well as forheavy and light duty vehicles) were refined to 10 ppm quality, the emissionsfrom refineries would increase by 4.6 Mt of CO2. Sulphur-free petrolaccounts for 3.1 Mt CO2 and diesel 1.5 Mt CO2 .
Table 2: Additional CO 2 emissions at refineries
Petrol Diesel
Additional CO2 emissions associated with producing100% sulphur-free petrol and diesel (per annum)
3.1 Mt 1.5 Mt
Figures taken from CONCAWE/EUROPIA Submission to “Call for Evidence”
For scenarios where the percentage of fuel refined to meet 10 ppm sulphurlimits is less than 100%, the above figures have been adjusted on apro ratabasis. For example, if 30% of petrol is refined to 10ppm this would increaseCO2 emissions at refineries by 0.3 * 3.1 Mt.
3.3. Additional Refinery Costs
To assess the costs of using sulphur-free fuel we have to set the additionalcosts of refining sulphur-free fuel against the value of the potential fuel costsavings that arise from the greater fuel efficiency for EURO IV vehicles.
There are likely to be additional investment and refinery operating costsassociated with lowering the sulphur content from a maximum of 50 ppm to a
6 Note that this requires either a disaggregation of total emissions by type, or some assumption about the relative contribution ofdifferent types to overall pollution. In our modelling we have taken a conservative assumption that there would be no additionalreduction of CO, NOx, PM and VOC from EURO IV cars. Thus, throughout this analysis, air quality benefits arise only fromthe pre-EURO IV cars.

6
maximum of 10 ppm. DG Environment commissioned a report fromconsultants Purvin & Gertz on the costs to refiners of producing sulphur-freefuels (less than 10 ppm)7. Table 3 indicates the range of costs that theyidentified. The main driver of cost difference between north and south EU isthe quality of the crude oil (in particular the sulphur content) that therefineries are currently set up to handle. For the purposes of the scenarios inthis paper average costs have been used as given in Table 3.
Table 3: Additional refining costs (€cents per litre) used in this analysis
Petrol(min)
Petrol(max)
Petrol(ave)
Diesel(min)
Diesel(max)
Diesel(ave)
EU, North8 0.1 0.3 0.2 0.3 0.6 0.45EU, South8 0.2 0.3 0.25 0.6 0.9 0.65
The analysis from Purvin & Gertz is based upon “yardstick” catalytic crackingrefineries which represent approximately 75% of refining capacity in Europe.Costs are expected to be highest for these refineries rather than, for example,hydrocracking refinery configurations. In addition, the study assumed acomplete switch to sulphur-free fuel production in 2008. If a phasedintroduction is implemented then investment costs are likely to be lower. Thisis because some new technologies under development are likely to makefurther progress towards market utilisation and because refiners can, at leastinitially, selectively desulphurise some fuel components for the 10 ppmsulphur pool whilst leaving others for the 50 ppm pool.
3.4. Reductions in operating costs of vehicles
As indicated above, it is estimated that the use of sulphur-free fuel woulddecrease the fuel consumption of EURO IV cars by an average of 3% forpetrol cars and around 2% for diesel cars. Fuel consumption of older vehiclesis assumed to be unaffected. It is likely that sulphur-free fuel would havepositive effects on fuel consumption for diesel light duty vehicles and heavygoods vehicles of a similar order to those for diesel cars (see Table 1 above).
The TREMOVE base case contains figures for the average fuel consumptionfor small, medium and large passenger cars9. This information can be used toassess the value of the savings that arise due to improvements in fuelefficiency.
7 ULS gasoline and diesel refining study. C.H. Birch & R. Ulivieri, Purvin & Gertz, November 2000.http://www.europa.eu.int/comm/environment/sulphur/index.htm
8 “EU, North” includes Austria*, Belgium*, Denmark*, Finland, Germany, Ireland, Luxembourg*, the Netherlands, Sweden* andthe UK. “EU South” includes Greece, Italy, Portugal* and Spain. Note: For the purposes of this analysis, France wasconsidered 50% North and 50% South. The Member States with an asterisk are not analysed as they are not included in theTREMOVE model. Note that in Finland and Sweden 10 ppm diesel fuel is already the norm.
9 Both petrol and diesel. However, in TREMOVE small diesel cars are grouped together with medium sized diesel cars.

7
3.5. Other Assumptions
3.5.1. Treatment of fuel taxation
The current EU price before tax for petrol is around€0.24 per litre forpetrol and€0.23 per litre for diesel. The cost increases at the refiningstage from lowering the sulphur content to 10ppm therefore representan increase of around 1-2%. At the petrol pump, however, thepercentage increase seen by the consumer will be much smaller, asaround three quarters of the price of fuel to the consumer is made upof excise duties and VAT.
It is important to note that consumers using EURO IV vehicles willbenefit from the use of a fuel that improves fuel efficiency. For eachunit of fuel they save not only do they not have to pay the productioncost, but they also do not pay tax to the fiscal authority. The high rateof tax therefore provides an indirect stimulus for penetration into themarket of sulphur-free fuel for those vehicles, which benefit from animprovement in fuel efficiency.
However, the benefit to the consumer of reduced tax payments is off-set by the losses of revenue to the tax authority, so there is no netsaving for society as a whole in that regard. Therefore, in examiningthe costs of introducing sulphur-free fuel we focus only on theadditional refining cost and the value of any fuel savings excludingtaxes.
3.5.2. “Homologation effect”
As the EURO IV vehicle emission standards have already been fixedin legislation it can be argued that reducing the levels of sulphur infuels to below 10 ppm (from 50 ppm) will have no further effect onemissions of regulated pollutants (NOx, CO, PM, Hydrocarbons).This is because there is no obligation on manufacturers to producevehicles that perform better than the mandated standard. As there isno minimum sulphur content for type-approval reference fuels avehicle can be certified on sulphur-free fuel although in practice itwould actually use a higher sulphur fuel. Consequently, for thepurposes of this analysis no conventional pollutant benefits have beenassumed for EURO IV vehicles.
3.5.3. Representative years
For simplicity, figures for the EU as a whole are presented althoughthe underlying analysis was performed on an individual MemberState basis. Figures disaggregated by Member State can be found inAnnex 2. Information for three representative years (2005 or 2007;2012 and 2020) is given rather than a complete time series for theperiod 2005-20 or 2007-20 though this is available.
8
3.5.4. EU-9 vs whole Community
As the Member States in the TREMOVE model represent 88% of thefinal energy demand for the road transport sector, the results in thisanalysis are representative for the EU as a whole10. In this analysis,none of the accession countries have been included. It is unlikely thatthe results would change qualitatively if the accession countries wereincluded. However, the rate of penetration of sulphur-free fuel mightchange slightly because of different vehicle stock turn-over times.
3.5.5. Fate of removed sulphur
It is also assumed that the extra amount of sulphur left in therefineries is disposed of without additional environmental harm.Implicitly, it is assumed that the extra cost of removing sulphur in therefineries includes the cost of its disposal.
3.5.6. Other greenhouse gases
It is possible that lowering the sulphur content of petrol would haveother benefits that have not been covered in this analysis, e.g. reducedemissions of nitrous oxide (N2O) from petrol cars fitted with threeway catalytic converters. These have not been included in theanalysis.
4. ANALYSIS OF A PHASED-IN INTRODUCTION OF ULTRA SULPHUR -FREE FUEL TO
PASSENGER VEHICLES FROM 2005OR 2007ONWARDS
4.1. “Main Scenario 2005” : Introduction of sulphur-free fuel in 2005
The analysis in this section assumes that sulphur-free petrol and diesel fuelsare introduced gradually into the market at the beginning of 2005 as describedin section 2.1.
Initially, these fuels are likely to be used only by those vehicle types (EUROIV) which require sulphur-free fuel to operate optimally. This will includenew passenger cars, light commercial vehicles and heavy-duty trucks andbuses. It is then assumed that in 2011 all of the petrol and diesel sold in theEU will be required to be sulphur-free.
To model the introduction of sulphur-free fuels in a phased manner between2005 and 2010 it has been assumed that only vehicles that derive animprovement in fuel efficiency will make use of sulphur-free fuel.Consequently, the value of fuel savings is higher than the additional refiningcosts during the phase-in period 2005 up to 2011 (see Figure 1).
10 Thus, no analysis has been carried out for Austria, Belgium, Denmark, Luxembourg, Portugal and Sweden. DG Environmenthas plans of increasing the coverage of the TREMOVE model to these (and Accession) countries in 2001-2002.

9
Table 4: ”Main scenario 2005” - Costs, benefits and emissions reductions
Sulphur-free fuels introduced from 2005 2005 2012 2020
CO2 emissions changes
Change in CO2 emissions in refineries, (kT) 215.7 5,348.3 5,404.3
CO2 change from cars (3% petrol 2% diesel), (kT) -562.8 -8,241.6 -14,960.5
Net change (- = decrease in CO2 emissions) -347.1 -2,893.2 -9,556.2
Costs and Benefits,€ million
Increase in refining costs (average per year) -39.0 -816.9 -831.4
Savings due to lower fuel consumption (average) 54.1 795.5 1,441.2
Benefits from better air quality 0.0 221.1 3.7
Net benefits (- depicts net costs) 15.1 199.7 613.5
Net Present Value (4%),€million 2,673.5
Changes in air related emissions
NOx, kilotonnes 0 -28.5 -0.5
VOC, kilotonnes 0 -10.6 -0.2
CO, kilotonnes 0 -135.9 -4.7
PM, tonnes 0 -280.8 -8.0
Note. All costs are without VAT or excise duties. For emissions negative signs indicate reductions, for benefits negatives signsindicate net costs. The above analysis has assumed a phased introduction of zero sulphur fuels in 2005.
Figure 1: Main Scenario 2005,€ million Figure 2: Main Scenario 2005, kilotonnes of CO2
However, all vehicles will have to use sulphur-free fuel following its fullintroduction in 2011, including those older vehicles that do not derive any fueleconomy benefits. There are therefore additional costs associated withrefining larger quantities of sulphur-free fuel that are not balanced by fuelsavings. In Figure 1 this appears as an upward spike in refining costs with nocorresponding increase in fuel savings. The result is that the gap between fuelsavings and refining costs narrows. From 2011 onwards however the fuel
0
200
400
600
800
1000
1200
1400
1600
2005 07 09 11 13 15 17 19
Additional refining costs
Fuel saving
Air quality
Total
0
2000
4000
6000
8000
10000
12000
14000
16000
2005 07 09 11 13 15 17 19
Additional refining emissions
Reduced vehicle emissions
Total change

10
savings and additional refining costs lines diverge as more new vehicles enterthe fleet, and so the number of vehicles that derive fuel efficiency savingsfrom sulphur-free fuel increases.
In Figure 2 the line showing the net CO2 balance dips for the same reason. In2011 the introduction of sulphur-free fuel for older vehicles leads to asignificant CO2 penalty, but this falls over time with fleet turnover.
For the period 2005–2011 there are no reductions in emissions ofconventional pollutants as only new EURO IV vehicles use sulphur-free fuel.Following the switch to full production of sulphur-free fuel from 2011 thereare some reductions in the emissions of conventional air pollutants from oldervehicles that yield improvements in air quality. However, as the number ofolder vehicles in the fleet falls these benefits decrease to zero. Values for thebenefit per tonne of pollutant reduced for conventional pollutants are given inAnnex 3.
The impact of this main scenario is a net present value of the benefits of€2.7billion and reduction of the CO2 emissions of 2.6 Mt of CO2 per annum duringthe first commitment period of the Kyoto Protocol (2008-2012) (see Table 4).This is primarily due to a relatively long period where fuel costs savings canaccrue and because of the fairly large number of vehicles in the fleet, whichbenefit from the use of sulphur free-fuels.
4.2. “Main Scenario 2007”: Introduction of sulphur-free fuel in 2007
This scenario differs from the one above in that sulphur-free fuels areintroduced two years later (1 January 2007). The results are set out in Table 5and Figures 3 and 4.
The impact of this main scenario is a net present value of€1.1 billion and asmaller reduction of the CO2 emissions of 1.8 Mt of CO2 per annum duringthe first commitment period of the Kyoto Protocol (2008-2012). Thesenumbers are smaller than in “Main Scenario 2005” primarily due to a shortperiod where fuel costs savings can accrue and because of the decreasednumbers of vehicles in the fleet which benefit from the use of sulphur free-fuels.

11
Table 5: ”Main scenario 2007” - Costs, benefits and emissions reductions
Sulphur-free fuels introduced from 2007 2007 2012 2020
CO2 emissions changes
Change in CO2 emissions in refineries, (kT) 407.0 5,348.3 5,404.3
CO2 change from cars (3% petrol 2% diesel), (kT) -1,245.9 -6,850.0 -13,574.9
Net change (- = decrease in CO2 emissions) -838.9 -1,501.7 -8,170.6
Costs and Benefits,€ million
Increase in refining costs (average per year) -75.4 -995.0 -1,019.0
Savings due to lower fuel consumption (average) 120.5 661.6 1,309.1
Benefits from better air quality 0.0 304.1 18.3
Net benefits (- depicts net costs) 45.2 -29.3 308.4
Net Present Value (4%),€million 1,061.2
Changes in air related emissions
NOx, kilotonnes 0 -39.0 -2.5
VOC, kilotonnes 0 -14.4 -0.9
CO, kilotonnes 0 -176.8 -9.9
PM, tonnes 0 -366.7 -11.8
Note. All costs are without VAT or excise duties. For emissions negative signs indicate reductions, for benefits negatives signsindicate net costs. The above analysis has assumed a phased introduction of zero sulphur fuels from 1 January 2007.
Figure 3: Main Scenario 2007,€ million Figure 4: Main Scenario 2007, kilotonnes of CO2
-200
0
200
400
600
800
1000
1200
1400
2007 09 11 13 15 17 19
Additional refining costs
Fuel saving
Air quality
Total
0
2000
4000
6000
8000
10000
12000
14000
16000
2007 09 11 13 15 17 19
Additional refining emissions
Reduced vehicle emissions
Total change
4.3. “Phased-In” Scenario: Phased introduction for all vehicle types in 2007
This scenario assumes that sulphur-free fuel is introduced in line with thenumber of vehicles that can benefit from a fuel efficiency improvement. Theassumption is, therefore, that sulphur-free fuel is available for those who areable to take advantage of its improved fuel efficiency, but it is not
12
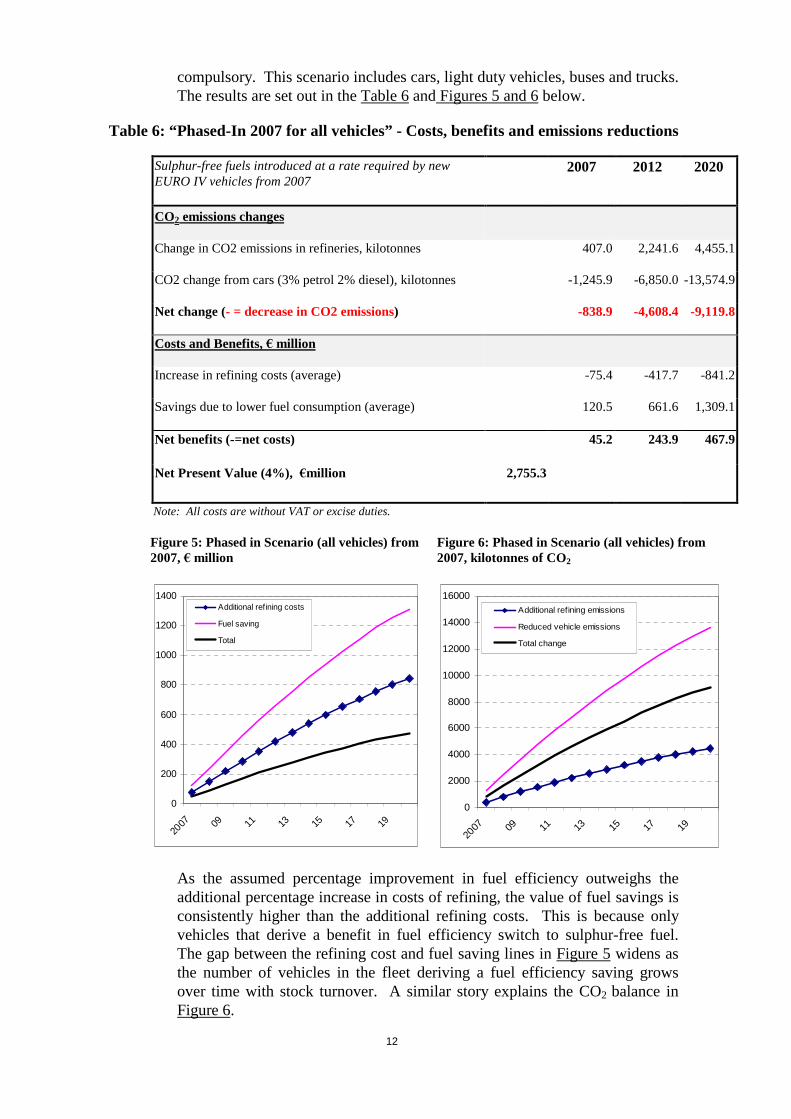
compulsory. This scenario includes cars, light duty vehicles, buses and trucks.The results are set out in the Table 6 and Figures 5 and 6below.
Table 6: “Phased-In 2007 for all vehicles” - Costs, benefits and emissions reductions
Sulphur-free fuels introduced at a rate required by newEURO IV vehicles from 2007
2007 2012 2020
CO2 emissions changes
Change in CO2 emissions in refineries, kilotonnes 407.0 2,241.6 4,455.1
CO2 change from cars (3% petrol 2% diesel), kilotonnes -1,245.9 -6,850.0 -13,574.9
Net change (- = decrease in CO2 emissions) -838.9 -4,608.4 -9,119.8
Costs and Benefits,€ million
Increase in refining costs (average) -75.4 -417.7 -841.2
Savings due to lower fuel consumption (average) 120.5 661.6 1,309.1
Net benefits (-=net costs) 45.2 243.9 467.9
Net Present Value (4%), €million 2,755.3
Note: All costs are without VAT orexcise duties.
Figure 5: Phased in Scenario (all vehicles) from2007,€ million
Figure 6: Phased in Scenario (all vehicles) from2007, kilotonnes of CO2
0
200
400
600
800
1000
1200
1400
2007 09 11 13 15 17 19
Additional ref ining costs
Fuel saving
Total
0
2000
4000
6000
8000
10000
12000
14000
16000
2007 09 11 13 15 17 19
Additional refining emissions
Reduced vehicle emissions
Total change
As the assumed percentage improvement in fuel efficiency outweighs theadditional percentage increase in costs of refining, the value of fuel savings isconsistently higher than the additional refining costs. This is because onlyvehicles that derive a benefit in fuel efficiency switch to sulphur-free fuel.The gap between the refining cost and fuel saving lines in Figure 5 widens asthe number of vehicles in the fleet deriving a fuel efficiency saving growsover time with stock turnover. A similar story explains the CO2 balance inFigure 6.

13
4.4. “100% Switch for Passenger Cars in 2007” Scenario
The compulsory use of sulphur-free fuels by all passenger cars from 2007onwards has been analysed. Other vehicle types are assumed not to usesulphur-free fuels. Table 7 and the Figures 7 and 8below show the costs andbenefits and CO2 balance if sulphur-free fuel is used by all passenger cars (butnot by trucks and vans)11.
Mandatory use of sulphur-free fuel would ensure full take up by EURO IVvehicles that derive an improvement in fuel efficiency. But it would alsoimply the use of sulphur-free fuel by older cars that derive no improvement infuel efficiency. The effect is that the additional refining costs in 2007 arehigher than the value of fuel savings. In addition, for older vehicles the net"well to wheel" effect of sulphur-free fuel on CO2 is negative, due to thehigher CO2 emissions at the refining stage. Therefore, the mandatoryintroduction of sulphur-free fuels in 2007 leads to an immediate CO2 penaltywhose eventual scale would depend on developments in refining technology.This is evident in Figure 8, where the CO2 balance is negative for the first fewyears.
The overall effect on CO2 will clearly depend on the relative balance of EUROIV and later vehicles in the fleet. As the number of EURO IV vehicles in2007 will be small the balance is negative to begin with, but this graduallychanges over time as the number of EURO IV vehicles in the fleet grows. Across over date occurs when the net effect of the introduction of sulphur-freefuels moves from negative to positive in terms of the balance between refiningcosts and fuel savings, and in terms of CO2. This cross over point will vary byMember State depending on how quickly the vehicle fleet turns over, but forthe EU as a whole the date is estimated to be around 2010.
On the other hand, it is expected that use of lower sulphur fuels would reduceconventional (non-CO2) emissions in pre-EURO IV cars. The air qualityimprovements constitute a significant benefit in the first few years, but theyfall away over time as older (EURO III and before) vehicles exit the fleet. Thefigures make the conservative assumption that there is no reduction inconventional pollutants from EURO IV cars using sulphur-free petrol.
11 Although the inclusion of trucks and vans would change the exact figures, we would not expect the results to changequalitatively.

14
Table 7: “Cars Only in 2007 for all vehicles” - Costs, benefits and emissionsreductions
Mandated sulphur-free fuels for all cars in 2007 2007 2012 2020
CO2 emissions changes
Change in CO2 emissions in refineries, kilotonnes 3,196.6 3,090.1 3,022.0
CO2 change from cars (3% petrol 2% diesel), kilotonnes -1,245.9 -6,850.0 -13,574.9
Net change(- = decrease in CO2 emissions), kilotonnes 1,950.6 -3,759.9 -10,552.9
Costs and Benefits,€ million
Increase in refining costs (average) -452.8 -436.7 -427.4
Savings due to lower fuel consumption (average) 86.4 472.1 927.2
Benefits from better air quality 578.4 118.4 6.5
Net benefits (-=net costs) 212.0 153.8 506.3
Net Present Value (4%),€million 2,594.4
Changes in air related emissions (- depicts reduction)
NOX, kilotonnes -78.3 -16.1 -0.9
VOC, kilotonnes -53.8 -7.7 -0.4
CO, kilotonnes -662.3 -163.1 -8.9
PM, tonnes -439.5 -113.9 -7.4
Note: All costs are without VAT orexcise duties.
Figure 7: Sulphur-free fuel to all cars in 2007("Cars only Scenario"), € million
Figure 8: Sulphur-free fuel to all cars in 2007("Cars Only Scenario"), kilotonnes of CO2
0
100
200
300
400
500
600
700
800
900
1000
2007 09 11 13 15 17 19
Additional ref ining costs
Fuel saving
Air quality
Total
-4000
-2000
0
2000
4000
6000
8000
10000
12000
14000
16000
2007 09 11 13 15 17 19
Additional refining emissions
Reduced vehicle emissions
Total change

15
4.5. "Phased Introduction for Passenger Cars from 2007” Scenario
This scenario is identical to the “all vehicle phase-in” scenario, except that thetake up of sulphur-free fuels is limited to passenger cars. As a much smallerproportion of cars run on diesel as compared to light duty vehicles or trucks,this scenario helps differentiate between the cost & benefits of sulphur-freepetrol and diesel. Table 8 and Figures 9 and 10below.
Table 8: “Phased introduction to Passenger Cars Only in 2007 for all vehicles” -Costs, benefits and emissions reductions
Sulphur-free fuels introduced at a rate required by newEURO IV passenger cars from 2007
2007 2012 2020
Changes in CO2 emissions
Change in CO2 emissions in refineries, kilotonnes 239.2 1,299.6 2,527.1
CO2 change from cars (3% petrol 2% diesel), kilotonnes -846.8 -4,609.2 -8,984.6
Net change (- depicts decrease in CO2 emissions) -607.6 -3,309.6 -6,457.5
Costs and Benefits,€ million
Increase in refining costs (average) -34.0 -184.4 -358.5
Savings due to lower fuel consumption (average) 82.3 447.3 871.6
Net benefits (-=net costs) 48.3 262.9 513.2
Net Present Value (4%),€million 2,987.4
Note: All costs are without VAT orexcise duties.
Figure 9: Phased in Scenario (cars only) from2007, € million
Figure 10: Phased in Scenario (cars only) from2007, kilotonnes of CO2
0
100
200
300
400
500
600
700
800
900
1000
2007 09 11 13 15 17 19
Additional refining costs
Fuel saving
Total
0
1000
2000
3000
4000
5000
6000
7000
8000
9000
10000
2007 09 11 13 15 17 19
Additional refining emissions
Reduced vehicle emissions
Total change
The shape of the curves is very similar to that for the “all vehicle phase-in”scenario above. As the assumed percentage improvement in fuel efficiencyoutweighs the additional percentage increase in costs of refining, the value of

16
fuel savings is consistently higher than the additional refining costs. This isbecause only vehicles that derive a benefit in fuel efficiency switch to sulphur-free fuel.
The essential difference between the scenarios is that the total benefits arehigher in the cars only scenario. This is because the additional costs ofrefining sulphur-free diesel are higher than for sulphur-free petrol, while theassumed fuel efficiency improvement for diesel vehicles is smaller. Therefore,there are net costs for diesel. Including trucks, buses and light duty vanstherefore raises total costs more than it raises the value of fuel savings, and sothe net benefits of the all vehicle phase-in are lower than for the car-onlyphase-in.
5. SUMMARY
This paper has examined the effects of shifting to sulphur-free petrol and diesel,comparing the effects on emissions of CO2 and other pollutants and costs of fivedifferent scenarios, each of which is explained in detail in Section 2. The completenumerical results are explained in Section 4. Figures in this paper are for the EU asa whole, but it is possible that there are differences between Member States. Themain results from the analysis are summarised in Table 9.
Table 9: Summary Results of the Scenarios
Reduction of CO2
during 2008-12Reduction in CO2
2013-20Total
Mt CO2
PerannumMt CO2
TotalMt CO2
PerannumMt CO2
Netpresentvalue(4%)
€ billionMain Scenario: Introduction in 2005 12.9 2.6 50.8 6.3 2.7Main Scenario: Introduction in 2007 9.2 1.8 44.5 5.6 1.1Phased-in Scenario (all vehicles) from 2007 15.8 3.2 58.8 7.3 2.8Cars only Scenario in 2007 7.8 1.6 63.1 7.9 2.6Phased-in Scenario (cars only) from 2007 11.4 2.3 41.9 5.2 3.0Note: Net Present Values (calculated using a 4% real discount rate) include net financial and air quality benefits
• The balance between pure financial benefits (fuel savings versus refinery costs),net CO2 emission reductions and air quality benefits varies from scenario toscenario. The air quality benefits are not reported separately, but their impact isincluded in the net present value of benefits.
• For all scenarios considered, the accumulated benefits (financial and air quality)are higher than the costs and there is a positive effect on overall CO2 emissionsover the period considered. During the first commitment period of the KyotoProtocol (2008-12) the CO2 reductions are estimated to be between 1.6 and 3.2Mt of CO2 per annum depending on how sulphur free fuel is phased in to themarket. After the first commitment period the CO2 savings are between 5.2 and7.9 Mt of CO2 per annum on the average i.e. about 1% of CO2 emissions of roadtransport.
• Air quality considerations would tend to favour an earlier date for the fullintroduction of sulphur-free fuels due to their positive effect on emissions fromexisting fleet of vehicles, whilst a consideration of CO2 emissions would tend to

17
favour a more progressive introduction of sulphur-free fuels. Obviously thisbalance is sensitive to technology development in the auto and refining industriesand its impact on CO2 emissions.
• The analysis seems to indicate that for petrol vehicles the benefits of a phasedintroduction in financial and CO2 terms are very significant. For diesel the CO2
balance is positive, but the economics are more sensitive to the initialassumptions about additional refining costs and fuel efficiency savings.

18
ANNEX 1 - ASSUMPTIONS REGARDING VEHICLE EMISSIONS
The quantification of vehicle emissions benefits resulting from the introduction of fuelscontaining a maximum 10 ppm sulphur are compared to similar vehicles using petrol anddiesel containing a maximum of 50 ppm sulphur. This follows from the fact that vehicleemissions standards have already been fixed for new vehicles manufactured post-2005.In addition, the sulphur content of petrol and diesel sold after 1st January 2005 has alsobeen fixed at 50 ppm.
The assumptions described briefly below are based upon the evidence submitted inresponse to the Commission’s “Call for Evidence” which is summarised in the reportprepared by AEA Technology.
Light duty diesel vehicles
Future technologies & fuel economy
From the responses to the Commission’s “Call for Evidence” it appears that in order toattain the Euro IV emissions limits light duty diesel vehicles will have to employ one ormore emission control technologies. These include NOx storage traps (NSTs), enhancedexhaust gas recirculation, selective catalytic reduction, more active oxidation catalysts,diesel particulate filters.
The use of NSTs in themselves would lead to a fuel economy disbenefit (about 3%) butthe combustion optimisation which NSTs make possible (up to 15%) is likely to morethan offset this12. There is a doubt about the viability of NSTs in the absence of 10 ppmsulphur diesel due to a possible inability to desulphate under certain operating conditionswhere the exhaust temperature is too low. In any event the NOx regeneration frequencywill vary as function of sulphur content of the diesel fuel. Increased regenerationfrequencies will lead to a fuel economy penalty.
Diesel particulate filters (DPFs) are affected in several ways by sulphur in the diesel fuel.Firstly, regeneration temperatures can be increased at higher sulphur levels which is ofimportance in some low-speed applications. Less efficient regeneration results inincreased back pressure that in turns results in a fuel economy penalty. Reduced levels offuel sulphur also results in less ash (calcium sulphate) being deposited on the filter that inturns reduces “clogging” and so improves fuel economy. In continuously regeneratingDPFs the upstream oxidation catalysts- can increase the particulate matter emissions dueto oxidation of the fuel borne sulphur to sulphate. This sulphate can also clog the DPFresulting in an increased back pressure and a fuel economy penalty. In summary, the useof DPFs with diesel containing 10 ppm sulphur can reduce fuel consumption by 3%relative to diesel containing 50 ppm sulphur13.
Current diesel vehicles use exhaust gas re-circulation (EGR) and oxidation catalysts tomeet the emissions limits for NOx, PM, carbon monoxide and hydrocarbons. Moving tolower sulphur diesel fuel will allow more active oxidation catalysts to be developed as
12 Submission to the “Call for Evidence” from the Association for Emissions Control by Catalyst, 28th July, page 13.
13 FEV Report Nov 1999,Influence of the Sulphur Content on fuel fuel consumlption and pollutant emissions of vehicles withgasoline and diesel engines.

19
less particulate sulphate will be generated. In addition, this will permit the use of moreEGR that means that the combustion can be better optimised for fuel economy.
The consensus from the “Call for Evidence” was that lowering the sulphur content ofdiesel to 10 ppm would lead to a better performance of these technologies leading toimproved fuel economy. From the available reported data it would appear that aconservative estimate of the fuel economy improvement gained from using diesel fuelwith 10 ppm sulphur (relative to fuel containing 50 ppm fuel) would be of the order 1-3%.
Existing vehicles and conventional pollutant emissions
No information was submitted in response to the “Call for Evidence” which addresses theemissions reductions in NOx, hydrocarbons and carbon monoxide following a switch todiesel fuel containing less than 10 ppm. In the benefits estimates presented here, noemissions reductions have been assumed for these pollutants from Euro III and earlierlight duty diesel vehicles.
Information was however submitted regarding emissions of particulate matter. The FEVreport14 cites tests that show that a reduction of the sulphur content from 50 ppm to 10ppm yields a reduction in emissions of particulate matter of 5%. In the absence of moredetailed information this reduction has been applied to Euro I, Euro II and Euro III cars.Both Euro II and Euro III vehicles are fitted with oxidation catalysts and are expected torespond to lower sulphur levels in a similar fashion. If anything greater benefits areexpected from Euro III vehicles as they are likely to have more active catalysts. The aftertreatment technologies on EURO IV vehicles are expected to be even more sensitive tosulphur though no emissions reductions have been assumed for these vehicles because ofthe “homologation” effect (see below).
Heavy Duty Diesel vehicles
It is expected that new heavy-duty diesel vehicles will need to employ after-treatmenttechnologies to control emissions of particulate matter and nitrogen oxides. Theseinclude diesel particulate traps, catalytic DPFs and continuously regenerating traps etc.and Exhaust Gas Recirculation or Selective Catalytic Reduction for NOx control. SCRdevices also contain oxidation catalysts to enhance the efficiency and also to ensureremoval of the reductant. The performance of all these technologies is affected bysulphur as described above and a lowering off the sulphur content is expected to permit asimilar improvement in fuel economy (i.e. 1-3%).
14FEV Report Nov 1999,Influence of the Sulphur Content on fuel fuel consumlption and pollutant emissions of vehicles withgasoline and diesel engines. Page 16

20
Light duty petrol vehicles
Future petrol vehicles and fuel economy
The automobile manufacturers have indicated that lean-burn gasoline direct injection(GDI) will become the dominant technology for petrol passenger cars. Manufacturershave indicated that some 90% of new petrol car sales will be GDI by 200815.
The GDI technology is reliant upon the NOx Storage Trap (NST) in order for suchvehicles to comply with the EURO IV emissions standards for NOx. Much informationwas submitted in response to the Commission’s “Call for Evidence” regarding the impactof sulphur on NSTs. The consensus reached by the review was that there is a fueleconomy improvement of between 1-5% of the GDI technology (with NSTs) from usingpetrol containing less than 10 ppm sulphur instead of petrol with 50 ppm sulphur.
Existing petrol cars and conventional pollutants
There is a reasonable amount of information regarding the emissions reductions may beobserved if existing petrol cars fitted with 3-way catalytic converters are switched tousing petrol containing a maximum 10 ppm of sulphur (rather than 50ppm). There areestimates based upon the results of European Programme on Emissions, Fuels and EngineTechnologies and other more recent studies from the USA. Using the EPEFE studyemissions reductions of the order of 1% would be expected. However, some havecriticised whether the EPEFE programme is appropriate as it did not study fuels with verysulphur-free contents, it only looked at EURO II vehicles and it used relatively un-agedcatalysts.
Various responses to the Commission’s Call for Evidence cited emissions reductions inthe range 13-21%16. Indeed one response cited reductions 2 to 3 times greater than these.These figures include a mixture of different test methodologies with catalysts of differentages and different generations of catalysts. For example, it has been reported and that theperformance of newer catalysts is more sensitive to the level of sulphur in petrolparticularly at low levels.
A conservative estimate has therefore been used to quantify the overall benefits. It hasbeen assumed that emissions from all 3-way catalysts (Euro I, II, III) are reduced by 10%when using petrol containing 10 ppm of sulphur (relative to 50ppm). This mayunderestimate the impact for newer catalysts but is in line with the conclusions of theFEV report17 that states that reductions of between 10 to 15% can be expected.
New light duty petrol & diesel vehicles & conventional emissions
The emissions standards of new vehicles for 2005 and beyond (Euro IV) are already fixedin the directives resulting from the Auto Oil I programme.
15 The Agreement by ACEA with the European Commission to reduce the CO2 emissions of new passenger cars in the EuropeanCommunity.
16 AEA technology, November 2000. Consultation on the need to reduce the sulphur content of petrol and diesel fuels below 50ppm. Page 14-15.
17FEV Report Nov 1999,Influence of the Sulphur Content on fuel fuel consumlption and pollutant emissions of vehicles withgasoline and diesel engines. Page 4
21
It can be argued, therefore, that there should be no discernible reduction in the in-servicepollutant emissions from these vehicles when using fuels containing 10 ppm sulphurrelative to fuels containing 50 ppm sulphur (The so-called “homologation effect”). Therationale for this is that it is unlikely that manufacturers will construct vehicles toperform better than the mandated emissions standards.
This necessarily assumes that the in-service vehicle emissions are the same as thosemeasured during the vehicle certification process. However, fuels used for type-approvaldo not have to meet any binding minimum sulphur content. In principle, therefore, it ispossible that the vehicle certification process could use near zero sulphur fuels whilst thesame vehicles would encounter fuels with a higher sulphur content whilst actually on theroad. This would very likely result in increased emissions relative to those measuredduring certification. In such circumstances, the introduction of near zero sulphur fuelswould return the levels of on-road emissions back to the certificated levels.
For the purposes of this analysis sensitivity cases have been investigated which excludepotential emissions reductions from new post-2005 cars.
22
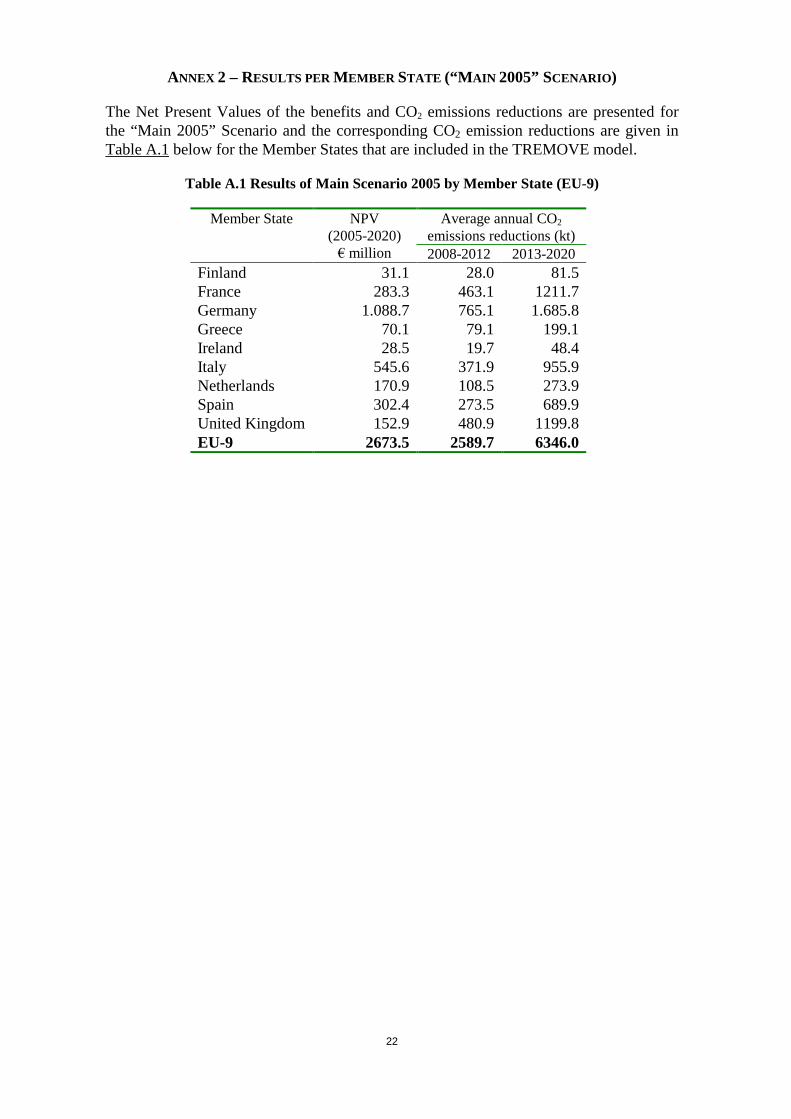
ANNEX 2 – RESULTS PERMEMBER STATE (“M AIN 2005” SCENARIO )
The Net Present Values of the benefits and CO2 emissions reductions are presented forthe “Main 2005” Scenario and the corresponding CO2 emission reductions are given inTable A.1 below for the Member States that are included in the TREMOVE model.
Table A.1 Results of Main Scenario 2005 by Member State (EU-9)
Average annual CO2emissions reductions (kt)
Member State NPV(2005-2020)€ million 2008-2012 2013-2020
Finland 31.1 28.0 81.5France 283.3 463.1 1211.7Germany 1.088.7 765.1 1.685.8Greece 70.1 79.1 199.1Ireland 28.5 19.7 48.4Italy 545.6 371.9 955.9Netherlands 170.9 108.5 273.9Spain 302.4 273.5 689.9United Kingdom 152.9 480.9 1199.8EU-9 2673.5 2589.7 6346.0

23
ANNEX 3 – MONETARY VALUATION OF REDUCTIONS IN NON -CO2 POLLUTANTS
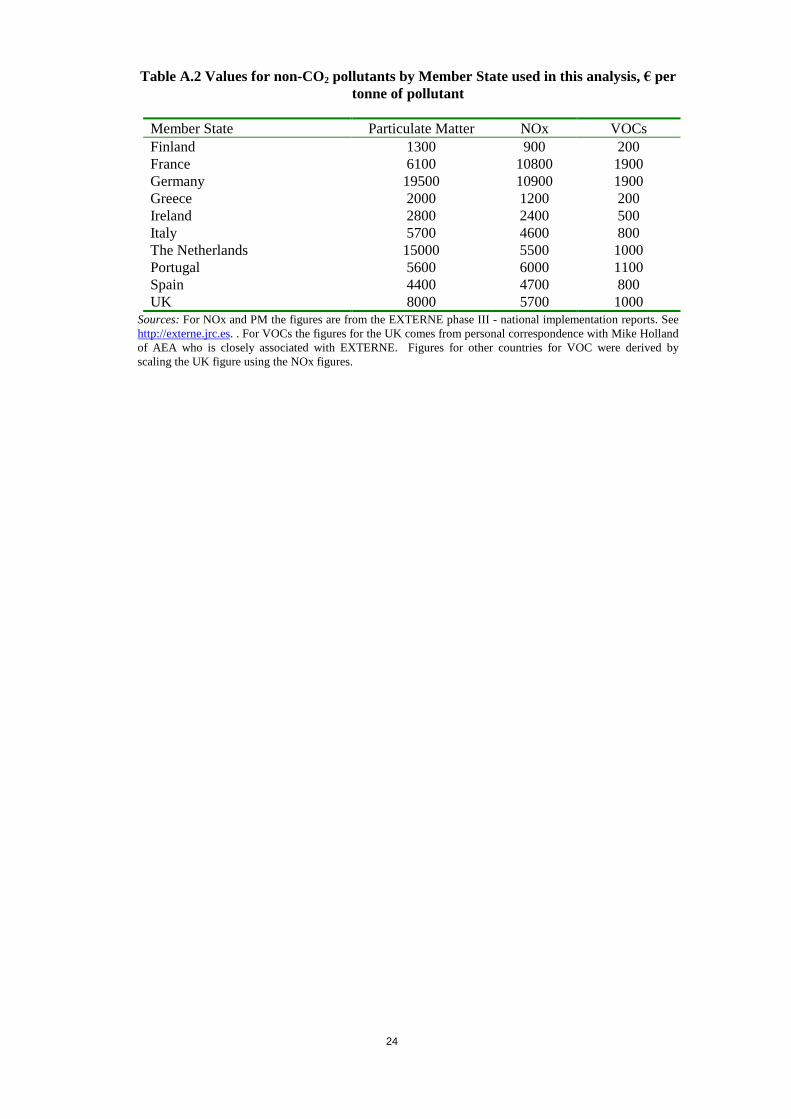
The results in Tables 4-8 show reductions in tonnes per annum of emissions innitrogen oxides (NOx), carbon monoxide (CO), volatile organic compounds (VOC)and particulate matter (PM) from a mandatory introduction in sulphur-free fuel.These reductions have a direct benefit on human health and the environment. Inorder to provide some indication of the importance of these reductions inconventional pollutants we have converted them into monetary form. We have donethis by attaching a simple cost per tonne to each tonne reduction, based on estimatesproduced under the DG RTD EXTERNE programme.
The national implementation reports for EXTERNE18 provide figures for damagecosts per tonne for NOx and particulate matter by Member State. Figures for theeffects of VOCs were obtained from an EXTERNE collaborator19. The basicapproach adopted in the EXTERNE programme to calculate monetary effects was"bottom up" – that is, starting by identifying changes in concentrations in pollutionin air linked to emissions reductions, then used a dose-response functions tocalculate impacts on the stock at risk. The number of cases is thus derived, and atotal monetary damage costs is derived by multiplying impacts by the value attachedto each case.
There is some debate about the appropriate methodologies for valuing small changesin risk. The approach taken in the latest EXTERNE work is to use an approach thatattaches a monetary value to each year of life lost as a result of premature mortality.This "value of life year" or VOLY approach tends to put a relatively low weight on"acute" deaths – impacts on those who are already chronically ill, and where themain effect is to advance death by around 6 to 12 months. The VOLY approachtherefore tends to provide lower estimates than the commonly used alternativemethod, the "value of a statistical life" or VOSL approach.
Although the DG ENV preferred position is to use a value of statistical lifeapproach, we have used the EXTERNE approach here for simplicity. The figuresused for each country (see Table A.2) are the bottom end of the ranges reported inthe EXTERNE national implementation reports. The figures include both chronic(long term) and acute (short-term) effects, both valued using a VOLY approach.These figures could therefore be seen as providing a fairly conservative estimate ofthe monetary benefits from reducing conventional pollutants.
18 See http://externe.jrc.es
19 Correspondence with Mike Holland of AEA Technology.
24
Table A.2 Values for non-CO2 pollutants by Member State used in this analysis,€ pertonne of pollutant
Member State Particulate Matter NOx VOCsFinland 1300 900 200France 6100 10800 1900Germany 19500 10900 1900Greece 2000 1200 200Ireland 2800 2400 500Italy 5700 4600 800The Netherlands 15000 5500 1000Portugal 5600 6000 1100Spain 4400 4700 800UK 8000 5700 1000
Sources:For NOx and PM the figures are from the EXTERNE phase III - national implementation reports. Seehttp://externe.jrc.es. . For VOCs the figures for the UK comes from personal correspondence with Mike Hollandof AEA who is closely associated with EXTERNE. Figures for other countries for VOC were derived byscaling the UK figure using the NOx figures.