
Prepared by · allows them to generate in an agile manner similar to traditional peaking plants....
44
Pathways to Solar Thermal Electric cost reduction Perspectives from the Abengoa Perenjori Study Prepared by IT Power for Abengoa March 2015 www.abengoa.com Prepared by
Transcript of Prepared by · allows them to generate in an agile manner similar to traditional peaking plants....

Pathways to Solar Thermal Electric cost reduction
Perspectives from the Abengoa Perenjori Study
Prepared by IT Power for Abengoa
March 2015
www.abengoa.com
Prepared by

Pathways to Solar Thermal Electric cost reduction
Abengoa has commissioned this study to facilitate discussion on the potential for Solar Thermal Electric technology in Australia.
Study undertaken and report prepared by IT Power (Australia) Pty Ltd, part of the IT Power group, a specialist engineering consultancy focussing on renewable energy, energy efficiency and climate change.
Authors: Keith Lovegrove, Josh Jordan, Joseph Wyder.
The views expressed in this report are views held by IT Power, formed on the basis of the conclusions reached in the course of its analysis. The report does not seek to present the views of Abengoa, or any employee or Director of Abengoa, nor that of the Australian Government.
For further information contact IT Power (Australia) Pty Ltd
Phone: 61-2 6257 3511 Email: [email protected] Web: www.itpau.com.au
© IT Power (Australia) Pty Ltd
www.abengoa.com
Graphics by 2B Advertising and Design www.2B.com.au

Prepared by
Contents
Executive Summary ......................................................................................2
1. Introduction .............................................................................................6
2. Solar Thermal Electricity Industry ..........................................................7
2.1 The potential for concentrating solar power in Australia – the 2012 study ..... 12
2.2 Developments since 2012 ............................................................................. 13
2.3 Recognising the extra values of STE ............................................................... 17
3 Calibrating Cost of Energy Predictions to the Perenjori Study .........23
3.1 First of a kind cost penalty ............................................................................ 23
3.2 Scaling for system size .................................................................................. 24
3.3 Regional effects ............................................................................................ 26
3.4 Modelling system output .............................................................................. 28
3.5 Calibration of cost parameters ...................................................................... 28
3.6 New baseline for Australian STE .................................................................... 29
4. Cost Reduction Potential ......................................................................32
4.1 Drivers for cost reduction ............................................................................. 32
4.2 Learning curve predictions ........................................................................... 33
5. Conclusions ............................................................................................35
Appendix A. Examination of Cost of Energy Sensitivity......................... 37
A.1 Effect of system size ...................................................................................... 37
A.2 Effect of storage ........................................................................................... 37
A.3 Effect of power block size ............................................................................. 39

2
Executive Summary
Abengoa Solar and its project partners have received ARENA funding to undertake a feasibility study for the Perenjori 20MW Solar Tower Project. The proposed plant would employ Abengoa’s molten salt tower technology with a thermal energy storage system. It would be located at Perenjori and integrated into the north-eastern fringe of WA’s South Western Interconnected System (SWIS).
Industry context
Solar Thermal Electric (STE) systems using solar concentrators are built in four general configurations - trough, tower, linear Fresnel and dish. Parabolic trough plants have the longest track record of operation in utility scale plants and constitute around 95% of all STE capacity installed today. Tower plants are currently emerging as the next favoured option, with higher efficiencies and greater dispatchability, and can now also be considered commercially mature.
The STE industry has been growing strongly in deployed capacity since 2006. At the beginning of 2015, more than 4.5GWe has been commissioned globally. Spain and USA have the most capacity. However, others such as South Africa, Morocco, the Middle East and India now have multiple plants installed. In addition, other countries such as Saudi Arabia and China have announced ambitious plans.
The potential for concentrating solar in Australia was previously the subject of a detailed study completed for the Australian Solar Institute, (ITP, 2012). This study found that Australia has all the ingredients necessary for a successful concentrating solar sector and that potential future capacity, under the right scenarios, could reach 2GWe by 2020. This study also concluded that a trough plant with no storage, built in a replicable manner at an ideal Australian site, would have a Levelised Cost of Energy (LCOE) of around $252/MWh.

Prepared by
Since the 2012 study was completed, the global STE industry has progressed strongly and seen a doubling of installed capacity. The period has also seen molten salt based thermal energy storage increase in maturity to become almost an industry standard. The future success of STE will clearly be built upon its ability to incorporate efficient and cost effective energy storage and to offer owners, off-takers and grid operators similar levels of dispatchability as a conventional power plant, which other intermittent renewable energy sources and technologies cannot match.
The extra values of STE
Whilst STE has been growing, photovoltaic (PV) solar energy has also enjoyed strong growth and has a global deployed capacity that is approximately 30 times greater. On simple cost of energy terms, STE costs about 50% more than PV, but only if any additional externalities needed for PV, such as grid management costs and ancillary service costs are excluded. PV generation becomes much more expensive when electricity storage systems are added, whereas inclusion of storage in a STE plant adds to levels of generation and both reduces the Levelised Cost of Energy and increases the value of energy produced.
STE plants with storage offer extra values beyond the baseline of variable renewable generators. The key concept is dispatchability, system operators are able to predict and control the generation levels from a STE plant with storage, within the constraints of its
configuration, in a way that cannot be done with variable renewables. STE plants can be built with large amounts of thermal storage to be effectively baseload in their nature or they can be built with bigger power blocks relative to solar field and the thermal storage allows them to generate in an agile manner similar to traditional peaking plants.
When all the benefits of a STE plant with storage are properly taken in to account, it is a cost effective renewable energy solution. The dispatchable characteristics and high equivalent firm capacity provides benefits which include:
• ability to move generation to times of high demand,
• provision of voltage and frequency support and other ancillary services,
• potential avoidance of network upgrades, and
• extra community benefits such as regional employment.

4
Studies by the Lawrence Berkeley National Laboratory and the National Renewable Energy Laboratory in the United States value the additional flexibility of STE plant at between USD19/MWh and USD35/MWh.
Historically, these benefits have not been directly recognised by renewable energy policy measures such as Feed-in Tariffs (FiTs) or Renewable Portfolio Standards, such as Australia’s Renewable Energy Target, which reward generators for energy produced irrespective of time of day or other factors. However, there are now some important developments:
• In Morocco, Masen recognizes the value of dispatchability and awards a premium of 117% for electricity generated from STE plants during the peak evening hours of 5pm to 10pm in winter and 7pm to midnight in summer.
• In South Africa, the Department of Energy also pays a premium of 270% of the Base Tariff for electricity generated from STE plants during the hours from 4:30pm to 11:30pm.
• In California, some STE power purchase agreements have applied time-based multipliers to a contracted base tariff. More recently, they have launched a program seeking to purchase energy storage capacity from renewables and only STE with storage, and pumped hydro can offer cost effective energy storage solutions.
Calibrating cost of energy to Perenjori
The ASI 2012 study concluded that a LCOE for an ‘ideal’ plant in Australia (N’th of a kind, at optimum solar conditions and without a remote location premium) would be $252/MWh.
The Perenjori study has found that a 20MWe molten salt tower plant with 7 hours storage could be built for $288m including construction finance and would generate 94 GWh per year. Such a plant is inherently more expensive than the industry potential because it is the first of its kind for Australia, it is in a remote location and because it is much smaller than the recognised optimal size of 100 to 200MWe.
The cost and performance of the tower plant from Abengoa’s Perenjori project analysis has been adjusted for system size, remote location and first of a kind cost penalties. This allows for a comparable LCOE calculation using the same assumptions used in the 2012 study. This calculation indicates that baseline STE cost for Australia has dropped from $252/MWh in 2012 to $177/MWh at the beginning of 2015, a substantial reduction.
Cost reduction potential
STE is a proven technology that is at an early stage of its cost reduction curve. Continued growth in installed capacity, together with further reductions in the cost of energy produced is confidently predicted by the industry. The practical sources of this cost reduction potential are technical improvements, other project improvements through learning, cost efficiencies as plants are built at larger size and manufacturing efficiencies as components are produced in higher volumes. These sources of cost reduction are interlinked.
Technical improvements require learnings from deployment in order to be effectively leveraged. Learnings cover not only local project management and site installation activities,

Prepared by
but also lead to significant reductions in financing costs, through a mix of reduced interest spreads, greater leverage, less onerous guarantees etc. Manufacturing efficiencies require an on-going pipeline of projects to be improved. Whilst, to a considerable extent, learnings can follow from global experience, each country that seeks to incorporate STE solutions will benefit most if it has a consistent pipeline of local projects established. As has been demonstrated in several counties already, providing a program that promises a pipeline of projects gives developers, contractors, suppliers, subcontractors, consultants and financiers confidence to invest in capacity building to fulfil the demand.
At the current early stage of the industry, it is not feasible to gather sufficient and reliable data to plot a historical cost reduction trend over time. However, the precedents of other technologies allow a prediction that costs are likely to reduce by between 10 and 20% with every doubling of installed capacity.
The substantial reduction in the baseline predicted STE cost of energy is an example of a real identifiable improvement based on a technology change. It is directly attributable to the choice of the tower plus molten salt configuration by Abengoa. This choice is consistent with a broad consensus within the STE industry. Salt towers deliver this major LCOE improvement in large part because they directly heat molten salt and are able to increase its temperature further and store nearly three times as much energy as troughs for the same investment in energy storage system.
Conclusions
Since 2012, a major strengthening in the commercial maturity of molten salt thermal energy storage has occurred, to the point that it is now virtually an industry standard. The tower plant has also established a strong performance track record that has reduced the potential project risk. Tower systems with salt based energy storage are the most cost effective, proven STE option currently available. STE systems are increasingly recognised for the extra benefits they provide via integrated thermal energy storage.
Cost reduction over time will follow from technical improvements, learning from deployment and operation, scaling to larger size and volume production of components. These are all interlinked and require a pipeline of projects to see maximum progress.
Construction of such a plant at 20MWe scale in Australia would have enormous benefit in providing the country with a tangible and locally visible solar energy system demonstrating the dispatchability characteristics that are essential for moving to a completely emissions free electricity sector. It would also signal to the world that a country with the best solar resources available was actively engaged with the technology and so strengthen the STE industry globally, in addition to the direct employment and capability development it would provide.

6
1. Introduction
Abengoa Solar and its project partners have received ARENA funding to undertake a feasibility study for the Perenjori 20MWe Solar Tower Project. The proposed plant would employ Abengoa’s molten salt tower technology with a thermal energy storage system. It would be located at Perenjori and integrated into the north-eastern fringe of WA’s South Western Interconnected System (SWIS).
Solar towers with heliostat fields are emerging as the increasingly favoured option for cost effective concentrator based Solar Thermal Electric (STE)1 systems. As part of the feasibility study, Abengoa Solar is investigating the technical and economic pathways to cost reductions for STE that would follow after the project.
Abengoa Solar have commissioned IT Power (ITP) to prepare this report to place the specific findings of the Perenjori study in context, such that the cost of STE plants in Australia of different size, location and future timing can be better predicted.
This report covers the following key areas:
• the evolution of the STE industry globally,
• using the results of the Perenjori feasibility study to establish a new baseline estimate for the levelised cost of energy for mature, full sized STE plants in Australia, and
• the potential for ongoing cost reduction in STE both globally and in Australia.
1 The technology is variously referred to as Concentrating Solar Power (CSP) or Concentrating Solar Thermal (CST). This document mainly uses the phrase Solar Thermal Electric (STE).
°°

Prepared by
2. Solar Thermal Electricity Industry
STE is available in four general configurations - trough, tower, linear Fresnel and dish, as illustrated in Figure 1. Of these, parabolic trough plants have the longest track record of operation in utility scale plants and are thus considered bankable. As a result, they constitute around 95% of all STE capacity installed to date.
Figure 1: STE Technologies - trough, tower, linear Fresnel and dish.
Despite their current dominance, troughs are not widely expected to maintain such a position indefinitely. Tower plants are currently emerging as the next favoured option and can now also be considered commercially mature. Linear Fresnel is also progressing, but at a slower rate and the dish approach is the least commercially mature of the four.
The global growth of STE capacity is shown in Figure 2. It can observed that the initial projects in the USA during the 1980s were followed by a hiatus. Spain led a resurgence from 2006 but has now slowed due to government policy changes that can be linked to the economic crisis and subsequent austerity measures it has experienced.
The USA is now experiencing a resurgence, and other key markets including South Africa, Latin America, India and the Middle East are similarly becoming significant, with China a likely new market in the future.

8
Figure 2: Evolution of accumulated CSP (STE) capacity2.
Whilst STE has been growing, photovoltaic (PV) solar energy has also enjoyed strong growth and has a global deployed capacity that is approximately 30 times greater. With costs of different technologies constantly changing and differing from country to country it is hard to make comparisons. However, a reasonable approximation in 2015 is that the simple levelised cost of energy (LCOE) for electricity generated from STE is around 50% more than that from flat plate PV. Although this does not take into account any externalities and ancillary costs which could be attributed to PV.
This is a reversal of the position a decade previously and at face value makes the progress of STE more challenging. However, PV generation becomes much more expensive when electricity storage systems are added, whereas inclusion of storage in a STE plant adds to levels of generation and both reduces the LCOE and increases the value of energy produced. This is the main driving factor behind STE’s continued growth.
The cost reduction success for PV follows predicted cost reduction with deployment models and can be directly linked to uptake following policy measures in key markets and large investments plus government support in manufacturing in China in particular. The success of PV is a strong precedent for ongoing cost reductions in STE also.
Solar thermal generation with storage offers extra values beyond the baseline of variable renewable generation. The key concept is dispatchability, system operators are able to predict and control the generation levels from a solar thermal plant, within the constraints of its configuration, in a way that cannot be done with variable renewables. STE plants can be built with large amounts of thermal storage to be effectively baseload in their nature or they can be built with bigger power blocks relative to solar field and the thermal storage allows them to generate in an agile manner more like traditional peaking plants.
2 http://www.nrel.gov/csp/solarpaces/

Prepared by
Variable generation will eventually reach a capacity limit in any system and a fully emissions free future will require plants with the dispatchability characteristics of STE with storage.
The energy storage solution that has emerged to dominate the STE industry is two tank molten salt, illustrated in Figure 3. A liquid salt is cycled between a “cold” tank at around 250°C and a “hot” tank at between 350 – 570°C (depending on the STE system). The hot salt is used to drive power generation in periods of no sun. There are a range of other energy storage approaches in the R&D phase, and two tank molten salt may be supplanted by more cost effective approaches in the future.
Figure 3: Two tank molten salt thermal energy storage at the Andasol 3 parabolic trough plant in Spain.
The advantage of using thermal storage with STE over electricity storage is that it is part of an integrated system that has improved output but with only a modest increase in installed cost and in many cases reduced cost of energy. In contrast, adding electricity in / electricity out storage to a variable generator always adds significant capital cost and reduces the output energy available.
Key observations in relation to thermal energy storage (TES) include:
• A STE plant without thermal storage typically has a solar field that is oversized for its power block, so at times of highest solar input it must take some heliostats off sun. Adding thermal storage allows that energy to be captured.
• A STE plant with storage can be built with a smaller power block running at higher capacity factor, so capital cost savings in the block and balance of plant help to offset the cost of the storage components, or can be built with the same sized power block and shift generation to hours of the day when it is most valuable.
10
• Over 50% of installed STE plants use two-tank molten salt thermal energy storage and that percentage is growing.
• Molten salt tower plants make more cost effective use of molten salt based thermal energy storage because they have higher efficiencies, a bigger temperature difference between cold and hot tanks, less heat losses and so generate and store more energy in the same unit.
• The Gemasolar 19MW tower plant with 15 hours of storage is shown in Figure 4. It has the highest capacity factor solar plant of any kind built to date and has three years of successful operation including extended periods of full generation 24 hours per day.
• The Solana 280MW trough plant in California with 6 hours of storage is the biggest solar plant to date with storage and has been operating successfully since 2013. During that time it has generated electricity at partial load for a continuous 24 hour period.
• The Crescent Dunes 110MW tower plant with 10 hours storage in Nevada is currently the biggest tower plant with storage. It was in the final stages of commissioning at the beginning of 2015.
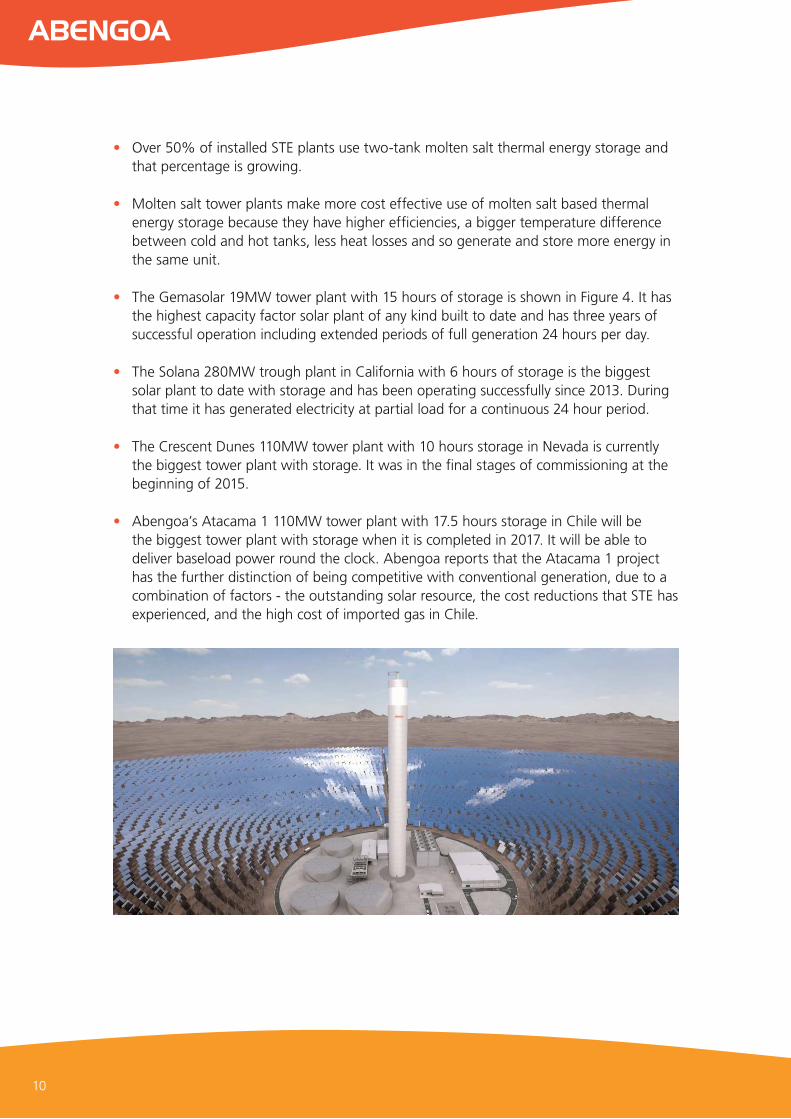
• Abengoa’s Atacama 1 110MW tower plant with 17.5 hours storage in Chile will be the biggest tower plant with storage when it is completed in 2017. It will be able to deliver baseload power round the clock. Abengoa reports that the Atacama 1 project has the further distinction of being competitive with conventional generation, due to a combination of factors - the outstanding solar resource, the cost reductions that STE has experienced, and the high cost of imported gas in Chile.

Prepared by
Figure 4: 19MW Gemasolar tower plant in Spain.
IT Power’s 2012 study3 of the potential for concentrating solar power in Australia, concluded that the technology has significant potential and outlined a recommended roadmap for development. In 2013, the Australian Energy Market Operator (AEMO) studied scenarios for 100% renewable electricity supply in Australia4 and concluded that large shares of STE with thermal storage were needed for a least cost stable electrical system, as shown in Figure 5.
3 Realising the potential of concentrating solar power in Australia, Prepared by ITP for the Australian Solar Institute, May 2012, www.australiansolarinstitute.com.au
4 100% Renewables Study - Modelling Outcomes, Australian Energy Market Operator, July 2013, www.aemo.com.au

12
Figure 5: AEMO’s scenario 1 100% renewable energy mix in 2030 (note STE is denoted here as CST, concentrated solar thermal)
2.1 The potential for concentrating solar power in Australia – the 2012 study
ITP has previously completed a detailed study, Realising the Potential for Concentrating Solar Power in Australia. This 2012 study reviewed the status of the global industry, activities and previous studies in Australia. It also analysed construction costs based on international experience transferred to Australian conditions. Construction costs, combined with O&M costs, and agreed financial parameters5 were used to analyse the Levelised Cost of Energy (LCOE) from hypothetical Australian STE plants.
A 64MWe trough plant without storage located in Longreach Queensland was chosen as a baseline and it was concluded that an N’th of a kind6 (NOAK) plant counting costs to the plant gate, could offer a real dollar LCOE (in 2012) of approximately $252/MWh. This baseline system was chosen at that time as representing the most technically conservative STE plant configuration located at close to the most favourable site within the East Coast National Electricity Market region. At the time maximum market value was assessed as $125/MWh, clearly a major gap between cost and potential income.
5 The financial parameters used were: loan fraction 60%, loan period 15 years, loan interest 7.78%, discount rate for equity 10.29%, depreciation period 20 years, project life 25 years, inflation 2.5%, O&M costs 1.8c/kWh, allowance for construction finance costs 6%.
6 “Nth of a kind” (NOAK) system indicates that a number of systems (e.g. N < 5- 10) have been built sufficient that construction teams and supply chains have developed experience and overcome initial inefficiencies.
Biomass (wood)
Bagasse
Pumpedhydro
Hydro
CST
Biogas
PV (rooftop)
PV (utility)
Wind (onshore)Geothermal
Wave
Prepared by
Extensive analysis then examined the key effects of:
• system size,
• location, and
• likely cost reductions over time.
A range of non-technical barriers were considered and policy recommendations were made. In the spirit of road mapping, it was suggested that it would be quite realistic for Australia to reach an installed STE capacity of 2GWe by 2020 and 100GWe by 2050, following on the expected completion of the 250MWe Solar Flagships project that was announced at the time. It was also concluded that based on likely rates of global STE deployment and likely range of cost reductions per doubling of capacity, that LCOE and income in Australia could converge in between 6 to 18 years.
2.2 Developments since 2012Since 2012, there have been a range of key developments both in Australia and internationally that represent both good and bad news for the STE industry. These include:
• Molten salt tower systems have significantly increased their maturity and lowered their technical risk level through the developments noted above. Overall a strong consensus has developed that the molten salt tower approach offers strong potential for deploying dispatchable STE with reduced costs.
• Australia did not proceed with its Solar Flagships STE project and the 44MWe Kogan Creek solar boost project remains in doubt for completion following AREVA’s announced exit from STE. The decline in electricity demand is lowering wholesale prices and providing a barrier to new generation capacity. There is a consequent pressure to reduce the Renewable Energy Target and certificate value is uncertain. Thus STE in Australia has still not left the starting blocks.
• Although Spain has stopped initiating new developments, other countries including US (Solana, Mojave, Crescent Dunes, Ivanpah and others), South Africa (KaXu, Khi, Xina, etc), Chile (Atacama 1 and 2), Morocco (Ouarzazate 1 and 2), Abu Dhabi (Shams), India (Godawari, Dhursar and Megha) and Kuwait (Shagaya and Al Abdaliyah) are proceeding strongly with STE deployment.
2.2.1 Revised cost models for Australia
Building on the 2012 study, ITP completed another relevant project in 2013 on adaptation of the well known NREL System Advisor Model (SAM) for modelling STE systems in Australia. This project produced a set of project files containing STE cases, with cost and financial parameters calibrated to Australian conditions such that the LCOE predictions are logically consistent with those of the 2012 study. The results are also described in the Australian Companion Guide to SAM for Concentrating Solar Power7.
7 Available from http://www.austela.org.au/projects

14
The ASI 2012 Report has the costing factors shown in Table 1. These cost factors were designed to be technology neutral. It is thus a different characterisation than normally applied to specific technologies and the solar field and receiver system components are expressed per kWth delivered to the power island rather than per m2 of field area.
Table 1: Estimated technology independent cost factors for a 100MWe capacity STE plant with storage and Rankine cycle power generation in Australia, (AUD 2012).
SubsystemPer unit cost Note / unit
Concentrator field (excluding receivers and Heat Transfer Fluid)
402 $/kWth capacity, delivered to power island at design point
Receiver/ transfer system (including receivers, HTF, piping, Tower as appropriate)
246 $/kWth capacity, delivered to power island at design point
Thermal Storage System 80 $/kWhth of installed thermal energy storage capacity, (to be scaled down for increase hot to cold temperature difference)
Power block 882 $/kWe output capacity
BOP and Other 529 $/kWe output capacity
Indirect project costs 25% Of subtotal of others (=20% of total)
To establish the cost parameters for the technology cost inputs for SAM these were reverse analysed back to cost factors matching the required input units.
The principle adopted was to make the real LCOE match the published 2012 value ($252/MWh) in the STE Australia study using the Longreach solar data file for any of the technologies for reasonably sized plants with no storage.
In establishing a logically consistent set of numbers, adjustments were needed based on common sense assumptions including that:
• Heliostat field costs quoted per m2 of mirror area should be the same for either molten salt towers or direct steam towers of equivalent size.
• Turbine costs and power block BOP should be the same for any of the modelled technologies at the same scale.
Completing this analysis indicated that a tower system with thermal energy storage offers a strong LCOE advantage over the baseline trough without storage. The overall LCOEs that result from the published project files for 100MWe plants, using the baseline RMY solar data file for Longreach are shown in Table 2.

Prepared by
Whilst the variation between many of the cases is within the uncertainty levels of the calculation, the 100MW molten salt tower with 10 hours storage, is clearly the lowest LCOE configuration . It should be noted that in these SAM cases, there is no systematic differentiation of cost parameters by size of system other than the tower itself, whereas in reality, system size has a major impact on turbine performance.
Table 2: LCOE results from the various SAM cases presented in the “Australian Companion Guide to SAM for Concentrating Solar Power”using the Longreach, Qld solar data.
SAM CaseConcentrator type
Real LCOE (AUD $/MWh)
Molten Salt Tower 100MW, 10 hours TES Tower 176
Direct Steam Power Tower 100MW Tower 230
Linear Fresnel 100 MW no storage LFR 232
Physical Trough 100MW 6 hrs TES Trough 237
Dish Stirling 100MW no storage Dish 242
2.2.2 IEA 2014 CSP (STE) roadmap
The International Energy Agency (IEA) published roadmaps for both CSP (STE) and PV in 2010. In September 2014, they released updated versions of these. The 2014 IEA CSP roadmap is a comprehensive review of progress in the industry. It finds that STE deployment has grown slower than predicted in 2010. However, it remains confident of a strong future and continued growth, with the previously foreshadowed deployment goals simply delayed by some years.
The confidence stems from STE’s strongly established advantage in proven energy storage. The delay in deployment is seen as a delay in establishing the increased sophistication in renewable energy policy measures that is needed around the world. This can be partly explained by the ongoing effects of the global financial crisis and corresponding austerity measures. Whilst there is growing recognition of the essential role of energy storage, most policy measures still focus on rewarding generated renewable energy irrespective of the time of generation, whilst ignoring supply and demand and the impact on networks etc. In such circumstances the lower LCOE of PV and wind will cause those variable renewable technologies to dominate the market.
The roadmap analyses the extent to which cost reductions have been achieved since 2010 and the forecasts of what will be achieved in the future. The overall conclusion is that cost reductions will continue but that the factors effecting the data are very complex and prevent an accurate global learning curve to be drawn yet.

16
Factors that influence this include:
• A large number of standard trough plants limited to 50MWe and with older design approaches locked in by FIT rules, have been built in Spain and this has constrained efforts to seek size related cost reductions.
• In other countries, much of the new capacity has been first of a kind for particular countries and companies, so has incurred higher costs because of that, irrespective of underlying global cost reductions.
• First of a kind projects in other countries have also tended to favour conservative low technical risk trough plants.
• Large tower projects that have come on line are also largely first of a kind with associated higher costs.
Published PPA information provides some indication of cost reduction progress. The IEA reports that Spanish plants benefited from FiTs of around USD 400/MWh, the PPA of the first phase of the Noor 1 plant at Ouarzazate in Morocco, is USD 190/MWh (MAD 1.62/kWh) for a 160 MW trough plant with three-hour storage, and a recent plant in the United States secured a PPA at USD 135/MWh, but taking investment tax credit into account, the actual remuneration is about USD 190/MWh. These are encouraging trends, however different countries have different costs of construction and DNI levels and there can be various escalation and duration assumptions in PPAs making them hard to compare.
Overall, the IEA concludes that capital cost learning should still proceed on the basis of a 10% reduction per doubling of installed capacity. This together with projections for deployment lead to their prediction of capital cost reduction over time shown in Figure 6.
Figure 6: Revised cost reduction trajectory from the IEA 2014 CSP roadmap.
Range Weighted average
10,000
8,000
6,000
4,000
2,000
0
USD/kW CSP 6-hour storage
2015 2020 2030 2040 2050
Prepared by
2.3 Recognising the extra values of STESolar energy based generation in general offers the prospect of non-polluting sustainable electricity. Solar thermal generation with storage offers extra values beyond the baseline of variable renewable generation. The key concept is dispatchability, system operators are able to predict and indeed control the generation levels from a solar thermal plant within the constraints of its configuration in a way that cannot be done with variable renewables. STE plants with large amounts of thermal storage are effectively baseload in their nature, on the other hand more agile plants with bigger power blocks relative to solar field and thermal storage can act more like traditional peaking plants.
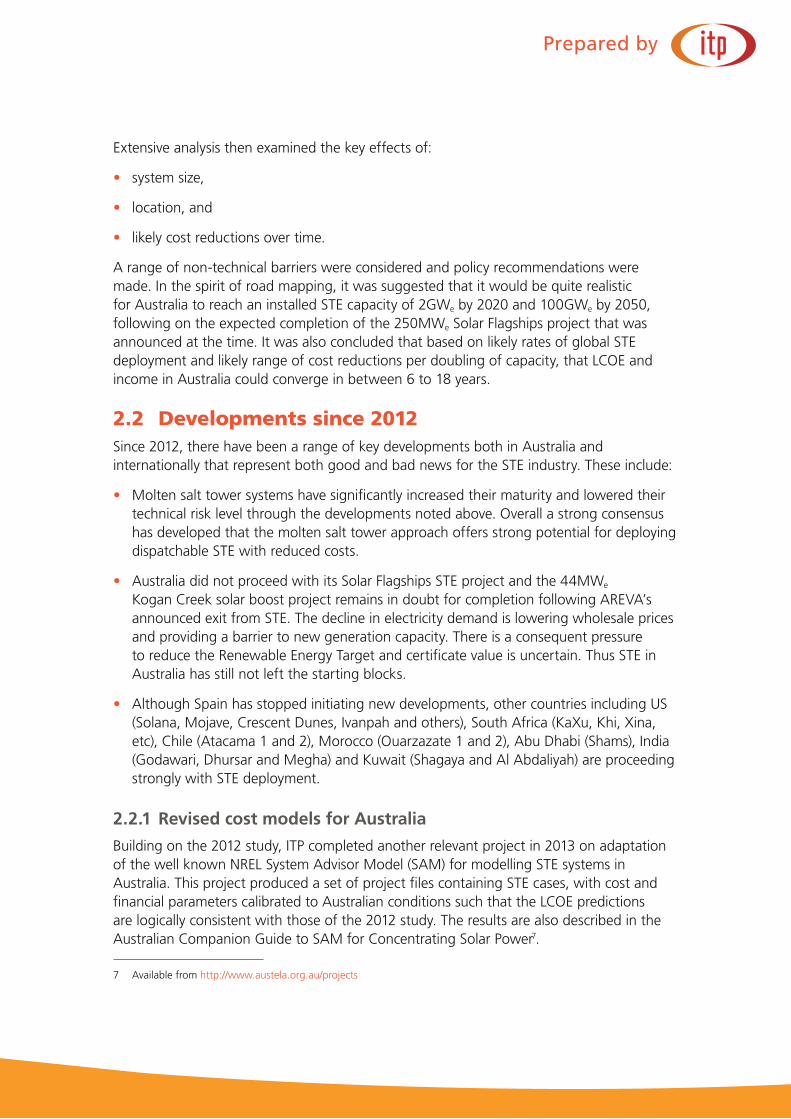
Some of the potential sources of value rely on the ability of a generation asset to provide ‘firm’ capacity. In simple terms this could be described as the extent to which a system can reproduce the availability of a conventional gas turbine plant. One way of doing this is modelling operation through a year and evaluating the capacity factor average over just the highest peak load events experienced. As part of the network benefits study carried out by a team lead by UTS8, this was done across the NEM, for a number of energy storage levels and times of the year. Key results are indicated in Figure 7. It can be seen that with just five hours of storage capacity, very high indicative firm capacity values are obtained in many areas. Similar results would no doubt be found for WA and NT.
Figure 7: Indicative firm capacity of CSP plants across the eastern states.
8 Breaking the solar gridlock. Potential benefits of installing concentrating solar thermal power at constrained locations in the NEM, 2013.

18
Studies of scenarios for 100% renewable electricity supply, typically find that due to these characteristics, significant fractions of STE capacity are an essential part of a mix capable of meeting demand at all times. Figure 8 from the AEMO study shows how STE with storage, hydro electricity and biomass are needed to fill in the gaps that result from variable renewables.
Figure 8: Sample forecast demand profile for 100% renewable electricity in the NEM from AEMO’s 2013 study
From the point of view of a project developer, STE plants offer a range of features in addition to providing emissions free electricity, that are rewarded either implicitly or explicitly in the market place. These include:
• moving energy sales to high demand periods,
• ancillary services ( spinning and non-spinning reserves, etc),
• whole electrical network avoided cost,
• community / society benefits, and
• option / hedging value.
Geothermal
Bagasse
PV (Utility)
Biogas
Biomass (wood)
Wind (onshore)
Concentrated solar thermal
Nominal demand
Wave
PV (rooftop)
Hydro (incl. pumped hydro)
Demand using flexibility
Mon 6 Jun Tue 7 Jun Wed 8 Jun Thu 9 Jun Fri 10 Jun Sat 11 Jun Sun 12 Jun
New load shape peak assuming flexible demand
Traditional load shape peak
Supp
ly a
nd d
eman
d (h
ourly
ave
rage
) (M
W)
60,000
50,000
40,000
30,000
20,000
10,000
0
Prepared by
2.3.1 Moving energy sales to high demand periods
The 2012 study examined the potential income that could hypothetically be derived in the NEM based on historic price data, if a STE plant with storage was configured for peaking generation. It was found that optimised dispatch could produce average sale prices up to double those of the average market price.
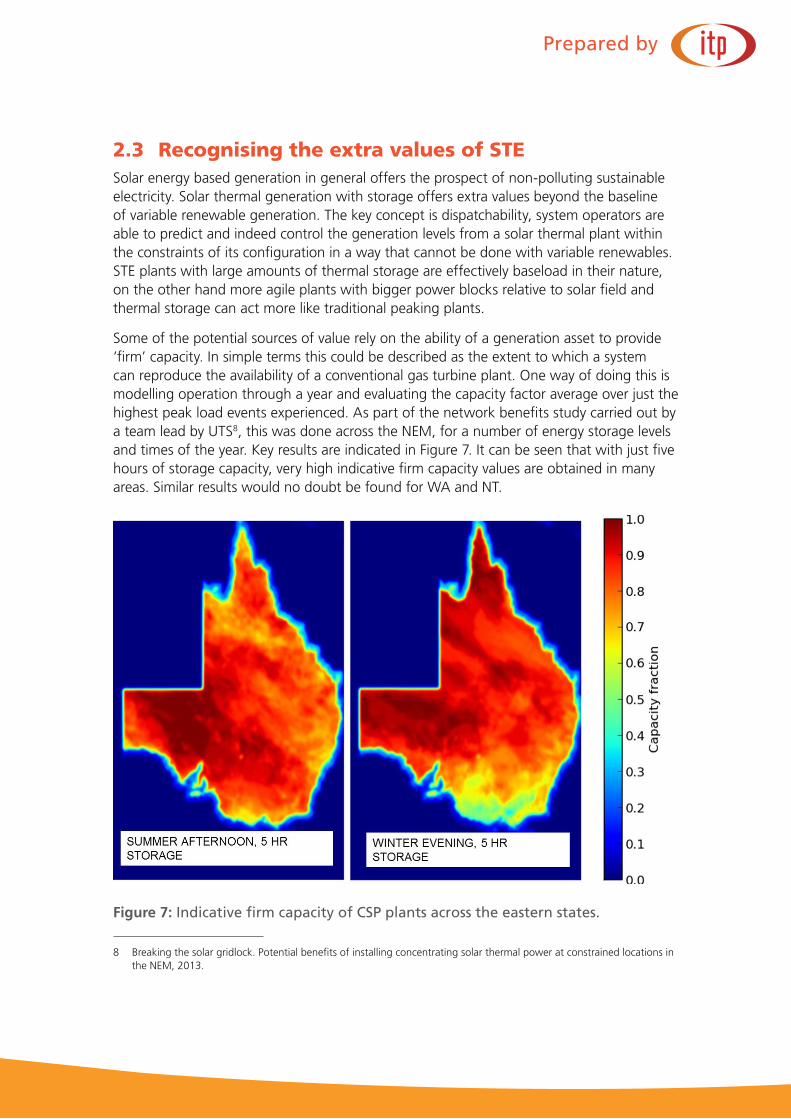
An approach to value generation via time shifting not widely discussed for STE plants is the idea that thermal storage could simultaneously be used for price arbitrage in a wholesale electricity market if molten salt tanks are fitted with suitable electric heaters. If these were used to add extra energy to the tanks at times of low energy prices due to high generation levels from wind for example, the result would be electricity storage and return for a round trip efficiency of around 30 to 40%, for very little extra capital cost. This is being promoted in California, where offtakers are looking for storage which they use to arbitrage their risk.
A study of price arbitrage income from electricity storage systems in a US wholesale market has shown that significant income can be generated from round trip efficiencies as low as 30%, as shown in Figure 9.
Figure 9: Net annual benefits from energy arbitrage via storage in a US network9.
2.3.2 Ancillary services
Ancillary services are those services, other than energy supply, that are needed to run an electrical network in a stable manner. They can be categorised in different ways and the specific methods of meeting them can also be described in different ways. Figure 10 illustrates some of the concepts.
9 Iannucci et al 2005, study of energy storage benefits in the PJM region in the central U.S. East Coast
Storage Discharge Duration ( Hours)
1 2 3 4 5 6 7 8 9 10
$/kW
-yr
80
0
20
40
60
90% Efficiency70% Efficiency50% Efficiency30% Efficiency

20
In the NEM, a range of ancillary services are already traded on a competitive basis in parallel with energy sales. The services are typically supplied by thermal (fossil) power stations characterised by synchronous generators, large amounts of angular momentum and the ability to ramp up and down as required.
STE plants also employ turbines and synchronous generators and, as has been seen internationally, with storage they offer high levels of firm capacity. In the NEM, as in many electrical networks, ancillary services currently command low prices, because they are in oversupply due to the current dominance of fossil fuelled generation. In future scenarios of high levels of intermittent renewable generation, the market price is expected to increase significantly and could be as much as 10% of the total value realised.
Figure 10: Classification of ancillary services needed and supplied, figure from Elsen et al 200410.
2.3.3 Whole electrical network avoided cost
High firm capacity values offer the possibility that an appropriately located STE plant could relieve the strain on network assets that are at the fringe of grid for example. This was the focus of the network benefits study carried out by the UTS team.
The UTS study found that in the East Coast NEM, STE could avoid the need for augmentation in 72% of constrained sites examined, while 25% of the constrained sites were assessed as being cost effective. In the most extreme cases, the network benefit was sufficient to justify 100% of the STE plant cost.
As part of Abengoa’s study for Perenjori, the UTS team have carried out a preliminary assessment of the potential network benefits that such a system would offer there. It is
10 Elsen R et al, 2004, Ancillary Services Unbundling Electricity Products – an Emerging Market, Paper prepared by Thermal Working Group, Union of the Electricity Industry EURELECTRIC
Restarting system
Maintaining stability
Maintaining frequency
Maintaining voltage
Maintaining frequency• frequency control• spinning reserve• remote automatic generation control• emergency control actions Maintaining voltage• voltage control Maintaining stability• frequency control• spinning reserve• emergency control actions Restarting system• black start capacity
RG
SPFC
EC
BS
VC

Prepared by
reported that Western Power have identified the Perenjori feeder in its top 20 feeders of concern across the SWIS network. The STE plant would require the installation of a substation to one of the 132kVA or 330kVA transmission lines that are in the vicinity. This would provide an opportunity to replace the current feeder and improve reliability at much reduced cost.
2.3.4 Community / society benefits
The high labour content and outright costs of construction for STE plants have obvious positive effects in terms of employment generation and economic stimulation. In 2011, a definitive study of this aspect was carried out by Deloitte for the Spanish industry association Protermosolar11. This study found that the economic benefit to the Spanish economy was well in excess of the net extra cost of the tariff support measures that were used to stimulate the industry. Of particular note was the observation that large fractions of the expenditure were provided by domestic activity rather than by importing technology, as illustrated in Figure 11.
Figure 11: Relative levels of domestic vs imported supply in Spanish STE plants.
In a similar vein, Abengoa reports that:
“In the US, with two projects (Mojave and Solana), the supply chains have created economic benefits and jobs across the US:
• More than 70% American goods and services,
• A national supply chain that includes 300 companies in 31 states and more are anticipated,
• Over 3,000 supply chain jobs created across America, and
• $USD1.8 billion total investment into the local economy of those 31 states.”
11 Deloitte, 2011, Macroeconomic impact of the Solar Thermal Electricity Industry in Spain, Study by Deloitte; Pza. Pablo Ruiz Picasso, 1, Torre Picasso, 28020 Madrid, España www.deloitte.es for PROTERMOSOLAR Camino de los descubrimientos, s/n 41092 Sevilla, España www.protermosolar.com ISBN: 978-84-8198-855-0.
solar field storage with salt
power island
Other (Engineering,
Contracting, etc)
total
ImportedDomestic
100%
0%
20%
40%
60%
80%
13.7
86.3
55.7 53.5 100.0 29.8
44.3 46.5
70.2

22
2.3.5 Option / hedging value
Option value can best be thought of as an insurance policy value. Countries that develop STE capability, even though this has significant lead time and begins with some early and more costly projects, gain the option of being able to more cost-effectively access the technology in later years when the need for ancillary services and system balancing, e.g. replacement of an existing conventional power station fleet, is likely to be higher. The value can be linked to the extra cost that would be encountered via the alternative of importing components and capabilities from other countries at a future time.
2.3.6 Overall value
Whilst all these sources of value can be discussed in general terms, value propositions must be optimised on a case-by-case basis. Values change with geographical area, market rules and the other generating assets in place.
Studies by the Lawrence Berkeley National Laboratory12 and the National Renewable Energy Laboratory13 in the United States value the additional flexibility of STE plant at between USD 19/MWh and 35/MWh.
Optimum system configurations and operational strategies must be adopted for best overall value which can be a trade-off. For example, providing spinning reserve is not perfectly compatible with maximising energy sales revenue.
Table 3 illustrates the approximate range that might be anticipated for the value of STE relative to the benchmark of PV or wind generation without storage. It indicates that the benefits could considerably outweigh the approximately 50% higher cost.
Table 3: Overall STE energy value relative to the value of intermittent renewable energy.
Source of increased Value
Estimate of relative value range increase over the value of an intermittent renewable energy supply
Time of Day benefit 5% to 100%
Ancillary services 0% to 10%
Network benefits -10% to 100%
Societal / option value 10% to 20%
Total extra value for CSP with storage 50% to 150%14
12 Mills A and Wiser R, Changes in the economic value of variable generation at high penetration levels: a pilot case study of California. LBNL-5445E, June 2012
13 Denholm P and Hummon K, Simulating the value of concentrating solar power with thermal energy storage in a production cost model, NREL/TP-6A20-56731, November 2012
14 Note that the estimated range of total extra value is not simply the sum of lowest and highest values from the categories as a system with very small extra value is never likely to be built on one hand, and all sources of value can not be expected to accrue together as a plant designed for maxim time shifting capability may not be able to deliver as realiable network support.

Prepared by
3 Calibrating Cost of Energy Predictions to the Perenjori Study
Abengoa’s Perenjori study has established the system parameters listed in Table 4.
Table 4: Design and performance parameters of the proposed Perenjori STE plant.
Parameter Value
Configuration Molten salt tower with surround field
Storage 7 hours
Nameplate capacity 20MWe
Turbine gross conversion efficiency 40.8%
Total heliostat area 231,000m2
Annual average DNI assumed 2,519kWh/m2
Annual generation based on average DNI 94GWhe
Capacity factor at Perenjori 53.7%
Capital cost including construction finance $288m
In order to use this rigorously obtained data point to make further observations on the overall costs of tower STE plants in Australia with other configurations and locations, several things are needed:
• Estimation of First of a kind cost penalty,
• Scaling cost and performance for system size,
• Understanding regional effects, and
• Modelling system output.
With these, general cost estimation parameters can be calibrated and a determination of a baseline LCOE and the effects of variations in plant configuration and location can be made.
3.1 First of a kind cost penaltyIn discussing the costs of a new energy technology from a policy and planning perspective, reference is often made to the concept of an Nth of a kind (NOAK) system. This is intended to indicate that some number of systems (e.g. N < 5 - 10) have been built such that construction teams and supply chains have developed experience and overcome initial inefficiencies. This level of costing marks the start of a further long term cost reduction trajectory that will fit a learning curve model as discussed later. In contrast to NOAK is

24
the cost of a first of a kind (FOAK) system. The Perenjori STE plant and its associated cost estimate, represents a FOAK system in respect to potentially being among other things:
• Australia’s first stand-alone utility scale STE plant of any kind.
• One of the first molten salt tower systems in the world.
• Abengoa’s first STE project in Australia.
In ITP’s 2012 study, it was concluded that the STE plant costing established at that time; “assumes the same level of industry maturity as is currently the case in the USA, a margin of a further 15 to 20% would likely apply for a first of a kind system in Australia“. In making that statement a conservative cost scale up was being foreshadowed. The Perenjori study is a thorough investigation of a particular FOAK system. In working back to an estimate of an equivalent NOAK cost, it is conservative to assume a cost reduction at the lower end of that range.
3.2 Scaling for system sizeThe size of a system significantly affects the capital cost per installed capacity. ITP’s 2012 study reviewed the literature on the subject and assembled a systematic basis for scaling capital costs with size that remains consistent with industry views15 and is used here.
There are three key effects:
1. For components / subsystems which are essentially single units of varying size per plant, larger units for larger plants will be more cost effective per MW of plant capacity.
2. The efficiency of turbines falls off in a non linear manner as size is reduced; this means that all subsystems on the thermal side of the power block must be increased in proportion to the conversion efficiency reduction.
3. Indirect costs. The indirect costs for a 20MW system are almost the same as for a 100MW system, e.g. development costs, mobilization, engineering, management, supervisions, etc.
For direct size effects on equipment costs empirical power law relationships are well established. Reference was made to Sargent and Lundy (2003) report that the specific cost per unit of installed capacity of both the Power Block and the Balance of Plant (BOP), have a power law scaling with size as follows:
BOP Cost/kWe ~ (System Size)^(-0.1896)
Power Block Cost/kWe ~ (System Size)^(-0.3145)
This power law scaling is applied to varied fractions of subsystem cost according to the extent they can be regarded as modular or fixed as shown in Table 5.
15 AT Kearney (2011), reports that companies surveyed estimated a 15% reduction in the cost per MW installed if the size of the plant were 100 MW instead of 50 MW.
Prepared by
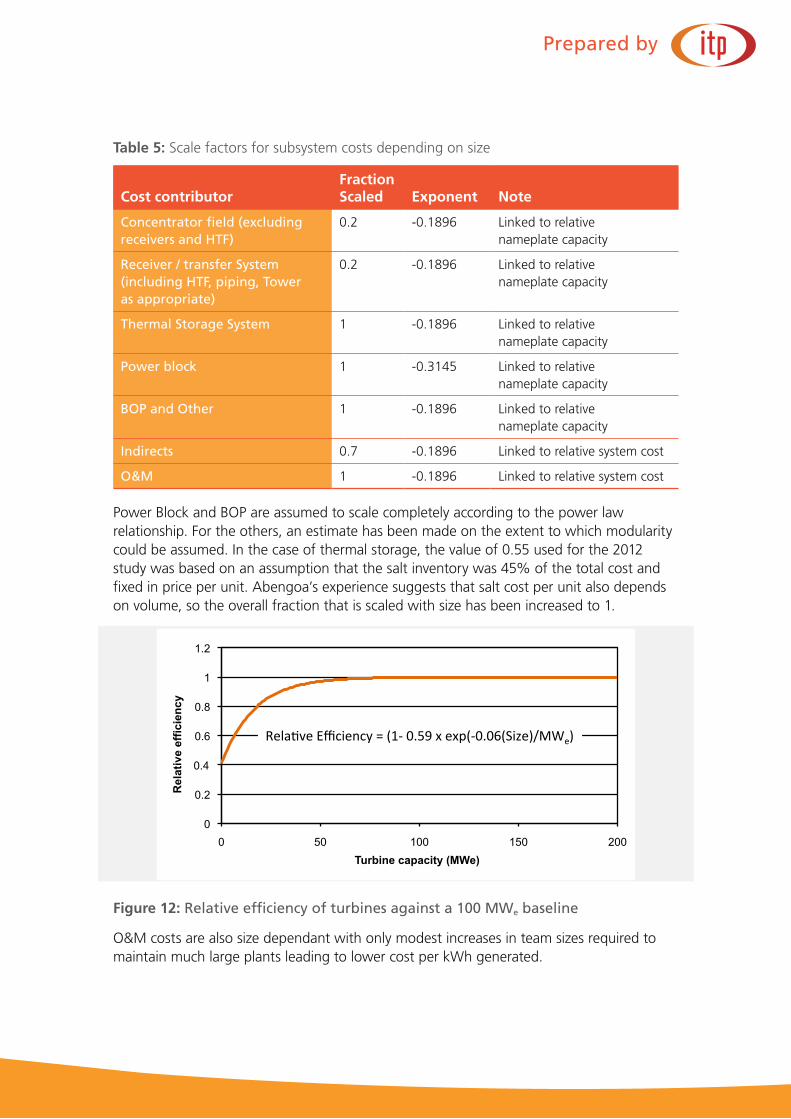
Table 5: Scale factors for subsystem costs depending on size
Cost contributorFraction Scaled Exponent Note
Concentrator field (excluding receivers and HTF)
0.2 -0.1896 Linked to relative nameplate capacity
Receiver / transfer System (including HTF, piping, Tower as appropriate)
0.2 -0.1896 Linked to relative nameplate capacity
Thermal Storage System 1 -0.1896 Linked to relative nameplate capacity
Power block 1 -0.3145 Linked to relative nameplate capacity
BOP and Other 1 -0.1896 Linked to relative nameplate capacity
Indirects 0.7 -0.1896 Linked to relative system cost
O&M 1 -0.1896 Linked to relative system cost
Power Block and BOP are assumed to scale completely according to the power law relationship. For the others, an estimate has been made on the extent to which modularity could be assumed. In the case of thermal storage, the value of 0.55 used for the 2012 study was based on an assumption that the salt inventory was 45% of the total cost and fixed in price per unit. Abengoa’s experience suggests that salt cost per unit also depends on volume, so the overall fraction that is scaled with size has been increased to 1.
Figure 12: Relative efficiency of turbines against a 100 MWe baseline
O&M costs are also size dependant with only modest increases in team sizes required to maintain much large plants leading to lower cost per kWh generated.
0
0.2
0.4
0.6
0.8
1
1.2
0 50 100 150 200
Rela
tive e
ffic
ien
cy
Turbine capacity (MWe)
Rela%veEfficiency=(1‐0.59xexp(‐0.06(Size)/MWe)

26
Estimates of turbine relative efficiency versus size were used to produce the curve fit in Figure 12. Relative efficiency is used such that any steam temperature or pressure effects can be considered separately.
The change in Power Block efficiency effectively changes the contribution of all the other contributors in inverse proportion to efficiency. Thus reducing system efficiency means that the solar field must be increased in size per unit of electrical output overall.
The overall result, graphed in Figure 13, shows close to, but slightly less size dependence than the predictions of others16.
Figure 13: STE capital cost dependency on size, relative to a 100MWe system with 10 hours of storage.
It is seen that the result is non-linear, with a major escalation in installed cost at small system sizes and a slow but continuing decline in costs above 50MWe. It can be seen that whilst moving to large (>100MWe) systems brings cost reduction, the penalty for working in the region of 20MWe is around 35%. In comparison, Abengoa report that increasing the capacity from 20 to 110MWe would result in a decrease in total EPC cost per MWe of 39 to 43% a result which is comparable but slightly stronger size dependence.
Whilst a cost per unit capacity penalty of more than 35% is significant, the reductions in project risk and level of grant or other support needed for a first project justify the choice of a small system as a first step.
3.3 Regional effectsAs well as the obvious variation of generation levels with DNI resources, it is expected that variation in capital cost will occur between regions in Australia. This arises because of variations in:
• cost of labour,
16 See for example Morse F, 2009, Concentrating Solar Power, presentation at the World Bank Energy Week, Washington DC, 2 April
0.0
0.5
1.0
1.5
2.0
2.5
3.0
0.1 5 10 20 30 40 50 60 70 80 90 100 120 140 160 180 200
Re
lati
ve
ca
pit
al c
os
t / k
We
Size (MWe)
Indirects
BOP & Other
Power Block
Storage
Receiver / transfer
Concentrators
higher
uncertainty

Prepared by
• transport costs,
• other costs of construction (eg plant hire costs, labour camp costs),
• ease of grid connection,
• availability of water.
The 2012 study referred to Rawlinsons for regional construction indices as shown in Table 6.
Table 6: Regional construction cost indices from Rawlinsons (2010).
CITY STATERegional Construction Price Index (Rawlinsons 2010)
Capital city Any 100
Broken Hill NSW 125
Bourke NSW 127.5
Inverell NSW 115
Mount Isa QLD 145
Longreach QLD 135
Charleville QLD 120
Toowoomba QLD 103
Pt Augusta SA 110
Roxby Downs SA 125
Alice Springs NT 110
Tennant Creek NT 150
Newman WA 165
Carnarvon WA 145
Kalgoorlie WA 135
The variation is significant and some of the highest values correspond to high solar resource locations. Overall there is a general trend to high cost of construction in locations further from major population centres. It could possibly be argued that there is some correlation also to high costs in locations with high demand for labour during the mining boom. Taken at face value, the indices are sufficiently high in some of the high solar sites that, if they were to be interpreted as direct multipliers on the installed capital cost of a STE system, they would outweigh the benefit of the extra solar resource.
However, there are good arguments to suggest that this would be an extreme view. An NREL analysis of trough system cost17 identifies the site labour cost component in each
17 Kutscher et al 2010.

28
part and suggests that it is less than 20% of the overall total. Nevertheless, it is logical that labour costs will generally increase (due to higher rates, allowances and transport) and labour productivity will decline (due to travel time, fly-in fly out regimes etc) in the more remote locations.
There is no direct entry for Perenjori, however its location suggests it should be similar to Carnarvon or Kalgoorlie. As such it is essentially on par with the baseline site of Longreach used in the 2012 study. Thus it is assumed here that Perenjori costs are a fair representation of STE plant costs for Australia in general.
Abengoa report that for the Perenjori case between 6 and 9% of the EPC cost is attributable to the remote location. Scaling up to 110 MW would result in an EPC cost per MW which is 39 to 43% lower than the 20MW plant.
3.4 Modelling system outputAbengoa has used its own proprietary modelling methods to arrive at a prediction of an annual average net level of electricity generation of 94GWhe for this system configuration. This determination has been made using a Typical Meteorological Year solar data file provided by 3Tier.
The previous studies by ITP have examined STE plant output using the NREL System Advisor Model. This is well known internationally and freely available18 and so has the advantage that any conclusions drawn using it can be verified and extended by others.
An existing physical model for a molten salt tower plant is included in its capabilities. This is not precisely matched to Abengoa’s design. However, calibrating it to the basic configuration for Perenjori and scaling its output to match Abengoa’s prediction, provides a good baseline position to examine the effects of other locations and configurations.
3.5 Calibration of cost parametersUsing the specified capital cost and performance of the Perenjori STE plant to calibrate the various subsystems as used in the 2012 study, gives the results shown in Table 7 expressed as specific cost per kWe of plant capacity.
To present these numbers in a manner that can be better applied to hypothetical systems with different relative solar field and storage sizes, these results can be converted to express the solar field contributions per a kWth of input to the power block, and the storage system, per kWhth of storage capacity as given in Table 8.
18 NREL’s System Advisor Model, is available from: https://www.nrel.gov/analysis/sam/

Prepared by
Table 7: Calibration of STE plant cost parameters based on Perenjori system cost estimate.
Parameter
Perenjori assumed cost parameters
Perenjori costs reduced by factor 0.85 for NOAK
Perenjori NOAK scaled to 100MWe 10 hour storage Unit
Solar field (excluding receivers and HTF)
3,320 2,802 2,380 $/kWe
Receiver / Transfer System (including HTF, piping, Tower as appropriate)
2,415 2,038 1,731 $/kWe
Thermal Storage System 2,070 1,747 1,516 $/kWe
Power block 2,890 2,439 1,470 $/kWe
BOP and Other 905 764 563 $/kWe
Indirects 2,200 1,857 1,202 $/kWe
TOTAL “overnight cost” 13,800 11,649 8,863 $/kWe
Total after allowance for construction finance
14,400 12,155 9,248 $/kWe
Table 8: Calibration of STE plant cost parameters based on Perenjori system cost estimate expressed per unit of thermal capacity as relevant.
Parameter
Perenjori assumed cost parameters
Perenjori costs reduced by factor 0.85 for NOAK
Perenjori NOAK scaled to 100MWe 10 hour storage Unit
Solar field (excluding receivers and HTF)
475 401 374 $/kWth
Receiver / Transfer System (including HTF, piping, Tower as appropriate)
345 292 272 $/kWth
Thermal Storage System 105 89 65 $/kWth
Power block 2,890 2,439 1,470 $/kWe
BOP and Other 905 764 563 $/kWe
Indirects 19% 19% 16%
30
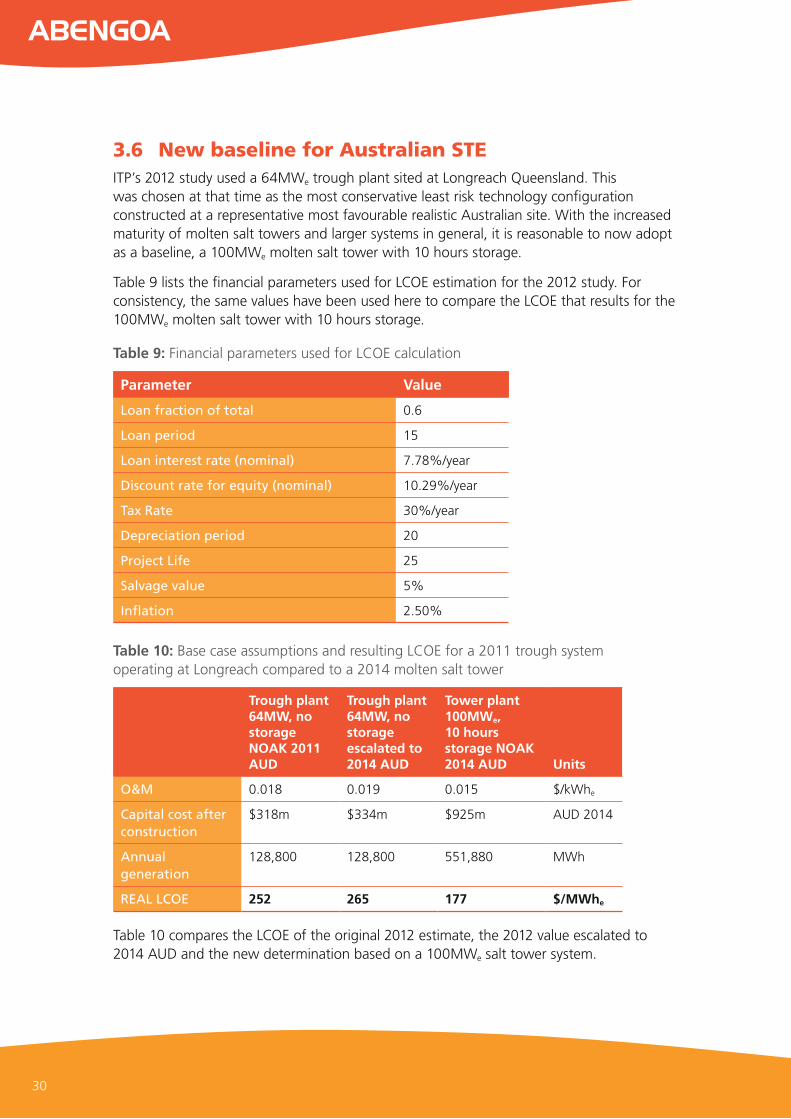
3.6 New baseline for Australian STE ITP’s 2012 study used a 64MWe trough plant sited at Longreach Queensland. This was chosen at that time as the most conservative least risk technology configuration constructed at a representative most favourable realistic Australian site. With the increased maturity of molten salt towers and larger systems in general, it is reasonable to now adopt as a baseline, a 100MWe molten salt tower with 10 hours storage.
Table 9 lists the financial parameters used for LCOE estimation for the 2012 study. For consistency, the same values have been used here to compare the LCOE that results for the 100MWe molten salt tower with 10 hours storage.
Table 9: Financial parameters used for LCOE calculation
Parameter Value
Loan fraction of total 0.6
Loan period 15
Loan interest rate (nominal) 7.78%/year
Discount rate for equity (nominal) 10.29%/year
Tax Rate 30%/year
Depreciation period 20
Project Life 25
Salvage value 5%
Inflation 2.50%
Table 10: Base case assumptions and resulting LCOE for a 2011 trough system operating at Longreach compared to a 2014 molten salt tower
Trough plant 64MW, no storage NOAK 2011 AUD
Trough plant 64MW, no storage escalated to 2014 AUD
Tower plant 100MWe, 10 hours storage NOAK 2014 AUD Units
O&M 0.018 0.019 0.015 $/kWhe
Capital cost after construction
$318m $334m $925m AUD 2014
Annual generation
128,800 128,800 551,880 MWh
REAL LCOE 252 265 177 $/MWhe
Table 10 compares the LCOE of the original 2012 estimate, the 2012 value escalated to 2014 AUD and the new determination based on a 100MWe salt tower system.

Prepared by
This LCOE baseline represents the current STE best practice technology built at a representative most favourable Australian site. The reduction in what can be considered a realistic baseline STE LCOE is substantial over an interval of three years. This number is also very close to that predicted predicted in the 2013 adaptation of SAM cases discussed in section 2.2.1.
From this baseline position, the effects of relative variations of LCOE are illustrated in Figure 14.
Figure 14: Variation of cost against an LCOE baseline of a 100MWe molten salt tower with 10 hours storage at Longreach.
The effects of sensitivity to a range of plant characteristics are examined in further detail in Appendix A.
•
•
•
•
•
•
0.100
0.120
0.140
0.160
0.180
0.200
0.220
0.240
50% 60% 70% 80% 90% 100% 110% 120% 130% 140% 150%
LC
OE
(A
UD
/kW
h)
Multiple of baseline
Capital cost / capacity
Annual generation
Operations & Maintenance
Cost of Capital

32
4. Cost Reduction Potential
4.1 Drivers for cost reduction STE is considered to be an essentially proven technology that is at an early stage of its cost reduction curve. A period of growth in installed capacity, together with decline in cost of energy produced is confidently predicted by the industry.
The trend to a learning curve of capital cost reduction as installed capacity increases, is logically linked to:
• technical improvements, building on knowledge (both local and global) gained from installed plants and parallel R&D efforts identify performance improvements (eg increase in efficiency, temperature etc),
• learning improvements from deployment and operation, such as reduced construction periods, lower O&M costs, etc,
• scaling to larger installed plant size, that allows for more efficient and more cost effective large turbines and other components to be used, and for fixed construction/management costs and overhead to be spread over larger project, and
• volume production that allows fixed costs of investments in production efficiency to be spread over larger production runs.
These sources of cost reduction are interlinked. Technical improvements for example require learnings from deployment in order to be effectively leveraged. Manufacturing efficiencies, which are both at the small component level and in the actual on-site installation, require an on going pipeline of projects to be developed effectively. Whilst, to a considerable extent, learnings can follow from global experience, each country that seeks to incorporate STE solutions will benefit most if it has a consistent pipeline of local projects established. This is particularly important to establish a mature and efficient supply chain for those aspects that must be local rather than imported. This includes the most obvious area of building skills and experience in a workforce to do the actual installations.
In addition to the direct capital cost effects, the financial terms applied to capital improve as the technology becomes better known and proven. Operations and maintenance costs also benefit in similar ways.
The substantial reduction in the baseline predicted STE cost of energy is an example of a real identifiable improvement based on a technology change. It is directly attributable to the choice of the tower plus molten salt configuration by Abengoa. This choice is consistent with a broad consensus within the STE industry. Salt towers deliver this major LCOE improvement in large part because they directly heat molten salt and are able to increase its temperature further and store nearly three times as much energy as storage trough plant for the same investment. This switch from troughs without storage to towers with storage can be considered as real, because sufficient tower plants have now been built to allow cost and performance analysis to be treated with greater certainty.

Prepared by
4.2 Learning curve predictions It is common practice to examine the track record of a technology using the idea of a “Progress Ratio”. This is the multiple by which the cost changes each time the total installed capacity is doubled. In other words, a progress ratio of 85% for example, would mean that cost decreases by 15% every time the installed capacity is doubled.
ITP’s 2012 study reviewed past analysis of cost reduction predictions both for STE and analogous energy technologies in general and concluded that STE progress ratio’s should fall between 90% and 80%. As noted previously, the IEA’s 2014 roadmap is projecting a progress ratio of 90%.
From a policy perspective, a forecast of how these cost reductions are likely to track with time is useful. Compound growth is likely to occur at a rate that will be at least 20% per year and most likely higher.
Figure 15 plots the progression over time of relative cost of energy19 under either 20% pa or 30% pa growth rates with the same range of possible progress ratios from an end of 2014 starting point.
Figure 15: Relative energy cost reductions over time under different growth rates and progress ratios.
19 Note that LCOE is strongly dependant on capital cost, but also depends on O&M costs and financing costs,. To a first approximation LCOE and capital cost are assumed to reduce over time according to the same progress ratio.
0.0
0.2
0.4
0.6
0.8
1.0
2015 2020 2025 2030 2035 2040
Re
lati
ve
LC
OE
Year
20%/a + PR=0.8
20%/a + PR=0.85
20%/a +PR=0.9
30%/a + PR=0.8
30%/a + PR=0.85
30%/a + PR=0.9

34
Figure 16: Abengoa’s experience with tower plant capital cost reductions over time
This empirical model is comparable to Abengoa’s direct experience of cost reductions achieved on its various tower projects as shown in Figure 16.
On this basis, a minimum further cost reduction of 15% by 2020 would be expected, with a reduction of as much as 40% feasible. No attempt has been made here to attribute differing progress ratios to different subsystem components or to O&M. To the accuracy of this analysis, the time and deployment evolution of relative LCOE will be exactly the same as relative capital cost.
From this analysis, the follow on question is - at what point does cost and value converge in the Australian market place? Figure 17 shows the predictions of possible cost of energy and revenue versus time from the 2012 study, with the new baseline STE cost of energy point superimposed. It is seen that the cost reduction implied is close to the maximum level predicted in 2012. This is a step change cost reduction resulting from a technical improvement. It can not be expected that the same improvement rate would be demonstrated on a continuous basis. Rather the range of possible cost reduction trajectories can now be re started from an end of 2014 data point.
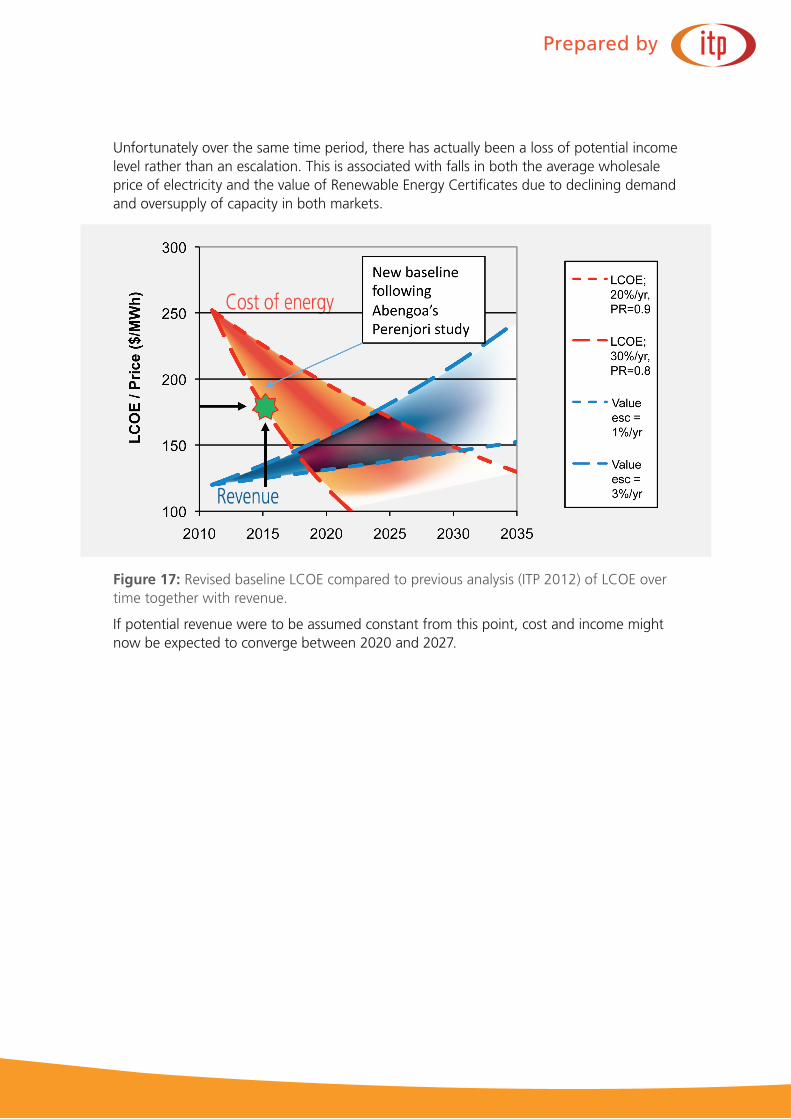
Prepared by
Unfortunately over the same time period, there has actually been a loss of potential income level rather than an escalation. This is associated with falls in both the average wholesale price of electricity and the value of Renewable Energy Certificates due to declining demand and oversupply of capacity in both markets.
Figure 17: Revised baseline LCOE compared to previous analysis (ITP 2012) of LCOE over time together with revenue.
If potential revenue were to be assumed constant from this point, cost and income might now be expected to converge between 2020 and 2027.

36
5. ConclusionsAbengoa’s study of a 20MWe salt tower STE plant for Perenjori, in Western Australia, represents the first publicly funded detailed study by an experienced STE developer of a proposal for Australia. As such it becomes the most important cost data point by which STE technology can be judged in the country.
In interpreting the bottom line cost from the study, it is essential that the impacts of the chosen system size and its First of a Kind nature are taken into account. The size of 20MWe
is lower than what is considered commercially practical for the technology. It is well known that significant cost efficiencies are available for systems sizes up to 100MW or larger. However, 20MWe is a sensible choice for a first project as it can deliver the maximum amount of learning from a system with lower capital expenditure and hence project risk and other support required.
The Perenjori study has found that a First of a Kind 20MWe tower plant with seven hours storage could be built for $288m including construction finance and would generate 94GWhe per year. Such a plant is inherently more expensive than the industry potential because it is the first of its kind for Australia and because it is much smaller than the recognised close to optimal size of 100MWe.
The analysis presented here has used established information on size and first of a kind effects to calibrate the cost estimates of an Nth of a kind 100MWe system of a similar configuration. When this is used to calculate a Levelised Cost of Energy, using the same assumptions as previous analysis carried out for the Australian Solar Institute in 2012, it is found that baseline Nth of a Kind STE LCOE for Australia has dropped from $252/MWh in 2012 to $177/MWh at the beginning of 2015, a substantial reduction.
This reduction is directly attributable to the choice of the tower plus molten salt configuration by Abengoa. This choice is consistent with a broad consensus within the STE industry. Salt towers deliver this major LCOE improvement in large part because they directly heat molten salt and are able to increase its temperature further and store nearly three times as much energy for the same investment in energy storage system. The years since 2012 have seen major strengthening in the commercial maturity of molten salt energy storage, to the point that it is now virtually an industry standard. The tower configuration, has also established a strong performance track record that has reduced the potential project risk.
The LCOE reduction that is suggested by this analysis is an example of cost reduction from technical advancement. As such it is a step change in cost reduction and has resulted in a cost reduction in excess of that which was projected in 2012. In parallel the cost reductions associated with manufacturing efficiencies in the industry are small but apparent.
Construction of such a plant in Australia would have enormous benefit in providing the country with a tangible and locally visible solar energy system demonstrating the dispatchability characteristics that are essentially for moving to a completely emissions free electricity sector.

Appendix A. Examination of Cost of Energy Sensitivity
A.1 Effect of system sizeThe size dependence of LCOE follows the size dependence of installed cost very closely, as shown in Figure 18.
Figure 18: Estimated LCOE dependence on plant size for a molten salt tower plant with system with 10 hours storage.
The model that was adopted for this analysis, projects LCOE continuing to drop for larger systems. There is a general consensus however that 250MWe represents a point of minimum LCOE. Beyond that size, LCOE begins to increase again, because the thermal losses from a large HTF network (or the optical losses from a larger heliostat field), result in decreasing system output.
A.2 Effect of storageFor a given plant generating capacity and nominated level of energy storage, the size of the solar field can be varied to find the minimum LCOE. If this is done for a range of levels of energy storage, the combined effect of storage level on LCOE can be examined. Carrying out this analysis for a 100MWe salt tower in Longreach produces the results shown Figure 19. The LCOE numbers have been normalised to 1 for the case of 10 hours storage. By presenting the results as relative LCOE in this way, they become largely independent of site, technology and financial parameters assumed.
0.0
0.5
1.0
1.5
2.0
2.5
3.0
0.1 5 10 20 30 40 50 60 70 80 90 100 120 140 160 180 200
Re
lati
ve
LC
OE
Size (MWe)
Indirects
O&M
BOP & Other
Power Block
Storage
Receiver sys
Concentrators
higher
uncertainty

Figure 19: Impact of storage on LCOE for a 100MWe molten salt tower plant with various levels of storage and solar field size adjusted to optimum.
The results suggest a minimum at around 15 hours of storage is optimum, however it is quite insensitive. Analysis for trough plants in the 2012 study showed that a minimum of around two hours of storage was optimum. The difference is directly linked to the much greater cost effectiveness of storage for towers that results from the higher temperature difference between hot and cold tanks
It needs to be recognised that adding this level of storage results in a much higher capital cost for a given capacity and also results in a plant which is effectively baseload. Plants with less storage may offer higher economic performance if their output is dispatched at times of higher value.
The effect of storage is twofold. It increases the overall annual generation by reducing the energy dumping that would occur from a field with a solar multiple greater than one. It also gives the ability to capture transient events too short to start up a power block. This extra generation has the effect of lowering the LCOE contribution from all categories, even though their actual capital cost has not changed. That is, the same cost is shared across greater generation. Offsetting this, an LCOE contribution appears and grows in proportion to the number of hours of storage.
In addition, adding storage and boosting the field size, increases the capacity factor and means that the investment in power block and balance of plant is amortised over much higher levels of generation.
IndirectsBOP & OtherPower BlockStorageReceiverConcentratorO&M
0 2 7 10 15 20
Hours of storage
Rela
tive
LCO
E
1.4
0
0.2
0.8
1.0
0.4
0.6
1.2
As more storage is added beyond the optimum, the annual generation stops growing and begins to decline slightly due to increased standing losses and the LCOE increases with the capital cost increase.
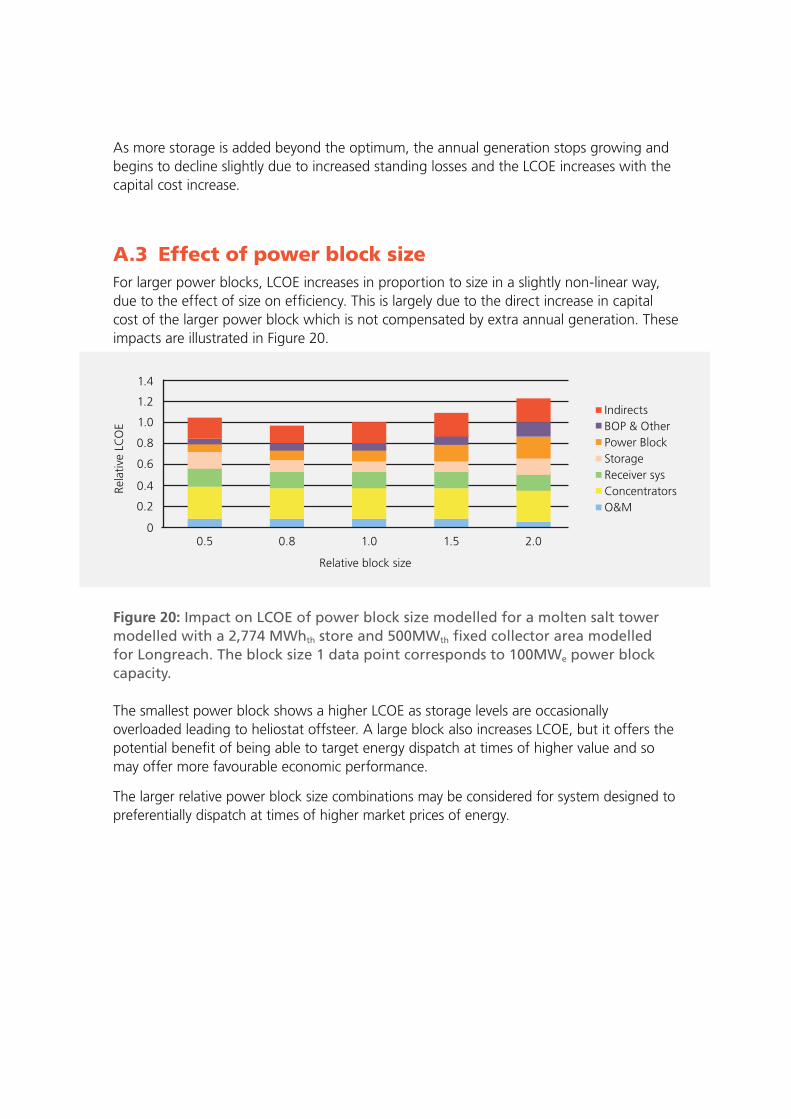
A.3 Effect of power block sizeFor larger power blocks, LCOE increases in proportion to size in a slightly non-linear way, due to the effect of size on efficiency. This is largely due to the direct increase in capital cost of the larger power block which is not compensated by extra annual generation. These impacts are illustrated in Figure 20.
Figure 20: Impact on LCOE of power block size modelled for a molten salt tower modelled with a 2,774 MWhth store and 500MWth fixed collector area modelled for Longreach. The block size 1 data point corresponds to 100MWe power block capacity.
The smallest power block shows a higher LCOE as storage levels are occasionally overloaded leading to heliostat offsteer. A large block also increases LCOE, but it offers the potential benefit of being able to target energy dispatch at times of higher value and so may offer more favourable economic performance.
The larger relative power block size combinations may be considered for system designed to preferentially dispatch at times of higher market prices of energy.
IndirectsBOP & OtherPower BlockStorageReceiver sysConcentratorsO&M
0.5 0.8 1.0 1.5 2.0
Relative block size
Rela
tive
LCO
E
1.4
0
0.2
0.8
1.0
0.4
0.6
1.2

40

Prepared by
List of abbreviations
AEMO Australian Energy Market Operator
AUD Australian Dollar
ARENA Australian Renewable Energy Agency
BOP Balance of Plant
CSP Concentrating Solar Power
DNI Direct Normal Irradiance
FiT Feed-in Tariff
FOAK First of a Kind
HTF Heat Transfer Fluid
IEA International Energy Agency
ITP IT Power (Australia) Pty Ltd
kW Kilowatt, unit of power
kWh Kilowatt-hour, unit of energy (1 kW generated/used for 1 hour)
LCOE Levelised Cost of Energy
NEM National Electricity Market (in Eastern Australia)
NOAK Nth of a Kind
NREL National Renewable Energy Laboratory (NREL)
PPA Power Purchase Agreement
PV Photovoltaic
RMY Representative Meteorological Year
STE Solar Thermal Electric
SAM System Advisor Model
SWIS South West Interconnected System (in Western Australia)
TES Thermal Energy Storage
USD United States Dollar
All references to $ in this report are Australian dollars unless otherwise specified.

Southern Cross House, 6/9 McKay St, Turner, ACTPO Box 6127 O’Connor, ACT [email protected] itpau.com.au
abn 42 107 351 673p +61 (0) 2 6257 3511f +61 (0) 2 6257 3611


![1. Kyrie eleison [Messe brève en Dom]...15 lei son 19 Pno. 23 son son - son son Pno. ste C}ri Chri Ste ste ste Ste ste ste Chri ste ste ste ste Chri Chri Chn Chn Chri Chri - son son](https://static.fdocuments.in/doc/165x107/5e609353fb97110321740385/1-kyrie-eleison-messe-brve-en-dom-15-lei-son-19-pno-23-son-son-son-son.jpg)