PREPARATORY SURVEY FOR NATIONAL ROAD NO. 5 REHABILITATION...
95
PREPARATORY SURVEY FOR NATIONAL ROAD NO. 5 REHABILITATION PROJECT IN THE KINGDOM OF CAMBODIA FINAL REPORT OCTOBER 2012 JAPAN INTERNATIONAL COOPERATION AGENCY KATAHIRA & ENGINEERS INTERNATIONAL EI JR (先) 12-200
Transcript of PREPARATORY SURVEY FOR NATIONAL ROAD NO. 5 REHABILITATION...

PREPARATORY SURVEY FOR
NATIONAL ROAD NO. 5
REHABILITATION PROJECT
IN THE KINGDOM OF CAMBODIA
FINAL REPORT
OCTOBER 2012
JAPAN INTERNATIONAL COOPERATION AGENCY
KATAHIRA & ENGINEERS INTERNATIONAL
EI
JR (先)
12-200

Exchange Rate US$ 1.00 = JPY 78.31 KHR = JPY 0.019 (As of Aug. 2011)

* The name of the city of ‘Sisophon’ was officially changed to ‘Serei Saophoan’ after this
Survey had started, and finally to ‘Sri Soporn’ during the loan processing. In preparing the
Final Report, the Survey Team corrected from ‘Sisophon’ to ‘Sri Sophorn’ as much as possible.
However, there may still remain the word ‘Sisophon’ and ‘Serei Saophoan’. The readers are
kindly requested to interpret that ‘Sisphon’, ‘Serei Saophoan’ and ‘Sri Sophorn’ refer the same
city.

i
SUMMARY
1. Outline of the Project
The Project consists of three components:
(i) Widening Battambang – Sri Sophorn
Section (47.0km) of National Road No.
5 (NR 5) into 4 lanes
(ii) Construction of Battambang Bypass
(23.1km) and Sri Sophorn Bypass
(13.4km) as 2-lane roads.
2. Objective of the Preparatory Survey
Objectives of the Preparatory Survey are
twofold:
(i) Evaluate the current conditions of the
North, South and Middle Section (see
the Location Map) and evaluate the
priorities for improvement.
(ii) Prepare the data and information
required for appraisal of loan project.
3. Importance of National Road No. 5
NR 5 plays important role in Cambodia and
ASEAN:
- NR 5, together with NR 1, constitutes
a part of ASEAN Highway No. 1
connecting Bangkok – Phnom Penh –
Ho Chi Minh City.
- This corridor is called ‘Southern
Economic Corridor of GMS (Greater
Mekong Sub-region).
- Improvement of NR 5 is expected to
contribute to development of
cooperation in GMS as well as
development of socio-economic
activities in Cambodia.
Figure 1 Project Road
Figure 2 Location Map
Figure 3 GMS Economic Corridor

ii
4. Existing Conditions of NR 5 and Its Problems
The existing NR 5 is 2-lane road which
imposes hazardous traffic condition.
Pavement is DBST which is vulnerable to
heavy traffic and cannot support growing
economic activities.
Fragile pavement is also imposing the
Government of Cambodia heavy financial
burden of maintenance.
Inundation frequently occurs and hampers
smooth and stable transport.
Figure 5 Hazardous Traffic Condition
5. Future Traffic Demand
Future traffic demand on NR 5 was
forecasted based on the results of surveys
on current traffic characteristics and future
economic growth.
Vehicle registration is estimated to reach
around 6.5 million in Year 2030 owing to
rapid economic growth of Cambodia.
Traffic volume on the North, Middle and
South Sections are estimated as shown in
Table 1.
Traffic volume in Year 2030 exceeds traffic
capacity on the North Section and
approaches to the capacity on the South
Section.
Figure 4 Typical Cross Section of North
Section
Figure 6 Damaged Pavement
Table 1 Estimated Traffic Volume
(Unit: pcu)
Section Year
2011 2016 2021 2030
North 8,453 12,356 17,812 25,540
Middle 6,071 8,232 11,368 15,899
South 8,644 11,519 15,735 21,164

iii
6. Priority of North, Middle and South Sections for Improvement
Road widths of North Section and South Section are similar with each other while the road width
of Middle Section is slightly wider than those of North and South Sections.
Urgent repair of the South Section is on-going under financial assistance of ADB (RAMP).
Considering mainly the urgent repair of RAMP, the priority of the North Section is evaluated to
be higher than that of the South Section, although the both sections needs to be urgently
improved. 7. Priority of Bypass
Battambang Bypass and Sri Sophorn Bypass are evaluated to have higher priority than Kampong
Chhnang Bypass since from viewpoint of continuity of traffic flow and the project
implementation/ supervision. 8. Study of Bypass Route
(1) Battambang Bypass
Six alternative routes were studied for
Battambang Bypass.
Alternative routes were evaluated mainly from
viewpoints of number of houses/household to be
relocated, impact to natural environment of
especially Tonle Sap Lake and Tonle Sap River,
and future urban development, as well as traffic
flow.
After consultation among MPWT, Provincial
Government of Battambang, affected people and
JICA Study Team, Alternative JICA-1 was
selected as the most preferable route.
After further study and consultation the route as
shown in Figure 8 was finally selected.
Figure 8 Finally Selected Route of
Battambang Bypass
Figure 7 Alternative Routes of
Battambang Bypass

iv
(2) Sri Sophorn Bypass
Sri Sophorn Bypass was planned to avoid
resettlement of people in the city of Sri
Sophorn.
Alternative routes as shown in Figure 9 were
evaluated.
With consultation among MPWT, Provincial
Government of Banteay Meanchey, and
JICA Team, Alternative JICA-3 was adopted.
Figure 9 Alternative Routes of Sri
Sophorn Bypass
9. Design of Widening of North Section and Bypasses
(1) Design of Widening of North Section
Three alternatives of cross section were
studied
(i) Full 4-lane with 3m-wide median
division and 3m-wide paved shoulder,
(ii) 4-lane with 0.5m-wide median and
3m-wide gravel shoulder
(iii) Opposed 2-lane plus slow vehicle
lanes of 2.5m wide on the both sides
In the all alternatives, 2.5m-wide parking
space was planned in urbanized sections.
The above alternatives were compared from
viewpoints on the following aspects:
(i) Standard of ASEAN Highway and
Cambodian Road Design Standards
(ii) Traffic Capacity
(iii) Traffic Safety
(iv) Resettlement and other social impacts
(v) Project Cost
After many discussions between MPWT,
MEF, JICA and JICA Survey Team,
Alternative (ii) was selected. Figures 10 and
11 shows typical cross section for rural and
urbanized section, respectively.
Figure 12 shows perspective view of the
widened NR 5.
Figure 10 Adopted Typical Cross Section
of Rural Section
Figure 11 Adopted Typical Cross Section
of Urban Section

v
(2) Design of Bypass
Considering the estimated traffic which will
divert to the bypasses, opposed 2-lane cross
section was proposed by the JICA Survey
Team and was agreed among MPWT, MEF
and JICA.
Same cross section is to be used in both
Battambang and Sri Sophorn Bypasses
considering the estimated traffic volumes.
Figure 13 shows the adopted typical cross
section of bypasses.
Figure 13 Typical Cross Section of Bypasses
10. Project Cost
Project cost is estimated as shown in Table 2.
Table 2 Estimated Project Cost
Items Amount (USD million)
Items Amount
(USD million)
JICA Portion RGC Portion1-1 Construction cost 2-1 Land Acquisition and Resettlement
Cost***
Section I (North Section of NR 5)
*** 2-2 Utilities Relocation / Removal / Protection Cost
***
Section II (Battambang Bypass) *** 2-3 Detection and Removal Cost of Mines and UXOs
***
Section III (Sri Sophorn Bypass) *** 2-4 Price Escalation ***Total of Construction Cost *** 2-5 Contingency ***
1-2 Consulting Services *** 2-6 Employer’s Administration Cost ***1-3 Price Escalation for above *** 2-7 Taxes ***
1-4 Contingency *** Total of Project Cost
(JICA Portion) *** Total of Project Cost
(RGC Portion)***
Grand Total ***
Figure 12 Perspective View of Widened NR 5

vi
11. Implementation Schedule
Table 3 shows the Implementation Schedule. The Project is expected to be completed in Year
2018, if the procedures of procurement consultant for detailed design and construction
supervision will be started in September 2012.
Table 3 Implementation Schedule
12. Project Evaluation
Based on the improvement of traffic
condition and estimated traffic cost,
economic internal rate of return (EIRR) and
other economic indicators were calculated
as shown in Table 4.
Sensitivity analysis shows that even in the
most unfavorable scenario with 10%
increase in the Project cost and 10%
decrease in the benefit, EIRR is calculated
to be 20.2%.
With EIRR larger than 20%, the project is
evaluated to be economically viable.
Table 4 Economic Parameters
Indicator Result
EIRR (%) 22.4
B/C 3.08
NPV(USD Million) ***
Table 5 Sensitivity Analysis
1 2 3 4 5 6 7 8 9 10 11 12 1 2 3 4 5 6 7 8 9 10 11 12 1 2 3 4 5 6 7 8 9 10 11 12 1 2 3 4 5 6 7 8 9 10 11 12 1 2 3 4 5 6 7 8 9 10 11 12 1 2 3 4 5 6 7 8 9 10 11 12 1 2 3 4 5 6 7 8 9 10 11 12 1 2 3 4 5 6 7 8 9 10 11 12 1 2 3 4 5 6 7 8 9 10 11 12
1 Feasibility Study (FS)
2
3 Negotiation of Loan Agreement
4 Selection of Consultant
5 Engineering Study and Supervision
a) Basic Design & Detail Design
b)Preparation of Tender Documents forContractors
PQ / Tender
c)Tender Process and Evaluation forContractors
PQ Tender
d) Supervision
6 Selection of Contractors PQ Tender
7 Land Acquisition / Resettlement
8 Detection & Removal of Mines / UXOs
9 Construction
Section I (National Road 5- North Section)
Section II (Banttambang Bypass)
Section III (Sri Sophom Bypass)
10 Operation and Maintenance
2019
RGC Action for Approval on FS
Items2011 2012 2013 2014 2015 2016 2017 2018
Defect Liability Period
Defect Liability Period
Defect Liability Period
Case EIRR
Base Case 22.4
Investment Cost +10% 21.3
Benefit -10% 21.2
Investment Cost +10%, Benefit -10%
20.2

vii
13. Environmental and Social Consideration
According to the Cambodian legislations on
EIA, EIA is not required for the Project
since the total length of Project road is less
than 100km.
However, the project is anticipated to
require large number of resettlement of
families and preparation of EIA report and
Resettlement Action Plan (RAP) are
required according to the JICA’s Guidelines
for Environmental and Social
Consideration’.
EIA report and RAP were prepared by
MPWT with assistance of JICA Survey
Team and were submitted to JICA.
Preliminary survey on Affected Households
(AHs) showed that 2,265 households are
affected.
In the stakeholder meetings, there were
very few opinion of oppositions to
resettlement for the Project.
Table 6 Affected Households
Province No. of AHs by Section
Total(AHs)National
Road 5 BTB
Bypass BMCH Bypass
Banteay Meanchey Province
644 0 150 794
Mongkol Borei District
644 0 108 752
Krong Sri Sophorn 0 0 42 42
Battambang (BTB) Province
964 507 0 1,471
Thma Koul District 964 107 0 1071
Krong Bat Dambang 0 235 0 235
Sangkae District 0 165 0 165
Total (the Project) 1,608 507 150 2,265
14. Conclusion and Recommendation
(1) Conclusion
Improvement of Battambang – Sri Sophorn Section of Natinal road No. 5 and construction of
Battambang Bypass and Sri Sophorn Bypass are justified considering the following aspects:
- There is no strong opposition to the Project among the stakeholders, including the people who
are anticipated to be relocated.
- The Project is expected to yield economic benefit such as EIRR of 22%
- No significant adverse impact on natural and living environment of the Project Area is
anticipated.
(2) Recommendation
Improvement of Battambang – Sri Sophorn Section of NR 5 and construction of Battambang
Bypass and Sri Sophorn Bypass is recommended to be implemented.
MPWT is recommended to employ competent consultants for the consultat services of detailed
design/assistance for procurement of civil works/construction supervision to minimize risks
possible to occur during construction.
MPWT is recommended to request to JICA for technical assistance for implementation of Yen
loan project.
Survey on improvement of Prek Kdam – Thlea Ma’am Section and construction of Kampong
Chhnang Bypass need to be urgently studied.

i
TABLE OF CONTENTS
Location Map
Summary
Table of Contents
List of Tables
List of Figures
List of Photos
List of Abbreviations
List of Appendixes
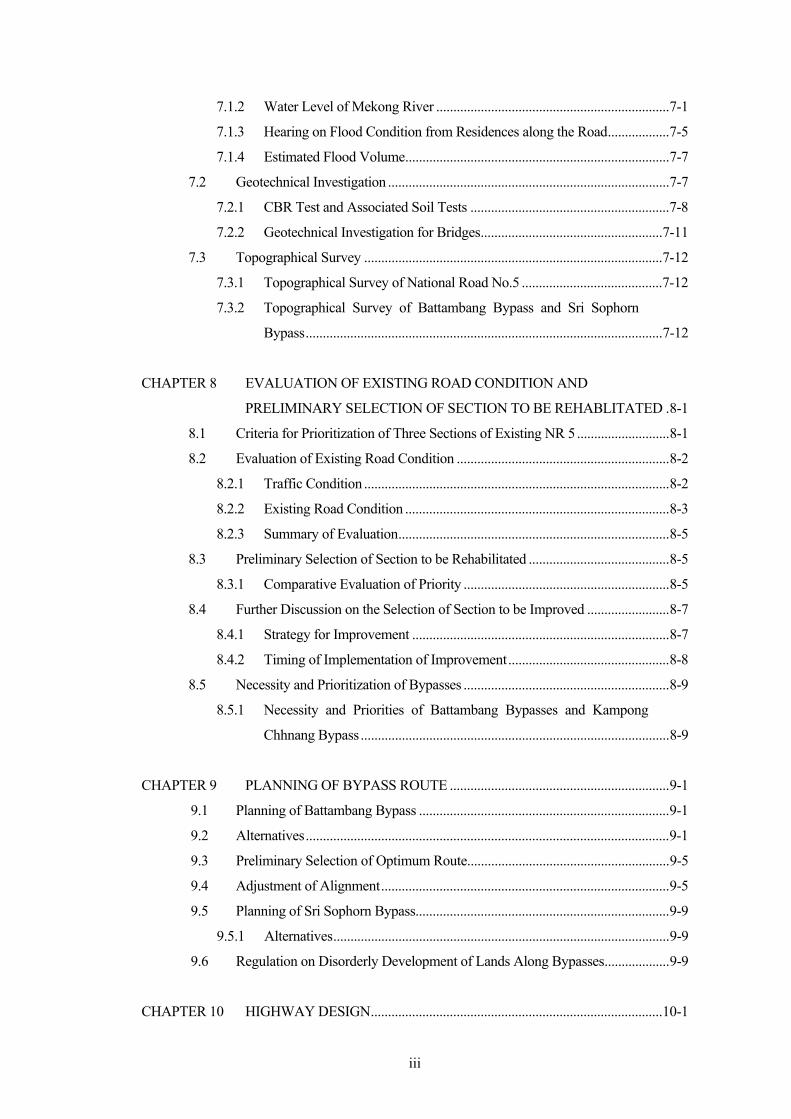
CHAPTER 1 INTRODUCTION............................................................................................1-1
1.1 Background..........................................................................................................1-1
1.2 Objectives of the Survey .....................................................................................1-2
1.3 Survey Area .........................................................................................................1-2
1.4 Scope of Work.....................................................................................................1-2
1.5 General Works Schedule.....................................................................................1-3
1.6 Organization of the Survey..................................................................................1-5
CHAPTER 2 PROFILE OF THE SURVEY AREA .............................................................2-1
2.1 Physical Profile....................................................................................................2-1
2.2 Socio-Economic Profile.......................................................................................2-4
CHAPTER 3 NATIONAL ROAD NETWORK OF CAMBODIA AND ROLE OF
NATIONAL ROAD NO. 5 ..............................................................................3-1
3.1 National Road Network of Cambodia.................................................................3-1
3.1.1 National Road Network of Cambodia ...........................................................3-1
3.1.2 Surface Condition of National Road Network ..............................................3-2
3.1.3 Development Plan..........................................................................................3-3
3.2 Role of National Road No. 5...............................................................................3-4
CHAPTER 4 PRESENT CONDITION OF NATIONAL ROAD NO. 5.............................4-1
4.1 Physical Condition of National Road No. 5........................................................4-1
4.1.1 Overall Conditions .........................................................................................4-1
4.1.2 Geometric Structure .......................................................................................4-5
4.1.3 Pavement Condition.......................................................................................4-8
4.1.4 Bridge Condition............................................................................................4-9

ii
4.1.5 Roadside Land Use ......................................................................................4-11
4.2 Planned, Ongoing and Past Project for Rehabilitation/Improvement of
NR 5 ...................................................................................................................4-12
CHAPTER 5 TRAFFIC SURVEYS ......................................................................................5-1
5.1 Traffic Count Survey...........................................................................................5-1
5.1.1 Outline .........................................................................................................5-1
5.1.2 Location of Traffic Count Survey...............................................................5-1
5.1.3 Survey Result...............................................................................................5-3
5.2 Origin Destination (OD) Survey .........................................................................5-5
5.2.1 Outline .........................................................................................................5-5
5.2.2 Survey Result...............................................................................................5-6
5.3 Travel Speed Survey..........................................................................................5-10
5.3.1 Outline .......................................................................................................5-10
5.3.2 Route and Sections of Travel Speed Survey.............................................5-10
5.3.3 Survey Result.............................................................................................5-10
CHAPTER 6 FUTURE TRAFFIC DEMAND FORECAST................................................6-1
6.1 Methodology........................................................................................................6-1
6.2 Socio-Economic Framework...............................................................................6-1
6.2.1 Population Projection ..................................................................................6-2
6.2.2 Economic Growth of Cambodia .................................................................6-3
6.2.3 Future GDP Prediction................................................................................6-4
6.2.4 Vehicle Registration....................................................................................6-6
6.3 Future OD Table..................................................................................................6-9
6.3.1 Zoning System.............................................................................................6-9
6.3.2 Preparation of Present OD table................................................................6-11
6.3.3 Trip Generation and Attraction .................................................................6-11
6.3.4 Modal Split ................................................................................................6-15
6.4 Traffic Demand Forecast...................................................................................6-15
6.4.1 Traffic Assignment....................................................................................6-15
6.4.2 Peak Hour Traffic Volume and Congestion .............................................6-21
6.4.3 Traffic Volume on Bypass ........................................................................6-22
CHAPTER 7 NATURAL CONDITION SURVEY..............................................................7-1
7.1 Hydrological Condition and Record of Flood ....................................................7-1
7.1.1 Flood Condition Information obtained from Provincial DPWTs ..............7-1
iii
7.1.2 Water Level of Mekong River ....................................................................7-1
7.1.3 Hearing on Flood Condition from Residences along the Road..................7-5
7.1.4 Estimated Flood Volume.............................................................................7-7
7.2 Geotechnical Investigation ..................................................................................7-7
7.2.1 CBR Test and Associated Soil Tests ..........................................................7-8
7.2.2 Geotechnical Investigation for Bridges.....................................................7-11
7.3 Topographical Survey .......................................................................................7-12
7.3.1 Topographical Survey of National Road No.5 .........................................7-12
7.3.2 Topographical Survey of Battambang Bypass and Sri Sophorn
Bypass........................................................................................................7-12
CHAPTER 8 EVALUATION OF EXISTING ROAD CONDITION AND
PRELIMINARY SELECTION OF SECTION TO BE REHABLITATED .8-1
8.1 Criteria for Prioritization of Three Sections of Existing NR 5...........................8-1
8.2 Evaluation of Existing Road Condition ..............................................................8-2
8.2.1 Traffic Condition .........................................................................................8-2
8.2.2 Existing Road Condition .............................................................................8-3
8.2.3 Summary of Evaluation...............................................................................8-5
8.3 Preliminary Selection of Section to be Rehabilitated .........................................8-5
8.3.1 Comparative Evaluation of Priority ............................................................8-5
8.4 Further Discussion on the Selection of Section to be Improved ........................8-7
8.4.1 Strategy for Improvement ...........................................................................8-7
8.4.2 Timing of Implementation of Improvement...............................................8-8
8.5 Necessity and Prioritization of Bypasses ............................................................8-9
8.5.1 Necessity and Priorities of Battambang Bypasses and Kampong
Chhnang Bypass..........................................................................................8-9
CHAPTER 9 PLANNING OF BYPASS ROUTE ................................................................9-1
9.1 Planning of Battambang Bypass .........................................................................9-1
9.2 Alternatives..........................................................................................................9-1
9.3 Preliminary Selection of Optimum Route...........................................................9-5
9.4 Adjustment of Alignment....................................................................................9-5
9.5 Planning of Sri Sophorn Bypass..........................................................................9-9
9.5.1 Alternatives..................................................................................................9-9
9.6 Regulation on Disorderly Development of Lands Along Bypasses...................9-9
CHAPTER 10 HIGHWAY DESIGN.....................................................................................10-1

iv
10.1 Basic Design Policy...........................................................................................10-1
10.1.1 Horizontal Alignment................................................................................10-1
10.1.2 Vertical Alignment and Height of Road Surface......................................10-3
10.1.3 Cross Section .............................................................................................10-4
10.2 Preliminary Design of North Section................................................................10-5
10.2.1 Roadside Land Use....................................................................................10-5
10.2.2 Typical Cross Section................................................................................10-6
10.2.3 Horizontal Alignment..............................................................................10-15
10.2.4 Vertical Alignment and Profile ...............................................................10-17
10.2.5 Intersection...............................................................................................10-18
10.2.6 Pavement Design.....................................................................................10-18
10.2.7 Drainage...................................................................................................10-20
10.2.8 Appurtenance...........................................................................................10-20
10.3 Preliminary Design of Battambang Bypass ....................................................10-22
10.3.1 Typical Cross Section..............................................................................10-22
10.3.2 Horizontal Alignment..............................................................................10-22
10.3.3 Vertical Alignment ..................................................................................10-23
10.3.4 Pavement Design.....................................................................................10-23
10.3.5 Drainage...................................................................................................10-24
10.4 Preliminary Design of Sri Sophorn Bypass ....................................................10-25
10.4.1 Typical Cross Section..............................................................................10-25
10.4.2 Horizontal Alignment..............................................................................10-25
10.4.3 Vertical Alignment ..................................................................................10-26
10.4.4 Pavement Design.....................................................................................10-26
10.4.5 Drainage...................................................................................................10-27
10.5 Traffic Safety Measures ..................................................................................10-28
10.6 Summary of Proposed Design.........................................................................10-30
CHAPTER 11 BRIDGE PLANNING..............................................................................11-1
11.1 Bridge Design Standards in Cambodia .............................................................11-1
11.1.1 Traffic Loading..........................................................................................11-2
11.2 Standard Bridges in Cambodia..........................................................................11-4
11.3 Inventory of Existing Bridges on the North Section.........................................11-9
11.4 Condition of Existing Bridges on the North Section ........................................11-9
11.4.1 Condition of the Existing Bridge Structures.............................................11-9
11.4.2 Flood Conditions at the Existing Bridge Locations................................11-13
11.5 Bridge Rehabilitation Plan on the North Section............................................11-14

v
11.5.1 Planning of Bridge Widening for 4-Lane Road......................................11-15
11.5.2 Rehabilitation of Br. 79 & Br. 82............................................................11-16
11.5.3 Rehabilitation of Br. 84 ...........................................................................11-20
11.5.4 Rehabilitation of Br. 89 ...........................................................................11-22
11.5.5 Rehabilitation of Br. 91 ...........................................................................11-25
11.6 Planning of Bridge Widening for 2-Lane Road..............................................11-28
11.7 Details of Bridge Widening for 4-Lane Road.................................................11-29
11.8 Additional/Replacement Bridges Required for 4-Lane Road ........................11-33
11.8.1 Preliminary Design of Substructure........................................................11-35
11.8.2 Preliminary Design of Superstructure.....................................................11-35
11.9 Planning of Bridges on Battambang Bypass...................................................11-37
11.9.1 Proposed Bridge over Sangkae River on Battambang Bypass...............11-38
11.10 Planning of Bridges on Sri Sophorn Bypass...................................................11-43
CHAPTER 12 COST ESTIMATION...............................................................................12-1
12.1 Construction Cost ..............................................................................................12-1
12.1.1 Section of Works .......................................................................................12-1
12.1.2 Cost Estimate.............................................................................................12-2
12.2 Consultancy Services.........................................................................................12-4
12.2.1 Major Tasks to be Undertaken by Consultant ..........................................12-5
12.2.2 Consultant Assignment Schedule..............................................................12-7
12.2.3 Roles of Professional Staff ........................................................................12-9
12.2.4 Organization of Consultant .....................................................................12-10
12.2.5 Cost of Consulting Services ....................................................................12-11
12.3 Cost Born by the RGC.....................................................................................12-11
12.3.1 Land Acquisition and Resettlement Cost................................................12-11
12.3.2 Cost of Relocation, Removal and/or Protection of Utilities...................12-12
12.3.3 Cost of Detection and Removal of Mines and UXOs ............................12-13
12.3.4 Taxes........................................................................................................12-13
12.3.5 Administration Cost ................................................................................12-13
12.4 Escalation.........................................................................................................12-13
12.5 Summary of Project Cost ................................................................................12-14
12.6 Contract Package .............................................................................................12-14
12.7 Annual Progress...............................................................................................12-15
12.8 Repayment Schedule .......................................................................................12-15
12.9 Value Engineering ...........................................................................................12-16

vi
CHAPTER 13 IMPLEMENTATION PLAN ........................................................................13-1
13.1 Execution Plan...................................................................................................13-1
13.1.1 Road works................................................................................................13-1
13.1.2 Bridge works .............................................................................................13-3
13.1.3 Widening of Existing Bridge ....................................................................13-6
13.1.4 Other Structure Works ..............................................................................13-7
13.1.5 Traffic Management during Construction ................................................13-7
13.1.6 Utilities.......................................................................................................13-8
13.2 Organization in Implementation........................................................................13-9
13.2.1 Employer ...................................................................................................13-9
13.2.2 Consultant................................................................................................13-10
13.2.3 Contractor ................................................................................................13-10
13.3 Implementation Schedule................................................................................13-10
CHAPTER 14 MAINTENANCE AND OPERATION PLAN.............................................14-1
14.1 Maintenance and Operation Cost ......................................................................14-1
14.1.1 Organization in Charge of Road Maintenance .........................................14-1
14.1.2 Practice of Road Maintenance and Operation ..........................................14-2
14.1.3 Necessity of Capacity Enhancement for Road Maintenance ...................14-4
14.1.4 Budget for Road Maintenance and Operation Works ..............................14-4
14.1.5 Maintenance and Operation Cost..............................................................14-5
14.2 Annual Road Maintenance and Operation Cost ...............................................14-6
CHAPTER 15 PROJECT EVALUATION............................................................................15-1
15.1 Evaluation Index................................................................................................15-1
15.2 Consideration on Indirect Benefits not Listed in the Table Above ..................15-3
15.2.1 Promotion of Poverty Reduction ..............................................................15-3
15.2.2 Investment Promotion of Foreign Firms...................................................15-3
15.2.3 Relation to rice export ...............................................................................15-3
15.3 Operation and Effect Monitoring Plan..............................................................15-3
15.4 Economic Analysis............................................................................................15-4
15.4.1 Methodology .............................................................................................15-4
15.4.2 Presumption for Economic Evaluation.....................................................15-5
15.4.3 Estimated Benefits.....................................................................................15-7
15.5 Justification of the Project ...............................................................................15-15
CHAPTER 16 NOTES FOR IMPLEMENTATION AS JAPANESE ODA LOAN
vii
PROJECT........................................................................................................16-1
16.1 Start-up Stage.....................................................................................................16-1
16.1.1 Land Acquisition, Relocation and Mitigation Plan for Affected
Families......................................................................................................16-1
16.1.2 Internal Approval Procedures ...................................................................16-2
16.2 Procurement Stage.............................................................................................16-2
16.3 Construction Stage.............................................................................................16-3
16.3.1 Construction Quality Control....................................................................16-3
16.3.2 Construction Safety ...................................................................................16-4
16.4 Operation and Maintenance Stage ....................................................................16-5
16.4.1 Budget for Operation and Maintenance....................................................16-5
16.4.2 Traffic Safety.............................................................................................16-6
16.4.3 Enforcement against Overloaded Trucks..................................................16-6
CHAPTER 17 ENVIRONMENTAL AND SOCIAL CONSIDERATION.........................17-1
17.1 Institutional Setup and Legal and Policy Framework for Environmental
and Social Considerations in Cambodia ...........................................................17-1
17.1.1 Organization in charge of EIA/IEIA in Ministry of Environment...........17-1
17.1.2 Organization in charge of EIA/IEIA in Province and Municipality ........17-2
17.2 Legal and Policy Framework for Environmental and Social Considerations
in Cambodia.......................................................................................................17-3
17.2.1 Fundamental Law and Regulations...........................................................17-3
17.2.2 EIA System in Cambodia..........................................................................17-3
17.2.3 Consistency with JICA Guidelines for Environmental and Social
Considerations (April, 2010, JICA New Guidelines)...............................17-6
17.2.4 Environmental Standard............................................................................17-8
17.3 Site Description..................................................................................................17-9
17.3.1 Natural Environment.................................................................................17-9
17.3.2 Climate.....................................................................................................17-19
17.3.3 Land Use..................................................................................................17-19
17.4 Categorization of the Project ...........................................................................17-26
17.5 Examination of Potential Environmental Impact and Scoping ......................17-26
17.5.1 Environmental Scoping...........................................................................17-26
17.5.2 Present Condition of Air Quality, Water Quality, Noise and Vibration 17-37
17.5.3 Estimation of Impact of Road Improvement ..........................................17-43
17.6 Alternative Analysis ........................................................................................17-45
17.7 Environmental Management Plan...................................................................17-50

viii
17.7.1 Objective and Target of EMP .................................................................17-50
17.7.2 Environmental Management Plan...........................................................17-51
17.7.3 Monitoring Plan.......................................................................................17-61
17.7.4 Staffing and Training...............................................................................17-67
17.8 Stakeholder Meeting (refer to Section 18.5, Chapter 18)...............................17-68
CHAPTER 18 RESETTLEMENT ACTION PLAN.............................................................18-1
18.1 Legal and Policy Framework ............................................................................18-1
18.1.1 Legal and Policy Framework for Resettlement and Land Acquisition
in Cambodia...............................................................................................18-1
18.1.2 Policy Gap Assessment.............................................................................18-5
18.2 Project Resettlement Policy...............................................................................18-7
18.2.1 Objective....................................................................................................18-7
18.2.2 Key Principles ...........................................................................................18-7
18.2.3 Cut-off Date...............................................................................................18-8
18.3 Eligibility ...........................................................................................................18-8
18.3.1 Entitlements.............................................................................................18-10
18.4 Project Impacts ................................................................................................18-15
18.4.1 Methodology Used in Preparing the Resettlement Plan.........................18-15
18.4.2 Inventory of affected Assets....................................................................18-18
18.5 Socio Economic Profile of the Affected Households.....................................18-21
18.5.1 Population and Household Composition ................................................18-22
18.5.2 Vulnerable Household.............................................................................18-22
18.5.3 Literacy of the Affected Households Heads and Spouses......................18-23
18.5.4 Educational Attainment of the Population..............................................18-23
18.5.5 Affected Households’ Heads Engaged in Farming and Non-farming...18-24
18.5.6 Main Sources of Income of Affected Households .................................18-24
18.5.7 Household Income of the Affected Households by Sex ........................18-25
18.5.8 Credit .......................................................................................................18-26
18.5.9 Sanitation .................................................................................................18-27
18.5.10 Transportation..........................................................................................18-29
18.5.11 Household Appliances ............................................................................18-30
18.5.12 People Perception on the Project.............................................................18-31
18.6 Organizational Framework..............................................................................18-32
18.6.1 The Environmental Section of the Project Management Unit
(PMU-ES)................................................................................................18-32
18.6.2 The Inter-ministerial Resettlement Committee (IRC) and

ix
the Resettlement Department (RD).........................................................18-33
18.6.3 Provincial Resettlement Sub-Committee................................................18-34
18.7 Implementation Schedule................................................................................18-34
18.8 Public Participation and Consultation.............................................................18-36
18.8.1 Participatory Activities in RAP Planning ...............................................18-36
18.8.2 Public Consultations during RP Preparation ..........................................18-37
18.9 Grievance Redress ...........................................................................................18-47
18.9.1 First Stage: Commune Level...................................................................18-47
18.9.2 Second Stage: PRSC-WG.......................................................................18-47
18.9.3 Third Stage: IRC .....................................................................................18-48
18.9.4 Final Stage: Court of Law.......................................................................18-48
18.10 Relocation Strategy..........................................................................................18-48
18.10.1 Summary Cost of Resettlement Site Development ................................18-49
18.11 Income Restoration Strategy ...........................................................................18-49
18.12 Costs and Budget .............................................................................................18-50
18.12.1 Procedures for Flow of Funds.................................................................18-50
18.12.2 Updating of the Compensation Rates and Inflation Adjustment ...........18-50
18.12.3 Estimated Costs for Resettlement ...........................................................18-50
18.13 Monitoring and Evaluation..............................................................................18-51
18.13.1 Internal Monitoring .................................................................................18-51
18.13.2 External Monitoring ................................................................................18-51
CHAPTER 19 CONCLUSION AND RECOMMENDATION............................................19-1
19.1 Conclusion .........................................................................................................19-1
19.2 Recommendation...............................................................................................19-1

x
LIST OF TABLES
Table 1.5-1 General Schedule of the Survey.....................................................................1-4
Table 1.6-1 List of Steering Committee Member.............................................................1-5
Table 1.6-2 Team Member List.........................................................................................1-6
Table 2.1-1 Monthly Rainfall in Batttambang Province...................................................2-3
Table 2.1-2 Maximum and Minimum Temperaturein Battambang Province in 2010
and 2011..........................................................................................................2-3
Table 2.2-1 Socio-Economic Data of Survey Area (4 provinces only)............................2-4
Table 3.1-1 Length and route of Arterial National Road (As of 2008) ............................3-2
Table 4.1-1 Description of Classification for Straight Line Diagram ..............................4-1
Table 4.1-2 Embankment Height ......................................................................................4-5
Table 4.1-3 Bridges Considered to be Replaced.............................................................4-10
Table 4.2-1 Project List on National Road No. 5............................................................4-14
Table 5.1-1 Vehicle Classification for the Traffic Count Survey.....................................5-1
Table 5.1-2 Location of Traffic Count Survey..................................................................5-2
Table 5.1-3 Traffic Volume for 12 Hours.........................................................................5-3
Table 5.1-4 Peak Hour Traffic Volume by Direction.......................................................5-4
Table 5.1-5 24 Hours/12 Hours Ratio at Station 5 (Rural Area) ......................................5-4
Table 5.1-6 24 Hours/12 Hours Ratio at Station 7 (Boundary of City)............................5-5
Table 5.1-7 Daily (24 Hour) Traffic Volume....................................................................5-5
Table 5.2-1 Number of Sampling and Rate ......................................................................5-6
Table 5.2-2 Average Passenger Occupancy......................................................................5-6
Table 5.2-3 Major Cargo ...................................................................................................5-7
Table 5.3-1 Long-Distance Average Travel Speed.........................................................5-11
Table 5.3-2 Travel Speed in Kampong Chhnang City ...................................................5-11
Table 5.3-3 Travel Speed in Batanmbang City...............................................................5-11
Table 6.2-1 Population by Province ..................................................................................6-2
Table 6.2-2 Annual Growth Rate of GDP and GDP Per Capita ......................................6-5
Table 6.2-3 GDP Growth Rate Adopted in JICA M/P Study...........................................6-5
Table 6.2-4 GDP Growth Rate of PRC and Vietnam.......................................................6-5
Table 6.2-5 Scenario of Future GDP Growth ...................................................................6-6
Table 6.2-6 Vehicle Ownership in year 2010 ...................................................................6-7
Table 6.2-7 Growth Rate of Vehicle Registration ............................................................6-7
Table 6.2-8 Projection of Number of Vehicle...................................................................6-8
Table 6.3-1 Zoning Code.................................................................................................6-10
Table 6.3-2 (1) Trip Generation and Attraction by Vehicle Type Group in 2011...............6-11

xi
Table 6.3-2 (2) Trip Generation and Attraction by Vehicle Type Group in 2016...............6-11
Table 6.3-2 (3) Trip Generation and Attraction by Vehicle Type Group in 2021...............6-12
Table 6.3-2 (4) Trip Generation and Attraction by Vehicle Type Group in 2030...............6-12
Table 6.4-1 Result of Traffic Assignment.......................................................................6-18
Table 6.4-2 Traffic Volume by Vehicle Type.................................................................6-19
Table 6.4-3 Traffic Volume Diverted to Rail ................................................................6-20
Table 6.4 4 Peak Hour Traffic Volume and Congestion Degree ...................................6-22
Table 6.4 5 Future Traffic Volume on Bypass ...............................................................6-22
Table 7.1-1 Flood Information Provided by Provincial DPWT.......................................7-1
Table 7.1-2 Flood Prone Area in South Section ...............................................................7-5
Table 7.1-3 Flood Prone Area in North Section ...............................................................7-5
Table 7.1-4 Volume of Rain Water Run-Off ....................................................................7-7
Table 7.2-1 Variation of CBR .........................................................................................7-10
Table 7.2-2 Borehole Location........................................................................................7-11
Table 7.3-1 Description of Activities of Aero Photo Survey..........................................7-12
Table 7.3-2 Survey Item and Output for Road Section ..................................................7-12
Table 7.3-3 Output of the Survey ....................................................................................7-13
Table 7.3-4 Survey Item for Bridge ................................................................................7-13
Table 7.3-5 Output of the Survey ....................................................................................7-13
Table 8.1-1 Criteria for Prioritization................................................................................8-1
Table 8.2-1 Summary of Anticipated Traffic Congestion ................................................8-2
Table 8.2-2 Number of Bridge Which Need to be Replaced............................................8-4
Table 8.2-3 Summary of Survey Result of Inundation.....................................................8-4
Table 8.2-4 Summary of Evaluation .................................................................................8-5
Table 8.3-1 Priority of Three Sections of Existing NR 5..................................................8-6
Table 8.4-1 Traffic Volume on the North Section ............................................................8-9
Table 8.5-1 Future Traffic Volume in the Outskirt of Battambang City........................8-10
Table 8.5-2 Future Traffic Volume in the Outskirt of Kamopong Chhnang City .........8-10
Table 8.5-3 Traffic Volume on Sri Sophorn Bypass and Battambang Bypass..............8-11
Table 9.2-1 Comparison of Alternatives of Battambang Bypass Routes.........................9-3
Table 9.4-1 Comparison of JICA-1A and JICA-1C .........................................................9-8
Table 9.5-1 Comparison of Alternatives of Sri Sophorn Bypass ...................................9-10
Table 10.1-1 Comparison of Design Speed and Criteria ..................................................10-1
Table 10.1-2 Curved Sections on North Section...............................................................10-2
Table 10.1-3 Comparison of Design Criteria....................................................................10-4
Table 10.2-1 Classification of Roadside Land Use...........................................................10-5
Table 10.2-2 Estimated Traffic Volume............................................................................10-6

xii
Table 10.2-3 Traffic Accident of Single-Digit National Highways .................................10-8
Table 10.2-4 Vehicle Types Involved in Traffic Accidents .............................................10-8
Table 10.2-5 Merits and Demerits of Cross Section Alternatives for
Rural/Suburban Area..................................................................................10-11
Table 10.2-6 Feature of Cross Section Alternatives for Urbanized Area.......................10-14
Table 10.2-7 Element of Curves to Be Improved ...........................................................10-15
Table 10.2-8 Designed Pavement Structure....................................................................10-19
Table 10.2-9 Location of Lined Ditch.............................................................................10-20
Table 10.3-1 IP & Element of Curves.............................................................................10-22
Table 10.3-2 Box Culvert Schedule ................................................................................10-24
Table 10.4-1 IP & Element of Curves.............................................................................10-25
Table 10.4-2 Box Culvert Schedule ................................................................................10-27
Table 10.5-1 Types, Causes and Measures of Traffic Accident due to Road
Improvement...............................................................................................10-28
Table 10.6-1 Summary of Design of North Section of Existing NR 5...........................10-30
Table 10.6-2 Summary of Design of Battambang Bypass .............................................10-30
Table 10.6-3 Summary of Design of Sri Sophorn Bypass..............................................10-31
Table 11.1-1 Comparison of Nominal Load Effects for 20m span Bridge
Cambodian, AASHTO and JRA Standards ................................................11-1
Table 11.3-1 Inventory of Existing Bridges, North Section .............................................11-9
Table 11.4-1 Flood Condition at Location of Existing Bridges, North Section.............11-14
Table 11.5-1 Summary of Bridge Widening- Full 4-Lane Design.................................11-16
Table 11.5-2 Comparative Study of Alternatives for Br. 91...........................................11-26
Table 11.5-3 Summary of Bridge Widening- 2-Lane Design ........................................11-28
Table 11.8-1 Preliminary Design of Additional/Replacement Bridges on NR 5
- Full 4-Lane Design...................................................................................11-34
Table 11.9-1 Preliminary Design of Bridges on Battambang Bypass............................11-38
Table 11.9-2 Comparative Study of Alternatives for Sangkae River Bridge.................11-39
Table 11.9-3 Comparative Study of Alternatives Pier Designs for Sangkae River
Bridge .........................................................................................................11-41
Table 11.10-1 Preliminary Design of Bridges on Sri Sophorn Bypass............................11-43
Table 12.1-1 Start Point and End Point of Sections..........................................................12-1
Table 12.1-2 Work Scope in Each Section .......................................................................12-2
Table 12.1-3 Typical Cross Section Used in Section I .....................................................12-2
Table 12.1-4 Unit Price of Works .....................................................................................12-3
Table 12.1-5 Summary of Construction Cost ...................................................................12-4
Table 12.2-1 Assignment Schedule for Engineering Study..............................................12-7

xiii
Table 12.2-2 Assignment Schedule for Selection of Contractors and Supervision .........12-8
Table 12.2-3 Roles of Professionals..................................................................................12-9
Table 12.2-4 Cost of Consulting Services.......................................................................12-11
Table 12.3-1 Land Acquisition and Resettlement Cost ..................................................12-12
Table 12.3-2 Utilities Relocation, Removal and/or Protection Cost ..............................12-12
Table 12.3-3 Detection and Removal Cost of Mines and UXOs ...................................12-13
Table 12.5-1 Summary of Project Cost...........................................................................12-14
Table 12.7-1 Annual Progress .........................................................................................12-15
Table 12.8-1 Loan Amount in Grace Period...................................................................12-16
Table 12.9-1 Items of Value Engineering .......................................................................12-17
Table 13.1-1 Bridge Rehabilitation in Section I................................................................13-4
Table 13.1-2 Summary of Bridges in Section I.................................................................13-4
Table 13.1-3 Bridge Construction in Section II and III ....................................................13-5
Table 13.3-1 Implementation Schedule for National Road 5 Rehabilitation Project.....13-15
Table 14.1-1 Functions and Duties of MPWT and DPWT with Respect to
Maintenance .................................................................................................14-1
Table 14.1-2 Typical Maintenance Activities...................................................................14-3
Table 14.1-3 Rank of Defects............................................................................................14-3
Table 14.1-4 Budget for Road Maintenance under MPWT .............................................14-4
Table 14.1-5 Routine Maintenance in Section I, II and III ...............................................14-5
Table 14.1-6 Periodic Maintenance in Section I, II and III ..............................................14-6
Table 14.2-1 Annual Road Maintenance and Operation Cost..........................................14-7
Table 15.1-1 Performance Indicator with Project Operation and Effectiveness
Measurement ................................................................................................15-2
Table 15.3-1 Operation and Effect Indicator.....................................................................15-4
Table 15.4-1 Project Implementation Schedule for Economic Analysis..........................15-6
Table 15.4-2 Maintenance Labor Cost ..............................................................................15-9
Table 15.4-3 Crew Cost ...................................................................................................15-10
Table 15.4-4 Vehicle Operating Cost by Vehicle Type ..................................................15-12
Table 15.4-5 Forecast of Time Value per vehicle by Vehicle Type ...............................15-13
Table 15.4-6 Result of Economic Analysis .....................................................................15-14
Table 15.4-7 Cost Benefit Stream of the Project.............................................................15-14
Table 15.4-8 Results of the Sensitivity Analysis.............................................................15-15
Table 17.2-1 List of Projects and its Criteria required IEIA or EIA in Cambodia...........17-4
Table 17.2-2 Comparison between EIA System in Cambodia and New JICA
Guideline ......................................................................................................17-8
Table 17.2 -3 Ambient Air Quality Standard in Cambodia...............................................17-8
xiv
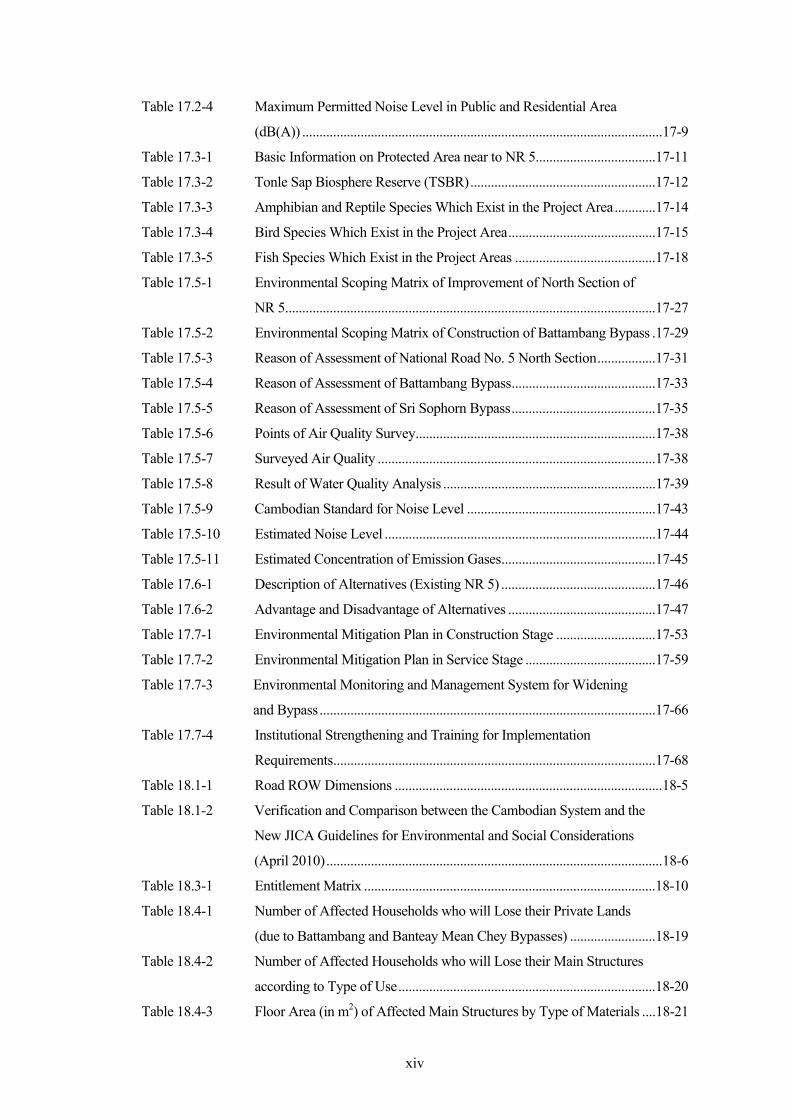
Table 17.2-4 Maximum Permitted Noise Level in Public and Residential Area
(dB(A)) .........................................................................................................17-9
Table 17.3-1 Basic Information on Protected Area near to NR 5...................................17-11
Table 17.3-2 Tonle Sap Biosphere Reserve (TSBR)......................................................17-12
Table 17.3-3 Amphibian and Reptile Species Which Exist in the Project Area............17-14
Table 17.3-4 Bird Species Which Exist in the Project Area...........................................17-15
Table 17.3-5 Fish Species Which Exist in the Project Areas .........................................17-18
Table 17.5-1 Environmental Scoping Matrix of Improvement of North Section of
NR 5............................................................................................................17-27
Table 17.5-2 Environmental Scoping Matrix of Construction of Battambang Bypass .17-29
Table 17.5-3 Reason of Assessment of National Road No. 5 North Section.................17-31
Table 17.5-4 Reason of Assessment of Battambang Bypass..........................................17-33
Table 17.5-5 Reason of Assessment of Sri Sophorn Bypass..........................................17-35
Table 17.5-6 Points of Air Quality Survey......................................................................17-38
Table 17.5-7 Surveyed Air Quality .................................................................................17-38
Table 17.5-8 Result of Water Quality Analysis ..............................................................17-39
Table 17.5-9 Cambodian Standard for Noise Level .......................................................17-43
Table 17.5-10 Estimated Noise Level ...............................................................................17-44
Table 17.5-11 Estimated Concentration of Emission Gases.............................................17-45
Table 17.6-1 Description of Alternatives (Existing NR 5) .............................................17-46
Table 17.6-2 Advantage and Disadvantage of Alternatives ...........................................17-47
Table 17.7-1 Environmental Mitigation Plan in Construction Stage .............................17-53
Table 17.7-2 Environmental Mitigation Plan in Service Stage ......................................17-59
Table 17.7-3 Environmental Monitoring and Management System for Widening
and Bypass..................................................................................................17-66
Table 17.7-4 Institutional Strengthening and Training for Implementation
Requirements..............................................................................................17-68
Table 18.1-1 Road ROW Dimensions ..............................................................................18-5
Table 18.1-2 Verification and Comparison between the Cambodian System and the
New JICA Guidelines for Environmental and Social Considerations
(April 2010)..................................................................................................18-6
Table 18.3-1 Entitlement Matrix .....................................................................................18-10
Table 18.4-1 Number of Affected Households who will Lose their Private Lands
(due to Battambang and Banteay Mean Chey Bypasses) .........................18-19
Table 18.4-2 Number of Affected Households who will Lose their Main Structures
according to Type of Use...........................................................................18-20
Table 18.4-3 Floor Area (in m2) of Affected Main Structures by Type of Materials ....18-21

xv
Table 18.5-1 Population and Household Composition...................................................18-22
Table 18.5-2 Vulnerable Household (Head) ...................................................................18-22
Table 18.5-3 Literacy of Affected Households’ Heads and Spouses.............................18-23
Table 18.5-4 Education Attainment of the Population ...................................................18-23
Table 18.5-5 Farming and Non-farming Affected Households’ heads ..........................18-24
Table 18.5-6 Main Sources of Income of the AHs .........................................................18-25
Table 18.5-7 Annual Income (USD) of AHs Headed by Males ....................................18-25
Table 18.5-8 Annual Income (USD) of AHs Headed by Females.................................18-26
Table 18.5-9 Average Annual and Monthly Income by Household and Capita............18-26
Table 18.5-10 Credits Acquired During the Last Year.....................................................18-27
Table 18.5-11 Purposes of Acquiring Credit.....................................................................18-27
Table 18.5-12 Water Sources for Drinking and Cooking.................................................18-28
Table 18.5-13 Households Boiling Water for Drinking ...................................................18-28
Table 18.5-14 Water Sources for Washing and Bathing ..................................................18-28
Table 18.5-15 Energy Sources for Lighting......................................................................18-29
Table 18.5-16 Energy Sources for Cooking......................................................................18-29
Table 18.5-17 Transport Equipment and Their Values ....................................................18-30
Table 18.5-18 Household Appliance and Its Values.........................................................18-30
Table 18.5-19 Satisfaction with the Project ......................................................................18-31
Table 18.5-20 Three Most Important Benefits of the Project...........................................18-31
Table 18.5-21 Perception of AHs on Relocation ..............................................................18-32
Table 18.7-1 Indicative Schedule of Resettlement Activities.........................................18-35
Table 18.8-1 Roles and Responsibilities of Key Stakeholders in the RP Planning .......18-37
Table 18.8-2 Public Meetings Held Regarding National Road No. 5 and the Two
Bypasses .....................................................................................................18-38
Table 18.8-3 Questions and Responses of the Provincial Stakeholder Meeting............18-40
Table 18.8-4 Questions and Responses of the Public Consultation Meeting
(before cut-off date)....................................................................................18-43
Table 18.8-5 Questions and Responses of the Public Consultation Meeting
(after cut-off date).......................................................................................18-46

xvi
LIST OF FIGURES
Figure 1.1-1 Surface Condition of National Roads in Cambodia (As of 2010) ................1-1
Figure 1.6-1 Organization of Survey ..................................................................................1-5
Figure 2.1-1 Location of NR 5............................................................................................2-1
Figure 2.1-2 Topography of Survey Area ..........................................................................2-2
Figure 2.1-3 Annual Rainfall ..............................................................................................2-2
Figure 2.1-4 Average Monthly Rainfall and Temperature.................................................2-3
Figure 2.2-1 Rice Production by Province .........................................................................2-4
Figure 3.1-1 National Road Network of Cambodia ...........................................................3-1
Figure 3.2-1 ASEAN Highway ..........................................................................................3-4
Figure 3.2-2 Economic Corridors of GMS.........................................................................3-5
Figure 4.1-1 (a) Straight Line Diagram : South Section (KP32~KP171) ............................4-2
Figure 4.1 1 (b) Straight Line Diagram : Middle Section (KP171~KP301)........................4-3
Figure 4.1 1 (c) Straight Line Diagram : North Section (KP301~KP361)..........................4-4
Figure 4.1-2 Typical Cross Section of South Section ........................................................4-6
Figure 4.1-3 Typical Cross Section of Middle Section......................................................4-6
Figure 4.1-4 Typical Cross Section of North Section ........................................................4-7
Figure 4.1-5 General Cross Section of Sri Sophorn-Poipet Section..................................4-7
Figure 4.1-6 Notice Board of Right of Way (Unofficial Translation).............................4-12
Figure 4.2-1 Schematic Illustration of Location of Works Executed under Projects
Cited Above..................................................................................................4-14
Figure 5.1-1 Location of Traffic Count Survey..................................................................5-2
Figure 5.1-2 Vehicle Composition by Survey Station .......................................................5-3
Figure 5.2-1 Loading Factor with Vehicle Classification ..................................................5-7
Figure 5.2-2 Trip Purpose with Vehicle Classification......................................................5-8
Figure 5.2-3 Estimated Average Travel Time....................................................................5-8
Figure 5.2-4 OD Trip Pattern..............................................................................................5-9
Figure 5.3-1 Travel Speed Survey Route and Section .....................................................5-10
Figure 6.1-1 Flow of Traffic Demand Forecast..................................................................6-1
Figure 6.2-1 Historical Trend of GDP Growth (2001 -2013)............................................6-3
Figure 6.2-2 GDP per Capita in US$ (2001-2013) ............................................................6-3
Figure 6.2-3 GDP Growth by Industry (2001-2013) .........................................................6-4
Figure 6.2-4 GDP Growth 2005-2013................................................................................6-4
Figure 6.2-5 Trend of Vehicle Registration in Cambodia..................................................6-6
Figure 6.2-6 Projection of Number of Vehicles .................................................................6-8
Figure 6.2-7 Increase of Vehicle Registration in Japan in the Past....................................6-8

xvii
Figure 6.2-8 Projection of Number of Vehicles for Three Scenarios of GDP Growth.....6-9
Figure 6.3-1 (1) Total Trip Production in 2011 (Total Vehicle)............................................6-13
Figure 6.3-1 (2) Total Trip Production in 2016 (Total Vehicle)............................................6-13
Figure 6.3-1 (3) Total Trip Production in 2021 (Total Vehicle)............................................6-14
Figure 6.3-1 (4) Total Trip Production in 2030 (Total Vehicle)............................................6-14
Figure 6.4-1 (1) Result of Traffic Assignment for Year 2011...............................................6-16
Figure 6.4-1 (2) Result of Traffic Assignment for Year 2016...............................................6-16
Figure 6.4-1 (3) Result of Traffic Assignment for Year 2021...............................................6-17
Figure 6.4-1 (4) Result of Traffic Assignment for Year 2030...............................................6-17
Figure 6.4-2 Verification Between Assignment Result and Actual Traffic Count .........6-20
Figure 6.4 3 Trips Which can Divert to Planned Battambang – Siem Reap Raod .........6-21
Figure 7.1-1 Water Level of Mekong at Prek Kdam .........................................................7-1
Figure 7.1-2 (1) Flood Prone Area (1) Prek Kdam to Kampong Chhnang.............................7-2
Figure 7.1-2 (2) Flood Prone Area (2) Pursat ..........................................................................7-3
Figure 7.1-2 (3) Flood Prone Area (3) Battambang to Sri Sophorn ........................................7-4
Figure 7.1-3 Flood Situation Diagram................................................................................7-6
Figure 7.2-1 CBR of Subgrade Soils ..................................................................................7-9
Figure 7.2-2 Histogram of CBR .......................................................................................7-10
Figure 9.2-1 Alternative Routes of Battambang Bypass....................................................9-2
Figure 9.4-1 Adjustment of Alignment ..............................................................................9-7
Figure 9.5-1 Alternatives of Route of Sri Sophorn Bypass..............................................9-10
Figure 10.1-1 Vertical Curve at Bridge Approach .............................................................10-3
Figure 10.1-2 Schematic Illustration of Minimum Height of Pavement Structure ...........10-3
Figure 10.1-3 Typical Cross Section of North Section ......................................................10-5
Figure 10.2-1 Straight Diagram of Roadside Land Use.....................................................10-6
Figure 10.2-2 Alternatives of Cross Section for Rural and Suburban Areas...................10-10
Figure 10.2-3 Perspective Drawing of NR 5 with R-2 Cross Section .............................10-12
Figure 10.2-4 Alternatives of Cross Section for Urbanized Area....................................10-13
Figure 10.2-5 New Alignment at IP1 ...............................................................................10-16
Figure 10.2-6 New Alignment at IP23 (KP351 + 797)....................................................10-16
Figure 10.2-7 New Alignment at IP27 (KP355 + 485)....................................................10-17
Figure 10.2-8 Intersection of NR 5 and Bypass ...............................................................10-18
Figure 10.2-9 Pavement Structure ....................................................................................10-19
Figure 10.2-10 Alternative Pavement Structure Adopted in Loan Appraisal....................10-19
Figure 10.2-11 At Grade Railway Crossing .......................................................................10-21
Figure 10.3-1 Cross Section of Battambang Bypass........................................................10-22
Figure 10.3-2 Alignment of Bypass Route.......................................................................10-23

xviii
Figure 10.3-3 Pavement Structure ....................................................................................10-24
Figure 10.4-1 Cross Section of Sri Sophorn Bypass ........................................................10-25
Figure 10.4-2 Alignment of Bypass Route.......................................................................10-26
Figure 10.4-3 Pavement Structure ....................................................................................10-27
Figure 10.6-1 Typical Cross Section of North Section of Existing NR 5........................10-30
Figure 10.6-2 Typical Cross Section of Battambang Bypass ..........................................10-31
Figure 10.6-3 Typical Cross Section of Sri Sophorn Bypass...........................................10-31
Figure 11.1-1 Design Truck Load T44...............................................................................11-3
Figure 11.1-2 Design Lane Loading L44 ...........................................................................11-3
Figure 11.1-3 Heavy Load Platform Loading ....................................................................11-4
Figure 11.2-1 Standard Bridge Typical Sections for 10m wide Carriageway...................11-7
Figure 11.2-2 Standard Bridge Abutments.........................................................................11-8
Figure 11.5-1 Proposed Rehabilitation at Br. 79 and Br. 82 – 4-Lane Road...................11-19
Figure 11.5-2 Elevations on Structure Alternatives for Br. 84 ........................................11-21
Figure 11.5-3 Proposed Rehabilitation at Br. 89 ..............................................................11-24
Figure 11.5-4 Elevation on Bridge Alternatives for Br. 91..............................................11-27
Figure 11.7-1 Typical Cross-Sections of Widened Bridge for Full 4-Lane ....................11-30
Figure 11.7-2 Deck Widening Connection Details for Full 4-Lane ................................11-31
Figure 11.7-3 Typical Cross-Sections of Substructure Widening for Full 4-Lane..........11-32
Figure 11.7-4 Abutment Widening Connection Detail for Full 4-Lane ..........................11-33
Figure 11.8-1 Typical Cross-Sections of Additional Bridge Deck for Full 4-Lane ........11-34
Figure 11.8-2 Typical AASHTO Girder Deck and Sections ...........................................11-36
Figure 11.8-3 AASHTO Girder Made Continuous..........................................................11-37
Figure 11.9-1 Elevations and Sections on Sangkae River Bridge ...................................11-40
Figure 11.9-2 Typical AASHTO Girder Deck and Pier Sections....................................11-42
Figure 12.1-1 Map of Sections............................................................................................12-1
Figure 12.2-1 Organization of Consultant ........................................................................12-10
Figure 13.1-1 Location of Quarry.......................................................................................13-2
Figure 13.1-2 Embankment Works (1)...............................................................................13-2
Figure 13.1-3 Embankment Works (2)...............................................................................13-2
Figure 13.1-4 Sub-Base Course Works ..............................................................................13-3
Figure 13.1-5 Base Course Works......................................................................................13-3
Figure 13.1-6 Asphalt Concrete Works..............................................................................13-3
Figure 13.1-7 Schematic View for Structural Excavation .................................................13-6
Figure 13.1-8 Flow of Traffic Management Plan...............................................................13-8
Figure 13.2-1 Organization of Employer............................................................................13-9
Figure 13.2-2 Relation of the Employer, Consultant and Contractor ..............................13-10

xix
Figure 13.3-1 Contamination Minefield in Battambang Province...................................13-13
Figure 14.1-1 Organizational Chart of Road Infrastructure Department, MPWT ............14-2
Figure 15.4-1 Procedure for Economic Analysis ...............................................................15-5
Figure 17.1-1 Organization of DEIA..................................................................................17-1
Figure 17.1-2 Organization of PMED ................................................................................17-2
Figure 17.2-1 IEIA/EIA Approval Procedure in Cambodia ..............................................17-6
Figure 17.3-1 Location of Protected Area ........................................................................17-10
Figure 17.3-2 Location Map of Tonle Sap Biosphere Reserve........................................17-11
Figure 17.3-3 Important Birds Area .................................................................................17-16
Figure 17.3-4 Tonle Sap Fishing Lots and Location of NR 5..........................................17-17
Figure 17.3-5 Land Use Classification of Tonle Sap Multiple Management Use Area .17-20
Figure 17.3-6 Present Land Use Plan of Battambang Province.......................................17-21
Figure 17.3-7 Present Land Use Plan of Battambang City ..............................................17-22
Figure 17.3-8 Present Land Use of Sri Sophorn City, Bantay Meanchey Province .......17-23
Figure 17.3-9 Connection Concept Around Sri Sophorn City, Banteay Meanchey
Province ......................................................................................................17-24
Figure 17.3-10 Concept of Spatial Plan of Sri Sophorn City, Bantay Meanchey
Province......................................................................................................17-24
Figure 17.3-11 Development Plan of Sri Sophorn City (2025), Bantay Meanchey
Province......................................................................................................17-25
Figure 17.3-12 Area Where Land Registration has been Completed in Bantay
Meanchey Province by the Land Title Project Assisted by
DANIDA-DiID-NZAid .............................................................................17-25
Figure 17.5-1 Location of Sampling of Water .................................................................17-40
Figure 17.5-2 Noise Level at KP 356 (Roadside) ............................................................17-41
Figure 17.5-3 Vibration Level at KP 356 .........................................................................17-41
Figure 17.5-4 Noise Level at KP 300 (Roadside) ............................................................17-42
Figure 17.5-5 Vibration Level at KP 300 (Roadside) ......................................................17-42
Figure 17.5-6 Noise Level at Future Intersection of Battambang Bypass and NR 57
(Roadside) ..................................................................................................17-42
Figure 17.5-7 Vibration Level at Future Intersection of Battambang Bypass & NR 57
(Roadside) ..................................................................................................17-43
Figure 18.6-1 Inter-Ministerial Resettlement Committee (IRC) and relevant
organizations ..............................................................................................18-33

xx
LIST OF PHOTOS
Photo 4.1-1 Edge Line and Paved Shoulder......................................................................4-5
Photo 4.1-2 Roadside Higher than Road Surface without Drainage ................................4-9
Photo 4.1-3 Damage of Br20...........................................................................................4-10
Photo 4.1-4 Battered Piles of Br26 ..................................................................................4-11
Photo 11.4-1 Existing Bridges on North Section (1/2) ...................................................11-10
Photo 11.4-2 Existing Bridges on North Section (2/2) ...................................................11-11
Photo 11.5-1 Existing Bridges Br. 79 and Br. 82............................................................11-17
Photo 11.5-2 Existing Bridge Br. 89 KP 351.5 (Mongkol Borei Bridge) ...................11-23
Photo 12.3-1 Utilities at Bridges......................................................................................12-12
Photo 13.1-1 Quarry in Sri Sophorn..................................................................................13-2
Photo 16.3-1 Examples of Road with Poor Quality..........................................................16-4
Photo 17.3-1 Sample of Roadside Vegetation along North Section of NR 5.................17-13
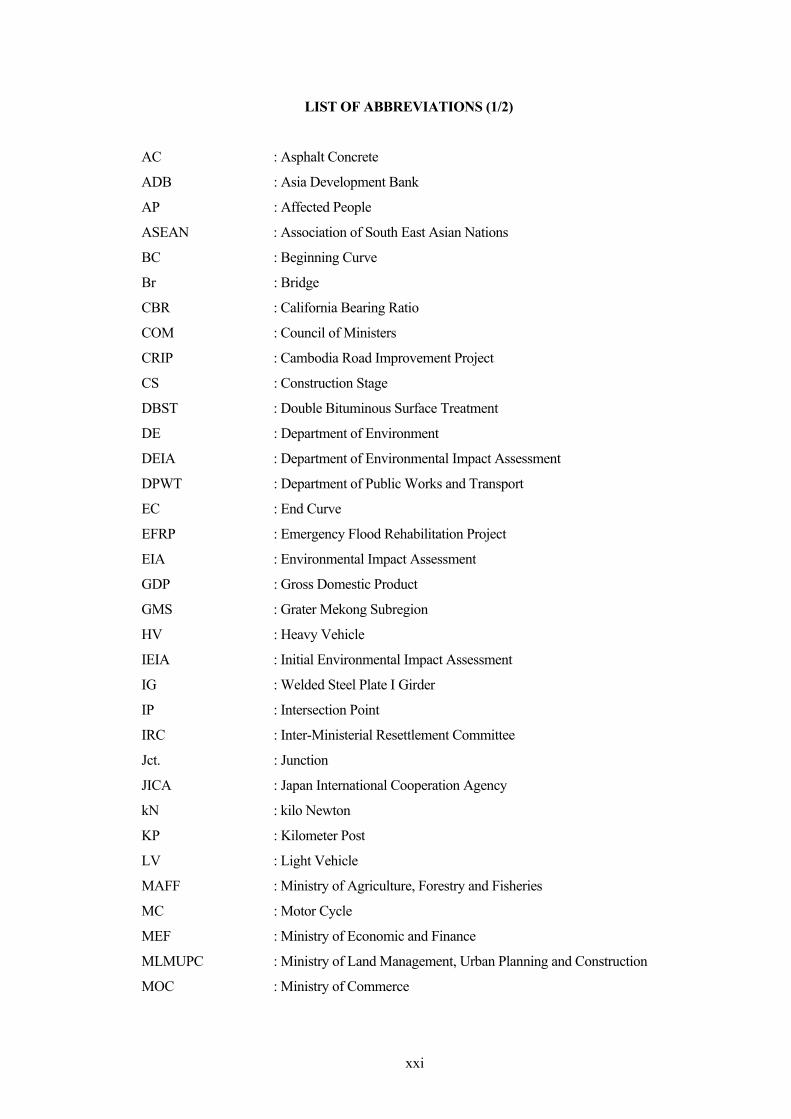
xxi
LIST OF ABBREVIATIONS (1/2)
AC : Asphalt Concrete
ADB : Asia Development Bank
AP : Affected People
ASEAN : Association of South East Asian Nations
BC : Beginning Curve
Br : Bridge
CBR : California Bearing Ratio
COM : Council of Ministers
CRIP : Cambodia Road Improvement Project
CS : Construction Stage
DBST : Double Bituminous Surface Treatment
DE : Department of Environment
DEIA : Department of Environmental Impact Assessment
DPWT : Department of Public Works and Transport
EC : End Curve
EFRP : Emergency Flood Rehabilitation Project
EIA : Environmental Impact Assessment
GDP : Gross Domestic Product
GMS : Grater Mekong Subregion
HV : Heavy Vehicle
IEIA : Initial Environmental Impact Assessment
IG : Welded Steel Plate I Girder
IP : Intersection Point
IRC : Inter-Ministerial Resettlement Committee
Jct. : Junction
JICA : Japan International Cooperation Agency
kN : kilo Newton
KP : Kilometer Post
LV : Light Vehicle
MAFF : Ministry of Agriculture, Forestry and Fisheries
MC : Motor Cycle
MEF : Ministry of Economic and Finance
MLMUPC : Ministry of Land Management, Urban Planning and Construction
MOC : Ministry of Commerce
xxii
LIST OF ABBREVIATIONS (2/2)
MOE : Ministry of Environment
M/P : Master Plan
MPWT : Ministry of Public Works and Transport
MRC : Mekong River Commission
N.A. : Not Applicable
NGO : None Governmental Organization
NR : National Road No.
OD : Origin Destination
ODA : Official Development Assistance
PAP(s) : Project Affected Person(s)
PC : Pre-stressed Concrete
PCDG : Pre-tensioned Precast Concrete Deck Girder
PCS : Pre-tensioned Precast Concrete Plank hollow Slab
PCU : Passenger Car Unit
PMO : Prime Minister’s Office
PRC : People’s Republic of China
PRRP : Primary Roads Restoration Project
PS : Planning Stage
RAMP : Road Assets Management Project
RAP : Resettlement Action Plan
RC : Reinforced Concrete
RCA : Reinforced Concrete Arched Rib
RCDG : Reinforced Concrete Deck Girder
RCS : Reinforced Concrete Flat Slab
RGC : Royal Government of Cambodia
ROW : Right of Way
SBST : Single Bituminous Surface Treatment
SHMs : Stakeholder Meetings
SPT : Standard Penetration Test
SS : Service Stage
STRADA : System for Traffic Demand Analysis
USDA : United States Department of Agriculture
VCR : Traffic Volume per Capacity Ratio
xxiii
LIST OF APPENDIXES
Appendix 7-1 Flood Survey
Appendix 7-2 Report of the Boring Survey of Sisophon Bypass
Appendix 10-1 National Road No. 5
Appendix 10-2 Battambang Bypass
Appendix 10-3 Sri Sophorn Bypass
Appendix 17-1 Calculation of Total CO2 Emission
Appendix 17-2 Method and Assumptions Adopted in Estimation of Noise and Gas
Emission
Appendix 18-1 IOL/SES Questionnaire Form
Appendix 18-2 Public Information Booklet (PIB) for the Resettlement Action Plan
Appendix 18-3 Terms of Reference for Training and Income Restoration
Appendix 18-4 Terms of Reference for External Monitoring Agency (EMA)
Resettlement Plan Implementation

Preparatory Survey for National Road No.5 Rehabilitation Project in the Kingdom of Cambodia
1-1
CHAPTER 1 INTRODUCTION
1.1 Background
In the Kingdom of Cambodia (“Cambodia”), the road transport accounts for around 65% of the passenger transport, for 70% of the freight transport, and plays the most important role in the domestic transport. However the most of the roads were severely deteriorated during the civil war in the 70’s to 80’s. Since the early 90’s Royal Government of Cambodia (RGC) has been exerting strenuous effort on rehabilitation of the road network with the assistance of Japan, the United States, Australia, Asian Development Bank (“ADB”) and Word Bank.
National Road No. 5 (NR 5) is the trunk road reaching Bangkok through the border between Cambodia and Thailand. It is also designated as Asian Highway A-1 or Southern Economic Corridor of GMS. The Survey Roads was damaged by the flood in 2000, and the section between Prek Kdam and Thlea ma’Am and the section between Battambang and Sri Sophorn have been temporarily repaired.
The repairs mentioned above mostly adopted DBST and the surface condition is being deteriorated, and the traffic flow has been hampered. Improvement of Southern Economic Corridor is in urgent need as known from the fact that it was designated as one of the prior projects in the ‘Study on the Road Network Development in the Kingdom of Cambodia’ (Master Plan Study), implemented by JICA in 2006.
Figure 1.1-1 Surface Condition of National Roads in Cambodia (As of 2010)

Preparatory Survey for National Road No.5 Rehabilitation Project in the Kingdom of Cambodia
1-2
Under such condition, JICA dispatched a survey team to Cambodia in November, 2010, held a series of discussions and reached agreement about a scope of the Preparatory Survey.
This Preparatory Survey (the Survey) is implemented, in view of the background as sited above, to obtain data and information required for appraisal of loan project of Japanese ODA, such as preliminary design, project cost, implementation plan, and natural and social impacts.
1.2 Objectives of the Survey
(1) The objective of the Project: The objectives of National Road No. 5 Rehabilitation Project (the Project) are as follows.
To ensure safe and smooth means of transport To promote economic activity in the area along the Project Road.
(2) Objective of the Survey: The objectives of the Survey are as follows.
To confirm the justification of the Project To obtain data and information required for appraisal of a loan project.
1.3 Survey Area
The Survey is to cover the section of National Road No. 5 between Prek Kdam and Sri Sophorn* (length: approximately 337 km). This road section traverses the provinces of; Kandal, Kampong Speu, Kampong Chhnang, Pursat, Battambang, and Bantey Meanchey,
* The name of the city of ‘Sisophon’ was officially changed to ‘Serei Saophoan’ after this Survey had started, and finally to ‘Sri Soporn’ during the loan processing. In preparing the Final Report, the Survey Team corrected from ‘Sisophon’ to ‘Sri Sophorn’ as much as possible. However, there may still remain the word ‘Sisophon’ and ‘Serei Saophoan’. The readers are kindly requested to interpret that ‘Sisphon’, ‘Serei Saophoan’ and ‘Sri Sophorn’ refer the same city.
1.4 Scope of Work
The original Scope of Work of the Survey as follows:
(1) Confirmation of the Scope of the Work
(2) Investigation and Evaluation of Existing Facilities
(3) Traffic Survey and Future Traffic Demand Forecast
(4) Aerial Photo Survey and Digital Mapping
(5) Geotechnical Investigation
Preparatory Survey for National Road No.5 Rehabilitation Project in the Kingdom of Cambodia
1-3
(6) Environmental and Social Considerations Study, including support to MPWT in preparing EIA report and RAP and holding stakeholders meetings
(7) Evaluation of Priority Section
(8) Comparative Study of Bypass Route (around the cities of Kampong Chhnang and Battambang)
(9) Topographic Survey
(10) Preliminary Design of Roads and Bridges
(11) Project Cost Estimation and Economic Evaluation
(12) Project Implementation Plan
In the 2nd Steering Committee held on 30 August 2011, study on Sri Sophorn Bypass was requested by the Cambodian side and JICA accepted this. Thus, the study on Sri Sophorn Bypass was added to the scope.
1.5 General Works Schedule
Due to the addition of Sri Sophorn Bypass to the scope, as sited above, the schedule of the Survey was revised. Table 1.5-1 shows the general schedule of the Survey after the revision:

1-4
Table 1.5-1 General Schedule of the Survey TASK
WORK ACTIVITY
1.Analysis in Japan I
Explanation and Discussion of Inception ReportConfirmation of Scope of the ProjectReview of Needs of the ProjectSite SurveyTransport Demand ForecastingNatural Condition SurveyAerial photo surveyGeotechnical Investigation (Digital Mapping)Analysis of the pavement conditionTraffic SurveyEnvironmental and Social Consideration SurveyStudy of the Project RoadPreparation, Explanation and Discussion of Interim Report
Justification of the ProjectThe Environmental and Social Consideration Advisory Committee Planning of the Second Study in Cambodia
Explanation of the Second Survey in CambodiaTopographical Survey (Bypass Section)Study of Road AlignmentsStudy of Bypass PlanStudy of Bridge Location and StructureEnvironmental and Social Consideration SurveyPreparation and Explanation of Progress ReportPreliminary Design of Road and Bridge Preparation of Road Safety PlanPreparation of Implementation System, Operation and MaintenanceReview of Execution SchemeCost Estimation and Object Loan Project CostMonitoring Plan of Project EffectProject Implementation PlanPreparation of Preliminary Draft Report
Study of Serei Saophoane BypassPlanning of the Third Study in Cambodia
Explanation of the Second Survey in CambodiaStudy of Bypass PlanTopographical Survey (Bypass Section)Traffic SurveyTransport Demand ForecastingGeotechnical InvestigationEnvironmental and Social Consideration SurveyPreliminary Design of Road and Bridge Cost Estimation and Object Loan Project CostMonitoring Plan of Project EffectProject Implementation Plan
Preparation and Submission Draft Final ReportThe Second Environmental and Social Consideration Advisory Committee
Explanation and Discussion of Draft Final Report
Discussion and Preparation of Final Report
Remark : Cambodia Japan Discussion and Exposition of Report
May June July FebruaryDecember
2012
7.Analysis in Japan IV
4.Study in Cambodia II
8.Field Survey IV
October November
2.Study in Cambodia I
5.Analysis in Japan III
3.Analysis in Japan II
February
9.Analysis in Japan V
6.Field Survey III (Serei Saophoane Bypass)
April MaySeptember JanuaryAugust MarchMarch April June July August September October
2012

1-5
1.6 Organization of the Survey
The organization of the Survey is shown in Figure 1.6-1.
Figure 1.6-1 Organization of Survey
Members of the Steering Committee are the representatives of relevant organization of Cambodia, JICA and the Survey Team. Table 1.6-1 shows the member of the Steering Committee.
Table 1.6-1 List of Steering Committee Member Organization Steering Committee Member Remarks
Secretary of State (HE Tauch Chankosal)
Chair Person
Director General of Public Works (HE Kem Borei)
Director of International Cooperation (Mr. Chhim Phalla)
Ministry of Public Works &
Transport (MPWT)
Deputy Director of Intnt’l Coop. (Mr. Kong Sophal)
Ministry of Economy & Finance (MEF)
Representative of Department of Resettlement Department
Ministry of Environment (MOE)
Representative of
Banteay Meahchey Province Director of DPWT (or his representative)
Battambang Province Ditto
Pursat Province Ditto 1st S/C only
Kampong Chhnang Province Ditto Ditto
Kandal Province Ditto Ditto
Sr. Representative, Cambodia Office (Mr. HIRATA Hitoshi)
JICA
Representative, Cambodia Office (Mr. MORIHATA Shigo: Up to May 2011) (Mr. EGAMI Masahiko: From June 2011)
Steering Committee
Ministry of Public Works & Transport
(MPWT)
JICA Survey Team (Katahira & Engineers Int’l)
Japan International Cooperation Agency
(JICA)
MPWT Counterpart

1-6
At the headquarter of JICA in Tokyo, Mr. KIMURA Hiroshi (up to May 2011) and Mr MIYAKE Shigeaki (from June 2011), Directors of Transport & ICT Division 2, Economic Infrastructure Department, Mr. OSHIRO Nodoka (up to June 2011) and Mr. FUKUI Takanori (from July 2011), Deputy Directors of Transport & ICT Division 2, Economic Infrastructure Department were in charge of administration of the Survey.
The members of JICA Survey Team are as listed in Table 1.6-2.
Table 1.6-2 Team Member List No. Name Job Title Firm
1 SAKURAI Tatsuyuki Team Leader/Road Traffic Plan Katahira & Engineers International
2 MURAKAMI Keiichi Deputy Team Leader/Road Design Katahira & Engineers International
3 ANTHONY GOURLEY Road Structure Plan Katahira & Engineers International
4 YASHIRO Shuichi Traffic Survey/Demand Forecast / Economic Analysis Katahira & Engineers International
5 TAKEUCHI Ryouji Natural Condition Survey / Environnement Consideration Katahira & Engineers International
6 SAITO Kumi Social Consideration Katahira & Engineers International(Seconded from Nippon Koei)
7 YAMAUCHI Masafumi Construction Plan/Cost Estimation Katahira & Engineers International
8 TOCHINAKA Masateru Project Coordination/Road Designing Assistant Katahira & Engineers International

Preparatory Survey for National Road No.5 Rehabilitation Project in the Kingdom of Cambodia
2-1
CHAPTER 2 PROFILE OF THE SURVEY AREA
2.1 Physical Profile
(1) Geography
NR 5 starts from Phnom Penh and traverses the southwest side of Tonle Sap River and Tonle Sap Lake up to Battambang. Between Battambang and Sri Sophorn, it passes through the upstream area of Tonle Sap Lake and finally reaches the border with Thailand. The distance between the city of Sri Sophorn (the north end of the Survey Section) and Poipet (the border point with Thailand) is approximately 50km and distance between Poipet and Bangkok in Thailand is approximately 250km. Thus, NR 5 becomes the main transport route between Phnom Penh and Bankgkok.
Figure 2.1-1 Location of NR 5
(2) Topography
The ground height along the NR is, in general, around 10m above sea level or less except at some sections passing low hills as shown in Figure 2.1-2 [Also see Figures 7.1-2 (1) – (3)].

Preparatory Survey for National Road No.5 Rehabilitation Project in the Kingdom of Cambodia
2-2
Thus, the terrain along NR 5 is generally flat.
Figure 2.1-2 Topography of Survey Area
(3) Meteorology
Climate of Cambodia is influenced by the Asian Monsoon and the climate can be described as ‘hot and humid’ in general. Figure 2.1-2 shows annual rainfall in Cambodia. It shows that the annual rainfall of the Survey Area is in the range of 1,200 – 1,600mm/yr.
Figure 2.1-3 Annual Rainfall
(Quoted from the final report of ‘the Study on the Road Network Development in the Kingdom of Cambodia, October 2006, JICA)
Figure 2.1-3 shows the monthly average rainfall and temperature measured at Pochetong, Phnom Penh. It shows that the rainy season is from May to September and dry season is from November to April. It also shows that the monthly average temperature ranges between 25 and 34 degree Celsius.

Preparatory Survey for National Road No.5 Rehabilitation Project in the Kingdom of Cambodia
2-3
Figure 2.1-4 Average Monthly Rainfall and Temperature (Quoted from the final report of ‘the Study on the Road Network Development in the Kingdom of Cambodia, October 2006, JICA)
Table 2.1-1 shows record of monthly rainfall in Battambang Province in years 2010 and 2011, as an example. June to October are rainy months and December to February are dry months.
Table 2.1-1 Monthly Rainfall in Batttambang Province (mm)
Month
Year Jan Feb Mar Apr May Jun Jul Aug Sep Oct Nov Dec Total
2010 8.3 12.0 25.2 69.9 77.3 121.2 241.9 216.6 193.3 325.2 40.5 8.3 1339.7
2011 0.0 50.8 35.1 152.7 151.5 108.0 186.8 253.2 -
Source: Department of Water Resources and Metrology, BB Province
The condition water of the area is also greatly influenced by the flood of Mekong River and Tonle Sap. The flood of Mekong River and Tonle Sap is discussed in Chapter 6.
Table 2.1-2 shows the temperature of Battambnag Province in years 2010 and 2011. March to May are hot months and October to December are cool months.
Table 2.1-2 Maximum and Minimum Temperaturein Battambang Province in 2010 and 2011 (o C)
Year Jan Feb Mar Apr May Jun Jul Aug Sep Oct Nov Dec
2010 33.2 35.3 36.1 37.1 36.6 34.6 33.4 32.3 32.1 30.5 30.6 31.1Max
2011 30.8 33.6 32.5 33.8 34.0 33.4 33.5
2010 22.4 24.9 25.2 26.0 27.2 26.3 25.6 25.4 25.5 24.5 23.7 21.7Min
2011 20.1 23.2 23.3 25.3 25.8 26.0 25.6
Source: Department of Water Resources and Meteorology, BB Province Station: Veal Bek Chan

Preparatory Survey for National Road No.5 Rehabilitation Project in the Kingdom of Cambodia
2-4
2.2 Socio-Economic Profile
Table 2.2-1 summarizes the socio-economic data of the Survey Area, focusing the 4 provinces substantially influenced by the Project.
Table 2.2-1 Socio-Economic Data of Survey Area (4 provinces only)
Kampong Chhnang Pursat Battambang Banteay
MeancheyWhole
Country
Proportion to Whole Country (%)
Population 472,000 397,000 1,025,000 678,000 13,389,000 28.3
Land Area (ha) 552,100 1,269,200 1,170,200 6,67,900 18,103,500 20.2 Rice Field Area (ha) 127,700 95,300 234,100 210,800 2,566,800 17.8
Proportion of Rice Field Area (%) 23.1 7.5 20.0 31.6 14.2 N.A.
Rice Production (ton) 311,500 239,700 567,200 447,200 6,727,100 23.3
Source: Statistical Yearbook of Cambodia 2008
It is noted that the percentage of total population of the 4 provinces against that of the whole country is approximately 28% while the percentage of land area is only 20%. This means that the population density of the Survey area is higher than the national average, implying that the Survey Area is the developed area in Cambodia.
As can be seen in the above table, one of the most important industries in the Survey Area is rice production. Figure 2.2-1 shows the status of rice production of the provinces. In this figure, the provinces which supply rice other provinces are indicated in blue and light blue. In Figure 2.2-1, it is seen that the provinces in the Survey Area are major areas of rice production. This leads to traffic demand for transportation of rice via NR 5.
Figure 2.2-1 Rice Production by Province (Quoted from the final report of ‘the Study on the Road Network Development in the Kingdom of Cambodia, October 2006, JICA)

Preparatory Survey for National Road No.5 Rehabilitation Project in the Kingdom of Cambodia
3-1
CHAPTER 3 NATIONAL ROAD NETWORK OF CAMBODIA AND ROLE OF NATIONAL ROAD NO. 5
3.1 National Road Network of Cambodia
3.1.1 National Road Network of Cambodia
National Road Network of Cambodia consists of arterial national roads with single digit numbers (1 to 8) with a total length of 2,096km and minor arterial roads with double digit numbers with a total length of 4,848km (as of end of year 2008). Figure 3.1-1 show the map of National Road Network of Cambodia. As can be seen in the figure, most of the arterial national roads of Cambodia is extend in radial directions centered at Phnom Penh and reach to the border points with neighboring countries of Vietnam and Thailand. They are numbered, in principle, in crock-wise direction starting from No. 1.
Source: MPWT
Figure 3.1-1 National Road Network of Cambodia

Preparatory Survey for National Road No.5 Rehabilitation Project in the Kingdom of Cambodia
3-2
Table 3.1-1 shows the lengths and routes of arterial (single-digit) national roads.
Table 3.1-1 Length and route of Arterial National Road (As of 2008) Road No. Length (km) Route
1 166.9 Phnom Penh – Bavet (Vietnam border)
2 120.7 Ta Kmau – Takeo – Phnom Den (Vietnam border)
3 201.7 Phnom Penh – Kampot – Veal Rinh
4 214.2 Chaom Chau – Kampong Speu – Krong Prea Sihanouk
5 407.5 Phnom Penh – Battambang – Sri Sophorn – Poipet (Thailand border)
6 416.4 Phnom Penh – Kampong Thom – Siem Reap – Sri Sophorn
7 460.8 Skun – Kamopong Cham – Kratie – Steung Treng – Veum Kham (Vietnam border)
8 107.3 Prek Kdam – Pea Reang – Prey Veng – Kamchay Mear – Ponhhea Krek
3.1.2 Surface Condition of National Road Network
Road network of Cambodia had deteriorated during the period of the civil war which ended in 1992 with signing of peace accord. Many bridges were collapsed and pavements were severely damaged. In 1990s, there were many impassable sections even on arterial national roads. Thus, road rehabilitation in 1990s and early 2000s mainly focused on urgent rehabilitation of arterial roads.
By late 2000s, most of urgent rehabilitation of the arterial roads had been completed. Most arterial national roads were passable and road surfaces were paved with mostly DBST. Further, some sections of arterial roads were paved with asphalt concrete as shown in Figure 1.1-1. By late 2000s, the focus for improving pavement condition had shifted from arterial national roads (single-digit roads) to minor arterial roads (double-digit roads).
However, the pavements of most sections of arterial roads are DBST which does not have sufficient bearing capacity to cater for heavy vehicles. The volume of heavy traffic is rapidly increasing on many roads due to rapid economic growth of Cambodia. This increase in heavy traffic is accelerating deterioration of DBST pavements and imposing heavy financial burden of maintenance to the Government of Cambodia.
Another problem of the existing national road network is insufficient road width or number of lanes. Road widths of most section are 2 lanes. Widths of some sections are even not sufficient for 2 lanes. This situation is resulting in deterioration in traffic safety condition and possible traffic congestions in the near future when traffic volume will increase.
Preparatory Survey for National Road No.5 Rehabilitation Project in the Kingdom of Cambodia
3-3
3.1.3 Development Plan
National Strategic Development Plan (NSDP) 2006 – 2010 adopted ‘Rectangular Strategy’ as the very basic strategy/policy for national development. ‘Further Rehabilitation of Physical Infrastructure’ was designated as one of the four components of ‘Rectangular Strategy’. The NSDP was updated in 2008 and issued as ‘NSDP Update 2009 – 2013’, which is currently valid. NSDP Update 2009 – 2013 prescribes ‘Further Rehabilitation and Construction of Transport Infrastructure’ as one of the four sub-components of ‘Further Rehabilitation of Physical Infrastructure’. Then, NSDP Update 2009 – 2013 states ‘Continuing to seek funding for ……(omitted)… the widening of NR 1, NR 4, NR 5 and NR 6’.
Road network development in Cambodia is planned and implemented basically based on the master plan proposed by ‘the Study on the Road Network Development in the Kingdom of Cambodia’ conducted in 2006 by JICA (M/P Study). In this M/P Study, NR 5 was proposed to be improved to support ‘Multi Growth Pole Development’ and ‘Development of International Corridor’. However, M/P Study proposed widening of NR 5 to 4 lanes between Phnom Penh and Kampong Chhnang and remaining sections were proposed to be 2 lanes.
The M/P Study was updated in 2009 in view of rapid economic growth and increase in vehicle registration in Cambodia, as well as several road improvement project implemented up to date. This update study reiterated the importance of NR 5 but no major change in widening to 4 lanes was proposed.

Preparatory Survey for National Road No.5 Rehabilitation Project in the Kingdom of Cambodia
3-4
3.2 Role of National Road No. 5
NR 5 is an arterial national road connecting Phnom Penh and Poipet, the border point with Thailand. It traverses provinces of Banteay Meanchey and Battambang whose populations are 3rd and 4th largest in the country. Thus, NR 5 accommodates the traffic needed for the day-to-day activities of the citizens, including access to the public services such as hospital and school, along the highway.
NR 5 also accommodates the traffic transporting goods and passengers between the major cities along the highway, such as Sri Sophorn, Battambang, Pursat, Kampong Chhinang and Phnom Penh. Further it is connected, via Phnom Penh, to National Road No. 1 (NR 1) which reaches to Ho Chi Min City in Vietnam and National Road No. 3 (NR 3) and National Road No. 4 (NR 4) which reach to Sihanoukville, the largest international seaport of Cambodia.
NR 5 is an important highway not only for domestic transport in Cambodia but also for international transport in ASEAN and the Greater Mekong Subregion (GMS). NR 5, together with National Road No. 1 (NR 1), forms a route connecting Bangkok, Phnom Penh and Ho Chi Minh City. Thus, NR 5 has been designated as ASEAN Highway No. 1 and Asian Highway No. 1. With rapid growth in the regional cooperation in GMS in the recent years, the importance of NR 5 is also rapidly growing.
Source: ASEAN Economic Community
Figure 3.2-1 ASEAN Highway

Preparatory Survey for National Road No.5 Rehabilitation Project in the Kingdom of Cambodia
3-5
Source: Overview on Transport Infrastructure Sectors in the Kingdom of Cambodia, Infrastructure and Regional
Integration Technical Working Group, 2010
Figure 3.2-2 Economic Corridors of GMS
Importance of NR 5 as an international transport corridor has been recently increasing due to the development of regional cooperation in GMS, as seen in the signing and ratification of Cross-Border Transport Agreement (CBTA) in 2008:
Cross-Border Transport Agreement Cross-Border Transport Agreement (CBTA) is a compact and comprehensive multilateral instrument that covers all the relevant aspects of cross-border facilitation including the followings: Facilitation of border crossing formalities (single-window and single-stop custom inspection,
coordinating of hours of operation, and exchange of advanced information and clearance) Facilitate cross-border movement of people (multi-entry visa, recognition of driver license) Facilitate cross-border movement of goods (regional transit regime) Exchange of commercial traffic rights Requirements for admittance of road vehicles Institutional arrangements Setting-up custom transits (guaranteeing system) Coordination on bridge design standards, road signs and signals
The CBTA is expected to accelerate the regional cooperation in GMS and further increase the importance of NR 5.

Preparatory Survey for National Road No.5 Rehabilitation Project in the Kingdom of Cambodia
4-1
CHAPTER 4 PRESENT CONDITION OF NATIONAL ROAD NO. 5
4.1 Physical Condition of National Road No. 5
4.1.1 Overall Conditions
Figure 4.1-1 (a) through (c) show the overall physical conditions of NR 5 in the form of ‘straight line diagram’. This diagram has been prepared based on the information obtained through the site survey conducted from late February to late March 2011.
MPWT is currently installing kilometer posts (KP) along NR 5. The straight line diagram shown in Figure 4.1-1 basically uses this KP. In this diagram, the whole Survey Section of NR 5 is divided into 3 sections; South Section (KP 32 – KP 171), Middle Section (KP 171 – KP 301) and North Section (KP 301 – KP 361).
The criteria for classification of the conditions shown in the diagram are as described below:
Table 4.1-1 Description of Classification for Straight Line Diagram Item Classification Description
Inundation Overflow Near by None
Overflow on the road surface Water level rose to near but lower than road surface No report of inundation
Drainage Bad Poor Fine
Water logs remain on the road after rain Water logs are seen at roadside after rain No remaining water on the road or roadside after rain
Pavement Bad Poor Fair
Function of pavement substantially lost due to occurrence of several types of defects Function of pavement lost to light degree due to occurrence of a few types of defects No major defects observed
Project Affected
Persons (PAPs)
Many Few None
Buildings densely located along the roadside Buildings sparsely located along the roadside No building nearby the road
Resettlement Many Few None
Roadside heavily populated Houses sparsely located close to the road No houses nearby the road
The following subsections describe the conditions of each item.

Preparatory Survey for National Road No.5 Rehabilitation Project in the Kingdom of Cambodia
4-2
Figu
re 4
.1-1
(a)
Str
aigh
t Lin
e D
iagr
am :
Sou
th S
ectio
n (K
P 32
~KP
171)

Preparatory Survey for National Road No.5 Rehabilitation Project in the Kingdom of Cambodia
4-3
Figu
re 4
.1-1
(b)
Str
aigh
t Lin
e D
iagr
am :
Mid
dle
Sect
ion
(KP
171~
KP
301)

Preparatory Survey for National Road No.5 Rehabilitation Project in the Kingdom of Cambodia
4-4
Figu
re 4
.1-1
(c)
Str
aigh
t Lin
e D
iagr
am :
Nor
th S
ectio
n (K
P 30
1~K
P 36
1)
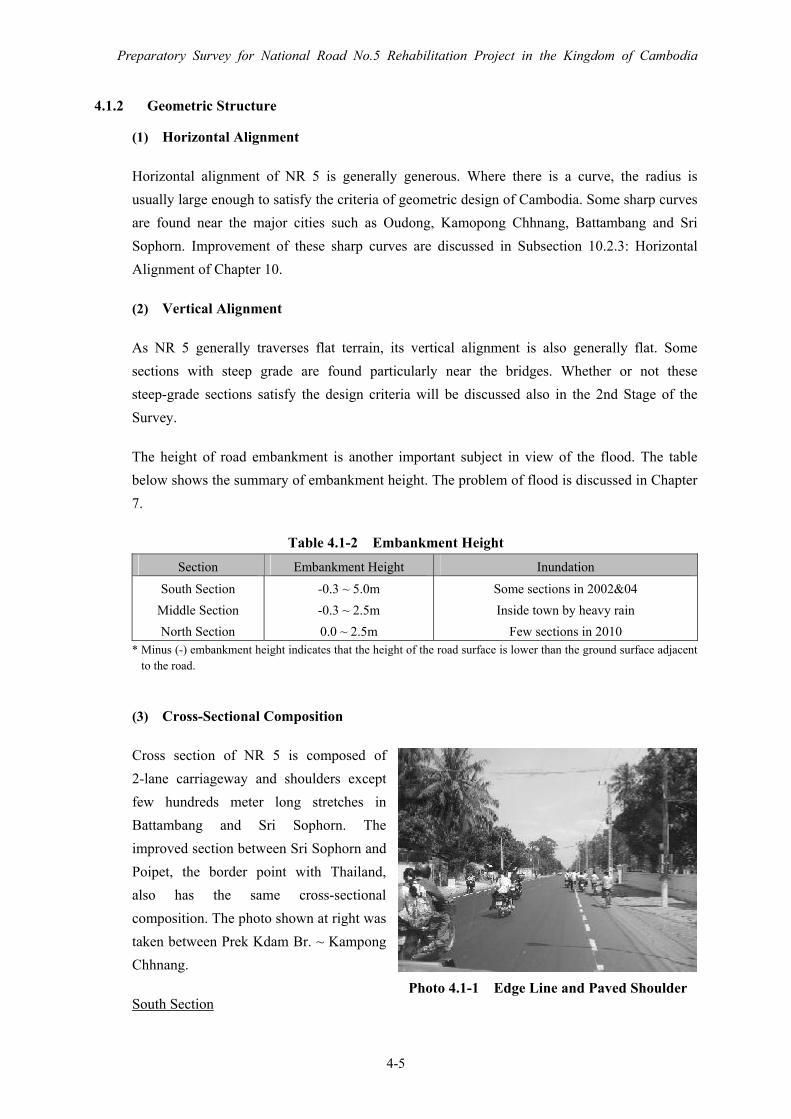
Preparatory Survey for National Road No.5 Rehabilitation Project in the Kingdom of Cambodia
4-5
4.1.2 Geometric Structure
(1) Horizontal Alignment
Horizontal alignment of NR 5 is generally generous. Where there is a curve, the radius is usually large enough to satisfy the criteria of geometric design of Cambodia. Some sharp curves are found near the major cities such as Oudong, Kamopong Chhnang, Battambang and Sri Sophorn. Improvement of these sharp curves are discussed in Subsection 10.2.3: Horizontal Alignment of Chapter 10.
(2) Vertical Alignment
As NR 5 generally traverses flat terrain, its vertical alignment is also generally flat. Some sections with steep grade are found particularly near the bridges. Whether or not these steep-grade sections satisfy the design criteria will be discussed also in the 2nd Stage of the Survey.
The height of road embankment is another important subject in view of the flood. The table below shows the summary of embankment height. The problem of flood is discussed in Chapter 7.
Table 4.1-2 Embankment Height Section Embankment Height Inundation
South Section Middle Section North Section
-0.3 ~ 5.0m -0.3 ~ 2.5m 0.0 ~ 2.5m
Some sections in 2002&04 Inside town by heavy rain
Few sections in 2010 * Minus (-) embankment height indicates that the height of the road surface is lower than the ground surface adjacent
to the road.
(3) Cross-Sectional Composition
Cross section of NR 5 is composed of 2-lane carriageway and shoulders except few hundreds meter long stretches in Battambang and Sri Sophorn. The improved section between Sri Sophorn and Poipet, the border point with Thailand, also has the same cross-sectional composition. The photo shown at right was taken between Prek Kdam Br. ~ Kampong Chhnang.
South Section Photo 4.1-1 Edge Line and Paved Shoulder

Preparatory Survey for National Road No.5 Rehabilitation Project in the Kingdom of Cambodia
4-6
There are two types of typical cross section on the South Section. The average width of pavement is 9.8m between Prek Kdam Bridge and Kampong Chhnang, and is 7.7m between Kampong Chhnang and Thlea Ma’Am. The wider section has enough space to separate motorcycles and carts from 4-wheel vehicles, while the narrow section does not have any separate space for motorcycles. The typical cross sections of the South Section are shown in Figure 4.1-2.
Prek Kdam Br ~ Kampong Chhnang
Kampong Chhnang ~ Thlea ma’Am
Figure 4.1-2 Typical Cross Section of South Section
Middle Section
The average width of pavement on middle section is the widest in NR 5 except for few hundreds meter portions of 4-lane near Battembang city. The shoulder is paved by SBST and it provides enough space for motorcycles and carts. The additional shoulders with gravel have been constructed for the protection of edge damage. The typical cross section of the Middle Section is shown in Figure 4.1-3.
Thlea ma’Am ~ Battambang Figure 4.1-3 Typical Cross Section of Middle Section

Preparatory Survey for National Road No.5 Rehabilitation Project in the Kingdom of Cambodia
4-7
North Section
The average width of pavement on north section is 7.8m. The cross-sectional composition is similar with the section between Kampong Chhnang and Thlea Ma’Am. The vehicles overtaking slow traffic use the opposite lane due to insufficient space in the traveling lane. The typical cross section of north section is shown in Figure 4.1-4.
Battambang ~ Sri Sophorn Figure 4.1-4 Typical Cross Section of North Section
Sri Sophorn-Poipet Section
The cross section beyond Sri Sophorn is similar with that of the Middle Section, but the pavement type is asphalt concrete. This section is directly connecting to the border with Thailand and has recently been improved. Therefore, this cross section composition can be a good reference case for this project. The general cross section of the section between Sri Sophorn and Poipet is shown in Figure 4.1-5.
Figure 4.1-5 General Cross Section of Sri Sophorn-Poipet Section
(4) Summary of Problems
The major problems of geometric structure known at this stage are the following two:
The narrow pavement width The insufficient height of embankment

Preparatory Survey for National Road No.5 Rehabilitation Project in the Kingdom of Cambodia
4-8
4.1.3 Pavement Condition
The condition of existing pavement was closely observed at the points of failure and every 1km interval where fixed kilometer post exists.
The maintenance of the pavement has been carried out well in general. Completed repair works such as patching, overlay and seal coat are observed. The maintenance works under RAMP also have been carried out in the section from KP 3.9 to KP 171 of NR 5. Several kinds of failure have been thoroughly repaired in RAMP.
The typical failures of the pavement observed on NR 5 are as described below:
Crack: There are two types of crack; longitudinal line crack on the shoulder and mesh crack on the depressed area. The longitudinal line cracks are supposed to be caused by the settlement of embanked ground
Pothole: Most of the large potholes have been repaired, but there are some small holes not reaching base course layer without being addressed. These small halls usually further develop during rainy season.
Depression: Usually observed in the right wheel tracks of vehicles due to insufficient strength of the pavement and/or penetration of water into the pavement structure.
Flush (Bleeding): Seeping out of bituminous material to the pavement surface. Cased by excess use of bitumen.
Rutting: Observed on the wheel tracks of vehicles; caused by insufficient strength of the pavement compared to the traffic load.
Aggregate loss: Breakaway of surface aggregate is observed on the old surface due to the poor adhesion of deteriorated bitumen or insufficient binder.
Edge Damage: Wear of shoulder caused by action of water and/or vehicle entering to the road.
Shoving: Usually it is observed near the edge of the pavement due to the ingress of water reducing the bearing capacity of the pavement and/or subgrade.
The locations where these defects are observed are summarized below:
South Section (KP 32~KP 171)
Failure Location Crack KP 32 ~ KP 54, KP 136 ~ KP 167 Depression KP 32 ~ KP 77, KP 102 ~ KP 170 Aggregate Loss KP 93 ~ KP 98 Edge Damage KP 92 ~ KP 131

Preparatory Survey for National Road No.5 Rehabilitation Project in the Kingdom of Cambodia
4-9
Middle Section (KP 171~KP 301)
Failure Location Crack KP 232 ~ KP 248, KP 259 ~ KP 284 Depression KP 217 ~ KP 243, KP 262 ~ KP 266 Rutting KP 187 ~ KP 268 Edge Damage KP 216 ~ KP 220
[Note] The surface condition is comparatively fair in the Middle Section and the original surface course constructed under PRRP is still being used without major repair in general. It seems that the bearing capacity of the pavement is stronger than the other two sections.
North Section
Failure Location Crack KP 311 ~ KP 322, KP 338 ~ KP 357 Depression KP 302 ~ KP 306, KP 311 ~ KP 324,
KP 341 ~ KP 348, KP 353 ~ KP 360 Rutting KP 325 ~ KP 335, KP 347 ~ KP 355 Aggregate Loss KP 350 ~ KP 351, KP 360 ~ KP 361
[Note] Percentage of commercial and residential usage of roadside land along this section is higher than the other two sections. The elevation of road surface is sometimes lower than the roadside land. This makes weakening of the pavement due to the penetration of rain water into the roadbed.
Photo 4.1-2 Roadside Higher than Road Surface without Drainage
4.1.4 Bridge Condition
The number of bridges located on the Survey Section is 87 in total. Some of the bridges are constructed by the fund of Australia in the middle of 1990s and their structures with steel plate girders are still stable. Most of the bridges are constructed under PRRP and EFRP after the extensive flood in 2000. The superstructure of those bridges is prestressed concrete (PC) hollow slab and its condition is quite good. The other bridges are also still in fair condition for supporting the present traffic load. Only one bridge located in Kampong Chhnang City (bridge code Br 20 at KP 88) is seriously damaged. The bottom of reinforced concrete (RC) slab is

Preparatory Survey for National Road No.5 Rehabilitation Project in the Kingdom of Cambodia
4-10
exfoliated and rusted steel bars are exposed. Thus this bridge needs to be replaced urgently to provide the safe road service.
Even though the present condition is still fair, the reconstruction of old bridges and culverts will be required when the road will be widened. Also safety of old bridges against the increased traffic load is not certain. Therefore the basic policy of bridge works should be replacement of old bridges. The old bridges to be replaced are listed up in Table 4.1-3.
Table 4.1-3 Bridges Considered to be Replaced
KP Code Length CarriagewayWidth Bridge Type
South Section 38.5 Br 5 9.15 m 10.75 m 2 span Rigid Frame RC Girder 40.1 Br 6 24.0 m 8.1 m 2 span Simple Steel Plate Girder 46.8 Br 11 16.7 m 10.4 m 4 span Rigid Frame RC Slab 88.3 Br 20 6.0 m 13.6 m 1 span RC Slab
106.3 Br 22 91.0 m 7.3 m 4 span Simple Steel Plate Girder 116.6 Br 26 71.0 m 7.25m 3 span Simple Steel Plate Girder
Middle Section 182.0 Br 42 19.4 m 9.7 m 4 span Simple RC Girder 186.0 Br 47 120.0 m 7.3 m 6 span Simple PC Girder 187.5 Br 48 38.9 m 8.8 m 2 span Simple RC Girder 245.9 Br 66 9.7 m 9.3 m 2 span Simple RC Girder
North Section 341.1 Br 84 4.9 m 10.2 m 2 span Rigid Frame RC Arch 357.2 Br 91 14.4 m 8.6 m 3 span Simple RC Girder
Photo 4.1-3 Damage of Br20

Preparatory Survey for National Road No.5 Rehabilitation Project in the Kingdom of Cambodia
4-11
Regarding two bridges in the South Section (bridge code Br 22 at KP 106.3 and Br 26 at KP 116.6) the pier is constructed on pile-bent type, and some of the foundation piles are battered piles. This implies that the construction of additional piles for expansion bridge seat is difficult. Thus, replacement is needed if these bridges are to be widened.
4.1.5 Roadside Land Use
The cities, towns and villages are developed along the road. Many factories, shops, stalls, vendors, benches and houses are observed just beside the road. The basic form of land use outside of urbanized area is agriculture, especially rice paddy. There are many rice mill factories and warehouses along the road functioning as the base station of transportations for rice.
Negligence of Drainage
The roadside of existing route has been developed rapidly such as new factories, commercial activities and residential buildings. Land fill for such development after pay very little attention to the necessity of drain channel at road shoulder. Some houses and shops bury the existing drainage channel of their front for their convenience of access. As a result, rain water stays on the road surface or penetrates through the road bed and subgrade soil causing damage to the pavement.
Occupancy of ROW by Roadside Shops and Utilities
In town areas, private shops occupy the existing road shoulder and sidewalk to display their merchandise, and their buildings are placed within Right of Way. On the other land, most of the houses are built outside of Right of Way and some houses are moving to their backyard by their intention. It may be the effect of the notice board installed by ADB project to announcing the width of Right of Way of 30 m from the center of existing road. The boards are installed on roadside at many locations on the whole stretch of NR 5.
Photo 4.1-4 Battered Piles of Br 26

Preparatory Survey for National Road No.5 Rehabilitation Project in the Kingdom of Cambodia
4-12
Figure 4.1-6 Notice Board of Right of Way (Unofficial Translation)
Although, it is instructed on the board that electric poles should be installed 28 m away from the road center, actual installation work of new electric poles is ongoing approximately 17 m away from the road center. This will bring confusion among the residents. It is strongly recommend that MPWT shall issue the warning to SKL Group, who has been installing electric poles within the road reserves.
4.2 Planned, Ongoing and Past Project for Rehabilitation/Improvement of NR 5
This subsection summarized the past projects which contributed to the current condition of NR 5, as well as the on-going and planned project which are expected to improve the current condition of NR 5.
(a) ADB: Primary Roads Restoration Project (PRRP)
The whole stretch of NR 5 had been originally scheduled to be improved in the ADB funded “Primary Roads Restoration Project (PRRP). Due to the severe flood occurred on 2000, some parts of NR 5 covered by the contract packages of PRRP were damaged, and extensive rebuilding and improvements became necessary (e.g., repair of eroded embankments, raising of embankment heights, construction of additional culverts, bridge rehabilitation etc.). As a result, 130 km of the Middle Section was improved under contract packages of PRRP.
Announcement about National Corridor Decree about the corridor management along national roads and rail of the Kingdom of Cambodia No.
197 issued on the 23rd of November 2009 article No. 8 states that the corridor is limited for
development process on the infrastructure as below:
National Road Level 1: Represent as 1 digit number, the corridor has 30 meter width from the center of
the road axe so all the constructions must follow to this decree by keep the space at lease 30 meter
from the center of road axe. Moreover, for the public service equipment such as Electric poles,
Telephone line Poles, Optical Cables etc… must be placed at lease 28 meter from the central road axe.
(as shown in figure below)
30m 30m 28m(min) 28m(min)
Road Axe Fence
Electric Pole
Fence
Electric Pole
Reserved space for publicservice equipment
Keep the reserved space for the future development
Keep the reserved space for the future development
Reserved space for public service equipment

Preparatory Survey for National Road No.5 Rehabilitation Project in the Kingdom of Cambodia
4-13
(b) ADB: Emergency Flood Rehabilitation Project (EFRP)
Two cancelled package of PRRP were transferred to the subprojects of “Emergency Flood Rehabilitation Project (EFRP) funded by ADB. This project was aimed to restore damaged facilities to their pre-flood conditions to permit early restoration of economic and social activities. Given the Project’s urgent nature, the detailed design was left for implementation and the rehabilitation works were commenced immediately with ensuring dry season. The design process depends heavily on national ministries and provincial agencies for information on the extent of damage. Therefore 139 km of the South Section and 60 km of the North Section except bridge works, reconstruction of bridges covered by PRRP Package 5E, were restored under contract packages of EFRP.
(c) ADB: Cambodia Road Improvement Project (CRIP)
The contract package 5F or PRRP, the section between Sri Sophorn and Poipet, was implemented under Cambodia Road Improvement Project (CRIP) funded by ADB. The road was paved with AC and the cross section composition is 2-lane road with motorcycle lane. Total width of the pavement is 10.2 m.
(d) Project Funded by Phnom Penh Municipality and Chinese Government
Regarding the section between Phnom Penh and Prek Kdam Bridge which is outside of scope of this Survey, a short stretch of approximately 8 km was overlaid with asphalt concrete (AC) recently by the fund of Phnom Penh Municipality, and there is a plan to upgrade into 4-lane with AC pavement over the whole section by Chinese fund on the period from 2012 to 2015. If this plan will come to reality, the section from Phnom Penh to the South Section will be greatly improved in the near future.
(e) ADB: Road Asset Management Project (RAMP)
Road Asset Management Project (RAMP) funded by ADB implements the maintenance work between Phnom Penh (KP 3.9) and Thlea Ma’Am (KP 170.9) in 2010 and 2011. The contents of the work are the installation of road signs, guide posts, lane marking and kilometer posts and the repair of cracks, potholes, depression, rutting, shoving, corrugation, base course failure, edge break damage and full depth reconstruction of failure. Any improvement or upgrading works are not carried out in this project.
The recent projects on NR 5 are listed in Table 4.2-1. The locations of repair/rehabilitation works executed under these projects are schematically illustrated in Figure 4.2-1.

Preparatory Survey for National Road No.5 Rehabilitation Project in the Kingdom of Cambodia
4-14
Table 4.2-1 Project List on National Road No. 5 Section Project Year
Phnom Penh ~ Prek Kdam Br. Restored by Army RAMP funded by ADB 4-lane widening by China fund
2000 - 2002 2010 - 2011 2012 -
Prek Kdam Br. ~ Kampong Chhnang (South Section)
Restored by Army RAMP funded by ADB
2000 - 2002 2010 - 2011
Kampong Chhnang ~ Thlea Ma’Am (South Section)
EFRP funded by ADB RAMP funded by ADB
2000 - 2004 2011 - 2012
Thlea Ma’Am ~ Battambang (Middle Section)
PRRP funded by ADB 2000 - 2005
Battambang ~ Sri Sophorn (North Section)
EFRP funded by ADB 2000 - 2004
Sri Sophorn ~ Poipet CRIP funded by ADB 2004 - 2007
Figure 4.2-1 Schematic Illustration of Location of Works Executed under Projects Cited Above
(a) PRRP
(b) EFRP
(c) CRIP
(d) PP & China
(e) RMAP
Phnom Penh
Prek Kdam
Kampong Chhnang
Thlea ma'Am Battambang Sisophon Poipet
PK5ACancel
PK5BCancel
PK5C PK5D PK5FCancel Cancel
Serei Saophoan
Preparatory Survey for National Road No.5 Rehabilitation Project in the Kingdom of Cambodia
5-1
CHAPTER 5 TRAFFIC SURVEYS
Traffic surveys were carried out on the National Road No. 5. The objectives of the surveys were to have better understanding on the characteristic of the Survey Area, as well as the present traffic pattern. The data obtained through the traffic surveys are also used in forecasting future traffic demand, which, in turn, is used in evaluation of priority of the South, Middle and North Sections and planning of cross sections.
The following three (3) types of the survey were conducted, namely; traffic count survey (12hr and 24hr), origin destination (OD) interview survey and travel speed survey. The outline, method and result of the survey are explained in each section below.
5.1 Traffic Count Survey
5.1.1 Outline
The traffic counts were conducted at eight (8) stations with three (3) vehicle groups and eight (8) vehicle classifications. 24 hours counts were carried out at two (3) stations from 6:00 a.m. to 6:00 a.m. next day and 12 hours counts at six (6) stations from 6:00 a.m. to 6:00 p.m. These traffic counts were carried out on weekdays, excluding Saturday, Sunday and national holidays. The groups and classifications of vehicle were classified as follows.
Table 5.1-1 Vehicle Classification for the Traffic Count Survey Group Classification
1 Motorcycle and Motor Tricycle I Motor Cycle
(MC) 2 Motorbike Trailer
3 Sedan, Wagon, Light Van and Pick-up(for passenger)
4 Pick-up(for commodity), Jeep and Light Truck (>3.5t)
II Light Vehicle
(LV)
5 Mini Bus (Van type and Pick-up Type)
6 Short and Long Body Bus
7 Short and Long Body Truck (<3.5t)
III Heavy Vehicle
(HV)
8 Semi and Full Trailer Truck
5.1.2 Location of Traffic Count Survey
The survey locations were selected at the provincial boundary and city boundary (Kompong Chhnang City and Battambang City) and they are shown in Table 5.1-2 and Figure 5.1-1, respectively.
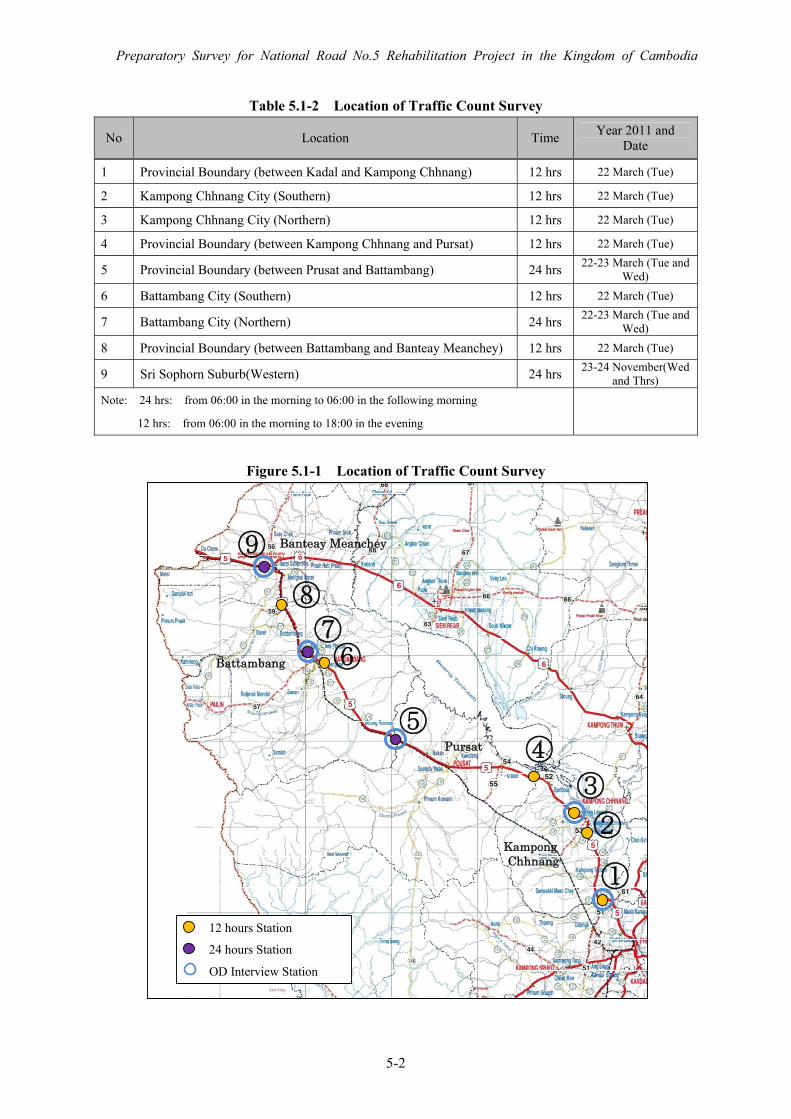
Preparatory Survey for National Road No.5 Rehabilitation Project in the Kingdom of Cambodia
5-2
Table 5.1-2 Location of Traffic Count Survey
No Location Time Year 2011 and Date
1 Provincial Boundary (between Kadal and Kampong Chhnang) 12 hrs 22 March (Tue)
2 Kampong Chhnang City (Southern) 12 hrs 22 March (Tue)
3 Kampong Chhnang City (Northern) 12 hrs 22 March (Tue)
4 Provincial Boundary (between Kampong Chhnang and Pursat) 12 hrs 22 March (Tue)
5 Provincial Boundary (between Prusat and Battambang) 24 hrs 22-23 March (Tue and Wed)
6 Battambang City (Southern) 12 hrs 22 March (Tue)
7 Battambang City (Northern) 24 hrs 22-23 March (Tue and Wed)
8 Provincial Boundary (between Battambang and Banteay Meanchey) 12 hrs 22 March (Tue)
9 Sri Sophorn Suburb(Western) 24 hrs 23-24 November(Wed and Thrs)
Note: 24 hrs: from 06:00 in the morning to 06:00 in the following morning
12 hrs: from 06:00 in the morning to 18:00 in the evening
Figure 5.1-1 Location of Traffic Count Survey
12 hours Station
24 hours Station OD Interview Station
③ ④
⑤
⑥⑦
⑧
②
①
Battambang
Kampong Chhnang
Pursat
⑨ Banteay Meanchey

Preparatory Survey for National Road No.5 Rehabilitation Project in the Kingdom of Cambodia
5-3
5.1.3 Survey Result
The results of the traffic count survey are as described below.
(1) 12-hour traffic volume and vehicle composition
Table 5.1-3 shows 12 hours traffic volume by vehicle group and classification. The traffic volume at station 6 and 7 (boundary of Battambang City) were over 10,000 vehicles.
Table 5.1-3 Traffic Volume for 12 Hours Unit: Vehicle
Motorcycle (MC) Light Vehicle (LV) Heavy Vehicle (HV)
Station No.
Motorcycle and
Tricycle
Motorbike Trailer
Total
Sedan, Wagon
and Light Van
Pick-up, Jeep and
Light Truck
Mini Bus
Total
Short &
Long Body Bus
Short &
Long Body Truck
Total
Grand Total
1 4,148 318 4,466 1,562 534 796 2,892 184 484 72 740
2 4,748 101 4,849 1,596 555 509 2,660 190 294 19 503
3 3,505 51 3,556 1,207 365 503 2,075 181 297 35 513
4 670 38 708 809 264 356 1,429 177 247 23 447
5 1,475 48 1,523 756 282 349 1,387 176 315 32 523
6 11,339 423 11,762 1,541 621 487 2,649 171 646 31 848
7 7,107 412 7,519 1,768 526 433 2,727 131 246 72 449
8 3,615 201 3,816 1,297 311 280 1,888 98 555 50 703
9 3,128 81 3,209 2,221 431 272 2,924 90 306 119 515
Figure 5.1-2 shows the vehicle composition at each survey station. Ratio of Motorcycle (MC) to total vehicle is more than 50% at most stations. The volume of MC is less than that of Light Vehicle (LV) at station No. 4 and No. 5. This may be attributed to the fact that there is no housing and facilities nearby.
Figure 5.1-2 Vehicle Composition by Survey Station

Preparatory Survey for National Road No.5 Rehabilitation Project in the Kingdom of Cambodia
5-4
(2) Peak hour traffic volume
Table 5.1-4 shows the peak hour traffic volume for all vehicles and for Heavy Vehicle (HV) in the two directions of “to Poipet” and “to Phnom Penh”. There was no particular time zone of peak traffic common to all counting stations.
Table 5.1-4 Peak Hour Traffic Volume by Direction Unit: Vehicle
Direction Phnom Penh ⇒ PoiPet PoiPet ⇒ Phnom Penh
Station No. Traffic count hour Maximum
hourly traffic volume
Time zone Maximum
hourly traffic volume
Time zone
1 12 483 7:00-8:00 379 16:00-17:00 2 12 517 7:00-8:00 441 17:00-18:00 3 12 331 11:00-12:00 395 7:00-8:00 4 12 151 9:00-10:00 126 11:00-12:00 5 24 166 10:00-11:00 201 21:00-22:00 6 12 887 8:00-9:00 809 17:00-18:00 7 24 553 17:00-18:00 575 8:00-9:00 8 12 301 8:00-9:00 344 9:00-10:00 9 24 365 9:00-10:00 324 17:00-18:00
(3) 24 hour/12 hour ratio
The 24 hour traffic count was carried out at three (3) stations (No. 5, No. 7 and No. 9) in order to confirm the trend of the traffic volume in rural area and at boundary of the city on the National Road No. 5. The rations of 24 hour/12 hour by vehicle classification are shown in Table 5.1-5 and Table 5.1-6, respectively. The 24 hour/12 hour ratio of Semi & Full Trailer Truck is the highest among those of various vehicle types, and is more than two (2) times of others. This means the semi & full trailer trucks move actively during night rather than daytime. It is assumed that they intend to avoid traffic congestion at those places.
Table 5.1-5 24 Hours/12 Hours Ratio at Station 5 (Rural Area) Unit: Vehicle
Motorcycle (MC) Light Vehicle (LV) Heavy Vehicle (HV)
Area Station
No. Motorcycle
and Tricycle
Motorcycle Trailer
Sedan, Wagon
and Light Van
Pick-up Jeep and
Light Truck
Mini Bus
Short &
Long Body Bus
Short &
Long Body Truck
Semi & Full
Trailer Truck
Grand Total
12 hour 1475 48 756 282 349 176 315 32 343324 hour 1674 50 970 357 391 195 567 194 4398Rural
24/12 ratio 113 1.04 1.28 1.27 1.12 1.11 1.80 6.06 1.28
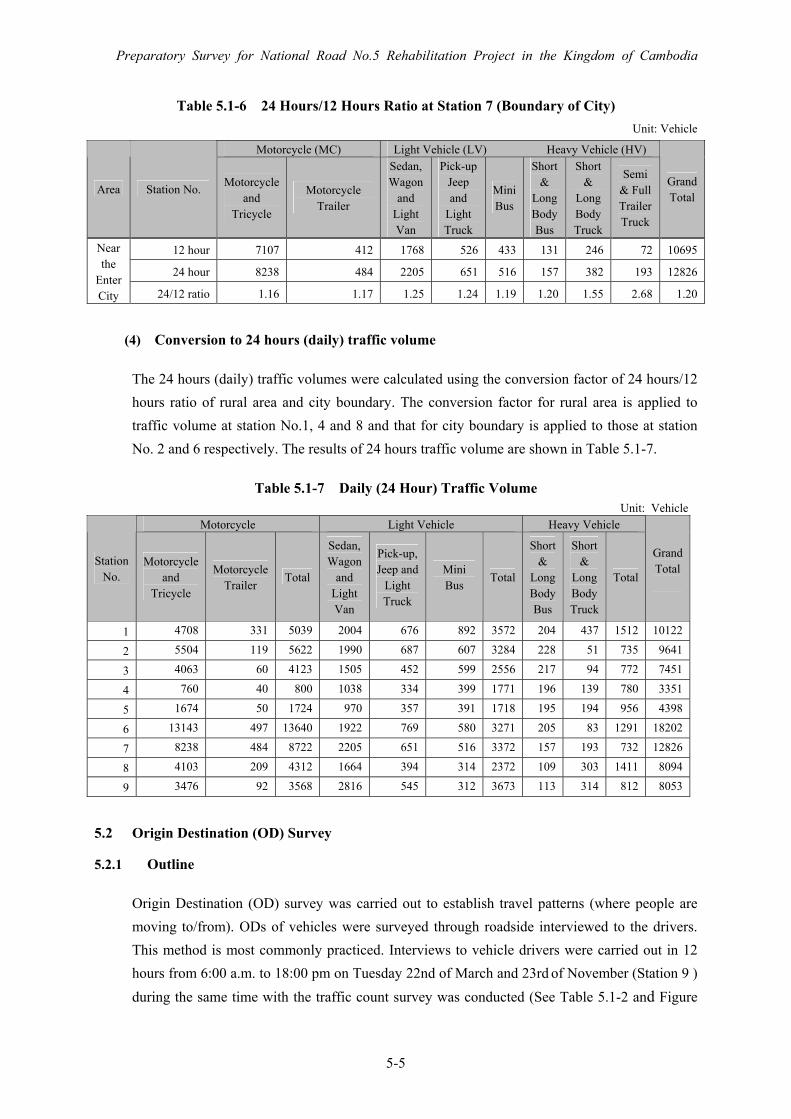
Preparatory Survey for National Road No.5 Rehabilitation Project in the Kingdom of Cambodia
5-5
Table 5.1-6 24 Hours/12 Hours Ratio at Station 7 (Boundary of City) Unit: Vehicle
Motorcycle (MC) Light Vehicle (LV) Heavy Vehicle (HV)
Area Station No. Motorcycle and
Tricycle
Motorcycle Trailer
Sedan, Wagon
and Light Van
Pick-up Jeep and
Light Truck
Mini Bus
Short &
Long Body Bus
Short &
Long Body Truck
Semi & Full Trailer Truck
Grand Total
12 hour 7107 412 1768 526 433 131 246 72 10695
24 hour 8238 484 2205 651 516 157 382 193 12826
Near the
Enter City 24/12 ratio 1.16 1.17 1.25 1.24 1.19 1.20 1.55 2.68 1.20
(4) Conversion to 24 hours (daily) traffic volume
The 24 hours (daily) traffic volumes were calculated using the conversion factor of 24 hours/12 hours ratio of rural area and city boundary. The conversion factor for rural area is applied to traffic volume at station No.1, 4 and 8 and that for city boundary is applied to those at station No. 2 and 6 respectively. The results of 24 hours traffic volume are shown in Table 5.1-7.
Table 5.1-7 Daily (24 Hour) Traffic Volume Unit: Vehicle
Motorcycle Light Vehicle Heavy Vehicle
Station No.
Motorcycle and
Tricycle
Motorcycle Trailer
Total
Sedan, Wagon
and Light Van
Pick-up, Jeep and
Light Truck
Mini Bus
Total
Short &
Long Body Bus
Short &
Long Body Truck
Total
Grand Total
1 4708 331 5039 2004 676 892 3572 204 437 1512 10122
2 5504 119 5622 1990 687 607 3284 228 51 735 9641
3 4063 60 4123 1505 452 599 2556 217 94 772 7451
4 760 40 800 1038 334 399 1771 196 139 780 3351
5 1674 50 1724 970 357 391 1718 195 194 956 4398
6 13143 497 13640 1922 769 580 3271 205 83 1291 18202
7 8238 484 8722 2205 651 516 3372 157 193 732 12826
8 4103 209 4312 1664 394 314 2372 109 303 1411 8094
9 3476 92 3568 2816 545 312 3673 113 314 812 8053
5.2 Origin Destination (OD) Survey
5.2.1 Outline
Origin Destination (OD) survey was carried out to establish travel patterns (where people are moving to/from). ODs of vehicles were surveyed through roadside interviewed to the drivers. This method is most commonly practiced. Interviews to vehicle drivers were carried out in 12 hours from 6:00 a.m. to 18:00 pm on Tuesday 22nd of March and 23rd of November (Station 9 ) during the same time with the traffic count survey was conducted (See Table 5.1-2 and Figure

Preparatory Survey for National Road No.5 Rehabilitation Project in the Kingdom of Cambodia
5-6
5.1-1). The target sample rate was set at 10 %. The vehicles were stopped on random sampling basis, and drivers were interviewed.
The following information was collect in the driver’s interview
Trip purpose (to home, to work, to school, at work/business, or private) Origin and destination Number of passengers (including driver) Estimated travel time Major cargo/loading factor (for truck)
5.2.2 Survey Result
(1) Number of samples and sampling rate
Number of sampling and rate at each station are shown in Table 5.2-1. Sampling rates exceeded the target of 10% at all the stations.
Table 5.2-1 Number of Sampling and Rate
Station No.
Traffic Volume (12 hrs)
No. of Sample
Sampling Rate
1 8,098 886 10.9%
3 6,144 938 15.3%
5 3,433 616 17.9%
7 10,695 1,681 15.7%
9 6,648 1,191 17.9%
(2) Average passenger occupancy
The average passenger occupancy by vehicle classification is shown in Table 5.2-2.
Table 5.2-2 Average Passenger Occupancy Motorcycle (MC) Light Vehicle (LV) Heavy Vehicle (HV)
Motorcycle and
Tricycle
Motorcycle Trailer
Sedan, Wagon and Light Van
Pick-up, Jeep and Light
Truck Mini Bus
Short & Long Body
Bus
Short & Long Body Truck
Semi & FullTrailer Truck
1.7 4.9 3.8 4.3 8.94 35.0 2.3 2.0
(3) Major cargo and load factor
Table 5.2-3 shows the major cargo carried by trucks and trailer trucks. The cargo type was classified into ten (10) categories. Cargos in “Agriculture” and “Construction” category count for approximately 50% of whole cargos except “Others category”.

Preparatory Survey for National Road No.5 Rehabilitation Project in the Kingdom of Cambodia
5-7
Table 5.2-3 Major Cargo
Share Cargo Including
Others Excluding ‘Others’
Agriculture (rice, vegetable, fruits etc.,) 23.1% 29.3%
Forest (log, timber) 1.8% 2.3%
Marine (fish seafood, fish sauce etc.,) 4.9% 6.2%
Mineral ( coal, cooper etc.,) 2.9% 3.6%
Metal & Machine (steel, car , motorbike, equipment, etc.,) 5.8% 7.4%
Chemical (petroleum, etc.,) 12.0% 15.2%
Light Industry ( machine parts, electronics, etc.,) 4.9% 6.2%
Miscellaneous Industry ( garment shoes, etc.,) 7.9% 10.0%
Construction ( sand, gravel, concrete, brick etc.,) 15.5% 19.7%Others ( water bottle, cosmetic, recycle materials(can paper, steel ), animal etc.,) 21.2%
Total 100.0% 100.0%
Figure 5.2-1 shows loading factor (percentage of actually loaded cargo against the capacity of vehicle). Approximately 40% of truck-type vehicles are fully loaded.
0% 20% 40% 60% 80% 100%
Pick-up / Jeep / Light Truck
Short & Long Body Truck
Semi & Full Trailer Truck
Full 3/4 1/2 1/4 1/4> Empty
Figure 5.2-1 Loading Factor with Vehicle Classification
(4) Trip purpose
Figure 5.2-2 shows trip purpose by vehicle classification. Except Motorcycle and Tricycle, the trip purpose with the largest share is ‘At Work / Business’.

Preparatory Survey for National Road No.5 Rehabilitation Project in the Kingdom of Cambodia
5-8
41.6%
15.9%
20.0%
8.1%
10.8%
3.6%
0.0%
11.0%
6.1%
9.7%
4.5%
3.2%
1.4%
3.6%
14.5%
72.0%
51.3%
81.2%
74.4%
96.2%
89.9%
94.6%
28.9%
6.1%
18.7%
6.0%
11.2%
1.4%
2.8%
2.7%
0.0% 20.0% 40.0% 60.0% 80.0% 100.0%
Motorcycle and Tricycle
Motorbike Trailer
Sedan, Wagon and Light Van
Pick-up, Jeep and Light Truck
Mini Bus
Short & Long Body Bus
Short & Long Body Truck
Semi & Full Trailer Truck
To Home To Work To School At work / Business Private
Figure 5.2-2 Trip Purpose with Vehicle Classification
(5) Travel time
Figure 5.2-3 shows the estimated average travel time by vehicle classification. The travel time from origin to destination was calculated based on estimation of driver’s sense. Travel time for “Semi & full trailer truck was more than 400 minute (7 hours). However those seem to be one (1) hour shorter than actual travel time, as “short & long body bus” includes a break and truck includes loading and unloading time for category.
55
73
144
228
234
390
349
433
0 50 100 150 200 250 300 350 400 450 500
Motorcycle and Tricycle
Motorbike Trailer
Sedan, Wagon and Light Van
Pick-up, Jeep and Light Truck
Mini Bus
Short & Long Body Bus
Short & Long Body Truck
Semi & Full Trailer Truck
Travel time (minute)
Figure 5.2-3 Estimated Average Travel Time

Preparatory Survey for National Road No.5 Rehabilitation Project in the Kingdom of Cambodia
5-9
(6) OD trip pattern
Figure 5.2-4 shows the OD trip pattern by vehicle group in the form of desire line. Motorcycle has usually the characteristic of the short-range trip. One of the OD survey points was located at the boundary of Kampong Chhnang and Kampong Speu. There are many towns and markets in this neighborhood, and many motorcycles travel between Kampong Chhanang and Kampong Speu. In case of light vehicle, medium range trips such as between Banteay Meanchey and Battambang, and between Kampong Chhnang and Phnom Penh, as well as long-distance trips between Phnom Penh and Battmabang are prominent. As for heavy vehicles, long-distance trips such as Banteay Menchey - Phnom Penh and Battambang - Phnom Penh are eminent.
Unit: Vehicle
Figure 5.2-4 OD Trip Pattern
Motorcycle (MC) Light Vehicle (LV)
Heavy Vehicle (HV) All Modes
Battambang Battambang
Battambang Battambang
Phnom Penh Phnom Penh
Phnom Penh Phnom Penh
Banteay Meanchey Banteay Meanchey
Banteay Meanchey Banteay Meanchey
Kampong Chhnang Kampong Chhnang
Kampong Chhnang Kampong Chhnang
2,500 5,000 2,500 5,000
2,500 5,0002,500 5,000
Kampong Speu
Preparatory Survey for National Road No.5 Rehabilitation Project in the Kingdom of Cambodia
5-10
5.3 Travel Speed Survey
5.3.1 Outline
The travel speed survey was conducted from Prek Kdam Bridge to Sri Sophorn and vice versa at 7:00am on Thursday 24th of March. The whole stretch was divided into nine (9) sections and the survey was conducted by sedan car traveling at the average speed of traffic flow. In addition, the survey was conducted in Kampong Chhnang City and Battambang City in order to figure out travel speed in the urbanized area.
5.3.2 Route and Sections of Travel Speed Survey
The route and section of travel speed survey are shown in Figure 5.3-1.
Figure 5.3-1 Travel Speed Survey Route and Section
5.3.3 Survey Result
The obtained average speed is shown in Table 5.3-1. Average travel speed between Prek Kdam and Sri Sophorn was 64.6 km/h. This speed is lower than that surveyed in the JICA Study 2005. Small reduction in the travel speed may reflect (i) deterioration of pavement and (ii) increase in traffic volume or congestion.
3 4 5
6
7
9
2
1
Battambang
Kampong Chhnang
Pursat
8
Preak Kdam Br.
NR. 53
NR. 52
NR. 54
NR. 149
NR. 57
NR. 59
Mongkoi Borei Sri Sophorn
Preparatory Survey for National Road No.5 Rehabilitation Project in the Kingdom of Cambodia
5-11
Table 5.3-1 Long-Distance Average Travel Speed
Section From To Distance (km)
Average Speed (km/h)
1 Prek Kdam Bridge NR 53 Jct. (Kampong Chhnang) 59.9 61.3
2 NR 53 Jct. (Kampong Chhnang) NR 52 Jct. 32.3 62.2
3 NR 52 Jct. NR 54 Jct. 30.0 76.7
4 NR 54.Jct NR 148 Jct. (Prusat) 31.8 76.2
5 NR 148 Jct. (Prusat) NR 149 (Moung Russey) 59.0 63.8
6 NR 149 (Moung Russey) NR 57 Jct. (Battambang) 43.2 68.3
7 NR 57 Jct. (Battambang) NR 59 Jct. 29.8 53.9
8 NR 59 Jct. Mongkol Borei 32.3 62.8
9 Mongkol Borei Sri Sophorn 8.5 44.3
Whole Prek Kdam Bridge Sri Sophorn 326.8 64.7
Travel speed survey was also conducted during the morning peak hour (8:00-8:30) in the Kampong Chhnang City and Batanmbang City. Average speeds in these cities were 49.3km and 32.4km, respectively. In the city centers, the travel speed drops to less than 30km/h and recovers to more than 40km/h when passenger car passing the city center.
Table 5.3-2 Travel Speed in Kampong Chhnang City
Section From To Distance
(km)
Average
Speed
(km/h)
1 South City Gate Rotary (Monument) 3.60 67.7
2 Rotary (Monument) Jct. NR 53 (City Center) 0.80 29.2
3 Jct. NR 53 (City Center) North City Gate 2.20 41.7
Whole South City Gate North City Gate 6.60 49.3
Table 5.3-3 Travel Speed in Batanmbang City
Section From To Distance
(km)
Average
Speed
(km/h)
1 East City Gate Small Rotary 0.78 34.5
2 Small Rotary Roundabout 2.10 44.1
3 Roundabout Bridge 2.10 40.6
4 Bridge Rotary (City Center) 0.90 23.0
5 Rotary (City Center) West City Gate 1.20 21.0
Whole East City Gate West City Gate 7.08 32.4

Preparatory Survey for National Road No.5 Rehabilitation Project in the Kingdom of Cambodia
6-1
CHAPTER 6 FUTURE TRAFFIC DEMAND FORECAST
Forecast of the future traffic demand is the basis of highway planning and economic analysis. This chapter describes the methodology and data used in the traffic demand forecast, as well as the result of the forecast.
In the estimation of future traffic demand, target years are set at 2016, 2021 and 2030. Years 2016 and 2021 correspond to 5 and 10 years from now, and year 2030 is chosen since it will be 10 years after the long-term target year of the JICA M/P Study, 2006.
6.1 Methodology
Figure 6.1-1 shows the flow of future traffic forecast.
Figure 6.1-1 Flow of Traffic Demand Forecast
First, the future OD table is prepared based on the present OD table and reflecting future socio-economic indices, such as population and vehicle registration forecast. Future OD tables are forecasted through use of trip generation and attraction, and OD distribution. The future traffic demand is forecasted by assigning the future OD table onto the future network on the JICA STRADA program.
6.2 Socio-Economic Framework
Since transportation supports the social activities of the citizens and the economic activities of the industries and commerce, traffic demand is governed by socio-economic factors such as GDP, population and vehicle registration. This section describes the present conditions and

Preparatory Survey for National Road No.5 Rehabilitation Project in the Kingdom of Cambodia
6-2
future forecast of such socio-economic factors.
6.2.1 Population Projection
“General Population Census of Cambodia 2008” published in January 2011 by the National Institute of Statistics, Ministry of Planning is the latest population projection of Cambodia. The population projection by province up to 2030 is shown in Table 6.2-1. Growth rate of whole Cambodia (country) between 2008 and 2030 is 1.33. It is noted that the growth rates of provinces in the Survey Area (Banteay Meanchey, Battambang and Pursat ) are higher than that of whole country.
Table 6.2-1 Population by Province Unit: Person
Provinces 2008 2011 2016 2021 2026 2030 2030/2008
Banteay Meanchey 701,786 745,618 822,187 899,389 968,181 1,017,936 1.45
Battambang 1,061,336 1,126,345 1,238,103 1,349,178 1,449,411 1,519,185 1.43
Kampong Cham 1,739,254 1,745,054 1,739,002 1,721,623 1,689,252 1,648,438 0.95
Kampong Chhnang 488,999 512,667 549,913 583,716 611,551 628,577 1.29
Kampong Speu 742,235 767,827 804,796 837,783 865,696 882,184 1.19
Kampong Thom 653,684 668,876 688,305 705,001 718,447 724,456 1.11
Kampot 606,516 613,305 629,383 654,515 687,197 716,987 1.18
Kandal 1,309,915 1,364,065 1,463,411 1,563,607 1,653,018 1,716,290 1.31
Koh Kong 121,624 133,047 153,846 176,552 199,995 218,811 1.80
Kratie 330,480 350,566 383,382 414,756 444,084 465,960 1.41
Mondul Kiri 63,263 70,587 83,410 97,607 113,303 126,725 2.00
Phnom Penh 1,374,451 1,570,791 1,898,407 2,175,636 2,364,203 2,450,717 1.78
Preah Vihear 177,176 185,509 199,547 214,576 230,617 243,681 1.38
Prey Veng 980,790 980,667 985,036 1,006,084 1,046,198 1,089,316 1.11
Pursat 411,171 425,704 453,467 486,491 522,505 553,067 1.35
Ratanak Kiri 155,773 166,339 182,759 200,145 218,482 233,141 1.50
Siem Reap 928,065 999,703 1,120,313 1,235,423 1,339,563 1,414,727 1.52
Preah Sihanouk 229,205 247,355 279,419 311,363 340,266 360,684 1.57
Stung Treng 115,610 122,756 135,778 151,803 170,639 187,442 1.62
Svay Rieng 499,820 500,275 504,905 517,511 538,082 559,726 1.12
Takeo 874,711 877,839 889,420 916,727 957,279 997,025 1.14
Otdar Meanchey 192,375 218,786 261,201 301,968 339,134 365,010 1.90
Kep 37,016 40,142 47,945 59,427 74,433 88,797 2.40
Pailin 72,971 87,453 112,509 137,997 162,734 181,801 2.49
Cambodia 13,868,227 14,521,275 15,626,444 16,717,422 17,704,090 18,390,683 1.33
Source: National Institute of Statistics, Ministry of Planning, January 2011

Preparatory Survey for National Road No.5 Rehabilitation Project in the Kingdom of Cambodia
6-3
6.2.2 Economic Growth of Cambodia
Figure 6.2-1 shows the historical trend of GDP of Cambodia in real term from 2001 to 2010 and estimated/predicted GDP from 2011 to 2013. The data show that Cambodian’s economic growth rate was continuously increasing from year 2001 to 2008 with an average annual growth rate of 9.5%. Slight increase in growth rate was experienced in year 2008 to 2009 probably due to the influence of the economic trend of the world (so-called ‘Lehman Shock’). It is predicted that the average annual growth rate will recover to 6.0% from year 2010 to 2013.
Note: p = predicted, e = estimated Source: Cambodia Macroeconomic Framework 2010-2011 of Ministry of Economic and Finance, March 2010 and Mid-Term Review 2011 on National Strategic Development Plan Update 2009-2013, Ministry of Planning
Figure 6.2-1 Historical Trend of GDP Growth (2001 -2013)
Figure 6.2-2 shows the growth of GDP per Capita. GDP per Capita increased from US$312 in 2001 to US$738 in 2008 with an average annual growth rate of 13.0%. After 2009, it is projected to increase to US$981 in year 2013.
Source: Cambodia Macroeconomic Framework 2010-2011 of Ministry of Economic and Finance
Figure 6.2-2 GDP per Capita in US$ (2001-2013)

Preparatory Survey for National Road No.5 Rehabilitation Project in the Kingdom of Cambodia
6-4
Figure 6.2-3 shows the GDP growth rate by industry during the same periods with that of GDP Per Capita. The Cambodia’s economic activities such as agriculture, industry and services keep steady increase.
Source: Cambodia Macroeconomic Framework 2010-2011 of Ministry of Economic and Finance
Figure 6.2-3 GDP Growth by Industry (2001-2013)
6.2.3 Future GDP Prediction
(1) Past Trend
The influence of the global economic slowdown is seen in the GDP of Cambodia in 2009. However, the Cambodian economy was expected start recovering from year 2010 and an average growth rate of 6.3% is predicted for the period of 2011-2013, according to the Ministry of Economics and Finance.
Source: Cambodia Macroeconomic Framework 2010-2011 of Ministry of Economic and Finance (MEF)
Figure 6.2-4 GDP Growth 2005-2013

Preparatory Survey for National Road No.5 Rehabilitation Project in the Kingdom of Cambodia
6-5
(2) Prediction by US Department of Agriculture
The long term (by 2030) GDP and GDP per Capita of Cambodia at constant price has been predicted by United States Department of Agriculture (USDA). According to this prediction, the annual growth rate of GDP and GDP per Capita will gradually decrease from 2013 to 2030.
Table 6.2-2 Annual Growth Rate of GDP and GDP Per Capita Unit: %
Year 2008 2009 2010 2011 2012 2013 2016 2021 2030
GDP 6.2 -1.1 3.8 6.1 6.6 7.0 6.6 6.1 5.2
GDP per Capita 4.4 -2.83 2.0 4.3 4.8 5.2 5.0 4.6 4.1
Source: Economic Research Service, United states Department of Agriculture (USDA).
(3) Prediction Used in JICA Master Plan Study
In the report of ‘the Study on the Road Network Development in the Kingdom of Cambodia’, October 2006, JICA (JICA M/P Study), the GDP growth rates shown below were adopted:
Table 6.2-3 GDP Growth Rate Adopted in JICA M/P Study Period 2006 - 2010 2011 - 2015 2016 - 2020 Growth Rate (%/Yr.) 6.0 6.9 7.8
By comparing this table with Figure 6.2-4 above, it is known that the actual growth rates for 2006 – 2008 were much higher than those predicted in the JICA M/P Study.
(4) GDP Growth Experienced in Neighboring Countries
Two neighboring countries, People’s Republic of China (PRC) and Vietnam, have recently experienced, and is experiencing, rapid economic growth. These countries well may be the model of Cambodia in economic growth.
Table 6.2-4 GDP Growth Rate of PRC and Vietnam Unit: %/Yr
Country 2001 2002 2003 2004 2005 2006 2007 2008 2009 2010
PRC 8.4 8.3 9.1 10.0 10.1 11.3 14.2 9.6 9.2 10.3
Vietnam 6.9 7.1 7.3 7.8 8.4 8.2 8.5 6.3 5.3 6.8
Source: PRC – National Statistic Bureau of China, Vietnam – IMF
(5) Scenario of Future GDP Growth
Considering the above-stated predictions, as well as the economic growth actually happened in Cambodia in the past, three scenarios of GDP growth are assumed.
Preparatory Survey for National Road No.5 Rehabilitation Project in the Kingdom of Cambodia
6-6
Table 6.2-5 Scenario of Future GDP Growth Unit: %/Yr
Scenario 2011 - 2016 2017 - 2021 2022 - 2030
High Growth 8.0 7.0 6.0
Medium Growth 6.5 6.1 5.2
Low Growth 5.5 5.0 5.2
These scenarios are used in the prediction of growth of vehicle registration described below.
6.2.4 Vehicle Registration
(1) Trend of Vehicle Registration
Figure 6.2-5 shows trend of vehicle registration in Cambodia since 2000. Table 6.2-6 shows the recorded composition of vehicle ownership by vehicle group in 2010. Table 6.2-6 shows the number of registered vehicles as of year 2010.
The salient feature of vehicle registration in Cambodia is that the share of motorcycles (MC) is predominantly larger than those of the other vehicles. In 2010, the total number of vehicles in Cambodia accounts for 1.65 million, of which 1.37 million are MC and the remaining 0.28 million are Light vehicle (LV) and Heavy Vehicle (HV).
Average growth rates of MC, LV and HV over the period from 2000 to 2010, obtained by discarding the maximum and minimum annual growth rates, are 33%, 18% and 10%, respectively. Vehicle ownership of MC and LV per 1000 population is 96.0 and 17.0, or 1 vehicle per 10 people for MC and 1 vehicle per 59 people for LV, respectively.
Source: Ministry of Public Works and Transport
Figure 6.2-5 Trend of Vehicle Registration in Cambodia

Preparatory Survey for National Road No.5 Rehabilitation Project in the Kingdom of Cambodia
6-7
Table 6.2-6 Vehicle Ownership in year 2010 Group Number of vehicle Percentage (%)
MC 1,372,252 83.0%
LV 244,267 14.8%
HV 36,015 2.2%
Total 1,652,534 100%
Source: Vehicle registration in year 2010 of Ministry of Public Work and Transport
(2) Future Vehicle Registration
Future growth rates of vehicle registration in Cambodia for the ‘Medium Growth Scenario’ are estimated as shown in Table 6.2-7 were estimated considering and/or assuming the following:
Although the growth rate of motorcycles in Cambodia was very high (more than 33%, 18% and 10 % for MC, LV and HV, respectively) in the past few years, probably owing to very high rate (more than 10%) of economic growth recorded in years 2005 – 2007, it should become smaller as the growth rate of economy becomes stable at around 6%.
It is assumed that people tend to shift from MC to LV as GDP per capita increases, or income level goes up. Thus, the decrease of the growth rate of MC in the future will be larger than that of LV.
Demand for HV will increase as the economy grows because transportation by HV is necessary for the economic activity. Thus, the growth rates of vehicle registration by vehicle type are estimated as shown in Table 6.2-7.
Table 6.2-7 Growth Rate of Vehicle Registration Growth Rate of Vehicle Registration (%/yr)
Year MC LV HV
2000 – 2010 (Trimmed Average) 33 18 10
2010 21 10 7
2011 17 15 10
2012 14 12 10
2013 12 10 10
2014 10 8 8
2015 9 7 7
2016 – 2020 8-4 6 6
2021 – 2026 3-2 5 5
2027 – 2030 1 4 4

Preparatory Survey for National Road No.5 Rehabilitation Project in the Kingdom of Cambodia
6-8
Figure 6.2-6 shows the future growth of vehicle registration, as well as growth of past 10 years.
Figure 6.2-6 Projection of Number of Vehicles
Table 6.2-8 shows the projected number of vehicle registration in years 2011, 2016, 2021 and
2030.
Table 6.2-8 Projection of Number of Vehicle
Group 2011 2016 2021 2030
MC 1,605,535 2,654,517 3,322,777 3,855,002
LV 280,907 423,923 561,952 823,128
HV 39,617 58,718 77,837 114,013
Total 1,926,058 3,137,158 3,962,567 4,792,143
If this estimation becomes reality, ratio of number of people per one vehicle, including MC, is
to become 3.8 persons/vehicle, or 1.25 vehicle/household, in year 2030. For reference, this ratio
is approximately 1.8 persons/vehicle in Japan now. In case of Japan percentage of MC is much
smaller (4.5%, excluding those with engine smaller than 50 cc) than that in Cambodia.
0
100,000
200,000
300,000
400,000
500,000
600,000
1955
1960
1965
1970
1975
1980
1985
1990
1995
2000
Year
Bill
ion
Yen
0
10
20
30
40
50
60
70
80
90
100
Veh
icle
Reg
istr
atio
n (
Mill
ion)
GDP
VehicleRegistration
Figure 6.2-7 Increase of Vehicle Registration in Japan in the Past

Preparatory Survey for National Road No.5 Rehabilitation Project in the Kingdom of Cambodia
6-9
In case of Vietnam, the total number of MC reached 19 million or 4.5 person/veh in 2006. This is comparable to 4.7 person/veh of MC in Cambodia projected in 2030.
Figure 6.2-8 shows the projected growth of vehicle registration for the three scenarios of GDP growth as in Subsection 6.2.3 above. In case of the ‘High Growth Scenario’, the total number of registered vehicle is projected to reach 6,547,000, or 2.8 person/veh, in 2030. Compared to the figures of Vietnam and Japan, this figure is considered to be too large. Thus, the figure of the ‘Medium Growth Scenario’ is adopted.
Figure 6.2-8 Projection of Number of Vehicles for Three Scenarios of GDP Growth
6.3 Future OD Table
6.3.1 Zoning System
The OD zoning system used the JICA M/P Study is also used in this Survey. The total number of zones is 197 (185 zones within Cambodia and 12 zones outside of Cambodia). Table 6.3-1 shows the list of OD zones.

Preparatory Survey for National Road No.5 Rehabilitation Project in the Kingdom of Cambodia
6-10
Province Zone No District Traffic Zone Province Zone No District Traffic Zone
Banteay Meanchey 1 Mongkol Barei 1 Preah Vihear 13 Chey Saen 106Phnum Srok 2 Chhaeb 107Preah Netr Preah 3 Choam Khsant 108Ou Chrov 4 Kuleaen 109Serei Saophoan 5 Rovieng 110Thma Puok 6 Sangkom Thmei 111Svay Chek 7 Tbaeng Mean Chey 112Malai 8 Prey Veng 14 Ba Phnum 113
Battambang 2 Banan 9 Kamchay Mear 114Thma Koul 10 Kampong Trabaek 115Bat Dambang 11 Kanhchriech 116Bavel 12 Me Sang 117Aek Phnum 13 Peam Chor 118Moung Ruessei 14 Peam Ro 119Rotanak Mondol 15 Pea Reang 120Sangkae 16 Preah Sdach 121Samlout 17 Prey Veaeng 122Sampov Lun 18 Kampong Leav 123Phnum Proek 19 Sithor Kandal 124Kamrieng 20 Pursat 15 Bakan 125Koas Krala 21 Kandieng 126
Kampong Cham 3 Batheay 22 Krakor 127Chamkar Leu 23 Phnum Kravanh 128Cheung Prey 24 Sampov Meas 129Dambae 25 Veal Veaeng 130Kampong Cham 26 Ratanak Kiri 16 Andoung Meas 131Kampong Siem 27 Ban Lung 132Kang Meas 28 Bar Kaev 133Kaoh Soutin 29 Koun Mom 134Krouch Chhmar 30 Lumphat 135Memot 31 Ou Chum 136Ou Reang Ov 32 Ou Ya Dav 137Ponhea Kraek 33 Ta Veaeng 138Prey Chhor 34 Veun Sai 139Srei Santhor 35 Siemreap 17 Angkor Chum 140Stueng Trang 36 Angkor Thum 141Tboung Khmum 37 Banteay Srei 142
Kampong Chhnang 4 Baribour 38 Chi Kraeng 143Chol Kiri 39 Kralanh 144Kampong Chhnang 40 Puok 145Kampong Leaeng 41 Prasat Bakong 146Kampong Tralach 42 Siem Reab 147Rolea B'ier 43 Soutr Nikom 148Sameakki Mean Chey 44 Srei Snam 149Tuek Phos 45 Svay Leu 150
Kampong Speu 5 Basedth 46 Varin 151Chbar Mon 47 Sihanoukville 18 Mittakpheap 152Kong Pisei 48 Prey Nob 153Aoral 49 Stueng Hav 154Odongk 50 Stung Treng 19 Sesan 155Phnum Sruoch 51 Siem Bouk 156Samraong Tong 52 Siem Pang 157Thpong 53 Stueng Traeng 158
Kampong Thom 6 Baray 54 Thala Barivat 159Kampong Svay 55 Svay Rieng 20 Chantrea 160Stueng Saen 56 Kampong Rou 161Prasat Balangk 57 Rumduol 162Prasat Sambour 58 Romeas Haek 163Sandan 59 Svay Chrum 164Santuk 60 Svay Rieng 165Stoung 61 Svay Teab 166
Kampot 7 Angkor Chey 62 Takeo 21 Angkor Borei 167Banteay Meas 63 Bati 168Chhuk 64 Bourei Cholsar 169Chum Kiri 65 Kiri Vong 170Dang Tong 66 Kaoh Andaet 171Kampong Trach 67 Prey Kabbas 172Kampot 68 Samraong 173Kampong Bay 69 Doun Kaev 174
Kandal 8 Kandal Stueng 70 Tram Kak 175Kien Svay 71 Treang 176Khsach Kandal 72 Oddar Meanchey 22 Anlong Veaeng 177Kaoh Thum 73 Banteay Ampil 178Leuk Daek 74 Chong Kal 179Lvea Aem 75 Samraong 180Mukh Kampul 76 Trapeang Prasat 181Angk Snuol 77 Kep 23 Damnak Chang'aeur 182Ponhea Lueu 78 Kaeb 183S'ang 79 Pailin 24 Pailin 184Ta Khmau 80 Sala Krau 185
Koh Kong 9 Botum Sakor 81 Laos 25 NR7 186Kiri Sakor 82 Thailand 26 NR5 187Kaoh Kong 83 27 NR48 188Smach Mean Chey 84 28 NR57 189Mondol Seima 85 29 NR67 190Srae Ambel 86 30 NR68 191Thma Bang 87 Vietnam 31 NR1 192Kampong Seila 88 32 NR2 193
Kratie 10 Chhloung 89 33 NR21 194Kracheh 90 34 NR33 195Preaek Prasab 91 35 NR72 196Sambour 92 36 NR76 197Snoul 93
Mondul Kiri 11 Kaev Seima 94Kaoh Nheaek 95Ou Reang 96Pechr Chenda 97Saen Monourom 98
Phnom Penh 12 Chamkar Mon 99Doun Penh 100Prampir Meakkara 101Tuol Kouk 102Dangkao 103Mean Chey 104Ruessei Kaev 105
Table 6.3-1 Zoning Code

Preparatory Survey for National Road No.5 Rehabilitation Project in the Kingdom of Cambodia
6-11
6.3.2 Preparation of Present OD table
OD table of year 2010 used in the JICA M/P Study 2006 was adopted as the basis of the present OD table of this Survey. It was adjusted based on the results of OD survey conducted in this Survey, focusing the traffic along NR 5.
6.3.3 Trip Generation and Attraction
Future OD matrices were estimated by the Frator method using the present OD matrix and the estimated trip generation and attraction. Future trip generation/attraction was estimated by incorporating the future growth of population and vehicle registration as described in Section 6.2 above. Present and future trip generation and attraction by vehicle type for the years 2011, 2016, 2021 and 2030 are shown in Table 6.3-2 (1) to Table 6.3-2 (4).
Table 6.3-2 (1) Trip Generation and Attraction by Vehicle Type Group in 2011
Unit: Vehicle/day
Trip Generation in 2011 Trip Attraction in 2011 Zone No.
Province MC LV HV MC LV HV
1 Banteay Meanchey 6,446 2,929 1,147 6,303 3,247 1,040
2 Battambang 23,505 3,448 1,341 23,701 3,743 1,591
4 Kampong Chhnang 9,299 2,482 339 8,578 2,752 411
12 Phnom Penh 50,588 22,848 5,191 50,920 21,821 5,164
15 Pursat 1,521 398 236 1,534 498 273
Table 6.3-2 (2) Trip Generation and Attraction by Vehicle Type Group in 2016 Unit: Vehicle/day
Trip Generation in 2016 Trip Attraction in 2016 Zone No.
Province MC LV HV MC LV HV
1 Banteay Meanchey 10,816 4,024 1,557 10,573 4,482 1,412
2 Battambang 39,936 4,724 1,808 40,252 5,153 2,145
4 Kampong Chhnang 14,063 3,264 441 12,974 3,642 534
12 Phnom Penh 90,844 39,560 8,144 91,330 37,917 8,109
15 Pursat 2,418 521 314 2,439 656 363

Preparatory Survey for National Road No.5 Rehabilitation Project in the Kingdom of Cambodia
6-12
Table 6.3-2 (3) Trip Generation and Attraction by Vehicle Type Group in 2021 Unit: Vehicle/day
Trip Generation in 2021 Trip Attraction in2021 Zone No.
Province MC LV HV MC LV HV
1 Banteay Meanchey 17,649 5,537 2,082 17,249 6,189 1,888
2 Battambang 65,398 6,480 2,406 65,903 7,092 2,854
4 Kampong Chhnang 21,943 4,312 568 20,247 4,830 689
12 Phnom Penh 151,570 62,586 11,853 152,303 60,158 11,811
15 Pursat 3,868 697 416 3,902 880 481
Table 6.3-2 (4) Trip Generation and Attraction by Vehicle Type Group in 2030 Unit: Vehicle/day
Trip Generation in 2030 Trip Attraction in 2030 Zone No.
Province MC LV HV MC LV HV
1 Banteay Meanchey 27,567 7,145 2,659 26,938 8,020 2,411
2 Battambang 102,090 8,329 3,052 102,860 9,153 3,621
4 Kampong Chhnang 33,362 5,210 690 30,787 5,867 837
12 Phnom Penh 237,020 96,186 16,624 238,120 92,788 16,581
15 Pursat 6,042 886 534 6,094 1,126 617
Figure 6.3-1 (1) to Figure 6.3-1 (4) (in the following pages) show the total trip production (total of generation and attraction) by zone in 2011, 2016, 2021 and 2030.

Preparatory Survey for National Road No.5 Rehabilitation Project in the Kingdom of Cambodia
6-13
Figure 6.3-1 (1) Total Trip Production in 2011 (Total Vehicle)
Figure 6.3-1 (2) Total Trip Production in 2016 (Total Vehicle)
Banteay Meanchey
Battambang
Kampong Chhnang
Pursat
Phnom Penh
50,000
100,000
Gen
Banteay Meanchey
Battambang
Kampong Chhnang
Pursat
Phnom Penh
50,000
100,000
Gen Att

Preparatory Survey for National Road No.5 Rehabilitation Project in the Kingdom of Cambodia
6-14
Figure 6.3-1 (3) Total Trip Production in 2021 (Total Vehicle)
Figure 6.3-1 (4) Total Trip Production in 2030 (Total Vehicle)
Banteay Meanchey
Battambang
Kampong Chhnang
Pursat
Phnom Penh
100,000
200,000
Gen Att
Banteay Meanchey
Battambang
Kampong Chhnang
Pursat
Phnom Penh
100,000
200,000
Gen Att

Preparatory Survey for National Road No.5 Rehabilitation Project in the Kingdom of Cambodia
6-15
6.3.4 Modal Split
(1) Railroad
A railroad line (North Line) between Poipet and Phnom Penh, is running in parallel to NR 5. This railroad is currently being rehabilitated with a financial assistance of ADB. In this rehabilitation plan, 5 times a day of train operation is assumed in the future. However, type and volume of cargo to be transported by the railroad is not known at present. Therefore, diversion of cargo nor passenger from automobile to railroad is not taken into account in this traffic forecast, but considered in overall examination of forecasted traffic volume presented in Item (3) of Subsection 6.4.1 below.
(2) Bus Service
Many long-distance bus services are available on NR 5. It is not conceivable that the share of transport by such long-distance buses greatly increase in the future as the income level of the people will be upgraded. Therefore, diversion to long-distance bus service is not taken into account in this future traffic demand forecast.
(3) Inland Water Transport
An agreement to promote inland water transport was signed between the RGC and the government of Vietnam in December 2009. This will encourage the inland water transport along Mekong River, Tonle Sap River, Tonle Sap Lake and Bassac River. However the diversion of cargo or passenger from NR 5 to such inland water transport is considered to be limited. Thus, such diversion is not considered in this traffic forecast.
6.4 Traffic Demand Forecast
6.4.1 Traffic Assignment
(1) Methodology and Result
Traffic volume by road section in the future was estimated by traffic assignment program of JICA STRADA. JICA STRADA adopts ‘the minimum paths method’ in which the vehicles are assumed to take the path with the minimum cost (sum of travel time cost and vehicle operation cost) among the road links of the network connecting the pair of OD zones. Figure 6.4-1 (1) to Figure 6.4-1 (4) show the result of the traffic assignment for year 2016 and 2030.

Preparatory Survey for National Road No.5 Rehabilitation Project in the Kingdom of Cambodia
6-16
Figure 6.4-1 (1) Result of Traffic Assignment for Year 2011
Figure 6.4-1 (2) Result of Traffic Assignment for Year 2016
LEGEND VCR (Vehicle/Capacity Ratio)
VCR<1.00 VCR<1.20 VCR<1.50 1.50<VCR
Banteay Meanchey
Battambang
Kampong Chhnang
Pursat
Phnom Penh
Banteay Meanchey
Battambang
Kampong Chhnang
Pursat
Phnom Penh
LEGEND VCR (Vehicle/Capacity Ratio)
VCR<1.00 VCR<1.20 VCR<1.50 1.50<VCR

Preparatory Survey for National Road No.5 Rehabilitation Project in the Kingdom of Cambodia
6-17
Figure 6.4-1 (3) Result of Traffic Assignment for Year 2021
Figure 6.4-1 (4) Result of Traffic Assignment for Year 2030
Banteay Meanchey
Battambang
Kampong Chhnang
Pursat
Phnom Penh
Banteay Meanchey
Battambang
Kampong Chhnang
Pursat
Phnom Penh
LEGEND VCR (Vehicle/Capacity Ratio)
VCR<1.00 VCR<1.20 VCR<1.50 1.50<VCR
LEGEND VCR (Vehicle/Capacity Ratio)
VCR<1.00 VCR<1.20 VCR<1.50 1.50<VCR

Preparatory Survey for National Road No.5 Rehabilitation Project in the Kingdom of Cambodia
6-18
Passenger Car Unit
In the traffic assignment, traffic volume is expressed in the form ‘Passenger Car Unit’ (PCU). The PCU equivalents used in this study are shown below.
Categories MC LV HV
PCU Equivalents 0.30 1.25 3.00
Usually, PCU of sedan and pick-up truck is set at 1.0. In this Survey, PCU of Light Vehicle (LV) is set at 1.25 considering that this category includes light truck and pick-up truck whose speed are slower than passenger cars because of cargo and contribution to traffic congestion is larger than ordinary passenger car.
Table 6.4-1 lists the forecasted traffic volumes for years 2011, 2016, 2021 and 2030 at the traffic counting stations stated in Chapter 5. Traffic volumes by vehicle type for each target year are shown in Table 6.4-2.
Table 6.4-1 Result of Traffic Assignment Unit: PCU
Year Section Station No.
2011 2016 2021 2030 1 10,612 14,720 20,641 28,637 2 8,644 11,519 15,735 21,164 3 7,426 10,001 13,775 18,947
South
4 5,616 7,453 10,092 13,888 5 6,071 8,232 11,368 15,899 Middle
(Boundary) 6 12,052 17,556 25,625 36,834 7 9,065 13,545 20,090 29,464 8 8,453 12,356 17,812 25,540 North 9 8,983 12,734 17,794 23,861

Preparatory Survey for National Road No.5 Rehabilitation Project in the Kingdom of Cambodia
6-19
Table 6.4-2 Traffic Volume by Vehicle Type Unit: Veh.
2011 2016 Section
Station No. MC LV HV Total
(Veh.)PCU MC LV HV Total
(Veh.) PCU
1 5,797 3,520 1,491 10,808 10,612 8,907 4,706 2,055 15,668 14,7202 3,677 3,347 1,119 8,143 8,644 5,643 4,146 1,556 11,346 11,5443 3,890 2,298 1,129 7,317 7,426 5,977 2,770 1,587 10,334 10,017
South
4 690 1,781 1,061 3,532 5,616 1,137 2,104 1,494 4,735 7,4535 1,380 2,308 924 4,612 6,071 2,327 2,830 1,332 6,489 8,232Middle
(Boundary) 6 12,523 3,250 1,411 17,184 12,052 21,263 4,168 1,989 27,420 17,5567 8,807 3,297 734 12,837 8,965 15,030 4,646 1,096 20,772 13,6058 4,617 2,374 1,367 8,357 8,453 7,803 3,356 1,940 13,099 12,356North 9 3,903 3,636 1,089 8,628 8,983 6,403 5,542 1,505 13,451 13,364
2021 2030
Section Station
No. MC LV HV Total (Veh.)
PCU MC LV HV Total (Veh.)
PCU
1 13,880 6,464 2,799 23,143 20,641 21,003 9,027 3,684 33,715 28,6372 8,763 5,337 2,145 16,245 15,735 13,220 6,863 2,873 22,956 21,1643 9,297 3,530 2,191 15,018 13,775 14,033 4,729 2,942 21,704 18,947
South
4 1,737 2,672 2,077 6,486 10,092 2,537 3,772 2,804 9,113 13,8885 3,693 3,672 1,890 9,255 11,368 5,623 5,106 2,610 13,339 15,899Middle
(Boundary) 6 34,713 5,554 2,756 43,024 25,625 54,063 7,612 3,700 65,375 36,8347 24,647 6,492 1,527 32,666 20,090 38,560 9,253 2,110 49,923 29,4648 12,700 4,827 2,656 20,183 17,812 19,807 7,242 3,514 30,562 25,536North 9 10,220 6,970 2,005 19,195 17,794 15,700 9,162 2,566 27,428 23,861
(2) Verification of Result of Traffic Forecast
In order to verify the accuracy of the traffic volumes estimated by the above-described method, the estimated traffic volumes of 2011 at traffic counting stations, as shown in Table 6.4-1 above, are compared with the actually observed traffic volumes. Figure 6.4-2 shows the result of comparison. The figure indicates overall agreement between the estimated values and actually observed values, with a tendency that the estimated values are slightly smaller than observed values.

Preparatory Survey for National Road No.5 Rehabilitation Project in the Kingdom of Cambodia
6-20
Figure 6.4-2 Verification Between Assignment Result and Actual Traffic Count
(3) Overall Examination of Forecasted Traffic Volume
As stated before, rehabilitation of the North Line of railroad is being implemented. Also, the plan of constructing a new road between Battambang and Siem Reap has recently been discussed. Ii is difficult to estimate the influences of these projects on the traffic demand of NR 5 since operation plan of railroad and route of the new road are not fixed yet. However, the influences of these projects are examined to see if there is any need of adjustment in overall plan of improvement of NR 5.
(i) Influence of Railroad
Based on the experiences of Japan, USA and European countries, as well as considering the routes and other conditions of rail transport and NR 5, the followings are assumed for estimation of diversion from road to railroad:
Traffic of heavy vehicles with trip length longer than 100 km is considered to be possibly subject to diversion to rail transport.
Considering modal shares of road and rail transports Japan etc, 10% of the above heavy vehicle traffic is assumed to divert to rail.
The result of calculation is shown in Table 6.4-3. Also, cases of 20% and 30% diversion are shown in the table as reference.
Table 6.4-3 Traffic Volume Diverted to Rail
Traffic Volume Diverted to Rail Heavy Vehicle Traffic with Trip
Length > 100 km (Year 2030) Div. Rate: 10% Div. Rate: 20% Div. Rate: 30%
5,598 pcu 560 pcu 1,120 pcu 1,679

Preparatory Survey for National Road No.5 Rehabilitation Project in the Kingdom of Cambodia
6-21
It should be noted that traffic volumes of ‘semi trailers’ and ‘full trailers’ actually observed at Station No. 5 and No. 7 are 194 vehicles/24 hr and 193 vehicles/24 hr, respectively (see Tables 5.1-5 and 5.1-6 in Chapter 5). With pcu factor of 3.0, these observed traffic volumes are converted to be around 580 pcu. Thus, 560 pcu, as calculated in Table 6.4-3, above is almost equivalent to the total traffic volume of semi trailers and full trailers observed in year 2011. Thus, the above calculation represents the situation where almost all the bulk and heavy cargo currently transported by semi trailers and full trailers divert to rail transport.
(ii) Influence of planned new road between Battambang and Siem Reap
The number of trips between the OD zones of Battambnag and southwards and Siem Reap and northwards is 2,187 pcu in year 2030. These trips can be assumed to divert to the new road.
Figure 6.4-3 Trips Which can Divert to Planned Battambang – Siem Reap Raod
(iii) Total diversion traffic volume
From the above, the total of possible diversion traffic is calculated to be;
560 + 2,187 = 2,747 pcu.
The traffic volume on the North Section (Battambang – Sri Sophorn) in year 2030 is estimated at 25,540 pcu (see Table 6.4-1). Thus, the total diversion traffic volume is a little more than 10% of the traffic volume estimated in year 2030. Therefore, influence of the diversion to rail and new road does not give substantial influence to the overall plan of improvement of NR 5.
6.4.2 Peak Hour Traffic Volume and Congestion
Table 6.4-4 shows the traffic volumes in peak hour at the traffic counting stations. The degree of congestion expressed in the form of the ratio of traffic volume against traffic capacity of the road (v/c ratio or VCR). VCR of 0.85 is usually considered to be the allowable limit of congestion in road planning.
VCR in peak hour at Station No. 6 is anticipated to become 1.0 in year 2021. The location of station No.6 is within the urbanized area of Battambang City. Therefore, the traffic volume at station No.6 is considered to include the short trips within the city or around the city.
By year 2030, at all the counting stations except No. 2, No. 4, No. 5 and No. 9, VCRs exceed
OD Zone: Battambang & South
Battambang, Pursat, Pailin OD Zone: Siem Reap & North
Siem Reap, Otdor Meanchey, Preah
Vehear
2,187 pcu (2030)

Preparatory Survey for National Road No.5 Rehabilitation Project in the Kingdom of Cambodia
6-22
1.0. Thus both the South Section and North Section need widening by that time.
Table 6.4-4 Peak Hour Traffic Volume and Congestion Degree Peak Hour Volume (PCU) Congestion Degree VCR Sation
No. 2011 2016 2021 2030 2011 2016 2021 2030 Lnk
Capacity(hour) No. of Lane
1 1103 1531 2146 2978 0.41 0.57 0.79 1.10 2700 1.5x2 2 948 1264 1726 2322 0.35 0.47 0.64 0.86 2700 1.5x2 3 781 1052 1448 1992 0.39 0.53 0.72 1.00 2000 2 4 565 750 1015 1397 0.28 0.37 0.51 0.70 2000 2 5 507 687 949 1327 0.19 0.25 0.35 0.49 2700 1.5x2 6 1276 1858 2712 3898 0.47 0.69 1.00 1.44 2700 1.5x2 7 772 1153 1710 2509 0.39 0.58 0.86 1.25 2000 2 8 821 1200 1729 2479 0.41 0.60 0.86 1.24 2000 2 9 711 1007 1408 1887 0.36 0.50 0.70 0.94 2000 2
It should be noted that daily traffic volumes at Stations No. 7 and 8 exceed, or approach, 20,000 PCU by year 2021 (see Table 6.4-1). 20,000 PCU is generally considered to be, or close to be, the capacity of an opposed 2-lane road. Thus, the traffic at these locations is anticipated to be congested. By year 2030, the daily traffic volume at stations No. 1, 6, 7 and 8 exceed, 25,000 PCU and widening of the North Section and the South Section will becomes absolutely necessary.
6.4.3 Traffic Volume on Bypass
One of the tasks included in the Scope of this Survey is to study the possibility of construction of bypasses around Kampong Chhnang, Battambang and Sri Sophorn. Table 6.4-5 shows the forecasted traffic volume on these bypasses.
Table 6.4-5 Future Traffic Volume on Bypass Area Section 2011 2016 2021 2030
Bypass 6,437 8,499 11,432 15,395 Kampong Chhnang
Inner city 1,752 2,456 3,533 4,859
Bypass 3,831 5,450 7,840 11,799 Battambang
Inner city 6,886 10,161 15,495 22,136
Bypass 3,940 5,563 7,632 10,281 Sri Sophorn
Inner city 4,505 6,546 9,482 13,284
While the traffic volume on the bypass is almost three times of what goes into the city in Kampong Chhnang, the traffic volume going into the city of Battambang is much larger than that on the bypass. The larger traffic volume going into the city of Battambang may well be attributed to the fact that Battambang City is the core city of the region and attracts/generates traffic.