Preparation, purity, and homogeneity of NBS standard ... · Preparation, Purity, and Homogeneity of...
5
JOURNAL OF RESEARCH of the National Bureau of Standards -A. Physics and Chemistry Vol. 71A, No. 1, January- February 1967 Preparation, Purity, and Homogeneity of NBS Standard Samples 705 and 706, Polystyrene D. Mcintyre * Institute for Materials Research, National Bureau of Standards, Washington, D.C. 20234 (September 14, 1966) The s tat e·of-art in the meas ur emen t of the molecular weights of macromolecul es is discussed. Th e preparation of polystyrene s tandard samp les 705 and 706 is d escr ibed. The results and the description of the carbo n-hydrogen mi croa nalysis, the ash det er mination, the lithium analysis, and the volatiles determination are given. The sampling methods for determining the homogeneity of 705 and 706 are prese nted. So me evidence of heterogeneity a pp eared to be present, particularly for lot 705, but the expe riment did not provide conclusive evidence of heteroge neity of the material. Key Words: Ash co nt ent, eleme ntal analysis, homogeneit y, lithium conte nt, molecular weights, polymer, pre paration , purity, sampling, standard sample, volatile co ntent. 1. Introduction For some time ther e has been a need for standard samples of polymers beyo nd the usual scientist-to- scientist exc hange of interesting and/or well-character- ized polymers. This need has been met by several undertakings in recent years. The Commission on Macromolecules of th e Int e rnational Union of Pur e and Applied Chemistry in 1950 und e rtook th e distri- bution of four samples of polystyrene with a request that r ec ipient laboratories report their data on the characterization of the molecular weight. The poly- styrene samples were fractions from two polymers obtained by th e thermal polymerization of bulk styrene. One fraction was taken from a polymer formed at 15 pe rc e nt conversion of the monomer; the other three fractions were from a polymer prepared by a bulk polymerization carried to a very high conversion. The c haracterization results, reported by H. P. Frank and H. Mark [1),1 are summarized in table 1. Th e weight- av erage molecular weights (Mw) of the thre e fractions re ported are approximately 1 X lOS, 3.Sx lOS and lOx lOS. The distribution of the molecular weights in the respec- tive fractions are all relatively large; the Mw/Mn ratio is approximately 1.4, where Mil is the numb e r-average molec ular weight. For all of the fractions th e range of reported Mil'S determined by osmotic pressure measurem e nts in the same solvent is always greater than 30 percent of the mean value, comparing only th e results from more than four laboratories using th e same conditions of measurement. The Mw's, where there are more than four results under the same conditions, give a range that is always greater than 20 percent of the mea n value. The intrinsic viscosities show much less variance in general, although the re- sults in methyl ethyl ketone (MEK) are often more scattered than those in toluene. The viscosities of the MEK solutions have an average range which is 14 percent of the mean , whereas th e range in toluene is 9 perce nt. Some of the measurem e nt proble ms were attributed to the large polydispersity of th e polymers. * Presenl add ress: Department of Che mi stry. The University of Akron. Akron, Ohio. I Figures in brackets indicate the lit e rature references at the end of this paper. 43 TABLE 1. Summary of the JUPAC molecular weight intercornparison [1 J No. of Range as Fraction Solvent reports Average Range a % of average Osmotic pressure measur ements: M" I 6 1,000,000 790.000- 1.110.000 32 11 MEK 4 199.000-2!lO,OOO 34 III MEK 5 680,000 474,000- 852,000 55 IV MEK 5 86.000 77 ,500- 100,000 38 Viscosity measure me nl s: I'lJlml/g I MEK 6 103.5 90- 111 16 I Benzene 4 27! 9 I Toluene 13 2p4 174- 2)6 2) 11 Toluene 4 104 4 11 MEK 5 61.7 54-69 23 itt Toluene 4 228 5 itt MEK 5 11 5 110- 127 10 IV Toluene 4 4ll 47-49.5 5 tV MEK 5 30.2, 29-31.5 8 Lighl scattering meas urements: MI(' II MEK 5 328,000 288•000- 360,000 2) III MEK 5 960,000 840,000- 1,050,000 22 IV MEK 4 110,300 96,000- 124.000 25
Transcript of Preparation, purity, and homogeneity of NBS standard ... · Preparation, Purity, and Homogeneity of...
JOURNAL OF RESEARCH of the National Bureau of Standards -A. Physics and Chemistry
Vol. 71A, No. 1, January- February 1967
Preparation, Purity, and Homogeneity of NBS Standard Samples 705 and 706, Polystyrene
D. Mcintyre *
Institute for Materials Research, National Bureau of Standards, Washington, D.C. 20234
(September 14, 1966)
The state·of-art in the measure ment of the molecular weights of macromolecules is discussed. The preparation of polystyrene standard samples 705 and 706 is described. The results and the description of the carbo n-hydroge n microa nalys is, the ash determination, the lithium analysis , and the volatiles determination are given. The sa mpling methods for determining the homogenei ty of 705 and 706 are prese nted. Some ev idence of he teroge ne ity a ppeared to be present, particularly for lot 705, but the experiment did not provide conclusive evidence of heterogeneity of the material.
Key Words: Ash content, elemental analysis, homoge ne it y, lithium content, molecular weights, polymer, preparation , purity, sampling, standard sample, volatile content.
1. Introduction
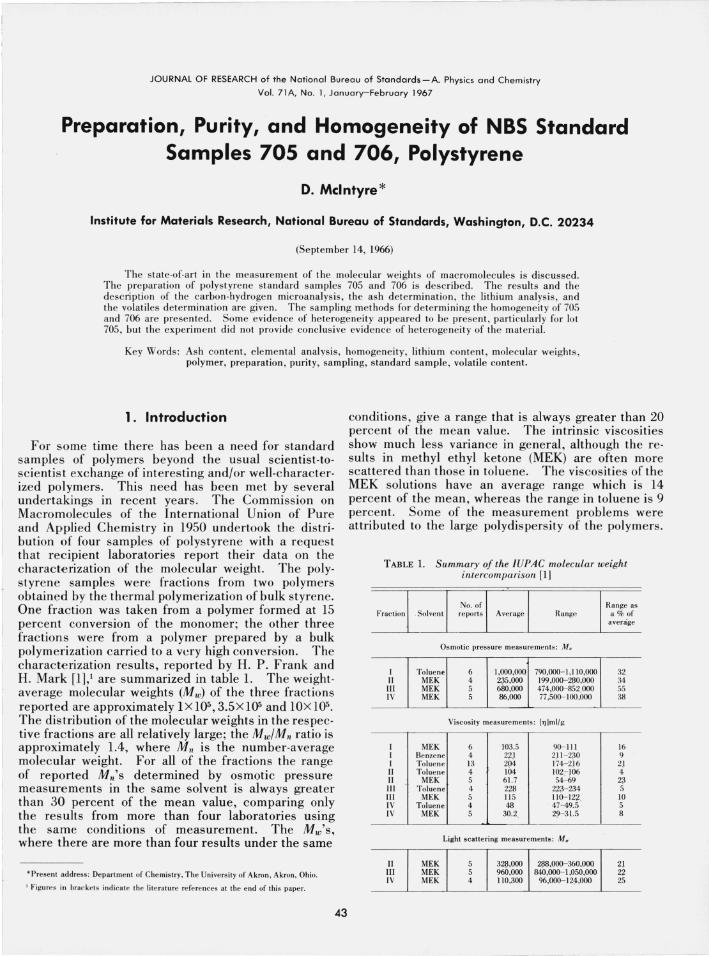
For some time there has been a need for standard samples of polymers beyond the usual scientist-toscientist exchange of interesting and/or well-characterized polymers. This need has been met by several undertakings in recent years. The Commission on Macromolecules of the International Union of Pure and Applied Chemistry in 1950 undertook the distribution of four samples of polystyrene with a request that recipient laboratories report their data on the characterization of the molecular weight. The polystyrene samples were fractions from two polymers obtained by the thermal polymerization of bulk styrene. One fraction was taken from a polymer formed at 15 percent conversion of the monomer; the other three fractions were from a polymer prepared by a bulk polymerization carried to a very high conversion. The c haracterization results, reported by H. P. Frank and H. Mark [1),1 are summarized in table 1. The weightaverage molecular weights (Mw) of the three fractions reported are approximately 1 X lOS, 3.Sx lOS and lOx lOS. The distribution of the molecular weights in the respective fractions are all relatively large; the Mw/Mn ratio is approximately 1.4, where Mil is the number-average molecular weight. For all of the fractions the range of reported Mil'S determined by osmotic pressure measurements in the same solvent is always greater than 30 percent of the mean value, comparing only the results from more than four laboratories using the same conditions of measurement. The Mw's, where there are more than four results under the same
conditions, give a range that is always greater than 20 percent of the mean value. The intrinsic viscosities show much less variance in general, although the results in methyl ethyl ketone (MEK) are often more scattered than those in toluene. The viscosities of the MEK solutions have an average range which is 14 percent of the mean, whereas the range in toluene is 9 percent. Some of the measurement proble ms were attributed to the large polydispersity of the polymers.
*Presenl address: Department of Che mistry. The University of Akron. Akron, Ohio.
I Figures in bracket s indicate the lite rature references at the end of thi s paper.
43
TABLE 1. Summary of the JUPAC molecular weight intercornparison [1 J
No. of Range as Fraction Solvent reports Average Range a % of
average
Osmotic pressure measurements: M"
I Toluen~ 6 1,000,000 790.000- 1.110.000 32 11 MEK 4 2~5,OOO 199.000-2!lO,OOO 34 III MEK 5 680,000 474,000- 852,000 55 IV MEK 5 86.000 77 ,500- 100,000 38
Viscosity measure menls: I'lJlml/g
I MEK 6 103.5 90- 111 16 I Benze ne 4 27! 2)1 -2~0 9 I Toluene 13 2p4 174- 2)6 2) 11 Toluene 4 104 102~ 106 4 11 MEK 5 61.7 54-69 23 itt Toluene 4 228 22~-234 5 itt MEK 5 11 5 110- 127 10 IV Tolue ne 4 4ll 47-49.5 5 tV MEK 5 30.2, 29-31.5 8
Lighl scattering measurements : MI('
II MEK 5 328,000 288•000- 360,000 2) III MEK 5 960,000 840,000- 1,050,000 22 IV MEK 4 110,300 96,000- 124.000 25
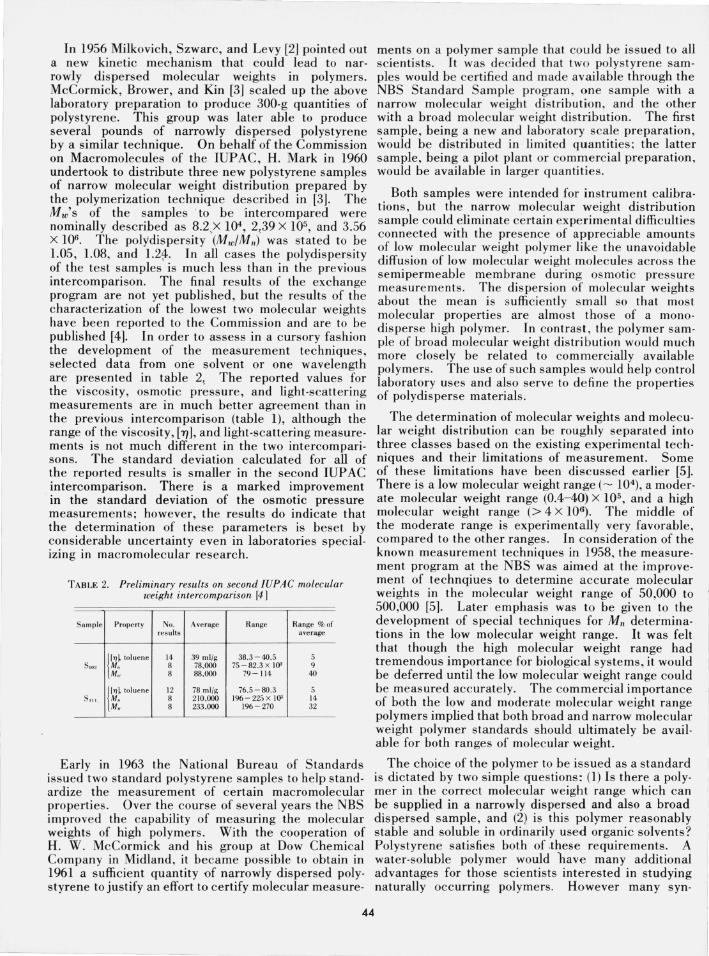
In 1956 Milkovich, Szwarc, and Levy [2] pointed out a new kinetic mechanism that could lead to narrowly dispersed molecular weights in polymers. McCormick, Brower, and Kin [3] scaled up the above laboratory preparation to produce 300-g quantities of polystyrene. This group was later able to produce several pounds of narrowly dispersed polystyrene by a similar technique. On behalf of the Commission on Macromolecules of the IUPAC, H. Mark in 1960 undertook to distribute three new polystyrene samples of narrow molecular weight distribution prepared by the polymerization technique described in [3]. The Mw's of the samples ' to be 'intercompared were nominally described as 8.2"X 10\ 2,39 X 10⁵ , and 3.56 X 10⁶. The polydispersity (Mw/Mn) was stated to be 1.05, 1.08, and 1.2;1<. In all cases the polydispersity of the test samples is much less than in the previous intercomparison. The final results of the exchange program are not yet published, but the results of the characterization of the lowest two molecular weights have been reported to the Commission and are to be published [4]. In order to assess in a cursory fashion the development of the measurement techniques, selected data from on'e solvent or one wavelength are presented in table 2, The reported values for the viscosity, osmotic pressure, and light-scattering measurements are in much better agreement than in the previous intercomparison (table 1), although the range of the viscosity, ['TI], and light-scattering measurements is not much different in the two intercomparisons. The standard deviation calculated for all of the reported results is smaller in the second IUP AC intercomparison_ There is a marked improvement in the standard deviation of the osmotic pressure measurements; however, the results do indicate that the determination of these parameters is beset by considerable uncertainty even in laboratories specializing in macromolecular research.
TABLE 2. Preliminary results on second IUPAC molecular weight intercomparison [41
Sample Prope rty No, Average Range Range % of results average
{''1~ toluene 14 39 ml/g 38,3 - 4<) .5 5 SIU~ M, 8 78,000 75 - 82,3 x I(}' 9
M" 8 88,000 79 - 114 4<)
{''1~ toluene 12 78 ml/g 76,5 - 80,3 5 Sill M, 8 210,000 196- 225 x I(}' 14
M", 8 233,000 196 - 270 32
Early in 1963 the National Bureau of Standards issued two standard polystyrene samples to help standardize the measurement of certain macromolecular properties. Over the course of several years the NBS improved the capability of measuring the molecular weights of high polymers_ With the cooperation of H. W. McCormick and his group at Dow Chemical Company in Midland, it became possible to obtain in 1961 a sufficient quantity 'Of narrowly dispersed polystyrene to justify an effort to certify molecular measure-
ments on a polymer sample that could be issued to all scientists. It was decided that two polystyrene samples would be certified and made available through the NBS Standard Sample program, one sample with a narrow molecular weight distribution, and the other with a broad molecular weight distribution. The first sample, being a new and laboratory scale preparation, would be distributed in limited quantities; the latter sample, being a pilot plant or commercial preparation, would be available in larger quantities.
Both samples were intended for instrument calibrations, but the narrow molecular weight distribution sample could eliminate certain experimental difficulties connected with the presence of appreciable amounts of low molecular weight polymer like the unavoidable diffusion of low molecular weight molecules across the semipermeable membrane during osmotic pressure measurements. The dispersion of molecular weights about the mean is sufficiently small so that most molecular properties are almost those of a monodisperse high polymer. In contrast , the polymer sample of broad molecular weight distribution would much more closely be related to commercially available polymers. The use of such samples would help control laboratory uses and also serve to define the properties of polydisperse materials.
The determination of molecular weights and molecular weight distribution can be roughly separated into three classes based on the existing experimental techniques and their limitations of measurement. Some of these limitations have been discussed earlier [5]. There is a low molecular weight range (- 104), a moderate molecular weight range (0.4-40) X 105, and a high molecular weight range (> 4 X 10⁶). The middle of the moderate range is experimentally very favorable, compared to the other ranges. In consideration of the known measurement techniques in 1958, the measurement program at the NBS was aimed at the improvement of technqiues to determine accurate molecular weights in the molecular weight range of 50,000 to 500,000 [5]. Later emphasis was to be given to the development of special techniques for Mn determinations in the low molecular weight range. It was felt that though the high molecular weight range had tremendous importance for biological systems, it would be deferred until the low molecular weight range could be measured accurately. The commercial importance of both the low and moderate molecular weight range polymers implied that both broad and narrow molecular weight polymer standards should ultimately be available for both ranges of molecular weight.
The choice of the polymer to be issued as a standard is dictated by two simple questions: (1) Is there a polymer in the correct molecular weight range which can be supplied in a narrowly dispersed and also a broad dispersed sample, and (2) is this polymer reasonably stable and soluble in ordinarily used organic solvents? Polystyrene satisfies both of ,these requirements. A water-soluble polymer would have many additional advantages for those scientists interested in studying naturally occurring polymers. However many syn-
44

thetic polymers, though not water soluble, are easily dissolved and stable in simple organic solvents. Polystyrene is not crystalline when it is derived from th e us ual free-radical or homogeneous anionic polymerization of styrene, yet it can be dissolved and handled in solution at high temperatures. Thus it can serve to s tandardize high temperature molecular weight measurements for crystalline polymers which are not soluble at lower temperatures as well. The unknown stereo-regularity of polystyrene is its only serious disadvantage for a macromolecular standard. Nevertheless, unknown stereo-regularity should not affec t any molecular weight measurements, although fractionation efficiencies and transport properties could, to some s mall extent, be affected.
The results of the envis ioned program to measure some of the molecular properties of a narrow and broad MWD polystyrene samples at moderate molecular weights will be presented in a series of papers. This first paper deals with the preparation, purity, and homogene ity of the samples referred to as NBS Polystyrene Standard Sample 705 and 706, respectively. Successive papers will discuss other aspects of the solution properties of these samples, s uc h as the ex tinction coefficien t, the partial specific volume, the osmotic press ures, turbiditi es, viscosities, and concentration gradients in a centrifugal field , measured at various initial concentrations in different solven ts, as well as the phase diagrams and fractionation curves determined by separations from two coexisting liquid phases.
2. Preparation of Samples
2.1. Polystyrene Standard Sample 70S
The styrene was polymerized in be nzene solution using butyl lithium by McCormick and co-workers [3]. The polymer was precipitated from the benzene solution by adding methanol. The precipitate was then dri ed in a vacuum oven for 15 to 20 hr at 75 °C. The fibrous precipitate was the n densified by calendering momentarily at 175 °C. The polymer was then ground, injection molded at a high temperature, and cut into pellets weighing approximately 10 mg.
2.2. Polystrene Standard Sample 706
Pme styrene was thermally polymerized at 140 °C to a conversion of 37.2 percent. The polymer was care fully heated and the residual monomer was pumped off at an elevated temperature. The polymer was the n injection molded and c ut into pellets weighing approximately 80 mg.
3. Sampling of Polymers
Polystrene 705 - The entire original sample, shipped in a carton, was placed in three amber jars. From each of these three jars, two 2;g samples were removed,
one about one-fourth the distance from the top of the jar, and the other about one-fourth the distance from the bottom of the jar. These six samples from six different locations constituted the samples for the study of the heterogeneity of the polymer, referred to later as heterogeneity samples. After the study of heterogeneity was concluded, two 50-g representative samples of the entire supply of polymer were formed by emptying and rebottling the e ntire sample while retaining one scoop from every twenty scoops, each scoopful weighing 10 g. These pooled and homogenized samples were called final samples. Measurements of the molecular properties were then made on these final samples.
Polystyreme 70o-Six lO-g samples were taken from the barrel of material to test the homogeneity of the sample. Each sample was taken from a different level of the barrel and at a different angular position with respec t to the center of the barrel. The first sample was taken near the top center and the other samples from positions which formed a spiral path of constant descent. Two 500-g final samples were formed by collecting alrernately 29 g of polymer from 250-g scoopfuls, while emptying the barrel. These pooled samples were then thoroughly mixed and called final samples. The measurements of the molecular properties were made on these final samples.
4. Heterogeneity of Samples
Polystyrene 705 - Since the polymer s tandards were initially planned for molecular weight calibrations, the tests for homogeneity of the sample were based on the simples t measurements related to molecular weight, namely, the measurement of the intrinsic viscosities in a good solVent and the osmotic pressures in an ideal solvent. The percent of volatiles in the samples also was measured for samples taken from the top and the center of the barrel of Polystyrene 706; however, the differences in volatile content were not significant compared to the experimental error in the determination.
Cyclohexane at 35°C was considered to be an ideal solvent for these samples, and the number-average molecular weight was therefore determined simply by the van't Hoff relation (M,. = RTc/7T) using a single, fixed concentration, where 1T is the osmotic pressure, c is the concentration, T is the absolute temperatme, and R is the gas constant. The osmotic pressures of two independently made solutions of each heterogeneity sample were determined in cyclohexane at 35°C. The osmotic pressure measure ments were made with 600 gel cellophane in osmometers described in refere nce [7]. Previous work [8] had es tablished the fact that the variation of ideality with molecular weight was very small, unless the end groups were quite different chemically from the backbone.
The intrinsic viscosities of the heterogeneity samples were determined in benzene at 2~ °C with an Ubbelbhde viscometer having a flow time of approximately 290 sec, and a maximum shear rate of - 1700
45
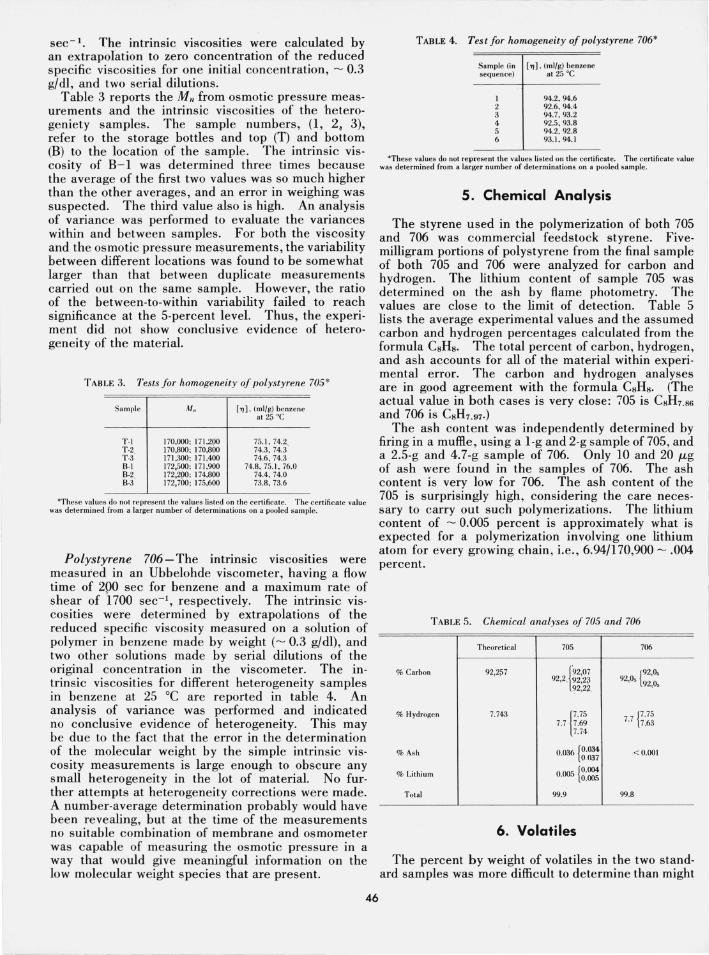
sec - 1. The intrinsic ViScosItIes were calculated by an extrapolation to zero concentration of the reduced specific viscosities for one initial concentration, - 0.3 g/dl, and two serial dilutions.
Table 3 reports the Mil from osmotic pressure measurements and the intrinsic viscosities of the heterogeniety samples. The sample numbers, (1, 2 , 3), refer to the storage bottles and top (T) and bottom (B) to the location of the sample. The intrinsic viscosity of B-1 was determined three times because the average of the first two values was so much higher than the other averages, and an error in weighing was suspected. The third value also is high. An analysis of variance was performed to evaluate the variances within and between samples . For both the viscosity and the osmotic pressure measurements, the variability between different locations was found to be somewhat larger than that between duplicate measurements carried out on the same sample. However, the ratio of the between-to-within variability failed to reach significance at the 5-percent level. Thus, the experiment did not show conclusive evidence of heterogeneity of the material.
TABLE 3. Tests for homogeneity of polystyrene 705*
Sa mple
T·I T·2 T .3' B·I B·2 B·3·
M"
170.000: 171.290 170.800: 170.800 171.300: 171.400 172,500: 171.900 172,290: 174.800 172,700: 175.600
["J. (mI/g) benzene at 2~ °c
75. 1. 74.2, 74.3. 74.3 74.6. 74.3
74.8. 75.1. 76.0 74.4. 74.0 73.8. 73.6
*Thcse va lues do not represent the values lis ted on the certificate. The certificate value was determined from a larger number of determinations on a pooled sample.
Polystyrene 706- The intrinsic ViscosItIes were measured in an Ubbelohde viscometer, having a flow time of 200 sec for benzene and a maximum rate of shear of '1700 sec-I, respectively. The intrinsic viscosities were determined by extrapolations of the reduced specific viscosity measured on a solution of polymer in benzene made by weight (- 0.3 gfdl), and two other solutions made by serial dilutions of the original concentration in the viscometer. The intrinsic viscosities for different heterogeneity samples in benzene at 25°C are reported in table 4. An analysis of variance was performed and indicated no conclusive evidence of heterogeneity. This may be due to the fact that the error in the determination of the molecular weight by the simple intrinsic viscosity measurements is large enough to obscure any small heterogeneity in the lot of material. No further attempts at heterogeneity corrections were made. A number-average determination probably would have been revealing, but at the time of the measurements no suitable combination of membrane and osmometer was capable of measuring the osmotic pressure in a way that would give meaningful information on the low molecular weight species that are present.
46
TABLE 4. Test for homogeneity of polystyrene 706*
Sample (i n ["J. (mI/g) benzene sequence) at 25 °C
1 94.2.94.6 2 ~2 .6. 94.4 3 94.7. 93.2 4 92.5.93.8 5 94.2.92.8 6 93. 1. 94. 1
*Thcse values do not represent the values li s ted on the certifi cate. The certificate value was determined from a larger number of determinations on a pooled sample.
s. Chemical Analysis
The styrene used in the polymerization of both 705 and 706 was commercial feedstock styrene. Fivemilligram portions of polystyrene from the final sample of both 705 and 706 were analyzed for carbon and hydrogen. The lithium content of sample 705 was determined on the ash by flame photometry. The values are clos e to the limit of detection. Table 5 lists the average experimental values and the assumed carbon and hydrogen percentages calculated from the formula CsHs. The total percent of carbon, hydrogen, and ash accounts for all of the material within experimental error. The carbon and hydrogen analyses are in good agreement with the formula CsHs. (The actual value in both cases is very close: 705 is CSH7.S6
and 706 is CSH7 .!J7.)
The ash content was indepe ndently determined by firing in a muffle, using a I-g and 2-g sample of 705, and a 2.5-g and 4.7-g sample of 706. Only 10 and 20 J-tg of ash were found in the samples of 706. The ash content is very low for 706. The ash content of the 705 is surprisingly high, considering the care necessary to carry out such polymerizations. The lithium content of - 0.005 percent is approximately what is expected for a polymerization involving one lithium atom for every growing chain, i.e., 6.94/170,900 - .004 percent.
TABLE 5. Chemical analyses of 705 and 706
Theoretical 705 706
% Carbon 92,2~7 {.92.07 {92,0, 92,2. 92;2~ 92,0, 92,0,
92,27.
% Hydrogen 7.743 r75 77 r-75 7.7 7.69 . 7.63
7.74
% Ash 0.036 {g.~ < 0.001
% Lithium 0.005 {g:~
Total 99.9 99.8
6. Volatiles
The percent by weight of volatiles in the two standard samples was more difficult to determine than might

be ex pec ted. Since both samples were pre pared in their final form in the same manner, namely, de volatilization at high temperatures and reduced pressure , followed by extrusion, it is not surprising that both samples contain appreciable amounts of volatiles. For 70.5 the volatiles would primarily be benzene, for 70.6 the volatiles would be styrene. Both volatile contaminants are good solvents for the polymer and both have the same molecular size as the polymer re peating unit so that the diffusion of the last traces of the residual volatiles might be very difficult below the glass temperature of polystyrene (90. to 10.0. °C).
A drying apparatus had been constructed which allowed relatively large samples ( - 100. mg) to be dried unde r a high vacuum (- 10- 6 mm Hg) for long times at various temperatures. One diffi c ulty with any si m pie drying technique is the necessity of crushing the pellets in air to allow better diffusion of the trapped so lvent out of the polyme r into the cold trap. Table 6 reports th e res ults of drying th e polym er several tim es unde r diffe rent conditions of time and te mperature. Neither the length of time (greater than 18 hr), nor the te mpe rat-ure (greater than 10.0. °C), made mu ch difference in the weight loss . Th e average value is calculated for the weight loss at 100. °C over approximate ly 20. hr. If the c rus hin g of 70.6 is continu ed vi go rou sly for a long time , the we ight loss is found to be less than 0..8 percent.
TABLE 6. Volatiles in 705 and 706 by weight loss m.easurements
Sample 705
Run % Loss Time (hr) Temp. oC
I 0.49' 18 100 .49 42 100 .51 24 11 5
2 .37* 24 100 3 .69 ' 22 100
(Ave)* 0.52
Sample 706
0.68' 18 100 .67 42 100 .73 24 l iS
2 1.01 ' 24 100 3 0.67 ' 18 100 4 .91 * 18 100
(Ave)* 0.82
Sampl es of both 70.5 and 70.6 were heated to 100. °C in se parate closed containers for 8 hr. The co ntain ers we re the n cooled in liquid nitrogen in ord er to pump off the res idual air. The co ntainers we re th e n warmed to room tempe rature, and the volatilized material was analyzed mass s pec trometrically. Unde r these conditions the weight loss was very s mall (- 0.% for 70.5 and 0..0.1 % for 70.6). Th e analysis of the volatiles produced in the above treatm e nt s howed mainly water (92 mole perce nt in 70.5, 97 in 70.6) with traces of be n-
zene in 70.5 (8 mole percent) and styrene in 70.6 (3 mole percent). The major contaminants, benzene and styre ne, are those volatiles to be expected from the sample pre paration, although the adsorbed water is the predominant species pumped off at room temperature. The determination of the res idual styrene by a spectrophotometric analysis is di scussed in a succeeding paper.
An analysis of the thermal degradation of both 70.5 and 70.6 appears in reference [9J. The weight loss in achieving the lowest temperatures reported for the kinetic studies (- 350. °C) was about 0..5 percent for 70.5 and 1 percent for 70.6.
7. Packaging
Th e packaging was carried out to avoid those pellets whi c h had some gross physical impe rfections , suc h as occluded foreign matter. Sample 70.5 is packaged in 2-g lots in amber bottles to minimize degradation. Sample 70.6 is paGkaged in 2p-g amounts. A small quantity has been s tored in a freezer and will be co mpared in a few years with samples stored at room te mperature.
Th e author thanks the following scientists both in and outside of the NBS ,who have helped in this standards effort: H. McCormick and R. Boyer of the Dow Chemical Company, who arranged to make the polyme rs available to the NBS program ; G. M. Kline and N. Bekkedahl for initiating the program ; J. Mandel for the s tati sti cal analysis of so me of the data; R. A. Paulson for the c he mical analyses; and J. H. O'Mara, D. E. Roberts, J. McElwain, and D. S tarr for many of th e meas ure me nt s and th e d e tail e d handlin g procedures.
8. References
[II H. P. Frank and H. Mark , J. Polyme r Sci. 10, 129 (1953). [21 R. Milkovich, M. Szwarc, and M. Le vy, J. Am. C he m. Soc., 78,
2656 (1956). [31 H. W . McCormick, F . M. Brower, and L. Kin , J. Polymer Sci.
39,87 (l959). [41 Private communication, Dr. Mark. [51 D. Mcintyre, Unsolved Problems ' in Polymer Science, NAS
NRS Publication No. 995 (1962). [61 Don ald Mcintyre, Symposium on Plastics Testing ; and Stand·
ardi zation , ASTM Spec ial Tec hnical Publicatiun No. 2~7 (1958).
[7J Dunald Mcintyre, .!. Res. NBS 62,63(1959)( RP 293 1). [8] Donald Mcintyre. J. H. O'Mara, a nd B. C. Kunuuc k, J. Am.
C he m. Suc. 81, 3498 (1959). [lJl L. A. Wall , S . S tra us , J. H. Fl ynn , D. Mc lnl yre, a nd R. S imha,
J. Ph ys . Che m. 70, 53 (1966).
(pape r 7lAl- 435)
47 236-4 31 0-67-4