Preparation of the USDA World Ag Supply & Demand Estimates ... · World Ag Supply & Demand...
28
United States Department of Agriculture(USDA) Sarah Hoffman, USDA-NASS Preparation of the USDA World Ag Supply & Demand Estimates (WASDE) Report 1
-
Upload
trinhthien -
Category
Documents
-
view
220 -
download
0
Transcript of Preparation of the USDA World Ag Supply & Demand Estimates ... · World Ag Supply & Demand...

United States Department of Agriculture(USDA)
Sarah Hoffman, USDA-NASS
Preparation of the USDA
World Ag Supply & Demand Estimates (WASDE) Report
1

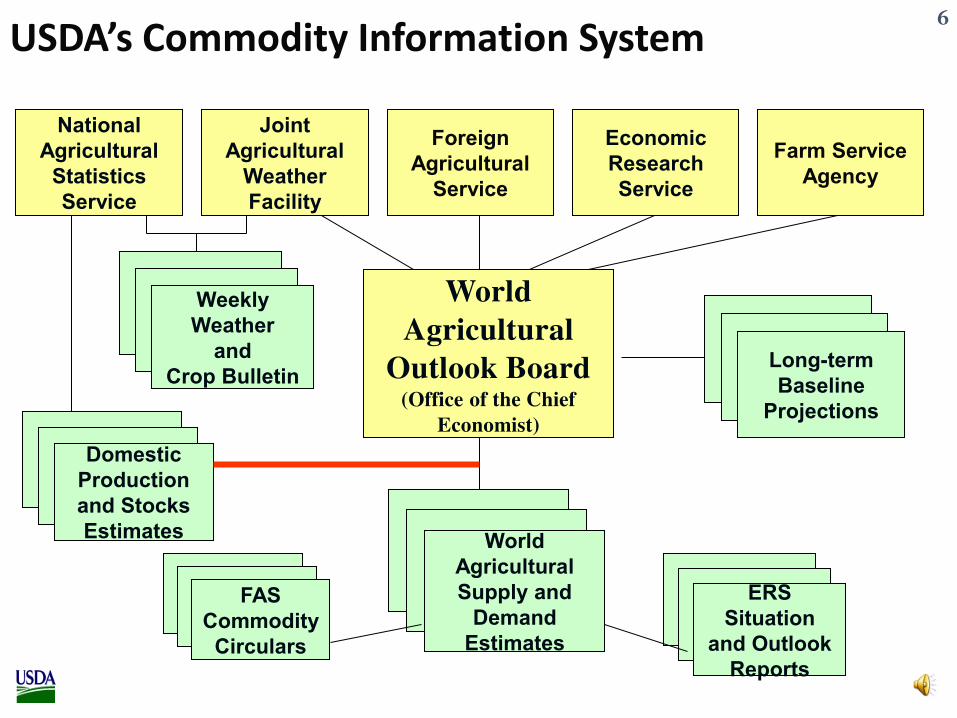
Agenda
History – Why does the US track Global Production?
O er ie of U“DA s Co odity I for atio “yste
Balance sheet approach
Detailed look at how USDA-FAS monitors and generates production estimates
2

Why does USDA track Global Production?
• The “o iet Grai Deals of the early 97 s • USDA failed to predict an increase in import demand for U.S. grain
due to crop failures in the Soviet Union (1972)
• International merchants quietly bought up U.S. grain supplies before the prices reflected the shortage – (Asymmetrical information)
• Embargos on U.S. exports were imposed to stabilize prices, which ran ou ter to far ers i terest
• U.S. Food inflation increase – serious social issue for the U.S.
• This led to major changes within U.S. agriculture

Changes to USDA in 97 ’s
• U.S. Exports were registered for major commodities • What could not be disputed was the fact that the U.S. government still
lacked a clear idea of what went on in its own grain markets. That August [1973] Congress amended the Agricultural Act to establish a mandatory reporti g syste i the U“DA fro Merchants of Grain by Dan Morgan
• One USDA number was needed • The age ies urre tly i ol ed ere doi g si ilar ork a k i the 97 s
but that information was NOT coordinated sufficiently and it need to be strengthened.
• Created the World Agricultural Outlook Board
•We will watch • No information on foreign agriculture will be taken Carte Blanche (we will
monitor and review)
• The need for quality market information has only become greater.

Agenda
History – Why does the US track Global Production?
O er ie of USDA’s Co odity I for atio Syste
Balance sheet approach
Detailed look at how USDA-FAS monitors and generates production estimates
5
USDA’s Commodity Information System
Farm Service
Agency
Joint
Agricultural
Weather
Facility
Foreign
Agricultural
Service
Economic
Research
Service
National
Agricultural
Statistics
Service
ERS
Situation
and Outlook
Reports
Weekly
Weather
and
Crop Bulletin
World
Agricultural
Outlook Board (Office of the Chief
Economist)
Domestic
Production
and Stocks
Estimates World
Agricultural
Supply and
Demand
Estimates
FAS
Commodity
Circulars
Long-term
Baseline
Projections
6

Agenda
History – Why does the US track Global Production?
O er ie of U“DA s Co odity I for atio “yste
Balance sheet approach
Detailed look at how USDA-FAS monitors and generates production estimates
7

Foreign Country Commodity Balance Sheets
= SUPPLY DEMAND
Beginning
Stocks Production + + Imports = Exports +
Domestic
Use + Ending
Stocks
Private
(On-farm)
(Pipeline)
Government
Area
Yield
Commercial
Concessional Feed
Residual
Food, Seed,
Industrial
WAOB Chaired Meetings:
Cotton, Oilseeds, Rice, Wheat, Coarse Grains
Participating USDA Agencies: WAOB, ERS, JAWF, FAS
WASDE Report
8
Commodity Prices

Foreign Country Commodity Balance Sheets
= SUPPLY DEMAND
Beginning
Stocks Production + + Imports = Exports +
Domestic
Use + Ending
Stocks
Private
(On-farm)
(Pipeline)
Government
Area
Yield
Commercial
Concessional Feed
Residual
Food, Seed,
Industrial
WAOB Chaired Meetings:
Cotton, Oilseeds, Rice, Wheat, Coarse Grains
Participating USDA Agencies: WAOB, ERS, JAWF, FAS
WASDE Report
9
Commodity Prices
Agenda
History – Why does the US track Global Production?
O er ie of U“DA s Co odity I for atio “yste
Balance sheet approach
Detailed look at how USDA-FAS monitors and generates production estimates
10

USDA-FAS Provides: Crop Condition Assessment,
Monitoring and Crop Estimates
• Monthly
• 17 Global Commodities
• 159 Countries
• 1020 Country-Crop Pairs (e.g. Australia-Wheat)
• 3 attributes: Area, Yield and Production
11

USDA-FAS Operational Approach to Global Crop Assessment and Monitoring
Satellite Imagery
Attaché Reports/GAIN
Crop Travel/Ground Truth
Official Data/Government
Crop & Soil Models
Global Weather
Monthly Foreign Crop Condition
Monitor food-insecure nations
Regional and
Commodity
Analysis
Resources Analysis Results
Provide early warning of
crop disasters
12
News Reports/Private
Official U.S. government
Crop Production Estimate

NASA Satellites Used by FAS-OGA/IPA
USDA-FAS
uses data
from 8 out
of 18 of
NASA’s Earth
Observing
fleet. FAS
uses
additional
satellites
from ESA,
ISRO and
private
orgs.
13

6/27/2016
USDA-FAS: Satellites used for Production Estimates
Satellite Type What it measures? Example Comments
A Low resolution
Imager
vegetation vigor (a) MODIS-Terra & Aqua
(b) Suomi-NPP (VIIRS)
Workhorse for FAS
250 to 1000 meters;
transition to VIIRS
B LEO Precipitation precipitation (a) TRMM
(b) GPM
GPM is replacing TRMM
C Mid-resolution
Imager
vegetation vigor, crop type (a) Landsat-8
(b) Sentinel-2
10 to 60 meters; MuSLI
project
D Microwave
Imagers
surface soil moisture (a) SSM/I
(b) SMOS
(c) SMAP
Surface wetness data used in
soil moisture model
E GPS location (a) USA-201 (IIR-19) Field work; geotagging
F High resolution
Imager
field scale (a) WorldView-1
(b) WorldView-2
0.5 to 3 meters
G Synthetic
Aperture Radar
flooding (a) Sentinel-1
(b) RadarSat-2
all-weather
H LEO Altimetry heights of water bodies (a) OSTM/Jason-2
(b) Jason-3
Heights measured in
centimeters
14

Precipitation
• World Meteorological Organization (WMO) —station data
• Satellite-Derived Sources
• USAF: 557th USAF Weather Wing-Air Force Weather Agency (AFWA)
• NOAA: CMORPH
• NASA: Multi precipitation analysis (MPA with TRMM)
NASA: Global Precipitation Mission (GPM-IMERG)
UCSB: Climate Hazard Infra Red Precipitation-Stations (CHIRPS)
15
Each precip. source has some challenges:
WMO—need more stations and in better
locations.
Satellite—improve accuracy

World Meteorological Organization (WMO)
Daily Data Loaded Next Day:
• 24-hour Precipitation
• Max Temp
• Min Temp
• Snow Coverage
USDA-FAS Updates Assessment Database:
• Average Daily Temperature
• Cumulative precipitation
• Potential ET
• Soil Moisture
• Surface soil moisture
• Subsurface soil moisture
Daily weather data provided by
approximately 7000 WMO ground stations
Maximum Temperature Departure from Normal
16

Air Force Weather Data (557th Air Force Weather Wing-AFWA)
Daily AFWA Data Loaded Next Day:
• 24-hour precipitation
• Max Temp
• Min Temp
• Snow Coverage
• Actual and Potential ET
• Solar and IR Radiation
FAS Updates Assessment Database:
• Average Daily Temperature
• Cumulative precipitation
• Potential ET
• Soil Moisture
• Surface Soil Moisture
• Subsurface Soil Moisture
Daily Modeled Weather Data for 244,000
Locations (Grid Cells)
17

Crop Assessment Data Retrieval & Evaluation (CADRE) database system
• Daily weather data stored in CADRE
• Uses various models to quantify the effect weather has on crops
• Provides objective information in assessing :
• Crop condition
• Yield prospects
• Stress factors
• Production potential
• High quality weather data is critical
• Visit www.pecad.fas.usda.gov/cropexplorer to see aggregated output from CADRE.
Crop E plorer products are displa ed on the Internet every 10-days and for summer/winter growing seasons
18

USDA/FAS: Crop Explorer Web Portal (displays numerous weather and vegetation condition data sets
over major crop regions every 10-days)
Maps and time-series charts for:
● Weather Data (AWFA, WMO, CMORPH, MPA) Dekadal (10-day) precipitation & temperatures compared to climate normals
● Soil Moisture & Crop Models Modified Palmer two-layer soil moisture
Behind firewall: Crop calendars for wheat, corn, & sorghum and corn hazard/alarm model.
● Vegetation Indices (polar-orbiting satellites) GAC (8-km) (behind firewall)
SPOT-VEG (1-km)
MODIS (250-m)
● Daily MODIS Aqua and Terra (250-m)
● Lake/Reservoir Heights TOPOX/Poseidon,Jason-1, Jason-2
GFO
ERS, ENVISAT
19

10 day Crop Explorer System Updates Immediately
Latest observation data integrated into
new maps and charts on the: 1st, 11th,
21st of each month
Soil Moisture Vegetation Change
Vegetation Health
NDVI Precipitation Cumulative Precipitation
20

USDA-FAS has 96 foreign offices covering 167 countries
Foreign Agricultural Service
American In Country
FAS Regional coverage
No Coverage Or Staff
FAS Overseas staff, collect data, statistics, crop
progress, and agricultural market information
21

FAS: Global Agricultural Information Network (GAIN)
FAS Overseas staff, collect data, statistics, crop
progress, and agricultural market information
22
http://gain.fas.usda.gov/Pages/Default.aspx

What about analysis?
• Screen information – Reliability of source • Is the source providing consistent data with good supporting
information?
• Does the source have a political or market agenda?
• What is the sour e s tra k re ord?
• How many different sources confirm the same information?
• Balance Sheet relationships • Does supply=demand?
• Imports=exports?
• Yield consistent with history? With weather?
• Stocks:Use ratio reasonable?

More on Analysis
• Economic analysis • Economic analysis is essential for assembling and verifying estimates.
• Analyze data relations to see if they are consistent with economic principles, models, and past behavior.
• Does the story ake se se, oth for the i di idual esti ates a d i the aggregate?
• There is a large suite of tools used for analysis, but not every tool is used in every analysis situation.
• Information must be gathered, screened, and assembled into a cohesive whole.
• Putting together the WASDE is like putting together a complex puzzle.

Outputs: Reports • Principal Federal Economic Indicators: WASDE, FAS & NASS
• WASDE: www.usda.gov/oce/commodity/wasde/
• Part of Data.gov http://www.data.gov/
25

6/27/2016
• Gold Standard in Agricultural Market Information
• PSD Online http://apps.fas.usda.gov/psdonline/
• Part of Data.gov http://www.data.gov/
Production Supply and Distribution Database 26

Production Supply and Distribution Database
27