Preparation of iron-enriched baker’s yeast and its ...
30
Accepted Manuscript Preparation of iron-enriched baker’s yeast and its efficiency in recovery of rats from dietary iron deficiency Mohammad Aref Kyyaly, Chris Powell, Elshahat Ramadan PII: S0899-9007(15)00182-3 DOI: 10.1016/j.nut.2015.04.017 Reference: NUT 9518 To appear in: Nutrition Received Date: 30 September 2014 Revised Date: 14 April 2015 Accepted Date: 17 April 2015 Please cite this article as: Aref Kyyaly M, Powell C, Ramadan E, Preparation of iron-enriched baker’s yeast and its efficiency in recovery of rats from dietary iron deficiency, Nutrition (2015), doi: 10.1016/ j.nut.2015.04.017. This is a PDF file of an unedited manuscript that has been accepted for publication. As a service to our customers we are providing this early version of the manuscript. The manuscript will undergo copyediting, typesetting, and review of the resulting proof before it is published in its final form. Please note that during the production process errors may be discovered which could affect the content, and all legal disclaimers that apply to the journal pertain.
Transcript of Preparation of iron-enriched baker’s yeast and its ...
Accepted Manuscript
Preparation of iron-enriched baker’s yeast and its efficiency in recovery of rats fromdietary iron deficiency
Mohammad Aref Kyyaly, Chris Powell, Elshahat Ramadan
PII: S0899-9007(15)00182-3
DOI: 10.1016/j.nut.2015.04.017
Reference: NUT 9518
To appear in: Nutrition
Received Date: 30 September 2014
Revised Date: 14 April 2015
Accepted Date: 17 April 2015
Please cite this article as: Aref Kyyaly M, Powell C, Ramadan E, Preparation of iron-enriched baker’syeast and its efficiency in recovery of rats from dietary iron deficiency, Nutrition (2015), doi: 10.1016/j.nut.2015.04.017.
This is a PDF file of an unedited manuscript that has been accepted for publication. As a service toour customers we are providing this early version of the manuscript. The manuscript will undergocopyediting, typesetting, and review of the resulting proof before it is published in its final form. Pleasenote that during the production process errors may be discovered which could affect the content, and alllegal disclaimers that apply to the journal pertain.
MANUSCRIP
T
ACCEPTED
ACCEPTED MANUSCRIPT
Preparation of iron-enriched baker’s yeast and its efficiency in
recovery of rats from dietary iron deficiency
Mohammad Aref Kyyaly1,2, Chris Powell1, Elshahat Ramadan2
1Food sciences, Bioenergy and Brewing Science, University of Nottingham,
Loughborough, LE12 5RD, UK
2Faculty Agriculture, Department of microbiology, Ain Shams University, Cairo, Egypt
MANUSCRIP
T
ACCEPTED
ACCEPTED MANUSCRIPT
Abstract
Background
Iron is an important metal, essential for the health and function of mammalian cells. Despite
its key role, iron deficiency in humans is common worldwide, often leading to significant
health issues within the population. In this study we aimed to evaluate the potential for using
iron-enriched baker’s yeast as a source of iron, especially for the protection and recovery
from conditions related to anemia.
Methods
Iron-enriched yeast was prepared by cultivating cells on basal medium comprising different
concentrations of iron. The effects of iron supplementation on animal health were assessed by
feeding anemic rats with a variety of diets containing either inorganic iron, or iron-enriched
yeast. Body weight, iron bioavailability, blood parameters, and the activity of iron containing
enzymes (catalase) were studied.
Results
Iron accumulation in yeast cells increased with iron concentration, reaching a maximum of 15
mg/g when 32 mM Fe was applied. Rat groups fed on iron enriched yeast gave the highest
feed efficiency, iron bioavailability and hemoglobin concentration. The source of iron
supplementation influenced catalase activity in kidney tissues, increasing from 70 U/g tissue
in anemic rats to 90 U/g tissue (inorganic iron salt), 110 U/g tissue (inorganic iron salt and
non-enriched dry yeast), 145 U/g tissue (iron-enriched yeast 15 mg Fe/g) and 115 U/g tissue
(iron-enriched yeast 30 mg Fe/g). The histological study of tissues from liver, kidney, heart,
and spleen of rats from different groups showed that the damage observed in tissues of
anemic rats, was not observed after feeding with iron-enriched yeasts.
Conclusion
The results demonstrate that ingestion of iron-enriched yeast is more efficient than inorganic
treatment in recovery from iron deficiency, including tissue recovery in rats.
Key Words: Saccharomyces cerevisiae, Anemia, Fe, metal ions, malnutrition
MANUSCRIP
T
ACCEPTED
ACCEPTED MANUSCRIPT
Introduction
Although iron is an abundant metal, it has low bioavailability, and iron deficiency represents
one of the most common nutritional deficiencies worldwide with significant implications to
public health [1]. The average adult male (70 kg) has a total body iron content of
approximately 4 grams, which remains relatively constant throughout adult life [2]. This is
maintained by balancing loss of iron with assimilation via nutritional intake. Persistent
deviation in iron intake can result in either iron deficiency, or iron overload (hemosiderosis
and hemochromatosis) [2]. The most obvious manifestation of iron deficiency is anemia, but
lack of iron can also have an adverse effect on the immune system [3, 4] and cognitive
development [5, 6]. Iron is an essential nutrient since iron cofactors, including heme and
iron-sulfur clusters, are required for the activity of a number of enzymes involved in a range
of cellular processes. Furthermore, iron is also an important component of molecules that
undergo redox reactions in cells [7, 8]. Anemia and iron deficiency may cause serious
diseases, for example, anemia and iron deficiency are quite prevalent in patients with heart
failure. In the past few years, there has been an enormous interest in the subject of iron
deficiency and its management in patients with heart failure [9].
Since leavened bread, produced using Saccharomyces cerevisiae (baker’s yeast), is a staple
component of diets in many areas of the world, the potential for using yeast biomass
enriched with iron as a feed supplement has the potential to deliver a safe and efficient
mechanism for the prevention or recovery from anemia. Previous studies have shown that
iron bound to organic carriers, such as cytochrome C, catalase and other proteins and
enzymes in yeast cells, are more easily absorbed and have a reduced potential to be toxic
[10]. In addition, yeast biomass is known to be a good source of protein, amino acids and
vitamins, and has been shown to have a positive nutritional impact in animals and humans
[10]. Despite the suitability of yeast for nutrient transfer, the uptake, storage and utilization
of iron in Saccharomyces cerevisiae cells is tightly regulated. In particular, the metal uptake
and assimilation processes are complex and dependent on the chemistry of metal ions,
specific surface properties of the organism, cell physiology and the physico- chemical
influence of the environment [10]. Consequently, in this study the capacity of a baker’s yeast
strain to assimilate iron was determined, and the resulting iron-enriched baker’s yeast was
evaluated for its potential in alleviating symptoms of iron deficiency in Wistar rats.
MANUSCRIP
T
ACCEPTED
ACCEPTED MANUSCRIPT
Materials and Methods
Preparation of iron-enriched yeast
A commercial baker's yeast strain was obtained and isolated from the local market (Aleppo,
Syria). Yeast propagation was conducted in 250 ml Erlenmeyer flask containing 100 ml basal
medium (20g/l glucose, 0.5g/l yeast extract, 5g/l ammonium sulphate, 1g/l potassium
dihydrogen phosphate, 0.5g/l magnesium sulphate, pH adjusted to 5.2 with 5N NaOH). Yeast
cultures were enriched with iron by supplementation with ammonium iron (III) citrate in
concentrations of 0.5, 1, 2 and 4 % (W/V) corresponding to 16, 32, 64 and 128 mM Fe. The
cultures were incubated at 30°C for 24 h, with shaking at 150 rpm. In each instance the entire
cell culture was recovered by centrifugation, excess liquid was decanted and samples were
desiccated using a drying oven (Memmert, Egypt). Dried yeast samples were collected and
used for further analysis (iron content and as a nutritional supplement) as described below.
Evaluation of iron content in iron enriched yeast
After 24 h cultivation cultures were centrifuged (5 min, 4000 g) and the supernatant
discarded. The pellet was washed three times with distilled water in order to remove loosely
associated fraction of iron from yeast cell surface. Washed yeast biomass was dried at 105°C
until a constant mass was achieved, and digested by adding 1 ml of 65 % (v/v) HNO3 to 20
mg dry biomass, followed by heating for 30 min at 140°C. After cooling, samples were
diluted with distilled water to a final volume of 5 ml and the content of iron was analyzed by
Flame Atomic Absorption Spectrometry (FAAS) in the Agricultural Research Center, Giza,
Egypt. The amount of total iron was calculated per gram of dry weight (mg Fe/g-1 dry wt.) as
described previously [10].
Animals and diets
Forty-eight newly weaned male and female Wistar rats (initial body weight, 75 - 85g) were
obtained and housed individually in stainless steel, wire mesh bottom cages. A 12-h light:
dark cycle and an environmental temperature of 25 ±2°C were maintained. Newly weaned
rats were chosen since individuals of this age can be considered to be similar irrespective of
gender; physiological, hormonal or metabolic changes are not observed between males and
females at this early stage of life. This was verified in-house by analysis of data, which
showed that there was no difference between young rats based on gender distinction (data not
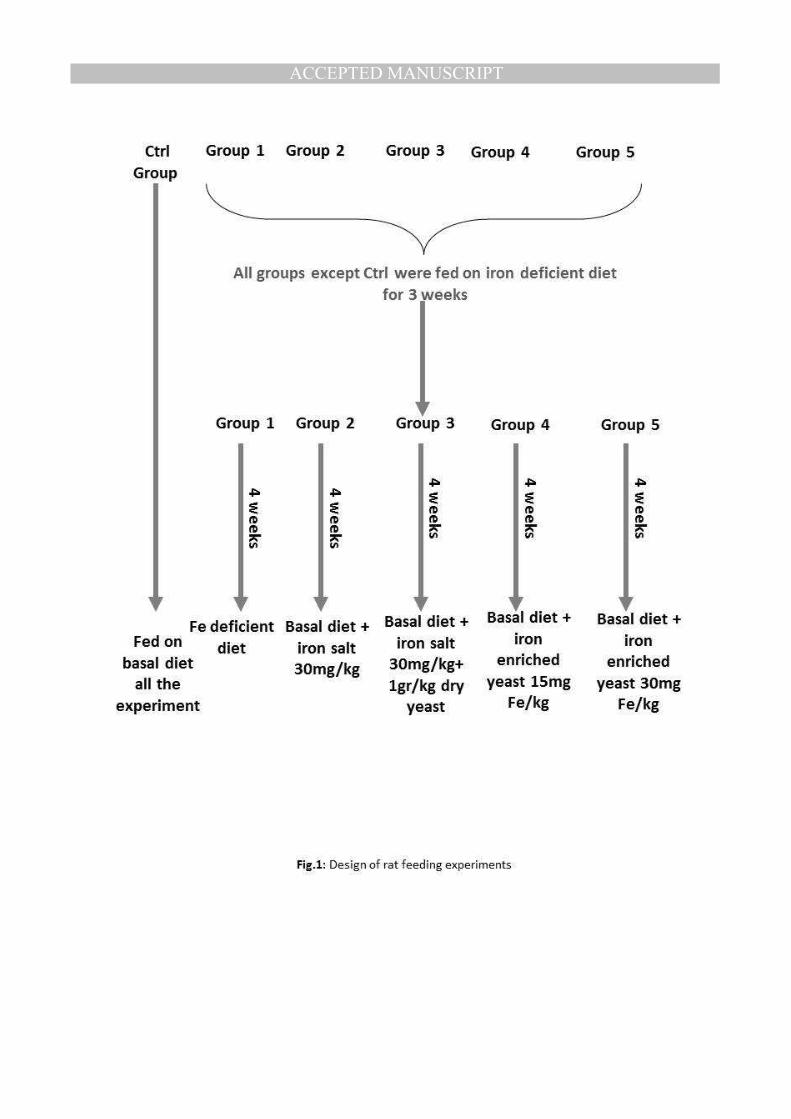
shown). Rats were randomly assigned to one of six dietary groups (eight rats per group) as
illustrated in Fig.1. The control group was fed on basal diet containing 30mg of Fe per
MANUSCRIP
T
ACCEPTED
ACCEPTED MANUSCRIPT
kilogram of diet for 56 days (total experiment time). Precise composition of the basal diet
used was based on Sun et al [11] and shown below.
Iron deficiency was induced as described by Hamdaoui et al [12] with minor modifications: a
low iron basal diet (3mg/Kg) was provided in conjunction with bleeding of 1-2 ml of blood
every week for four weeks until the Fe and Hemoglobin reached a designated low level (109-
112 g/L Hemoglobin and 3 mg body iron) . These anemic rats were assigned to five groups of
8 rats (four males and four females). Groups were examined by feeding on one of the
following diets for an additional 28 days: Group 1 was fed on basal Fe-deficient diet (no iron
added). Group 2 was fed on basal Fe-deficient diet plus FeSO4.7.H2O (30mg Fe/kg diet)
Group 3 was fed on basal Fe-deficient diet plus FeSO4.7.H2O (30 mg Fe/kg diet) plus 1 g of
non-enriched yeast per kg diet. Group 4 was fed on basal Fe-deficient diet plus iron-enriched
yeast (containing 15 mg Fe/kg diet). Group 5 was fed on basal Fe-deficient diet plus iron-
enriched yeast (containing 30 mg Fe/kg diet). Total food intake was determined at the end of
the experiment; it should be noted that in each instance all animals were marginally under-fed
in order to ensure that each individual ingested the total quantity of food provided.
The body weight of rats was measured every week throughout the 56 days of dietary
treatment. Blood (0.5ml) was collected after 14, 21, 28, 42, and 56 days of the dietary
program from their eyes into heparinized micro capillary tubes.
Basal Diet was prepared as follows: Skimmed milk(50% casein), 400 g/Kg diet; Corn starch,
603 g/Kg; Vegetable oil, 80 g/Kg; Sucrose, 50 g/Kg; Mineral mix, 40 g/Kg; Vitamin mix, 10
g/Kg.
The mixtures of minerals and vitamins were prepared according to [11] as follows:
Vitamin mix contained the following (g/kg mix): inositol, 25.0; ascorbic acid, 5.0; calcium
pantothenate, 0.67; thiamine hydrochloride, 0.27; pyridoxine hydrochloride, 0.53; nicotinic
acid, 1.0; menadione, 0.25; riboflavin, 0.27; p- amino benzoic acid, 0.50; folic acid, 0.067;
biotin, 0.26; all-rac-a-tocopherol acetate, 3.60; retinyl palmitate, 0.034; cholecalciferol, 0.21;
vitamin B-12 1 mannitol, 3.33; choline chloride, (70% solution), 71.50; cerelose, 887.8.
Mineral mix contained the following (g/kg mix): CaCO3, 139.7; CaHPO4, 166.6; K2HPO4,
133.6; NaCl, 21.2, MgSO4, 49.5; ZnCO3, 0.8; MnSO4.H2O, 0.61; CuSO4.5H2O, 0.66; KI,
0.0033; CrK(SO4).12H2O, 0.048; Na2SeO3, 0.015; Na2MoO4.2H2O, 0.0063, cerelose,481.1
MANUSCRIP
T
ACCEPTED
ACCEPTED MANUSCRIPT
Blood analysis
Hematocrit was measured by centrifugation of blood and expressed as the volume
percentage of red blood cells. Hemoglobin concentration was measured using a Hemoglobin
determination kit (Biodiagnostic Inc., Egypt). Serum iron concentration and total iron
binding capacity (TIBC) using iron and (TIBC) kit (Biodiagnostic Inc., Egypt).Transferrin
saturation (TS) was calculated from the ratio of serum iron/TIBC.
Catalase assay
Catalase activity was determined in plasma and kidney tissue after homogenate preparation by
tissue perfusion with a PBS (phosphate buffered saline) solution, pH 7.4 containing 0.16 mg /
ml heparin to remove any red blood cells and clots prior to dissection. Tissue was homogenized
in 5-10 ml cold buffer (50 mM potassium phosphate, pH 7.5. 1 mM EDTA) per gram of tissue;
the homogenate was then centrifuged at 10,000 rpm for 15 minutes at 4 °C. The supernatant
was removed and stored on ice. If the assay was not conducted on the same day, the sample was
frozen at -80°C. Catalase activity was estimated using a catalase assay kit (Biodiagnostic Inc.,
Egypt).
Calculation of iron bioavailability and feed efficiency
The iron (Fe) bioavailability from test meals was calculated for each animal based on initial
and final body weights, the initial and the final hemoglobin concentrations, and the amount
of Fe consumed during the repletion period. The initial and final concentration of
hemoglobin-Fe was computed according to equations 1, 2 respectively, assuming that 7.5%
of the body weight is blood and that hemoglobin contains 3.35mg Fe per gram as defined
previously [12].
The relative Fe bioavailability (equation 3) was calculated by dividing the % Fe
bioavailability from the test meals by the % Fe bioavailability for ferrous sulfate [RBV = (Fe
bioavailability from diets/Fe bioavailability from FeSO4) × 100]. The relative liver weight
was calculated by dividing the liver weight by the total body weight. The Fe status was
evaluated by determining the Fe stored in the liver for each rat. Feed efficiency was also
calculated according to equation 4.
MANUSCRIP
T
ACCEPTED
ACCEPTED MANUSCRIPT
Equation (1)
Initial Hb Fe [mg] = initial BW × (7.5 ml blood/100 g BW) × (initial Hb g/ 100ml) × (3.35mg
Fe/1g Hb)
Equation (2)
Final Hb Fe [mg] = final BW × (7.5ml blood/100g BW) × (final Hb g/100ml) × (3.35mg
Fe/1g Hb)
Where: BW = body weight, and Hb = hemoglobin.
Equation (3)
Fe bioavailability [%] = (final Hb Fe [mg] - initial Hb Fe [mg])/Fe consumed [mg]
Equation (4)
Feed efficiency % = BW gained/ total food intake
Where: BW gained = final BW – initial BW BW: body weight.
Tissue preparation for iron determination
After 56 days, animals were euthanized and their livers, hearts, kidneys, and spleens were
removed. 1-2 g of tissue was transferred into borosilicate test tubes and concentrated nitric
acid and perchloric acid were added to the contents. The contents were heated to 85°C for 24
h followed by 110°C for 5h. Digestion was determine to be complete by the appearance of a
colorless solution [13]. The iron concentration of samples was measured by inductively
coupled plasma emission spectrometry (ICPS-1000 II, Shimadzu, Faculty of Agriculture,
Cairo University).
Histological examination of tissues
Tissues derived from liver, kidney, and heart were stained with Hematoxylin-Eosin (H&E)
for histological examination, while the spleen was stained with Perls’ Prussian blue to
evaluate iron accumulated in different groups. Histological examinations of rat tissues were
performed in Cairo University, Faculty of Veterinary medicine as follows: Tissue samples
were fixed for 48 hours in neutral buffered formalin (NBF). Following the fixation
procedure, tissues were dehydrated through increasing concentrations of ethanol and
embedded in paraffin. Sections approximately 5-7 µm thick were cut from the paraffin
blocks and stained with H&E for routine histological examination, and with Perls’ Prussian
MANUSCRIP
T
ACCEPTED
ACCEPTED MANUSCRIPT
blue for iron pigment analysis.
Statistical analysis
All data obtained for yeast experiments reflects the mean of identical triplicate samples ± the
standard error. Where appropriate, statistical variation was determined using a two tailed
Student T-Test. A significant difference was identified at the 5% confidence level (P< 0.05).
For rat analysis, in each instance sample groups were comprised of 8 newly weaned
‘young’ individuals, with males and females considered to be identical as described
previously. Data was analyzed using a two tailed Student t-test to determine significant
differences between trial and control samples. A significant difference was identified at the
5% confidence level (P< 0.05).
MANUSCRIP
T
ACCEPTED
ACCEPTED MANUSCRIPT
Results
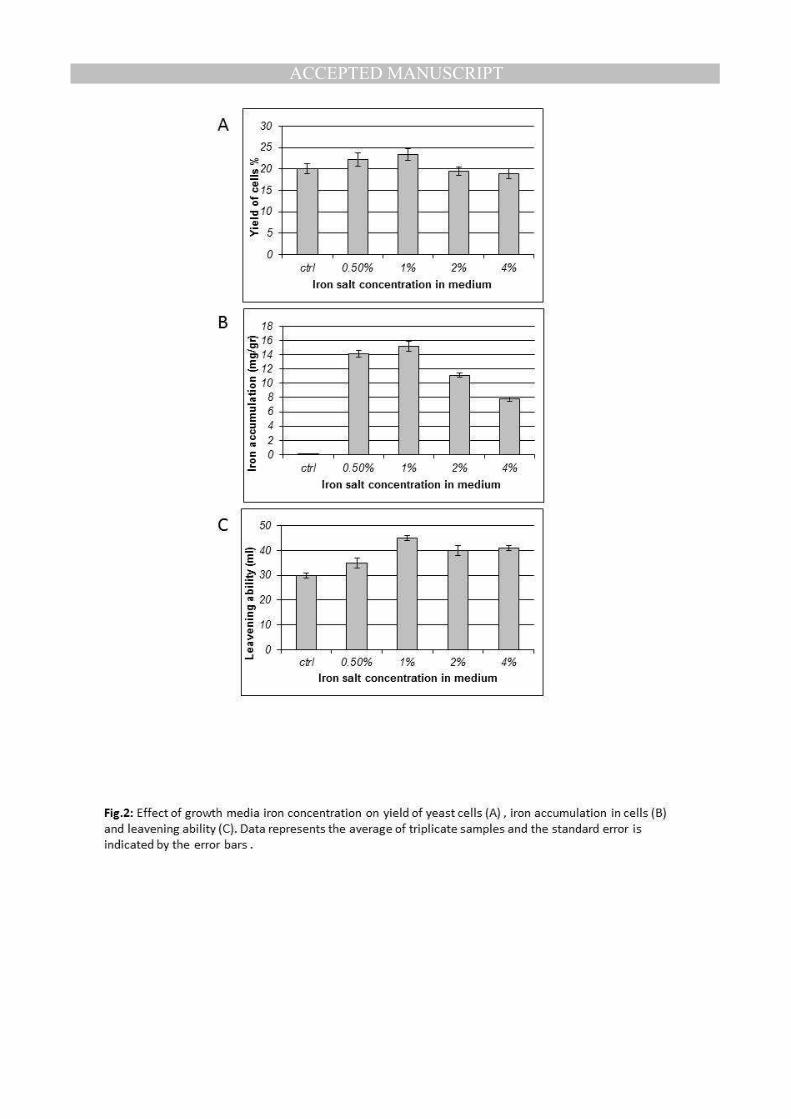
Yeast growth and iron accumulation- Yeast cells were grown at different concentrations of
iron in growth media in order to study the effect of iron concentration in growth medium on
the yield of cells, iron accumulation in cells and one of mail baking properties of the produced
cells (leavening ability). Results clearly showed that the yield of S.cerevisiae cells increased
as the concentration of iron increased until the iron concentration reached 32 mM Fe in
medium (1% iron salt) but at higher concentrations of iron the yield of cells decreased as
the iron concentration increased (Fig.2A ). The amount of iron accumulated in yeast cells also
increased and reached up to 15 mg/g at 32 mM Fe in medium (1% iron salt), while above that
concentration (64 and 128 mM) it dropped again. Yeast cells accumulated about 11 mg Fe/g
dry weight at 64 mM iron concentration, while the addition of 128 mM Fe inhibited iron
uptake by yeast cells, which was only 7 mg Fe/g (Fig.2B).
Effect of iron concentration on leavening ability- Leavening ability was studied for
yeast cells produced at different concentrations of iron. Data in Fig.2C revealed that all
yeast cells grown on different iron concentrations gave leavening ability higher than the
control (grown on basal medium). The leavening ability of yeast cells increased up to 32
mM Fe in medium, while above this concentration it dropped again but still higher
than control and the concentration of 1 % (32 mM Fe) improved the leavening ability by
50 % than control.
Statistical evaluation of different feeding treatments- Results in Table 1 indicate that
the differences in final body weights of rats from different groups were non-significant at
both 5 % and1 %, so this suggests that there is no significant difference between all
treatments. On the other hand, significant increases in body weights of rats were
observed in all groups, although the increase in group 1 (fed on iron deficient diet) was
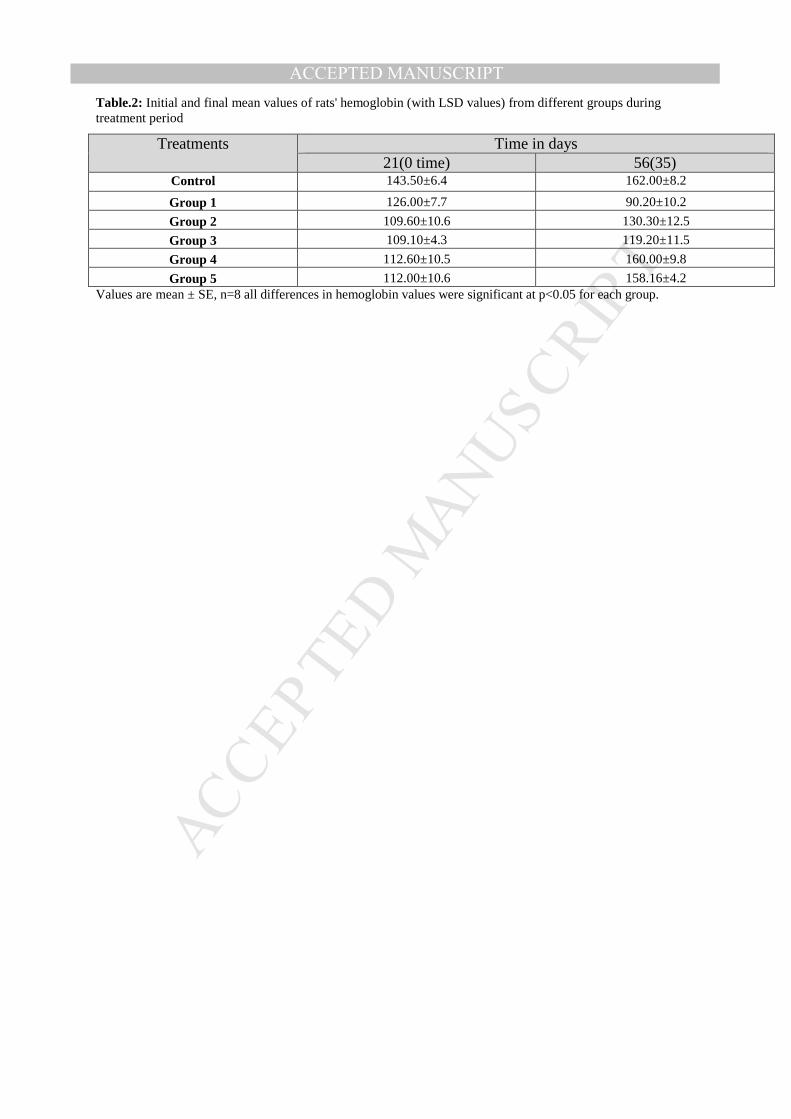
the least significant increase. Moreover, Table 2 shows that the increase of hemoglobin
levels in all groups were significant except in group 3 (fed on diet containing iron salt
plus yeast) which was non-significant at the level of 1 % and significant at 5 %. On the
other hand, there was a significant increase in hemoglobin levels of rats from groups 4 and
5 when compared with other treatments groups 2 and 3; these results prove clearly that
both groups 4 and 5 achieved better results than other treatments. Also when
comparing hemoglobin results from groups 4 and 5 with those from control group, it was
noticed that differences between hemoglobin levels of these groups and control group are
MANUSCRIP
T
ACCEPTED
ACCEPTED MANUSCRIPT
not significant but the result of group 4 was less significant (closer) to control group
which give this group (treatment) the advantage on the other group (group 5).
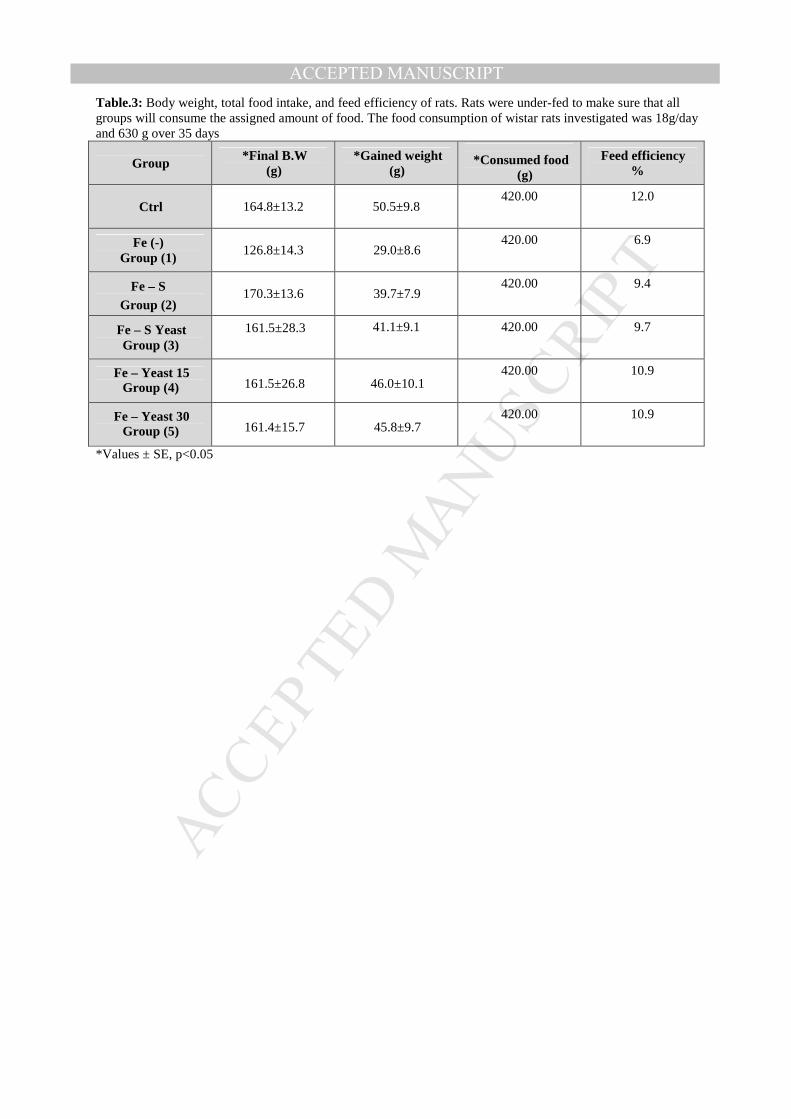
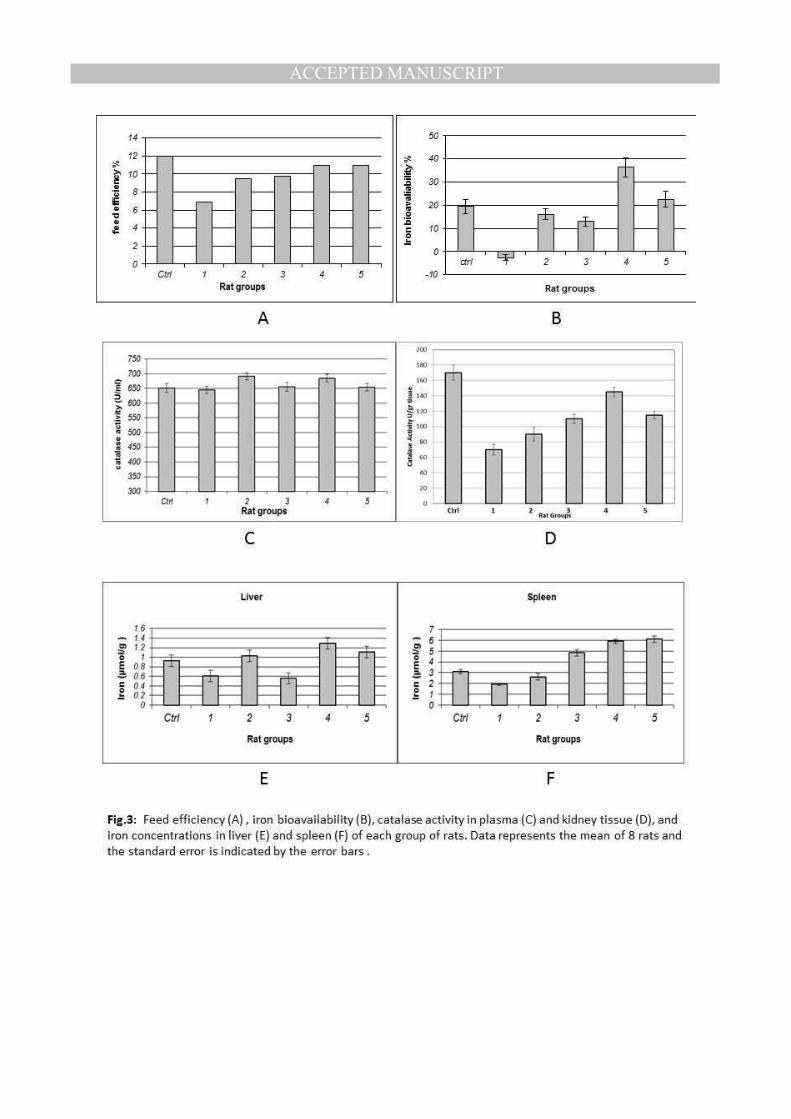
Iron bioavailability and feed efficiency- Feed efficiency and iron bioavailability were
studied and calculated during treatment period (4 weeks). Results indicate that animal
groups fed on iron enriched yeast (4 and 5) gave the highest feed efficiency (10.9 %) when
compared with other anemic groups (1, 2 and 3). These groups (4 and 5) gave 90.83 % of
feed efficiency of control group (which was fed normally), also the feeding efficiency of
groups fed on iron enriched yeast was increased 1.16 fold when compared with group 2
which was fed on basal medium plus inorganic iron salt(Fig.3A and Table 3).
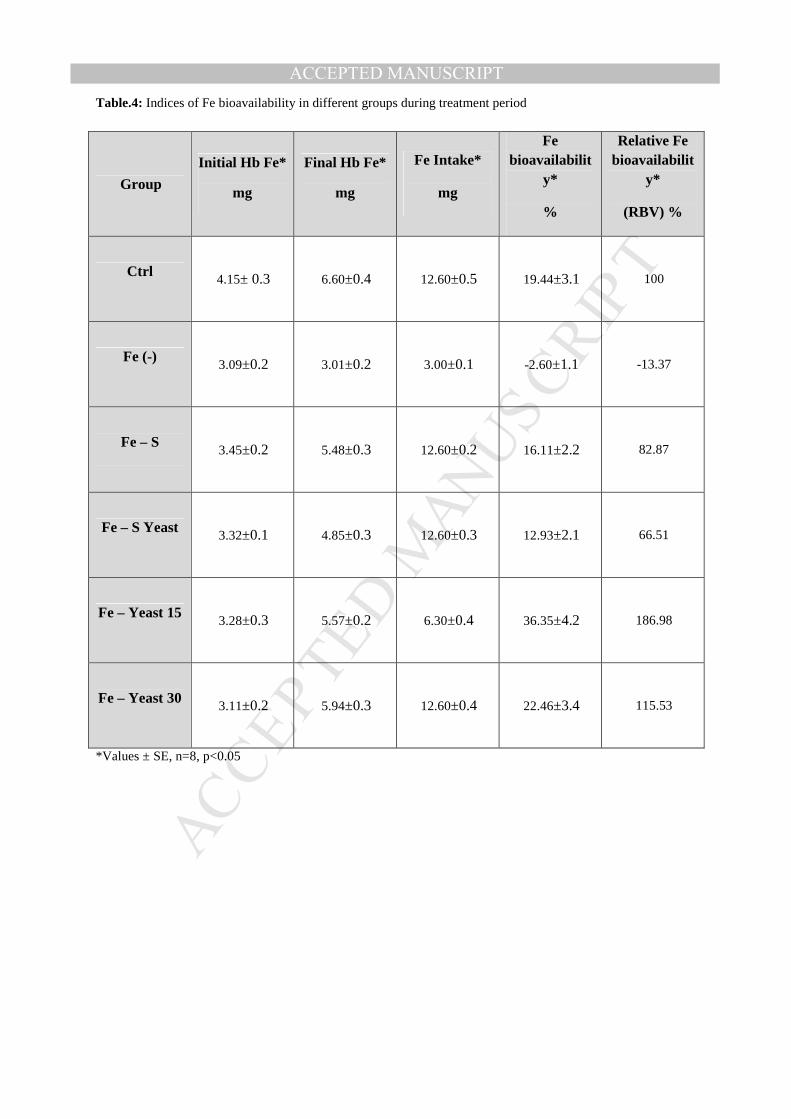
Regarding iron bioavailability, results obtained from Table 4 and Fig.3B show that the Fe in
group 4 (fed on iron yeast 15 mg/g) was significantly more bioavailable compared to
other groups (p<0.01), also the iron bioavailability in group 5 was more than other treatments
in groups 2 and 3. Results showed that Fe bioavailability increased to 22.46 % in group 5
when compared to that of control group where it was about 19.44 %, while Fe in groups 2
and 3 was less bioavailable than control group (16.11 % and 12.93 % respectively). The
highest Fe bioavailability was obtained in group 4 reached to about 36.35 %. Relative iron
bioavailability (RBV) gave the same trend of iron bioavailability and increased in groups 4
and 5 to give 186.98 and 115.53 % of control group, while (RBV) remained less than
control in the other groups.
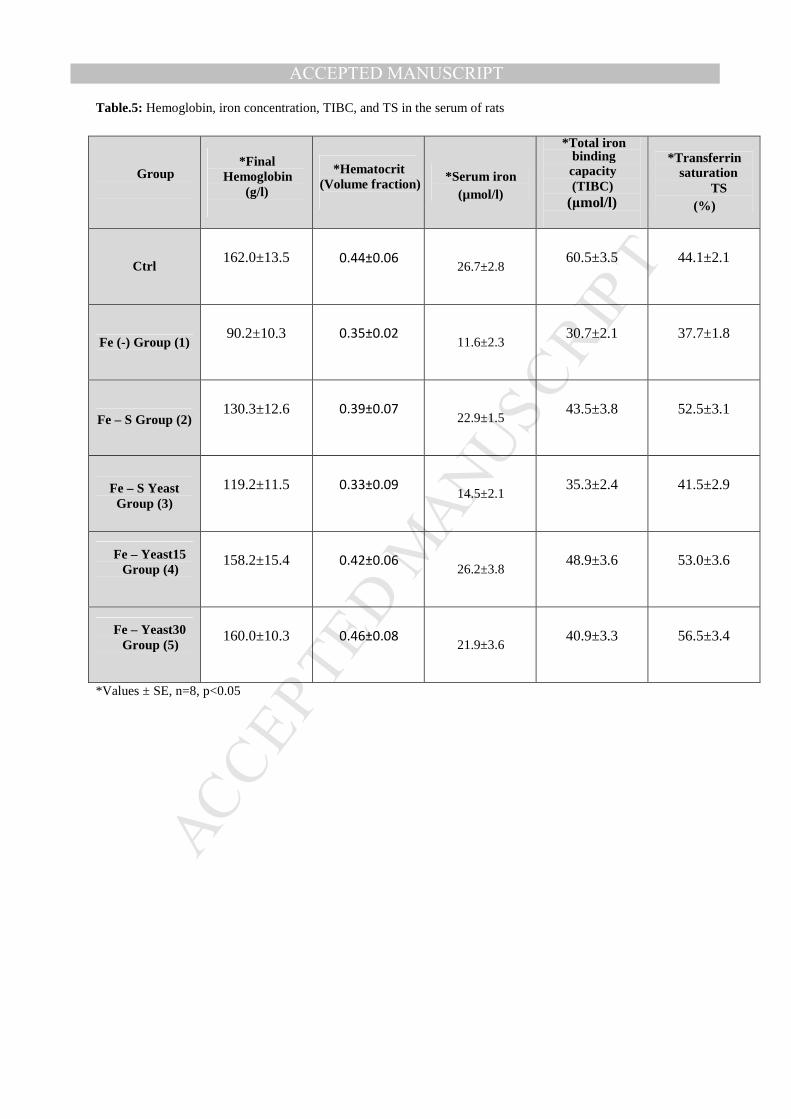
Blood parameters- Based on hemoglobin concentration and hematocrit value, iron in
groups 4 and 5 (fed on iron enriched yeast) was more bioavailable in rats and cured iron
deficiency when compared with other groups (1, 2 and 3), as shown in Table 5. In groups
2 and 3, hemoglobin concentration was less than that in the control group, whereas the
hematocrit value was also slightly less than that in control group at the end of
treatment period, indicating that the Fe bioavailability of the iron enriched yeast is
better than other treatments for recovery from iron deficiency. The recovery of iron
deficiency in groups 2 and 3 was poor when compared to that in groups 4 and 5, assuming
that the iron sources of iron enriched yeast are more effective than iron salt such as ferric
sulfate (group2). In the group supplemented with dry yeast besides iron salt (group 3)
yeast cells might have functioned as absorption inhibitor decreasing the bioavailability of
iron in rats When iron concentration in serum compared between different treatments
(groups 2, 3, 4, and 5) results showed that group 4 was subjected to the best treatment
(iron enriched yeast 15mg Fe/g dry weight) and the iron concentration in serum was similar
to that of control group, whereas iron concentrations in serum of groups 2 and 5 were
MANUSCRIP
T
ACCEPTED
ACCEPTED MANUSCRIPT
nearly equal but less than control group. Treatment of group 3 was the poorest one among
other treatments and only a slight increase of serum iron was observed when compared to
negative control (group 1) fed on iron deficient diet. Similar results were obtained when
comparing total iron binding capacity (TIBC) and transferrin saturation (TS) in different
groups. Results obtained from hemoglobin analysis showed that groups 4 and 5 were
subjected to the best treatments than other treatments, whereas group 4 also gave the best
results in other blood parameters studied when compared to other groups.
Enzymatic activity of iron dependent enzyme (catalase activity)- Results shown in
Fig.3C indicates that the iron restricted diet didn't affect the catalase activity in plasma
during moderate iron deficiency anemia development (4 weeks) period in this experiment
this may be because the period was not enough to affect the catalase activity in plasma.
Catalase activity in kidney was also studied. Fig.3D shows the catalase activity in kidney
tissues of rats from different groups. In contrast of plasma, results obtained from figure 3D
showed that the catalase activity in kidney tissues of anemic rats decreased. Different
treatments raised the catalase activity from 70 U/g tissue in anemic rats to 90 U/g tissue in
group 2 (iron salt added), 110 U/g tissue in group 3 (iron salt and dry yeast added), 145 U/g
tissue in group 4 (iron enriched yeast 15 mg Fe/g diet added) and 115 U/g tissue in group
5 (iron enriched yeast 30 mg Fe/g diet added). Although the improvement was less than
aimed, the previous results suggest that the treatment applied in group 4 (iron enriched
yeast 15 mg Fe/g diet) is the best treatment that can be used in the treatment of iron
deficiency, but it may need more time than used in this experiment (4weeks) to achieve
complete recovery of catalase activity in kidney tissues.
Iron accumulation in tissues- Data shown in Fig.3E shows that the reduction of iron
concentration in liver tissues was about 34% (from 0.93 µmol/g in control group to 0.61
µmol/g in anemic rats group 1) but it was completely recovered in group 2 to reach 1.03
µmol/g, but the highest concentration of iron was accumulated in liver tissues of rats fed on
iron enriched yeast in group 4 which was 1.29µmol/g. On the other hand, iron concentration in
spleen tissues shown in Fig.3Fwas gradually increased in different treatments from
1.93µmol/g in anemic rats (group 1) to 2.6µmol/g and 4.85µmol/g in groups 2 and 3
respectively, and reached its maximum of 5.9 and 6.1µmol/g in groups 4 and 5, respectively.
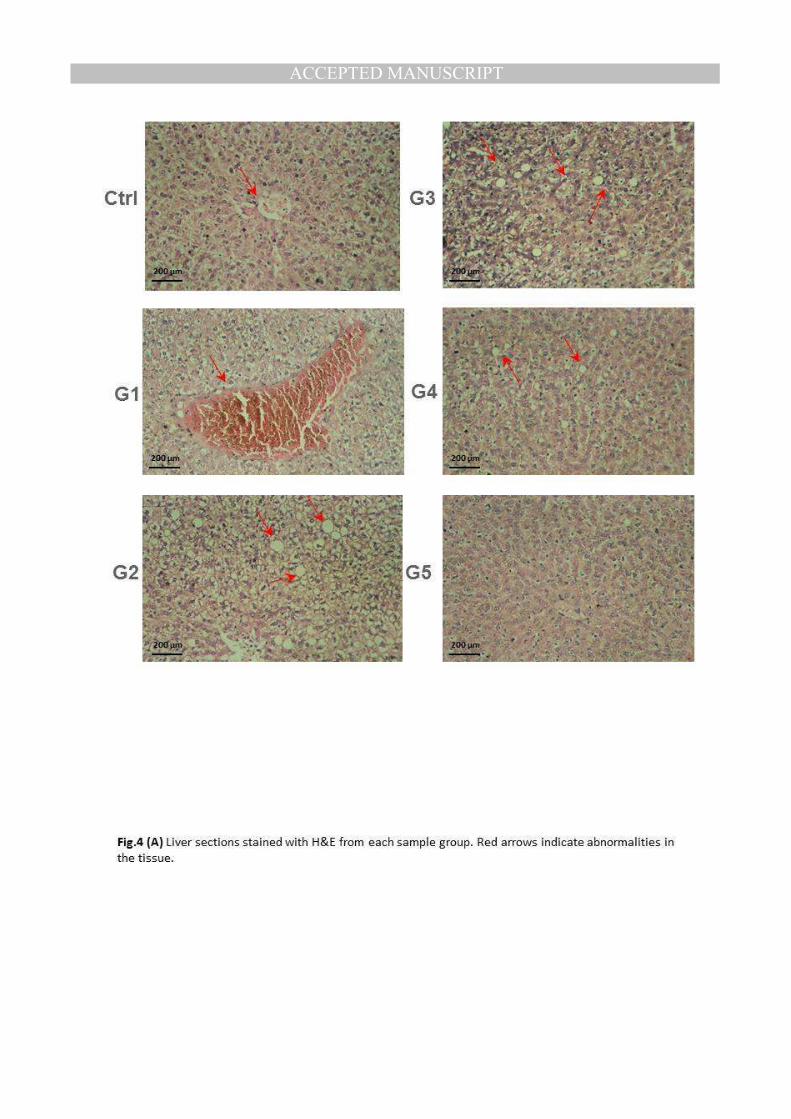
Histological examination of tissues- Analysis of rat liver sections (Figure 4A) indicated that
livers from the control group showed no histological changes apart from hydropic degeneration
of hepatocytes (Ctrl). However, liver of rat from group 1 (G1) revealed vacuolar degeneration of
hepatocytes. Examined liver of rat from group 2 (G2) showed marked dilatation and
MANUSCRIP
T
ACCEPTED
ACCEPTED MANUSCRIPT
congestion of central vein as well as hydropic degeneration of hepatocytes. Meanwhile, liver
of rat from group3 (G3) revealed no histopathological changes. Liver of rat from group 4
(G4) showed vacuolar degeneration of some hepatocytes. Moreover, liver of rat from
group 5 (G5) showed vacuolar degeneration of hepatocytes. Histological study of liver
showed that a clear damage was observed in the livers of anemic rats (G2), but the damage
was decreased by different treatments, and the best results were obtained in groups 4 and 5.
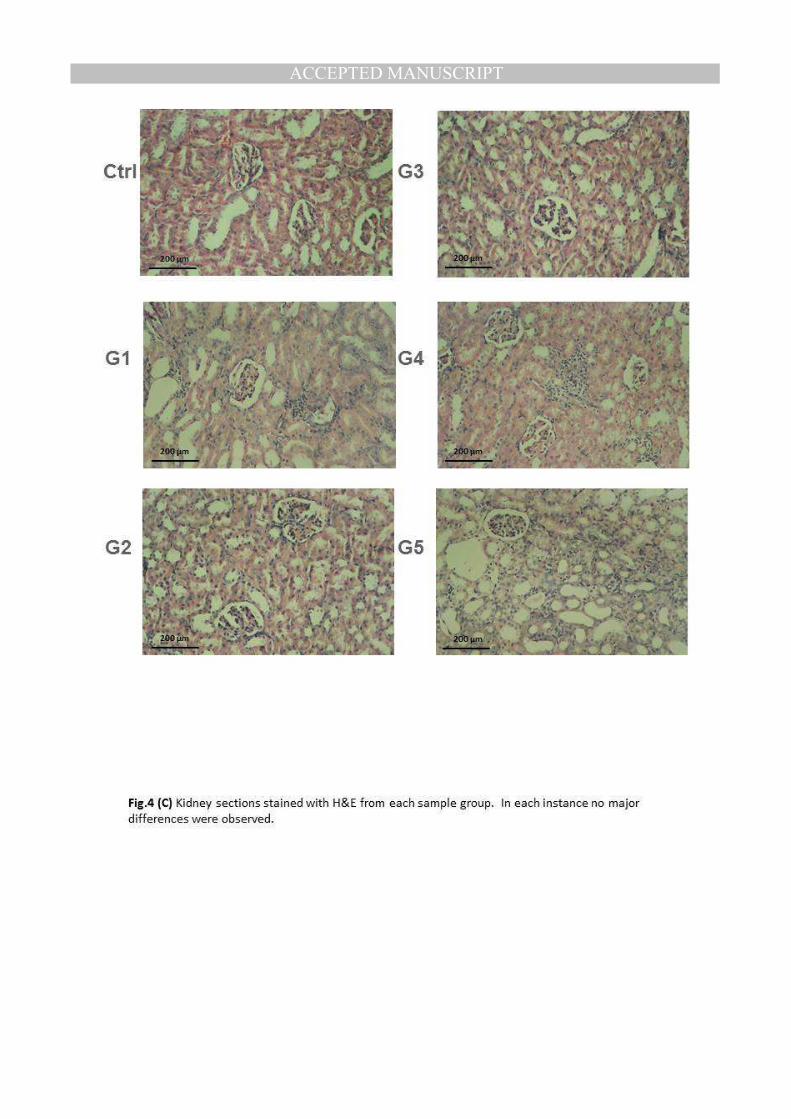
Kidneys of rats from control group (Ctrl) revealed the normal histological structure of renal
parenchyma. Meanwhile, kidneys of rats from group 1 showed peritubuler leucocytic
cells infiltration and perivasculitis (G1). However, kidneys from rats of group 2 revealed
no histological changes (G2). Examined kidneys of rats from group 3 showed vacuolation
of epithelial lining renal tubules and focal interstitial nephritis (G3). No histological
changes were noticed in kidneys of rats from groups 4 and 5 (G4) and (G5). The previous
results show that the kidneys of rats from groups 2, 4, and 5 were recovered from damage
occurred due to anemia in group 2 (Fig.4B).
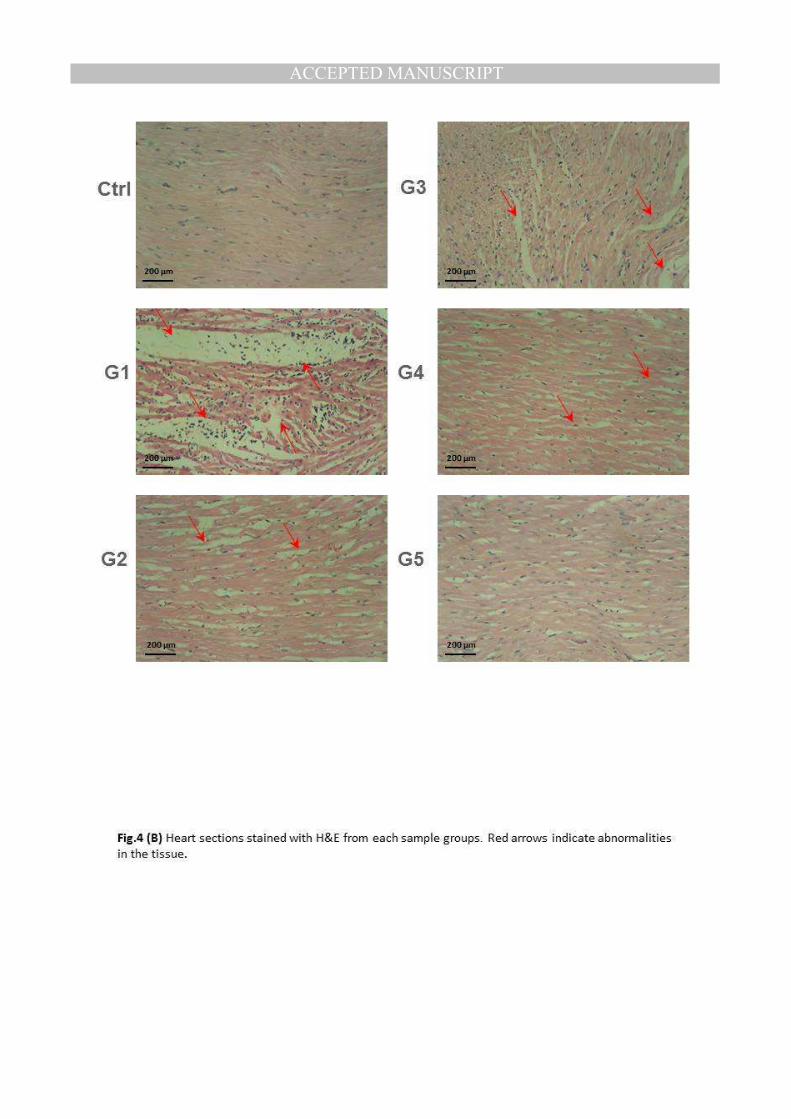
Examination of heart of rat from control group revealed no histopathological changes (Ctrl).
On the other hand, heart of rat from group 1 showed myocarditis with mononuclear
leucocytic cells infiltration (G1). However, heart of rat from group 2 showed no changes
except slight intermuscular edema (G2). Vaculations of some cardiac myocytes was
noticed in heart of rats from group 3 (G3). Meanwhile, hearts of rats from groups 4 and 5
showed no histopathological changes (G4) and (G5). The results of microscopically studied
heart sections showed that the severe damage occurred in hearts of anemic rats in group 1
(G1), was completely recovered in rats of groups 4 and 5(Fig.4C).
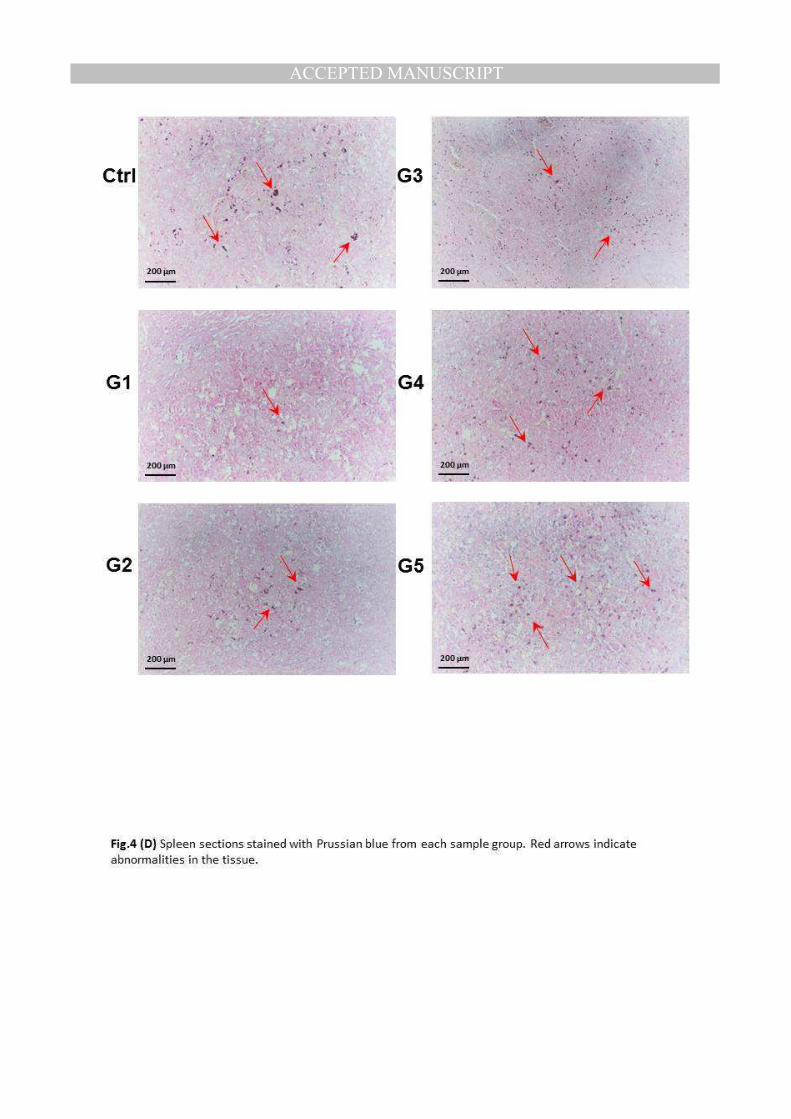
Sections of spleens were stained with Perls’ Prussian blue to evaluate iron accumulated in
different groups. Fig.4D shows iron accumulated in spleens of rats from different groups.
Examination of spleens of rats from control group showed marked deposition of
greenish blue hemosiderin pigment, indicating iron accumulated in tissues (Ctrl). Examined
spleens of rats from group 2 showed a very few deposits in spleen tissues (G1). Moreover, the iron
deposition in groups 2 and 3 was increased but still less than control group, (G2) and (G3).
However the iron deposition in spleen tissues from rats in groups 4 and 5 was clearly
increased and recurred as control group, (G4) and (G5). These results support the results of
iron accumulated in tissues of spleen of rats of different groups.

MANUSCRIP
T
ACCEPTED
ACCEPTED MANUSCRIPT
Discussion
Possible explanations for lower iron accumulation in yeast cells at higher concentrations in the
medium could be found in some previous investigations. Lesuisse et al. [14] found out that
higher concentration of Fe(III) in the medium caused decrease of negative potential at
yeast cell surface due to saturation of negative groups near iron transporters, which
otherwise participate in iron uptake. Consequently, the accumulation of iron would be
inhibited, what is consistent with previous results, too. On the other hand, Tuttle et al.
[15]discussed the possibility of iron efflux out of yeast cells at higher concentrations of iron in
the cell interior. This could also be a reason for lower amounts of accumulated iron in
S.cerevisiae at concentrations of ammonium Fe (III) citrate higher than 32 mM.
. In humans, the capacity of iron absorption from the diet depends on various factors including
the amount of iron in the body, the rate of erythrocyte production, the amount and kind of
iron in the diet, and the presence of absorption enhancers and inhibitors in the diet [16], [17].
The histological study of tissues from liver, kidney, heart, and spleen of rats from
different groups showed that the severe damage occurred in tissues of anemic rats group 1,
was completely recovered after treatment by iron enriched yeast in groups 4 and 5.
However other treatments in groups 2 and 3 may require more time to achieve the same
results obtained in treatment by iron enriched yeast, also only slight histological
differences can be observed when comparing group 4 and group 5, leading that both
treatments, 15 mg Fe/Kg diet (group 4) and 30 mg Fe/Kg diet (group 5), of iron
enriched yeast have the same efficiency when used to cure moderate iron deficiency
anemia.
In conclusion, this study demonstrates that the iron enriched baker’s yeast prepared in
presence of 32 mM Fe in growth medium has the best baking properties (leavening ability)
of both parent and other Fe concentrations grown cells, with improvement of biomass
produced. The used strain was also proved to accumulate the highest content of Fe (15
mg/g) at this concentration (32 mM) among other concentrations tested, and achieved the
most bioavailability of iron when used in the diet of anemic rats ahead of other treatments
by inorganic iron salts. Also the severe damage occurred in tissues of anemic rats was
completely recovered after treatment by iron enriched yeast, However salt-based
treatments may require more time to achieve the same results. It is suggested that the use of
MANUSCRIP
T
ACCEPTED
ACCEPTED MANUSCRIPT
iron-enriched yeast products may lead to the prevention of anemia in compromised
individuals, or the ability to recover from moderate iron deficiency.
More advanced studies about the effects of iron enriched baker’s yeast on the quality of
bread loaf are undergoing for pave the way for the use of iron enriched yeast industrially for
the production of bread.
Acknowledgment
The first author wants to thank Council for At-Risk Academics (CARA) for their support and
help in being in the University of Nottingham to complete this work.
Highlights
• Iron enriched yeast was prepared by cultivation of yeast cells at different iron
concentrations and best concentration was determined with no effect of yeast growth
or baking properties.
• Anemic rats were fed on different diets containing either inorganic iron salt or iron
enriched yeast as iron source.
• Feeding efficiency and different haematological incidences were followed up for all
groups.
• Histological study was performed for liver, heart, kidney and spleen tissues in all
groups.
• Feeding anemic rats with supplemented yeast leads to better results in recovery from
iron deficiency when compared to other diets containing inorganic iron salt as iron
source.
MANUSCRIP
T
ACCEPTED
ACCEPTED MANUSCRIPT
References
1. Zimmermann, M.B. and R.F. Hurrell, Nutritional iron deficiency. Lancet, 2007.
370(9586): p. 511-20.
2. Conrad, M.E. and J.N. Umbreit, Pathways of iron absorption. Blood Cells Mol Dis,
2002. 29(3): p. 336-55.
3. Pietrangelo, A., Hereditary hemochromatosis. Annu Rev Nutr, 2006. 26: p. 251-70.
4. Nairz, M. and G. Weiss, Molecular and clinical aspects of iron homeostasis: From
anemia to hemochromatosis. Wien Klin Wochenschr, 2006. 118(15-16): p. 442-62.
5. Hayflick, S.J., Neurodegeneration with brain iron accumulation: from genes to
pathogenesis. Semin Pediatr Neurol, 2006. 13(3): p. 182-5.
6. Burn, J. and P.F. Chinnery, Neuroferritinopathy. Semin Pediatr Neurol, 2006. 13(3):
p. 176-81.
7. De Freitas, J.M. and R. Meneghini, Iron and its sensitive balance in the cell. Mutat
Res, 2001. 475(1-2): p. 153-9.
8. Eaton, J.W. and M. Qian, Molecular bases of cellular iron toxicity. Free Radic Biol
Med, 2002. 32(9): p. 833-40.
9. Arora, N.P. and J.K. Ghali, Iron deficiency anemia in heart failure. Heart Fail Rev,
2013. 18(4): p. 485-501.
10. Pas, M., et al., Iron enriched yeast biomass--a promising mineral feed supplement.
Bioresour Technol, 2007. 98(8): p. 1622-8.
11. Sun, J.Y., et al., Effects of dietary zinc levels on the activities of enzymes, weights of
organs, and the concentrations of zinc and copper in growing rats. Biol Trace Elem
Res, 2005. 107(2): p. 153-65.
12. Hamdaoui, M.H., S. Chabchoub, and A. Hedhili, Iron bioavailability and weight
gains to iron-deficient rats fed a commonly consumed Tunisian meal 'bean seeds
ragout' with or without beef and with green or black tea decoction. J Trace Elem Med
Biol, 2003. 17(3): p. 159-64.
13. Schmidt, G.J. and W. Slavin, Inductively coupled plasma emission spectrometry with
internal standardization and subtraction of plasma background fluctuations.
Analytical Chemistry, 1982. 54(14): p. 2491-2495.
MANUSCRIP
T
ACCEPTED
ACCEPTED MANUSCRIPT
14. Lesuisse, E., F. Raguzzi, and R.R. Crichton, Iron uptake by the yeast Saccharomyces
cerevisiae: involvement of a reduction step. J Gen Microbiol, 1987. 133(11): p. 3229-
36.
15. Tuttle, M.S., et al., A dominant allele of PDR1 alters transition metal resistance in
yeast. J Biol Chem, 2003. 278(2): p. 1273-80.
16. Baynes, R.D. and T.H. Bothwell, Iron deficiency. Annu Rev Nutr, 1990. 10: p. 133-
48.
17. Derman, D.P., et al., Iron absorption from ferritin and ferric hydroxide. Scand J
Haematol, 1982. 29(1): p. 18-24.
MANUSCRIP
T
ACCEPTED
ACCEPTED MANUSCRIPT
Figure legends
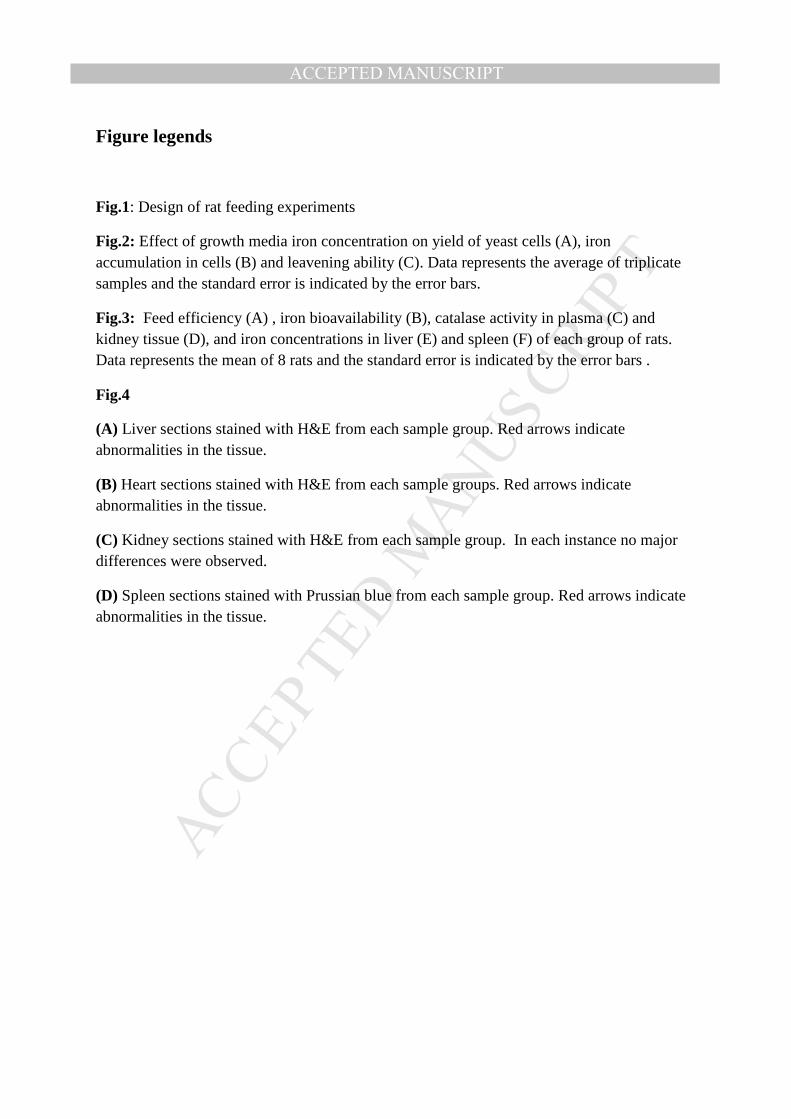
Fig.1: Design of rat feeding experiments
Fig.2: Effect of growth media iron concentration on yield of yeast cells (A), iron accumulation in cells (B) and leavening ability (C). Data represents the average of triplicate samples and the standard error is indicated by the error bars.
Fig.3: Feed efficiency (A) , iron bioavailability (B), catalase activity in plasma (C) and kidney tissue (D), and iron concentrations in liver (E) and spleen (F) of each group of rats. Data represents the mean of 8 rats and the standard error is indicated by the error bars .
Fig.4
(A) Liver sections stained with H&E from each sample group. Red arrows indicate abnormalities in the tissue.
(B) Heart sections stained with H&E from each sample groups. Red arrows indicate abnormalities in the tissue.
(C) Kidney sections stained with H&E from each sample group. In each instance no major differences were observed.
(D) Spleen sections stained with Prussian blue from each sample group. Red arrows indicate abnormalities in the tissue.
MANUSCRIP
T
ACCEPTED
ACCEPTED MANUSCRIPT
Tables
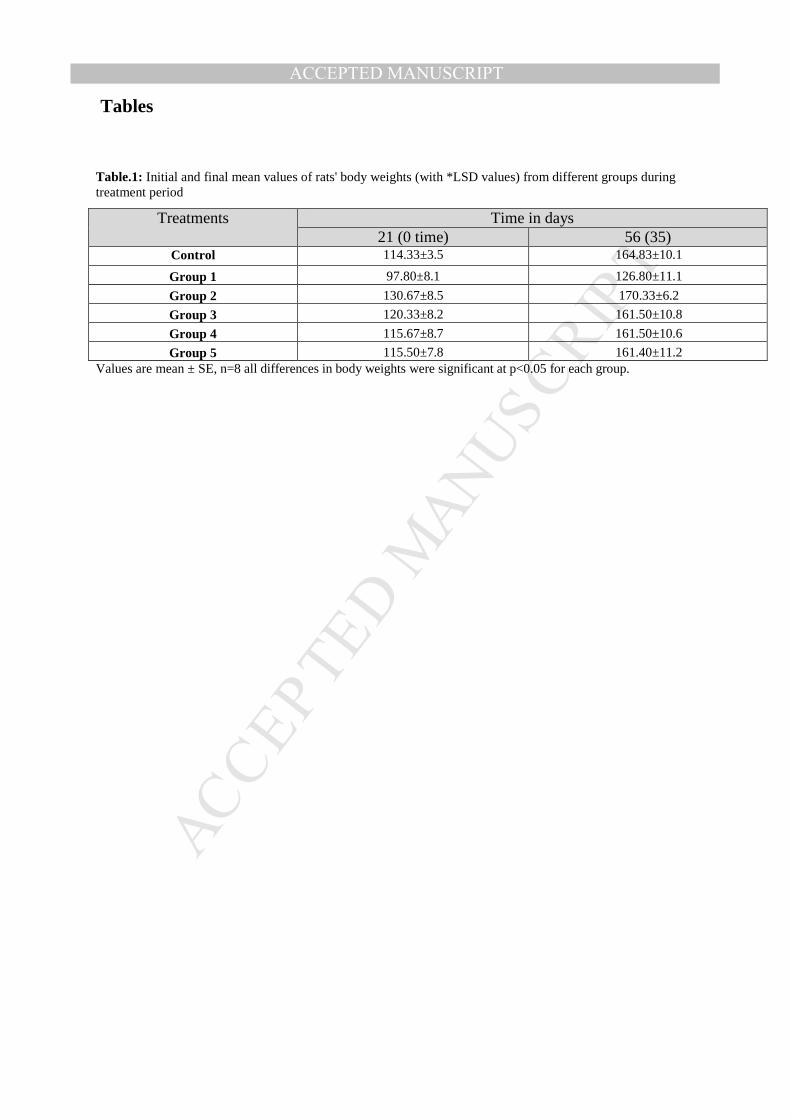
Table.1: Initial and final mean values of rats' body weights (with *LSD values) from different groups during treatment period
Treatments Time in days 21 (0 time) 56 (35)
Control 114.33±3.5 164.83±10.1 Group 1 97.80±8.1 126.80±11.1 Group 2 130.67±8.5 170.33±6.2 Group 3 120.33±8.2 161.50±10.8 Group 4 115.67±8.7 161.50±10.6 Group 5 115.50±7.8 161.40±11.2
Values are mean ± SE, n=8 all differences in body weights were significant at p<0.05 for each group.
MANUSCRIP
T
ACCEPTED
ACCEPTED MANUSCRIPTTable.2: Initial and final mean values of rats' hemoglobin (with LSD values) from different groups during treatment period
Treatments Time in days 21(0 time) 56(35)
Control 143.50±6.4 162.00±8.2 Group 1 126.00±7.7 90.20±10.2 Group 2 109.60±10.6 130.30±12.5 Group 3 109.10±4.3 119.20±11.5 Group 4 112.60±10.5 160.00±9.8 Group 5 112.00±10.6 158.16±4.2
Values are mean ± SE, n=8 all differences in hemoglobin values were significant at p<0.05 for each group.
MANUSCRIP
T
ACCEPTED
ACCEPTED MANUSCRIPTTable.3: Body weight, total food intake, and feed efficiency of rats. Rats were under-fed to make sure that all groups will consume the assigned amount of food. The food consumption of wistar rats investigated was 18g/day and 630 g over 35 days
Group *Final B.W
(g) *Gained weight
(g)
*Consumed food (g)
Feed efficiency %
Ctrl 164.8±13.2 50.5±9.8 420.00 12.0
Fe (-) Group (1)
126.8±14.3 29.0±8.6 420.00 6.9
Fe – S Group (2)
170.3±13.6 39.7±7.9 420.00 9.4
Fe – S Yeast Group (3)
161.5±28.3
41.1±9.1 420.00 9.7
Fe – Yeast 15 Group (4) 161.5±26.8 46.0±10.1
420.00 10.9
Fe – Yeast 30 Group (5) 161.4±15.7 45.8±9.7
420.00 10.9
*Values ± SE, p<0.05
MANUSCRIP
T
ACCEPTED
ACCEPTED MANUSCRIPTTable.4: Indices of Fe bioavailability in different groups during treatment period
Group
Initial Hb Fe*
mg
Final Hb Fe*
mg
Fe Intake*
mg
Fe bioavailabilit
y*
%
Relative Fe bioavailabilit
y*
(RBV) %
Ctrl 4.15± 0.3 6.60±0.4 12.60±0.5 19.44±3.1 100
Fe (-) 3.09±0.2 3.01±0.2 3.00±0.1 -2.60±1.1 -13.37
Fe – S 3.45±0.2 5.48±0.3 12.60±0.2 16.11±2.2 82.87
Fe – S Yeast 3.32±0.1 4.85±0.3 12.60±0.3 12.93±2.1 66.51
Fe – Yeast 15 3.28±0.3 5.57±0.2 6.30±0.4 36.35±4.2 186.98
Fe – Yeast 30 3.11±0.2 5.94±0.3 12.60±0.4 22.46±3.4 115.53
*Values ± SE, n=8, p<0.05
MANUSCRIP
T
ACCEPTED
ACCEPTED MANUSCRIPT
Table.5: Hemoglobin, iron concentration, TIBC, and TS in the serum of rats
Group
*Final Hemoglobin
(g/l)
*Hematocrit (Volume fraction)
*Serum iron (µmol/l)
*Total i ron binding capacity (TIBC)
(µmol/l)
*Transferrin saturation
TS (%)
Ctrl 162.0±13.5
0.44±0.06
26.7±2.8 60.5±3.5
44.1±2.1
Fe (-) Group (1) 90.2±10.3
0.35±0.02
11.6±2.3 30.7±2.1
37.7±1.8
Fe – S Group (2) 130.3±12.6
0.39±0.07
22.9±1.5 43.5±3.8
52.5±3.1
Fe – S Yeast Group (3)
119.2±11.5
0.33±0.09
14.5±2.1 35.3±2.4
41.5±2.9
Fe – Yeast15 Group (4)
158.2±15.4
0.42±0.06
26.2±3.8 48.9±3.6
53.0±3.6
Fe – Yeast30 Group (5)
160.0±10.3
0.46±0.08
21.9±3.6 40.9±3.3
56.5±3.4
*Values ± SE, n=8, p<0.05
MANUSCRIP
T
ACCEPTED
ACCEPTED MANUSCRIPT
MANUSCRIP
T
ACCEPTED
ACCEPTED MANUSCRIPT
MANUSCRIP
T
ACCEPTED
ACCEPTED MANUSCRIPT
MANUSCRIP
T
ACCEPTED
ACCEPTED MANUSCRIPT
MANUSCRIP
T
ACCEPTED
ACCEPTED MANUSCRIPT
MANUSCRIP
T
ACCEPTED
ACCEPTED MANUSCRIPT
MANUSCRIP
T
ACCEPTED
ACCEPTED MANUSCRIPT