Types of bonds 1. Metallic Solids 2. Ionic Solids 3. Molecular Solids 4. Covalent network solids.

Loughborough UniversityInstitutional Repository
Preparation of high solidscontent nanozirconia
suspensions
This item was submitted to Loughborough University's Institutional Repositoryby the/an author.
Citation: SANTACRUZ, I., ANAPOORANI, K. and BINNER, J.G.P, 2008.Preparation of high solids content nanozirconia suspensions. Journal of theAmerican Ceramic Society, 91(2), pp. 398�405
Additional Information:
• This is the author's version of the work. It is posted here by permis-sion of c© Blackwell Publishing for personal use, not for redistribution.The definitive version was published in the Journal of the AmericanCeramic Society and is available at: http://dx.doi.org/10.1111/j.1551-2916.2007.02164.x
Metadata Record: https://dspace.lboro.ac.uk/2134/3159
Publisher: c© Blackwell Publishing
Please cite the published version.

This item was submitted to Loughborough’s Institutional Repository by the author and is made available under the following Creative Commons Licence
conditions.
For the full text of this licence, please go to: http://creativecommons.org/licenses/by-nc-nd/2.5/

For Peer ReviewPREPARATION OF HIGH SOLIDS CONTENT NANO ZIRCONIA
SUSPENSIONS
Journal: Journal of the American Ceramic Society
Manuscript ID: JACERS-23218.R1
Manuscript Type: Article
Date Submitted by the Author:
30-Aug-2007
Complete List of Authors: Santacruz, Isabel; Loughborough University, IPTME; Consejo Superior de Investigaciones Cientificas, Instituto de Ceramica y Vidrio Annapoorani, Ketharam; Loughborough University, IPTME Binner, Jon; Loughborough University, IPTME
Keywords:colloids, nanomaterials, processing, rheology/rheometry, zirconia: yttria stabilized
Journal of the American Ceramic Society
Journal of the American Ceramic Society
For Peer Review
PREPARATION OF HIGH SOLIDS CONTENT NANO ZIRCONIA
SUSPENSIONS
Isabel Santacruz*†, Ketharam Anapoorani, Jon Binner‡
IPTME, Loughborough University, Loughborough, LE11 3TU Leicestershire, UK
Abstract
A new colloidal route leading to the production of ~99% dense 3 mol% yttria
stabilized zirconia nanostructured ceramics, whilst retaining a final average grain size of
~75 nm, has been developed. The process was based on the production of stable,
homogeneous nanosuspensions with solids contents of up to 28 vol% (70 wt%) but
viscosities less than 0.05 Pa s at any shear rate in the range of study were obtained. The
suspensions were formed by the concentration and optimization of precursor, dilute (5.0
vol%) commercial nanosuspensions, the approach requiring a change of pH, from the
2.4 of the as-received suspension to 11.5, and the use of an appropriate anionic
dispersant. Exposure of the nanosuspensions to ultrasound also helped to reduce the
viscosity further, though it only worked when the dispersant was optimized. The
nanosuspension was slip cast to form homogenous green bodies with densities of ~55%
of theoretical without agglomeration in the nanostructure; these were subsequently
densified using a two-step sintering technique.
* Author to whom correspondence should be addressed. e-mail: [email protected]† Currently at the Instituto de Cerámica y Vidrio (CSIC), Madrid, Spain‡ Member, American Ceramic Society.
Supported by Rolls Royce Fuel Cell Systems Ltd., the PowdermatriX Faraday and the Engineering and Physical Science Research Council (EPSRC), UK, under grant No. GR/S84477/01 and the Spanish Education and Science Ministry under postdoctoral grant No. EX2004-1012.
Page 1 of 34
Journal of the American Ceramic Society
Journal of the American Ceramic Society
123456789101112131415161718192021222324252627282930313233343536373839404142434445464748495051525354555657585960

For Peer Review
I. Introduction
The recent interest in nanocrystalline materials arises from their potential to display
unusual properties, including higher hardness and strength in both metals and
ceramics,1,2 and also lower sintering temperatures, offering the ability to save energy
and allowing metals and ceramics to be co-fired to a greater extent. If powders can be
consolidated into fully dense engineering parts without loosing the nanostructure, there
is the potential to use the materials for structural, thermal, magnetic, electric or
electronic applications such as capacitors, varistors, electronic substrates, wear, thermal
barrier and net shape parts, magnets and tools.2 Conventional, submicron zirconia
ceramics are widely used for their excellent mechanical3 and electrical properties4 and
hence there is considerable interest in investigating the properties of nanostructured
yttria stabilized zirconia (YSZ) ceramics.
Commercial nanopowders can now be produced in relatively large quantities,
although to date they are generally strongly agglomerated and/or show large amounts of
organics derived from their synthesis.5 However, a major obstacle to the formation of
genuinely nanostructured ceramics (average grain size <100 nm) is in the preparation of
homogeneous green bodies. Whilst dry forming via die or isostatic pressing is industry’s
generally preferred route, the strong agglomerates that readily form in dry nanopowders,
plus the latter’s inability to flow, means that wet forming routes are likely to lead to
greater success. Colloidal processing generally allows the production of complex-
shaped parts with reduced size and number of pores and higher reliability,6 however the
majority of wet forming routes,7-11 such as slip casting, in-situ coagulation molding, gel
casting and tape casting, require stable slurries with a high solids loading and a low
viscosity and this is difficult to achieve with particles in the sub 100 nm range.12,13
Colloidally stable nanopowder suspensions are known to display a markedly lower
Page 2 of 34
Journal of the American Ceramic Society
Journal of the American Ceramic Society
123456789101112131415161718192021222324252627282930313233343536373839404142434445464748495051525354555657585960
For Peer Review
volume loading at the same viscosity compared to suspensions with larger particle
sizes.13
The dispersion of ceramic powders in either an aqueous or a non-aqueous medium
has received considerable attention,14,15 the nature and strength of the interparticle
forces and also the quantity, shape, and size of the particles determining the rheological
properties of a suspension.16-18 To achieve adequate distance between the particles in
ceramic suspensions generally requires the use of surfactants that modify the particle
surface. This can be achieved by changing the surface charge, coating the particles with
an organic barrier layer or the combination of the two, i.e. the use of polyelectrolytes,19-
22 although the saturation adsorption and dissociation of the latter in aqueous solution
are strongly dependent on the pH of the solution.23,24
It is known that tetramethylammonium hydroxide (TMAH), tetraethylammonium
hydroxide (TEAH) and tetrapropylammonium hydroxide (TPAH) are all quaternary
ammonium surfactants for which the positively charged nitrogen atom can be adsorbed
onto particle surfaces, enhancing stabilization in some systems25-28 and also acting as a
strong base. The length of the alkyl chain affects the rheology of the suspension, with
viscosity, yield stress and thixotropy all increasing with increasing chain length.27 As a
result, the green density decreases as the chain length increases. As a result of these
properties, TMAH was studied as basic agent in the present work.
The aim of the present work was to investigate the potential for preparing fully
dense, 3 mol% yttria stabilized zirconia nanostructured ceramics whilst retaining a final
average grain size of <100 nm. In order to avoid the drawbacks of dry nanopowders,
which include uncontrolled agglomeration, the presence of organics (from their
synthesis) and potential toxicity due to their ultrafine size, a dilute commercial nano
suspension was used to prepare low viscosity, high solid content nanosuspensions.
Page 3 of 34
Journal of the American Ceramic Society
Journal of the American Ceramic Society
123456789101112131415161718192021222324252627282930313233343536373839404142434445464748495051525354555657585960

For Peer Review
Optimization of the basic agent required to modify the suspension pH, the dispersant
and the use of ultrasound were all performed. The most promising nanosuspensions
were slip cast into green bodies that were subsequently sintered, both the green and
sintered bodies being thoroughly characterized in terms of their density and
nanostructure, the latter in terms of their homogeneity and grain size.
II. Experimental Procedure
The precursor, as-received, nanosuspension (MEL Chemicals Ltd, Manchester, UK)
contained 5.0 vol% of 3 mol% yttria stabilized zirconia nanoparticles (3YSZ) in
deionised water. The solids loading was calculated after drying the suspension in an
oven at 60ºC overnight, followed by calcination at 500oC for 2 h. The density of the
dried and calcined powder was measured by He pycnometry (Quantachrome, Fleet,
UK), resulting in values of 4.88 g cm-3 and 5.55 g cm-3 respectively. All calculations
were performed with the powder crystallographic density, 6 g cm-3.
A tetragonal/cubic phase content of 92% was observed in the dried nanopowder
using XRD, the balance being monoclinic. The as-received suspension, which had a pH
of 2.4±0.1, was also characterized in terms of particle size using an AcoustoSizer II
(Colloidal Dynamics, Sydney, Australia) and the dried nanoparticles were examined
using transmission electron microscopy, TEM, (JEOL 2000FX, Jeol, Tokyo, Japan).
The effect of both cationic and anionic dispersants were examined. The former,
poly(ethylenimine), PEI, (BDH Chemicals Ltd., Poole, UK), was appropriate for the as-
received acidic suspension,24 whilst the anionic dispersants required that the pH be
modified to the basic region.20,23,24 This was achieved using both 35% ammonia solution
(Fisher Scientific, Loughborough, UK) and solid tetramethylammonium hydroxide,
Page 4 of 34
Journal of the American Ceramic Society
Journal of the American Ceramic Society
123456789101112131415161718192021222324252627282930313233343536373839404142434445464748495051525354555657585960
For Peer Review
TMAH (Aldrich Chemicals Ltd, Dorset, UK), the latter having the advantage of not
involving the initial further dilution of the precursor nanosuspension. When the
ammonia solution was used, the solids content of the nanosuspension fell from 5.0 to
3.3 vol%; with the TMAH, it remained at 5.0 vol% and the suspension displayed
superior stability. Additions of 6.7 wt% of TMAH, as a function of the suspension
solids content, were found to be required to modify the as-received suspension’s pH
from 2.4 up to 11.5±0.1. The anionic dispersants investigated were Dispex A40, an
ammonium polyacrylate-based surfactant, NH4PAA, (Ciba Speciality Chemicals,
Bradford, UK), and triammonium citrate, TAC, (FSA Laboratory, Loughborough, UK).
The latter was studied because it is a relatively short molecule that was considered to be
less likely to be broken by the application of ultrasound, which was used to break down
any agglomerates present.
The suspensions involving PEI were prepared by mixing 2.0 and 4.0 wt% directly
into the as-received suspension; the presence of the strong acid neutralized its basic –
NH– groups and conferred a positive charge on the polymer skeleton.19 For the anionic
dispersants, 1 to 4.5 wt% additions of Dispex and TAC were introduced to the pH-
modified nanosuspension, preliminary work indicating that 2.5 wt% was the optimum
addition. The adsorption of dispersants was achieved by shaking the suspensions, on an
automatic shaker (KS 260 basic, IKA, Staufen, Germany), in closed plastic bottles for
20 h. Note: in all cases, the amount of the deflocculant addition is expressed in terms of
the active matter present in the dispersant with respect to suspension solids loading.
Zeta potential and particle/agglomerate size measurements as a function of pH were
performed using an AcoustoSizer II. The as-received suspension was diluted to 1.8
vol% using deionised water due to the difficulties found in performing a continuous
titration at higher solids loading in the equipment. Titration was performed from acid to
Page 5 of 34
Journal of the American Ceramic Society
Journal of the American Ceramic Society
123456789101112131415161718192021222324252627282930313233343536373839404142434445464748495051525354555657585960

For Peer Review
base, using 1M NaOH solution (automatic titration) or by manual addition of TMAH.
Similar measurements were made on the basic diluted suspension (achieved using
ammonia solution) containing 2.5 wt% Dispex A40 or TAC using 1M NaOH and HCl
solutions for pH adjustments.
The dilute nanosuspensions were subsequently concentrated in a water bath at 50ºC
for between 1 and 4 days, depending on the required final solids loading and, for the
anionically-dispersed suspensions, whether ammonia solution or TMAH was used. For
example, to achieve a solids content of 17 vol% required 4 days for the ammonia
solution-based suspension and only 2 days for that produced using TMAH due to the
higher solids content at the starting point. Throughout the process, the pH was
controlled every two hours, keeping it at 9.5±0.1, and the suspension was stirred
constantly.
As already indicated, in order to break up any agglomerates present, the suspensions
were exposed to ultrasound using a KS150 ultrasound probe (Kerry Ultrasonics Ltd,
Skipton, UK), with an amplitude of 14 µm and a power of 75 W. In all cases, the
ultrasound was applied to 50 ml aliquots of the different nanosuspensions. A variety of
different time periods of ultrasound exposure were investigated, from 0 to 10 minutes.
Note that the ultrasound exposure was performed in 1 minute steps, with the suspension
being stirred at room temperature for 10 minutes between each ultrasound application in
order to avoid excessive heating of the nanosuspension.
A “multi-ultrasound” approach was also applied to selected suspensions, as distinct
from the simple ultrasound method described above. The “multi-ultrasound” technique
involved applying ultrasound to the suspension at several different points in the
concentration process until the required solids loading was achieved. For example, the
suspension dispersed with Dispex was exposed to ultrasound 3 times during the
Page 6 of 34
Journal of the American Ceramic Society
Journal of the American Ceramic Society
123456789101112131415161718192021222324252627282930313233343536373839404142434445464748495051525354555657585960

For Peer Review
evaporation process; 2 minutes at a solids loading of 15 vol%, then a further 5 minutes
when it reached 19 vol% and finally 10 more minutes at 28 vol%. For the TAC-based
suspension, it was found that less ultrasound was required, viz. only two applications, 6
minutes at 24 vol% followed by a further 2 minutes at 28 vol%. In all cases, the
suspensions were held in a cold water bath during ultrasonication the suspension
heating.
The size of any agglomerates present in the nanosuspensions was measured using a
Mastersizer 2000 (Malvern Instruments Ltd., Malvern, UK). Based on the results, it is
believed that the agglomerates formed during the evaporation of the suspension were
subsequently broken by the ultrasound, thus allowing more concentrated suspensions to
be prepared. The rheological behavior of the suspensions was determined using a Visco
88 BV viscometer (Bohlin Instruments, Cirencester, UK) with a C30 concentric
cylinder sensor and varying the shear rate from 0 to 1000 s-1 in 8 minutes without pre-
shearing; the time taken in obtaining the flow curve being distributed equally across the
measurement points. After each exposure to ultrasound, all the suspensions were stirred
for 10 min prior to rheological measurement. To study the effect of ageing on the
agglomerate size and rheology, the suspensions were left for several days in closed
plastic bottles on the shaker before additional measurements were made.
To ensure comparisons could be made between the different nanosuspensions, the
agglomerate size and rheological measurements were all made at pH 9.5±0.1 at room
temperature and the viscosity values presented in the results were all taken from the
upward flow curves at a shear rate of 100 s-1.
The suspensions with the highest solids content whilst retaining a low viscosity were
subsequently slip cast in plaster of Paris moulds to form green bodies measuring 9 mm
diameter by 7 mm thick. The resulting green densities of the bodies formed were
Page 7 of 34
Journal of the American Ceramic Society
Journal of the American Ceramic Society
123456789101112131415161718192021222324252627282930313233343536373839404142434445464748495051525354555657585960

For Peer Review
measured by the Archimedes’ method using mercury. After the removal of the organic
dispersants at 500oC for 2 hours, the green samples were sintered in an electrical
furnace (UAF 16/10, Lenton Thermal Design, Hope Valley, UK) using a two stage
sintering cycle.29 This involved heating the samples to 1150ºC at 20oC min-1 and
holding them for one minute before the temperature was dropped as rapidly as possible
to 1000ºC, where the samples were soaked for 5 or 10 hours. The sintered densities of
the bodies were measured by the Archimedes’ method using water.
Fracture surfaces of the green and sintered nanozirconia samples were observed by
field emission gun scanning electron microscopy (LEO 1530VP, LEO
Elektronenmikroskopie GmbH, Oberkochen, Germany).
III. Results and Discussions
The average particle size of the as-received suspension at pH 2.4±0.1 was 16 nm ±
0.5%, which correlated well with the particle size observed using TEM, figure 1.
When PEI was added to the as-received suspension it resulted in an increase in
viscosity under all conditions. Table I shows the viscosity of the suspension containing
2.0 wt% PEI, measured at 100 s-1, and compares it with the as-received suspension. For
this reason, and also because at acidic pH the yttria is dissolved resulting in Y3+
cations,30 which would make the processing of concentrated suspensions difficult by
promoting coagulation, it was decided to focus on basic pH values.
Figure 2 shows the results of the titration of the 1.8 vol% suspension. Note that since
1 M NaOH was used there was a negligible reduction in solids content with pH change.
From the figure it is clear that the isoelectric point (IEP) for the as-received suspension
was just below pH 10; this is higher than generally observed in the literature31,32 and
may be due to the presence of residual species, e.g. counter ions, from the preparation of
Page 8 of 34
Journal of the American Ceramic Society
Journal of the American Ceramic Society
123456789101112131415161718192021222324252627282930313233343536373839404142434445464748495051525354555657585960

For Peer Review
the nanosuspension. At pH values from 2 to 6 the suspension was very stable with a zeta
potential of ~60 mV, however in the basic pH range of 11 to 12, the maximum absolute
value was found to be quite low, ~20 mV. Despite this, the particle size of the 1.8 vol%
suspension at pH 11.5 was 31 nm (d50) / 53 nm (d85) ± 1% suggesting that there were no
significant agglomerates present, even though the zeta potential was low. In the same
figure, the zeta potential curves as a function of pH for the suspensions with 2.5 wt% of
both Dispex and TAC are also shown. It can be seen that the suspensions with these
anionic dispersants had very similar curves with desirably large zeta potential values
over a wide range of pH, from ~8 to 12.
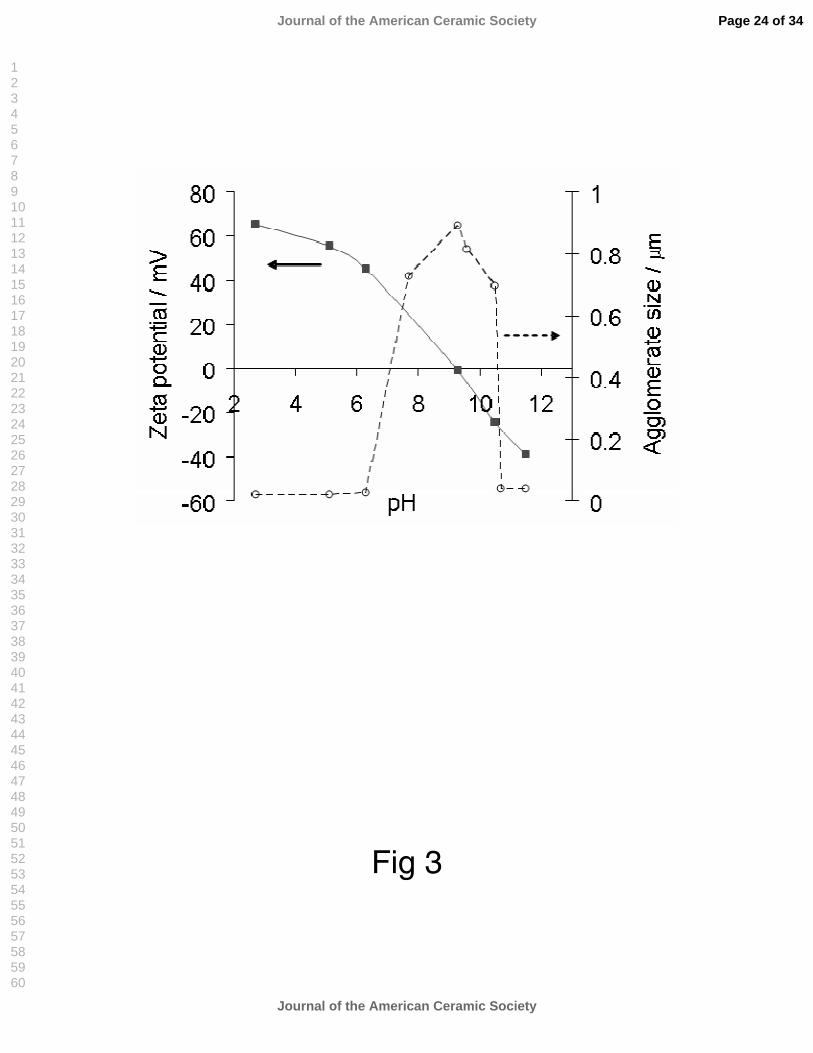
Figure 3 reveals that the zeta potential of the as-received nanosuspension changed
smoothly from ~60 mV through to ~-40 mV as the pH was changed from 2.4 to
11.5±0.1 by the addition of TMAH. The higher absolute value of the zeta potential at
pH 11.5 after the addition of TMAH compared with that obtained by the addition of
NaOH, ~-20 mV, confirms that TMAH provides an extra contribution to stability,
probably related to the adsorption of N+(Me)4 groups27 which are not available from
bases such as NaOH. The change in pH resulted in the formation of agglomerates as the
pH passed through the isoelectric point (IEP), which occurred at pH ~9.5 when no
deflocculants were present. Interestingly, the formation of the agglomerates was
reversible and hence no significant agglomeration was observed after crossing the IEP,
figure 3, even though ultrasound was not applied to the suspensions.
The flow curves of the nanosuspensions with 2.5 wt% Dispex A40 prepared using
TMAH at a solid content of 19.0 vol% and using ammonia solution at a solid loading of
17.0 vol% are shown in figure 4. In both cases, 2 minutes of ultrasound have been
applied. Both pH agents allowed the formation of moderately concentrated
nanosuspensions with low viscosities, although it may be seen that the use of the
Page 9 of 34
Journal of the American Ceramic Society
Journal of the American Ceramic Society
123456789101112131415161718192021222324252627282930313233343536373839404142434445464748495051525354555657585960

For Peer Review
TMAH allowed slightly higher concentrations to be achieved whilst retaining a very
similar viscosity. This may be due to 2 reasons: the extra stabilization provided by the
TMAH27 and/or the longer evaporation time required when ammonia was added due to
the initial suspension dilution, which may contribute to greater agglomeration thus
necessitating longer ultrasound times than were studied in the current work. Whatever
the reason, TMAH was selected as the basic agent for further studies since it avoided
the initial dilution, hence reducing processing time, and yielded a slightly lower
viscosity for a given solids content.
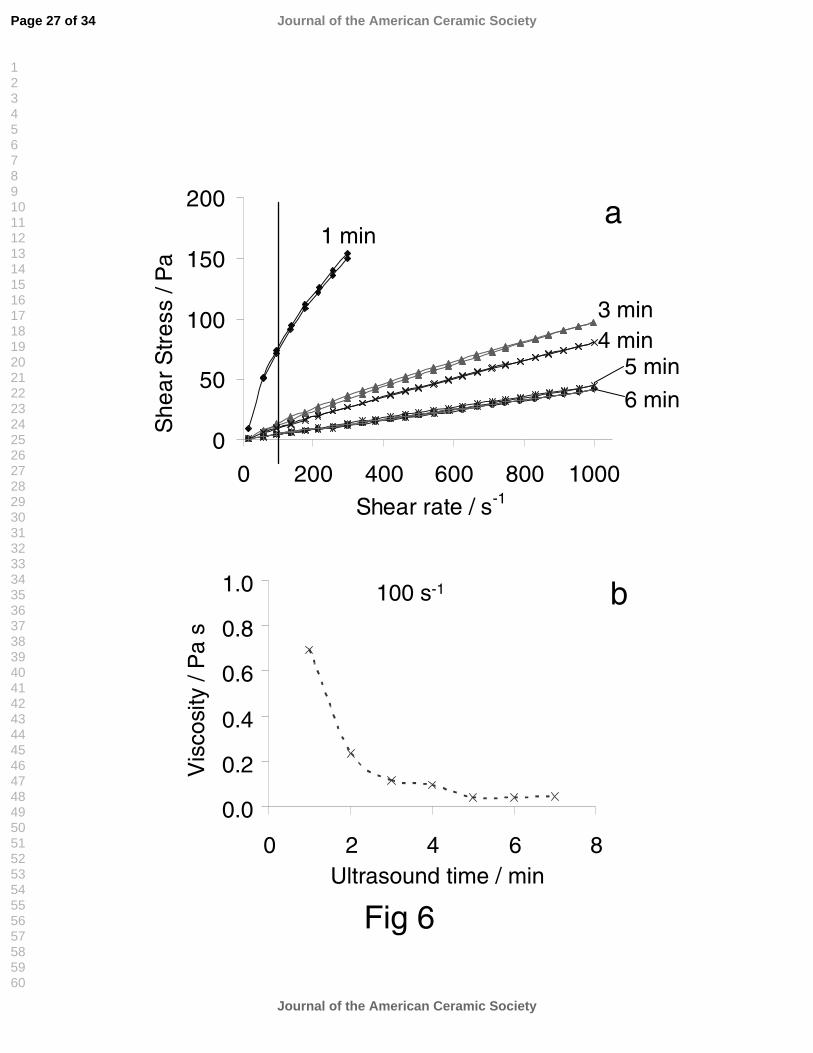
The effect of the ultrasound is plotted in figures 5 and 6. These show flow curves for
15.0 vol% solids content dispersed nanosuspensions after 1 and 2 minutes of ultrasound
exposure, figure 5, and flow curves of 19.0 vol% nanosuspensions after 1 to 6 minutes
of ultrasound, figure 6 (a). Dispex A40 was used in both cases. Whilst both curves in
figure 5 displayed shear thinning behavior without thixotropy, the suspension with two
minutes of ultrasound treatment exhibited considerably lower viscosity. A similar
outcome is presented by figure 6, where longer ultrasound times were required with the
higher solids content suspension. Figure 6 (b) shows the viscosity of the 19.0 vol%
suspensions at 100 s-1 after ultrasound.
The stability of the viscosity taken at 100 s-1 during ageing of a 16.0 vol%
suspension prepared using Dispex A40 after 2, 4 and 8 minutes of ultrasound is shown
in figure 7. Once again, this shows that longer periods of ultrasound exposure result in
more stable suspensions in the range of study, where samples treated for ≥4 min were
entirely stable for at least 7 days whilst those treated for only 2 min exhibited a fairly
steady increase in viscosity over time. No sedimentation was observed in these
suspensions. Stable suspensions with solids loadings up to 19 vol% could be achieved
with this approach.
Page 10 of 34
Journal of the American Ceramic Society
Journal of the American Ceramic Society
123456789101112131415161718192021222324252627282930313233343536373839404142434445464748495051525354555657585960

For Peer Review
Figure 8 reveals the effect of ultrasound on the size of the agglomerates present in
the suspension, the d50 value taken from the volume distribution as measured by laser
scattering via a Malvern MasterSizer 2000, as a function of solids content. It can be
seen how the use of ultrasound significantly reduced the size of the agglomerates
present – and also confirms again how at higher solids loadings, longer ultrasound
periods were required.
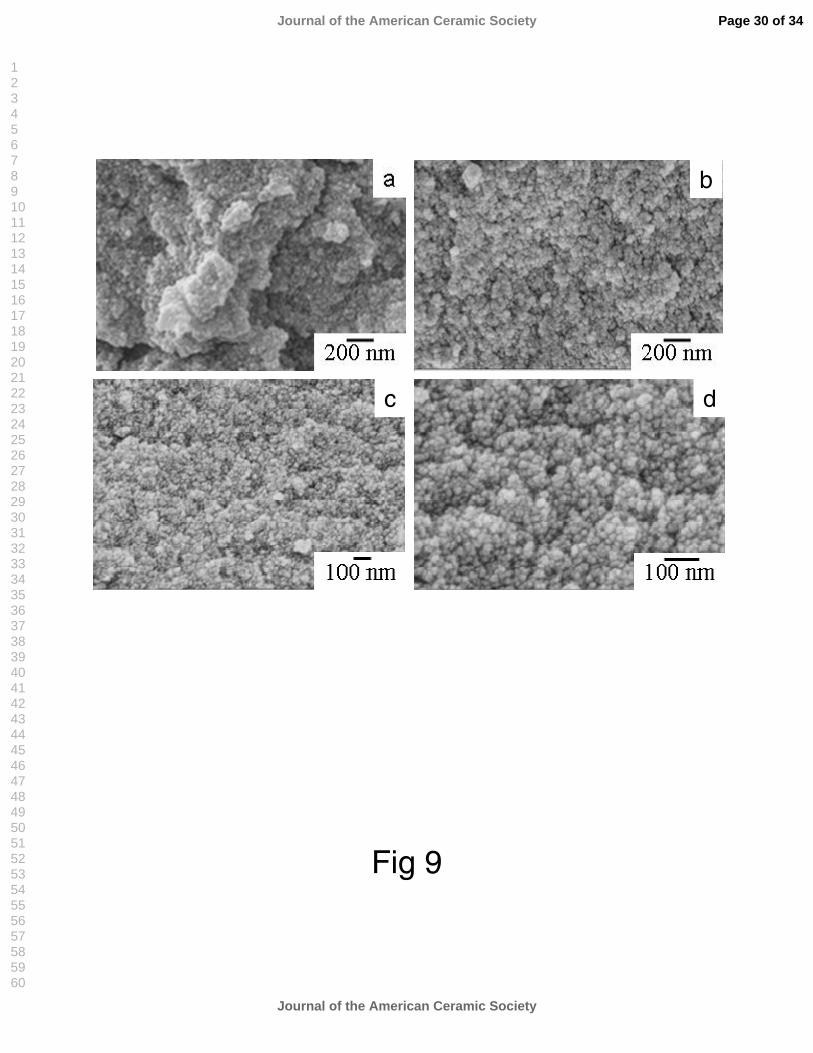
The consequences of the presence of the agglomerates on the microstructure of the
slip cast green samples are illustrated by the fracture surfaces shown in figure 9. Images
(a) and (b) are both from bodies prepared from a 15.0 vol% suspension after 1 and 2
minutes of ultrasound respectively (the samples were prepared from the suspensions
represented in figure 5); it can be seen how the latter is very significantly more
homogeneous since the action of the ultrasound broke up the agglomerates present.
Figures 9 (c) and (d) show the nanostructure obtained by slip casting a 19.0 vol%
suspension after 5 minutes of ultrasound at two different levels of magnification
(prepared from suspensions shown in figure 6). The homogeneity of the structure is
notable.
All of the results presented to date were based on the application of ultrasound at the
final solid loading. However, this approach suffered from an upper solid loading limit
beyond which ultrasound could not be applied because the viscosity was too high and
the suspension became a solid even before the application of the ultrasound. This led to
the development of the multi-ultrasound approach described earlier. Figure 10 shows
the results achieved for a 28 vol% suspension when this approach was used. Whilst it
can be seen that a final viscosity of <1 Pa s was achieved even at this high solids content
(28.0 vol%, 70.0 wt%), unfortunately it was discovered that the resulting suspensions,
which were based on Dispex A40, were unstable. They became a gel over time; the
Page 11 of 34
Journal of the American Ceramic Society
Journal of the American Ceramic Society
123456789101112131415161718192021222324252627282930313233343536373839404142434445464748495051525354555657585960
For Peer Review
higher the solids content achieved, and hence the more ultrasound used, the faster this
occurred. It is believed that excessive use of ultrasound may have damaged the polymer
chain of the dispersant, resulting in an unstable system. This led to the investigation of
tri ammonium citrate, TAC, a shorter chain anionic dispersant, so it is less likely to be
broken by the application of ultrasound, since the length of the dispersant chain is a key
parameter in the stabilization of nanosuspensions.33,34
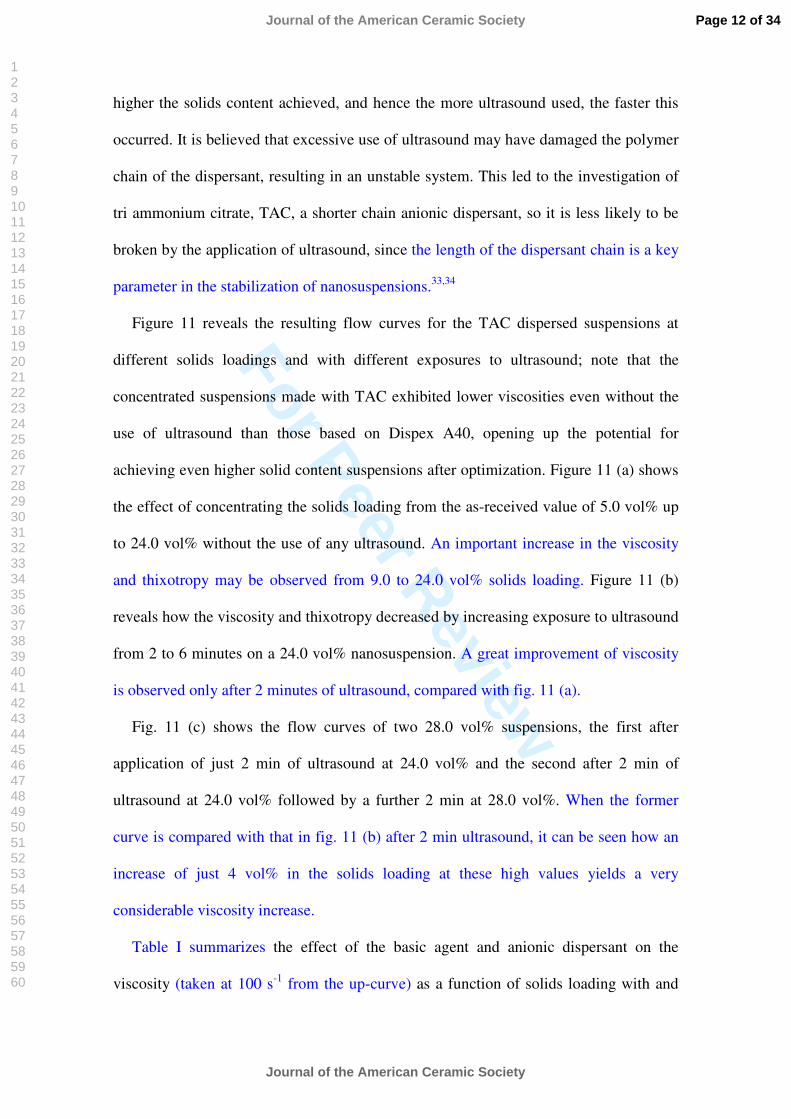
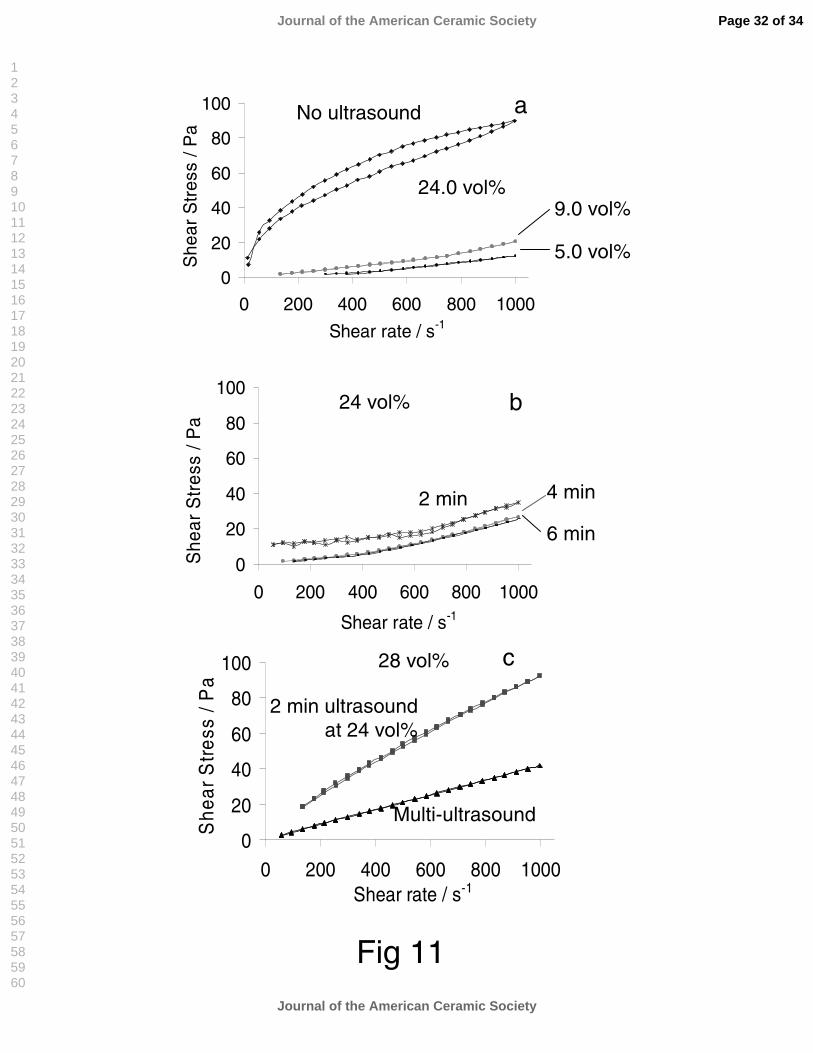
Figure 11 reveals the resulting flow curves for the TAC dispersed suspensions at
different solids loadings and with different exposures to ultrasound; note that the
concentrated suspensions made with TAC exhibited lower viscosities even without the
use of ultrasound than those based on Dispex A40, opening up the potential for
achieving even higher solid content suspensions after optimization. Figure 11 (a) shows
the effect of concentrating the solids loading from the as-received value of 5.0 vol% up
to 24.0 vol% without the use of any ultrasound. An important increase in the viscosity
and thixotropy may be observed from 9.0 to 24.0 vol% solids loading. Figure 11 (b)
reveals how the viscosity and thixotropy decreased by increasing exposure to ultrasound
from 2 to 6 minutes on a 24.0 vol% nanosuspension. A great improvement of viscosity
is observed only after 2 minutes of ultrasound, compared with fig. 11 (a).
Fig. 11 (c) shows the flow curves of two 28.0 vol% suspensions, the first after
application of just 2 min of ultrasound at 24.0 vol% and the second after 2 min of
ultrasound at 24.0 vol% followed by a further 2 min at 28.0 vol%. When the former
curve is compared with that in fig. 11 (b) after 2 min ultrasound, it can be seen how an
increase of just 4 vol% in the solids loading at these high values yields a very
considerable viscosity increase.
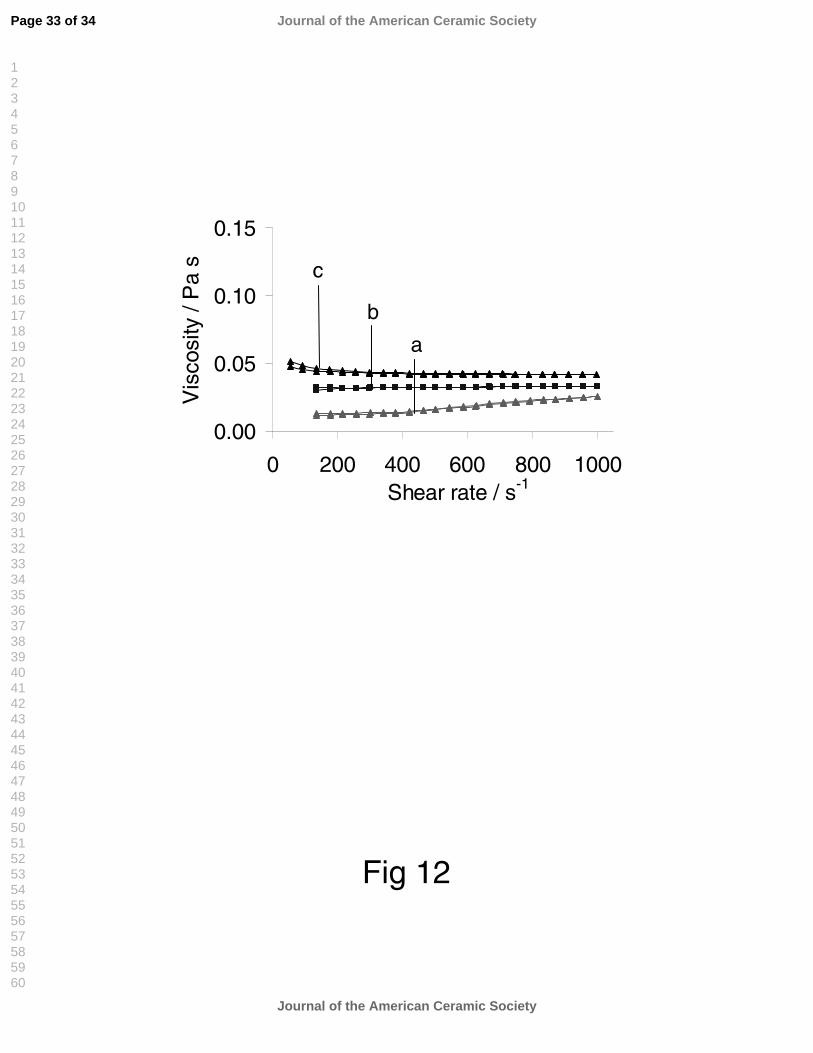
Table I summarizes the effect of the basic agent and anionic dispersant on the
viscosity (taken at 100 s-1 from the up-curve) as a function of solids loading with and
Page 12 of 34
Journal of the American Ceramic Society
Journal of the American Ceramic Society
123456789101112131415161718192021222324252627282930313233343536373839404142434445464748495051525354555657585960
For Peer Review
without the use of ultrasound. The improvement shown by the TMAH / TAC system
over the ammonia solution / Dispex A40 system is clearly visible in terms of the lower
viscosities observed. Fig. 12 shows the viscosity curves of three suspensions in which
TMAH was used as the basic agent. It can be seen that even with the application of a
single, 6 min ultrasound treatment at the end of the concentration process, the use of
TAC results in the 24.0 vol% solids content nanosuspension, fig. 12 (a), having a lower
viscosity than the 19.0 vol% suspension prepared with 2.5 wt% Dispex A40 after the
multi-ultrasound treatment, fig. 12 (b). When the multi-ultrasound process is then
combined with the TAC, 28.0 vol% suspensions can be seen to display a viscosity <0.05
Pa s at all shear rates measured, fig. 12 (c). They were also entirely stable for periods of
at least 15 days, confirming the superiority of TMAH over ammonia solution and TAC
as a dispersant compared to Dispex A40.
These suspensions were slip cast and green density values of ~55% of theoretical
(6 g cm-3) were obtained. Fig. 13 (a) and (b) show the nanostructures of the two-stage
sintered, slip cast samples prepared from a 19.0 vol% suspension prepared with TMAH
and Dispex A40 after 5 min of ultrasound; ~99% dense ceramics were obtained with an
average and uniform grain size of 80 and 90 nm after 5 and 10 h soaking time
respectively. The equivalent nanostructure for a sample prepared from 28.0 vol%
suspension made with TAC and the multi-ultrasound treatment after a soaking time of
10 hours can be seen in fig. 12 (d), its green nanostructure may be seen in fig. 12 (c).
The sintered sample has an average grain size of 75 nm, i.e. lower than that obtained
from the equivalent sintering cycle for the sample prepared with Dispex A40, figure 12
(b), and is much more uniform due to the greater stability and higher solid loading of
the precursor suspension.
Page 13 of 34
Journal of the American Ceramic Society
Journal of the American Ceramic Society
123456789101112131415161718192021222324252627282930313233343536373839404142434445464748495051525354555657585960

For Peer Review
IV. Conclusions
A colloidal route has been developed for the production of ~99% dense 3 mol%
yttria stabilized zirconia nanoceramics with final average grain sizes of ~75 nm. It is
based on the preparation of 3YSZ nanosuspensions with solids contents up to 28.0 vol%
but viscosities as low as 0.05 Pa s from commercially available, dilute suspensions. The
process is based on a series of steps involving initially adjusting the pH to a value of
~11.5±0.1 from the original value of 2.4±0.1 using (solid) tetramethylammonium
hydroxide, TMAH. This is followed by the addition of anionic dispersants. Whilst both
Dispex A40, a commercial surfactant based on ammonium polyacrylate, and
triammonium citrate, TAC, work, the latter has been found to be more suitable, offering
both the potential to achieve lower viscosities at higher solids contents and also more
resistance to the subsequent use of ultrasound. The dilute nanosuspensions can then be
concentrated by evaporation at 50oC in a water bath. The use of ultrasound energy has
been found to be important for breaking any agglomerates that form, thus ensuring that
they do not cause a problem in the subsequent nanostructure of the green components
formed. Since the higher the solid content of the suspension, the more frequent and the
longer periods of ultrasound that were required, an approach based on the use of
multiple ultrasound applications for relatively short durations was found to be an
appropriate way forward. Whilst this caused problems with nanosuspensions dispersed
with Dispex A40, possibly because of damage to the polymer chain, with the shorter
chain TAC, high solids content, low viscosity nanosuspensions could be formed that
were stable for periods of at least 15 days. This stability range is very high when
compared with other nanoparticle suspensions.35
Samples produced by slip casting the most promising nanosuspensions could be
sintered using a two stage sintering process to yield a final average grain size as fine as
Page 14 of 34
Journal of the American Ceramic Society
Journal of the American Ceramic Society
123456789101112131415161718192021222324252627282930313233343536373839404142434445464748495051525354555657585960

For Peer Review
~75 nm. The process by which the nanosuspension was formed is the subject of a patent
application.36
Acknowledgements
The authors would like to thank to MEL Chemicals Ltd. for provision of the
precursor nanosuspension free of charge.
References
1M. Mayo, “Processing of nanocrystalline ceramics from ultrafine particles,” Int.
Mater. Rev., 41 [85] 1743-2804 (1996).
2M. N. Rittner and T. Abraham, “Economics: Nanostructured Materials: An Overview
and Commercial Analysis,” JOM, 50 1160-96 (1998).3J. Kondoh, H. Shiota, K. Kawachi, and T. Nakatani, “Yttria concentration dependence
of tensile strength in yttria-stabilized zirconia,” J. Alloys and Comp., 365 253–58
(2004).
4I. Kosacki, T. Suzuki, V. Petrovsky, and H. U. Anderson, “Electrical conductivity of
nanocrystalline ceria and zirconia thin films,” Solid State Ionics, 136-137 1225-33
(2000).
5I. Santacruz, M I. Nieto, J. Binner and R. Moreno, “Wet forming of concentrated nano
BaTiO3 suspensions,” J. Eur. Ceram. Soc., In Press.
6F. F. Lange, “Powder Processing Science and Technology for increased Reliability,” J.
Am. Ceram. Soc., 72 [1] 3-15 (1989).
7L. A. Wang and F. Aldinger, “Near Net Shape Forming of Advanced Ceramics,” Adv.
Eng. Mater., 3 [2] 110-13 (2000).
Page 15 of 34
Journal of the American Ceramic Society
Journal of the American Ceramic Society
123456789101112131415161718192021222324252627282930313233343536373839404142434445464748495051525354555657585960

For Peer Review
8I. Santacruz and J. Binner, “Rheological characterization and coagulation casting of
Al2O3–nano zirconia suspensions,” J. Am. Ceram. Soc., In Press.
9W. M. Sigmund, N. S. Bell and L. Bergström, “Novel Powder-Processing Methods for
Advanced Ceramics,” J. Am. Ceram. Soc., 83 [7] 1557-74 (2000).
10I. Santacruz, M. I. Nieto and R. Moreno, “Alumina bodies with near-to-theoretical
density by aqueous gelcasting using concentrated agarose solutions,” Ceram. Int., 31 [3]
439-45 (2005).
11J. A. Lewis, “Colloidal Processing of Ceramics,” J. Am. Ceram. Soc., 83 [10] 2341-59
(2000).
12H. B. Shan and Z. T. Zhang, “Slip Casting of Nanometre-Sized Tetragonal Zirconia
Powder,” Br. Ceram. Trans., 95 [1] 35-38 (1996).
13L. P. Meier, L. Urech and L. J. Gauckler, “Tape casting of nanocrystalline ceria
gadolinia powder,” J. Eur. Ceram. Soc., 24 [15-16] 3753–58 (2004).
14R. Moreno, “The role of slip additives in tape-casting technology: part I – solvents and
dispersants,” Am. Ceram. Soc. Bull., 71 [10] 1521-30 (1992).
15J. Cesarano III and I. A. Aksay, “Stability of aqueous α-Al2O3 suspensions with
poly(methacrylic acid) polyelectrolyte,” J. Am. Ceram. Soc., 71 [4] 250-55 (1988).
16R. Moreno Botella, (“Rheology of Ceramic Suspensions”) “Reología de Suspensiones
Cerámicas,” Biblioteca de Ciencias, Published by Consejo Superior de Investigaciones
Científicas, Madrid, Spain, 2005. (In Spanish).
17D. R. Dinger, “Rheology for Ceramists,” Published by Dinger Ceramic Consulting
Services, Clemson, USA, 2002.
18G. Schramm, “A practical approach to Rheology and Rheometry,” Published by
Thermo Electron (Karlsruhe) GmbH, Karlsruhe, Germany, 2004.
Page 16 of 34
Journal of the American Ceramic Society
Journal of the American Ceramic Society
123456789101112131415161718192021222324252627282930313233343536373839404142434445464748495051525354555657585960

For Peer Review
19J. Cesarano III and I. A. Aksay, “Processing of highly concentrated aqueous α-
alumina suspensions stabilized with polyelectrolytes,” J. Am. Ceram. Soc., 71 [12]
1062-67 (1988).
20L.C. Guo, Y. Zhang, N. Uchida, K. Uematsu, “Adsorption effects on the rheological
properties of aqueous alumina suspensions with polyelectrolyte,” J. Am. Ceram. Soc.,
81 [3] 549-56 (1998).
21E. P. Luther, J. A. Yanez, G. V. Franks, F. F. Lange, D. S. Pearson, “Effect of
ammonium citrate on the rheology and particle packing of alumina slurries,” J. Am.
Ceram. Soc., 78 [6] 1495-500 (1995).
22P. C. Hidber, T. J. Graule, L. J. Gauckler, “Citric Acid-A dispersant for aqueous
alumina suspensions,” J. Am. Ceram. Soc., 79 [7] 1857-67 (1996).
23J. Davies and J. G. P. Binner, “The role of ammonium polyacrylate in dispersing
concentrated alumina suspensions,” J. Eur. Ceram. Soc., 20 1539-53 (2000).
24J. Sun, L. Gao and J. Guo, “Influence of the initial pH on the adsorption behaviour of
dispersant on nano zirconia powder,” J. Eur. Ceram. Soc., 19 1725-30 (1999).
25R. Moreno, A. Salomoni, and S. M. Castanho, “Colloidal filtration of silicon nitride
aqueous slips. Part I: Optimization of the slip parameters,” J. Eur. Ceram. Soc., 18,
405–416 (1998).
26I. Santacruz, J. Binner, M. I. Nieto, R. Moreno, “Dispersion and rheology of aqueous
suspensions of nanosized BaTiO3,” Submitted to J. Am. Ceram. Soc., August 2007.
27F. Boschini, A. Rulmont, R. Cloots and R. Moreno, “Colloidal stability of aqueous
suspensions of barium zirconate,” J. Eur. Ceram. Soc., 25 3195–3201 (2005).
28Z. Xie, J. Ma, Q. Xu, Y. Huang and Y. B. Cheng, “Effects of dispersants and soluble
counter-ions on aqueous dispersibility of nano-sized zirconia powder”, Ceram. Int., 30
[2] 219-24 (2004).
Page 17 of 34
Journal of the American Ceramic Society
Journal of the American Ceramic Society
123456789101112131415161718192021222324252627282930313233343536373839404142434445464748495051525354555657585960

For Peer Review
29J. G. P. Binner, B. Vaidhyanathan and A. Carney, “Microwave hybrid sintering of
nanostructured YSZ ceramics,” Adv. Sci. Techn., 45 835-844 (2006).
30M. Colic, G. Franks, M. Fisher and F. Lange, “Chemisorption of organofunctional
silanoes on silicon nitride for improved aqueous processing,” J. Am. Ceram. Soc., 81 [8]
2157–63 (1998).
31T. Fengqiu, H. Xiaoxian, Z. Yufeng and G. Jingkun, “Effect of dispersants on surface
chemical properties of nano-zirconia suspensions,” Ceram. Int., 26 [1] 93-97 (2000).
32A. J. Sanchez-Herencia, C. Pascual, J. He, and F. F. Lange, “ZrO2/ZrO2 Layered
Composites for Crack Bifurcation,” J. Am. Ceram. Soc., 82 [6] 1512–18 (1999).
33A. R. Studart, E. Amstad, M. Antoni, L. J. Gauckler, “Rheology of concentrated
suspensions containing weakly attractive alumina nanoparticles,” J. Am. Ceram. Soc.,
89 [8] 2418-25 (2006).
34K. Lu, C. S. Kessler, R. M. Davis, “Optimization of a nanoparticle suspension for
freeze casting,” J. Am. Ceram. Soc., 89 [8] 2459-65 (2006).
35O. Burgos-Montes, M. I. Nieto, R. Moreno, “Mullite compacts obtained by colloidal
filtration of alumina powders dispersed in colloidal silica suspensions,” Ceram. Int., 33
[3] 327-3 (2007).
36J. G. P. Binner, I. Santacruz and K. Annapoorani, International patent application
Publ. No. WO 2006/136780 A2, Publ. Date 28/12/06.
Page 18 of 34
Journal of the American Ceramic Society
Journal of the American Ceramic Society
123456789101112131415161718192021222324252627282930313233343536373839404142434445464748495051525354555657585960

For Peer Review
Captions
Fig. 1. TEM images of the 3YSZ nanoparticles at different magnifications.
Fig. 2. Evolution of the zeta potential as a function of pH for the diluted, 1.8 vol%,
nanosuspension: without dispersant, with 2.5 wt% of Dispex A40, or TAC.
Fig. 3. Evolution of the particle size and zeta potential as a function of pH with the
addition of TMAH to 1.8 vol% nanosuspension.
Fig. 4. Flow curves of dispersed suspensions containing 2.5 wt% Dispex A40
prepared with NH4OH (17.0 vol% solids content) and TMAH (19.0 vol%
solids content).
Fig. 5. Flow curves of a 15.0 vol% suspension dispersed with Dispex A40 after 1 and
2 minutes of ultrasound. The basic agent was TMAH.
Fig. 6. Effect of ultrasound time on the viscosity of a 19.0 vol% suspension dispersed
with Dispex A40; a) flow curves and b) viscosity at 100 s-1 as a function of
ultrasound exposure time. The basic agent was TMAH.
Fig. 7. Effect of ageing on viscosity of a 16.0 vol% suspension with Dispex A40
subjected to different ultrasound exposure time. The basic agent was TMAH.
Fig. 8. Average agglomerate size measured by laser scattering for Dispex based
concentrated suspensions with and without ultrasound exposure.
Fig. 9. FEG-SEM micrographs of the fracture surface of green bodies prepared from
15.0 vol% suspensions with TMAH and Dispex after a) 1 minute and b) 2
minutes of ultrasound, c) and d) green bodies from a dispersed 19.0 vol%
suspension (TMAH & Dispex) subjected to 5 minutes of ultrasound, at
different magnifications.
Page 19 of 34
Journal of the American Ceramic Society
Journal of the American Ceramic Society
123456789101112131415161718192021222324252627282930313233343536373839404142434445464748495051525354555657585960

For Peer Review
Fig. 10. Viscosity vs. volume fraction curve for a suspension with TMAH and Dispex
A40 using “multi-ultrasound”. Shear rate: 100 s-1. Ultrasound application at
15.0, 19.0 and 28.0 vol%, the latter being the final solids content.
Fig. 11. Flow curves of suspensions with TMAH and TAC, a) without ultrasound, b)
24.0 vol% with different ultrasound times, c) 28.0 vol% without and with 2
min ultrasound at this solids loading, after 2 min ultrasound at 24.0 vol%
(multi-ultrasound).
Fig. 12. Viscosity curves for the nanosuspensions: a) 24.0 vol% using TMAH & TAC
after 6 min ultrasound, b) 19.0 vol% prepared using TMAH & Dispex A40
after multi-ultrasound, c) 28.0 vol% using TMAH & TAC after multi-
ultrasound treatments.
Fig. 13. FEG-SEM micrographs of sintered samples prepared from a 19.0 vol%
suspension with TMAH & Dispex with soaking times of: a) 5 h, b) 10 h; c) a
green sample prepared from a 28.0 vol% suspension with TMAH & TAC after
multi-ultrasound and d) the sample in (c) after sintering (soaking time: 10 h).
Table I. Summary of the characteristics of the nanosuspensions prepared under a range
of different conditions.
Page 20 of 34
Journal of the American Ceramic Society
Journal of the American Ceramic Society
123456789101112131415161718192021222324252627282930313233343536373839404142434445464748495051525354555657585960

For Peer Review
DispersantDispersant content /
wt%
Solids loading / vol%
Basic agent
Ultrasound / min
Viscosity / mPa s
at 100 s-1
pH ±0.1
- 0 5.0 - 0 2 2.4
PEI 2.0 5.0 - 0 10 4.6
0 100017 Ammonia
2 300
2 26019
6 45
Dispex A40
2.5
28
TMAH
Multiultrasound 700
9.5
0 1400
2 7524
6 15
2 320
TAC 2.5
28
TMAH
Multiultrasound 45
9.5
Table I.
Page 21 of 34
Journal of the American Ceramic Society
Journal of the American Ceramic Society
123456789101112131415161718192021222324252627282930313233343536373839404142434445464748495051525354555657585960

For Peer Review
Fig. 1
20 nm20 nm20 nm
b
50 nm50 nm50 nm
a
Page 22 of 34
Journal of the American Ceramic Society
Journal of the American Ceramic Society
123456789101112131415161718192021222324252627282930313233343536373839404142434445464748495051525354555657585960

For Peer Review
Fig. 2
-60
-40
-20
0
20
40
60
80
2 4 6 8 10 12
pH
Zet
a P
oten
tial /
mV
DispexCitrate
No dispersant
Page 23 of 34
Journal of the American Ceramic Society
Journal of the American Ceramic Society
123456789101112131415161718192021222324252627282930313233343536373839404142434445464748495051525354555657585960
For Peer Review
Fig 3
Page 24 of 34
Journal of the American Ceramic Society
Journal of the American Ceramic Society
123456789101112131415161718192021222324252627282930313233343536373839404142434445464748495051525354555657585960

For Peer Review
Fig 4
0
50
100
150
200
0 200 400 600 800 1000
Shear rate / s-1
She
ar S
tres
s / P
a
17 vol% NH4OH plus 2 min ultrasound
19 vol% TMAH plus 2 min ultrasound
Page 25 of 34
Journal of the American Ceramic Society
Journal of the American Ceramic Society
123456789101112131415161718192021222324252627282930313233343536373839404142434445464748495051525354555657585960

For Peer Review
Fig 5
0
50
100
150
200
0 200 400 600 800 1000
Shear rate / s-1
She
ar S
tres
s /
Pa
15 vol%
1 min
2 min
Page 26 of 34
Journal of the American Ceramic Society
Journal of the American Ceramic Society
123456789101112131415161718192021222324252627282930313233343536373839404142434445464748495051525354555657585960
For Peer Review
0.0
0.2
0.4
0.6
0.8
1.0
0 2 4 6 8Ultrasound time / min
Vis
cosi
ty /
Pas
100 s-1 b
0.0
0.2
0.4
0.6
0.8
1.0
0 2 4 6 8Ultrasound time / min
Vis
cosi
ty /
Pa
s
100 s-1 b
Fig 6
0
50
100
150
200
0 200 400 600 800 1000Shear rate / s-1
She
ar S
tres
s / P
a
a1 min
3 min4 min
5 min
6 min
Page 27 of 34
Journal of the American Ceramic Society
Journal of the American Ceramic Society
123456789101112131415161718192021222324252627282930313233343536373839404142434445464748495051525354555657585960

For Peer Review
Fig 7
0
0.1
0.2
0.3
0 2 4 6 8No. of days
Vis
cosi
ty /
Pa
s
2 min
4 min
8 min
100 s-1
Page 28 of 34
Journal of the American Ceramic Society
Journal of the American Ceramic Society
123456789101112131415161718192021222324252627282930313233343536373839404142434445464748495051525354555657585960

For Peer Review
Fig 8
0.0
0.2
0.4
0.6
0.8
1.0
0.00 0.05 0.10 0.15 0.20
Volume fraction
Agg
lom
erat
e si
ze / µ m Without ultrasound
2 min ultrasound
100 s-1
0.0
0.2
0.4
0.6
0.8
1.0
0.00 0.05 0.10 0.15 0.20
Volume fraction
Agg
lom
erat
e si
ze / µ m
Without ultrasound
2 min ultrasound
Page 29 of 34
Journal of the American Ceramic Society
Journal of the American Ceramic Society
123456789101112131415161718192021222324252627282930313233343536373839404142434445464748495051525354555657585960
For Peer Review
b
c d
Fig 9
Page 30 of 34
Journal of the American Ceramic Society
Journal of the American Ceramic Society
123456789101112131415161718192021222324252627282930313233343536373839404142434445464748495051525354555657585960

For Peer Review
Fig 10
0.0
0.2
0.4
0.6
0.8
1.0
0 0.1 0.2 0.3Volume fraction
Vis
cosi
ty /
Pas
Application of ultrasound
2 min
10 min
5 min
0.0
0.2
0.4
0.6
0.8
1.0
0 0.1 0.2 0.3Volume fraction
Vis
cosi
ty /
Pas
Application of ultrasound
0.0
0.2
0.4
0.6
0.8
1.0
0 0.1 0.2 0.3Volume fraction
Vis
cosi
ty /
Pa
s
Application of ultrasound
10 min
5 min2 min
100 s-1
Page 31 of 34
Journal of the American Ceramic Society
Journal of the American Ceramic Society
123456789101112131415161718192021222324252627282930313233343536373839404142434445464748495051525354555657585960
For Peer Review0
20
40
60
80
100
0 200 400 600 800 1000
Shear rate / s-1
She
ar S
tres
s / P
a
aNo ultrasound
24.0 vol%9.0 vol%
5.0 vol%
0
20
40
60
80
100
0 200 400 600 800 1000
Shear rate / s-1
She
ar S
tres
s / P
a
b24 vol%
2 min 4 min
6 min
Fig 11
0
20
40
60
80
100
0 200 400 600 800 1000Shear rate / s-1
She
ar S
tres
s / P
a
28 vol%
2 min ultrasound at 24 vol%
Multi-ultrasound
c
Page 32 of 34
Journal of the American Ceramic Society
Journal of the American Ceramic Society
123456789101112131415161718192021222324252627282930313233343536373839404142434445464748495051525354555657585960
For Peer Review
Fig 12
0.00
0.05
0.10
0.15
0 200 400 600 800 1000Shear rate / s-1
Vis
cosi
ty /
Pa
s c
b
a
Page 33 of 34
Journal of the American Ceramic Society
Journal of the American Ceramic Society
123456789101112131415161718192021222324252627282930313233343536373839404142434445464748495051525354555657585960

For Peer Reviewa b
d
Fig 13
c
Page 34 of 34
Journal of the American Ceramic Society
Journal of the American Ceramic Society
123456789101112131415161718192021222324252627282930313233343536373839404142434445464748495051525354555657585960