Premium Mobile Apps in North America: Enterprise Preferences and Plans
28
Premium Mobile Apps in North America -- Enterprise Preferences and Plans -- Jeanine Sterling, Senior Industry Analyst Mobile and Wireless Communications June 30, 2009
-
Upload
frost-sullivan -
Category
Business
-
view
1.173 -
download
1
Transcript of Premium Mobile Apps in North America: Enterprise Preferences and Plans

Premium Mobile Apps in North America-- Enterprise Preferences and Plans --
Jeanine Sterling, Senior Industry Analyst
Mobile and Wireless Communications
June 30, 2009

2
Today’s Focus Points
• Premium Mobile Apps in the Workplace: A Market Overview
• Enterprise Preferences and Plans (1Q Survey Results)
� Level of Perceived Need
� Deployment Plans
� Barriers to Implementation
� ROI Metrics
• Conclusions

3
Economic Downturn – Impacts Still Raining Down
• Financial crisis continues to strongly influence individual enterprise wireless strategies and expenditures.
• Companies remain in wait-and-see mode: Consumer sentiment is improving; however, unemployment figures remain high and conditions remain volatile.
• Frost & Sullivan Mobile and Wireless Advisory Board feedback:
o Cautious optimism
o Solid ROI a must on any new purchase
o Deployment slow-down remains in place
o SaaS model gaining in popularity

4
On the flip side…
• Mobile worker population is growing.
• A “changing of the guard” is taking place at management levels.
• Strong worker expectations exist re: mobile access to corporate applications and information.
• Both hard and soft benefits of premium mobile apps are being recognized and valued.
• IT software typically survives economic downturns in better shape than hardware.
However…. Is the North American enterprise really ready to deploy more than just wireless
email and mobile Internet access to its growing population of mobile workers?
5
Premium Mobile Apps in the Workplace-- A Market Overview --

6
Mobile Data Services: Continued Growth
0.0
20000.0
40000.0
60000.0
80000.0
100000.0
120000.0
140000.0
160000.0
180000.0
200000.0
2007 2008 2009 2010 2011 2012 2013 2014
Revenues (
$ M
illio
n)
0
5
10
15
20
25
30
35
40
Year
% o
f R
evenues
Mobile Service Revenues($ Million)
Mobile Data Revenues($ Million)
% of Revenues
• 2009 Mobile Data Services revenues are expected to comprise ~25% -- or $40.9 billion – of total mobile services revenues in U.S.

7
Four Premium Mobile Enterprise Application Categories
� Local Field Fleet Management
� Service Inventory Tracking and Management
� Mobile Product/Cargo Tracking
� Data Capture Technologies: Barcode scanning, Image capture, Wireless asset tracking devices, RFID, Sensor solutions, Location tagging
Field Asset Management (FAM) Mobile Office
� Wireless push email
� PIM – Personal Information Management
� Security and management support and administration
� Worker Track, Locate, Monitor
� Mapping & Navigation
� Exception Alerts and Geo-Fencing
� Messaging
� Business Intelligence and Reporting
� Worker Management (Time Cards, Job Progress Updates, etc.)
� Scheduling, Dispatch, and Event Confirmation
� Data Collection (Signature/Image Capture, Barcode Scanning, Wireless Forms)
Mobile Resource Management (MRM)
Mobile Sales Force Automation (SFA)
� Wireless SFA on handheld devices
� Off-line PDA SFA with wired synchronization to back-end CRM/SFA systems
� Laptop SFA – wired or wireless
� Central repository for:
• Accounts
• History
• Contacts
• Calendar
• Tasks
• Inventory
• Sales pipeline

8
Market Trends and Issues
• Growing traction of location-aware services
• Intensifying verticalization
• Dispersion through the mobile workforce
• Progress on back-office integration
• Emphasis on ROI as key selling point
2008
• Continued quest for optimal monetization model(s)
• Appealing to the SMB sector
• More intelligent data mining
• Centralized approach to mobility management
• Growing emphasis on customer satisfaction as key selling point
2009

9
Polling Question
• Finding the optimal monetization model(s)
• Appealing to the SMB segment
• Making data-mining more intelligent
• Implementing a centralized approach to mobility management
• Highlighting the customer satisfaction benefits of these solutions
Which 2009 trend is most critical to the long-term success of our four premium mobile applications?

10
Premium Mobile Apps-- Enterprise Preferences and Plans --

11
First Quarter 2009 Mobile Apps Survey
• January 2009 online research survey.
• 150 enterprise mobile and wireless decision-makers.
• Sample divided evenly in terms of company size:• Fewer than 500 employees
• 500+ employees
• Wide range of industries represented, including:• Business/Professional Services
• Manufacturing and Distribution
• Telecommunications/IT
• Financial/Insurance Services
• Retail
• Healthcare
• U.S. vs. Canada representation.

12
Four Areas of Questioning
• Level of Perceived Need
• Plans for Deployment
• Barriers to Implementation
• Measures of Success
� Local Field Fleet Management
� Service Inventory Tracking and Management
� Mobile Product/Cargo Tracking
� Data Capture Technologies: Barcode scanning, Image capture, Wireless asset tracking devices, RFID, Sensor solutions, Location tagging
Field Asset Management (FAM) Mobile Office
� Wireless push email
� PIM – Personal Information Management
� Security and management support and administration
� Worker Track, Locate, Monitor
� Mapping & Navigation
� Exception Alerts and Geo-Fencing
� Messaging
� Business Intelligence and Reporting
� Worker Management (Time Cards, Job Progress Updates, etc.)
� Scheduling, Dispatch, and Event Confirmation
� Data Collection (Signature/Image Capture, Barcode Scanning, Wireless Forms)
Mobile Resource Management (MRM)
Mobile Sales Force Automation (SFA)
� Wireless SFA on handheld devices
� Off-line PDA SFA with wired synchronization to back-end CRM/SFA systems
� Laptop SFA – wired or wireless
� Central repository for:
• Accounts
• History
• Contacts
• Calendar
• Tasks
• Inventory
• Sales pipeline

13
0
5
10
15
20
25
30
35
40
45
50
Very Necessary Somewhat
Necessary
Not Necessary
at All
Perc
ent of R
espondents
(%
)
Field Asset ManagementField Asset ManagementField Asset ManagementField Asset Management
Mobile OfficeMobile OfficeMobile OfficeMobile Office
Mobile Resource ManagementMobile Resource ManagementMobile Resource ManagementMobile Resource Management
Mobile Sales Force Automation Mobile Sales Force Automation Mobile Sales Force Automation Mobile Sales Force Automation
Question: How necessary is this solution in helping to meet your organization’s business goals?
North America
Level of Perceived Need – All Respondents

14
Level of Perceived Need -- U.S. vs. Canada
Very Very Very Very Necessary Necessary Necessary Necessary
18%18%18%18%
Somewhat Somewhat Somewhat Somewhat Necessary Necessary Necessary Necessary
26%26%26%26%
Not at All Not at All Not at All Not at All Necessary Necessary Necessary Necessary
56%56%56%56%
Canadian RespondentsCanadian RespondentsCanadian RespondentsCanadian Respondents
Very Very Very Very Necessary Necessary Necessary Necessary
41%41%41%41%Somewhat Somewhat Somewhat Somewhat Necessary Necessary Necessary Necessary
34%34%34%34%
Not at All Not at All Not at All Not at All Necessary Necessary Necessary Necessary
25%25%25%25%
U.S. RespondentsU.S. RespondentsU.S. RespondentsU.S. Respondents
Very Very Very Very Necessary Necessary Necessary Necessary
30%30%30%30%
Somewhat Somewhat Somewhat Somewhat Necessary Necessary Necessary Necessary
24%24%24%24%
Not at All Not at All Not at All Not at All Necessary Necessary Necessary Necessary
46%46%46%46%
Canadian RespondentsCanadian RespondentsCanadian RespondentsCanadian Respondents
Very Very Very Very Necessary Necessary Necessary Necessary
54%54%54%54%Somewhat Somewhat Somewhat Somewhat Necessary Necessary Necessary Necessary
31%31%31%31%
Not at All Not at All Not at All Not at All Necessary Necessary Necessary Necessary
15%15%15%15%
U.S. RespondentsU.S. RespondentsU.S. RespondentsU.S. Respondents
Mobile Resource Management (MRM) Mobile Office
Question: How necessary is this solution in helping to meet your organization’s
business goals?
• U.S. companies significantly more likely to see value in Premium Mobile apps
• Most valued app – Mobile Office – still shows wide divergence in U.S. vs. Canada perceptions

15
Deployment Plans – All Respondents
0
5
10
15
20
25
30
35
40
45
50
Have app,
Expanding within 12
months
Have app, No plans
to expand
Plan to intro app
within 3 years
No app, No plans to
deploy
Perc
ent of R
espondents
(%
)
Question: Please indicate your organization’s current plans for implementing this solution.
Field Asset ManagementField Asset ManagementField Asset ManagementField Asset Management
Mobile OfficeMobile OfficeMobile OfficeMobile Office
Mobile Resource ManagementMobile Resource ManagementMobile Resource ManagementMobile Resource Management
Mobile Sales Force Automation Mobile Sales Force Automation Mobile Sales Force Automation Mobile Sales Force Automation
North America

16
Deployment Plans -- U.S. vs. Canada
Canadian RespondentsCanadian RespondentsCanadian RespondentsCanadian Respondents
U.S. RespondentsU.S. RespondentsU.S. RespondentsU.S. Respondents
Canadian RespondentsCanadian RespondentsCanadian RespondentsCanadian Respondents
U.S. RespondentsU.S. RespondentsU.S. RespondentsU.S. Respondents
Mobile Sales Force Automation Mobile Office
Question: Please indicate your organization’s current plans for
implementing this solution.
• Striking difference in willingness to deploy premium mobile apps
• Most deployed app in Canada sample – Mobile Office – still shows wide delta between U.S. and Canada actions/plans
14%14%14%14%
8%8%8%8%56%56%56%56%
12%12%12%12%
10%10%10%10%
31%31%31%31%
19%19%19%19%
27%27%27%27%
17%17%17%17%
6%6%6%6%
16%16%16%16%
10%10%10%10%
40%40%40%40%22%22%22%22%
12%12%12%12%
37%37%37%37%
30%30%30%30%
13%13%13%13%
16%16%16%16%
4%4%4%4%
Have app, Expanding within 12 months
Have app, No plans to expand
Plan to intro within 12 months
Plan to intro within 2-3 years
No app, No plans to deploy

17
0 20 40 60 80 100
Implementation Barriers – For Those With No Plans to Deploy
Question: Please indicate which of the following are the most significant barriers to implementing this solution within your company.
Average Percentage of Respondents (%)
No perceived need
Cost of implementation
High TCO
ROI benefits are unclear
Other
Security concerns
Lack of internal expertise
Lack of knowledge re: vendors/solutions
Difficulty integrating into back-office systems
Employee resistance
Privacy concerns
79.5%
22.7%
19.2%
9.5%
9.0%
7.2%
6.5%
5.7%
4.5%
4.5%
4.0% North America

18
MRM Implementation Barriers – U.S. vs. Canada
Question for companies with no plans to deploy MRM: Please indicate which of the following are the most significant barriers to implementing an MRM solution within your company.
Source: Frost & Sullivan Online Survey, January 2009
0 20 40 60 80 100
No perceived need
Cost of implementation
High TCO
ROI benefits are unclear
72%
80%
64%
24%23%
25%
14%
13%
14%
10%0%
21%
All respondents
Canadian respondents
U.S. respondents
Percent of Respondents (%)

19
MRM Implementation Barriers – By Company Size
Question for companies with no plans to deploy MRM: Please indicate which of the following are the most significant barriers to implementing an MRM solution within your company.
Source: Frost & Sullivan Online Survey, January 2009
0
10
20
30
40
50
60
70
80
90
100
No need
Cost of implementation
79%
21%
57%
40%40%
Perc
ent of R
espondents
(%
)
No need
Cost of implementation
Unclear ROI
<500 Employees<500 Employees<500 Employees<500 Employees 500+ Employees500+ Employees500+ Employees500+ Employees
0
10
20
30
40
50
60
70
80
90
100
13%
High TCO
40%

20
MRM Implementation Barriers – By Organizational Level
0
10
20
30
40
50
60
70
80
90
100
0
10
20
30
40
50
60
70
80
90
100
Question for companies with no plans to deploy MRM: Please indicate which of the following are the most significant barriers to implementing an MRM solution within your company.
Source: Frost & Sullivan Online Survey, January 2009
0
10
20
30
40
50
60
70
80
90
100
No need
Cost of implementation
79%
57%
Perc
ent of R
espondents
(%
)
CXO Respondents CXO Respondents CXO Respondents CXO Respondents VP RespondentsVP RespondentsVP RespondentsVP Respondents
26%
IT Mgr/Staff RespondentsIT Mgr/Staff RespondentsIT Mgr/Staff RespondentsIT Mgr/Staff Respondents
43%
29%
No need
Cost of implementation
Unclear ROI
No need
Security Concerns
High TCO
Lack of Expertise
50%
38%
25% 25%

21
Implementation Barriers – For Those Planning to Deploy Within Next Three Years
Question: Please indicate which of the following are the most significant barriers as to why your organization has yet to implement this solution.
0 20 40 60
Average Percentage of Respondents (%)
Cost of implementation
Security concerns
High TCO
ROI benefits are unclear
Privacy concerns
Lack of knowledge re: vendors/solutions
Lack of internal expertise
Difficulty integrating into back-office systems
Employee resistance
Technology not ready
50.0%
32.0%
31.5%
29.7%
24.5%
15.5%
13.2%
11.7%
11.0%
9.7% North America
22
Polling Question
• Creating the right product
• Selling through the right channels
• Pricing the solution appropriately
• Identifying key target markets
• Crafting effective marketing messages
If you’re a vendor or channel for enterprise mobile apps, which is your biggest challenge at this time?
23
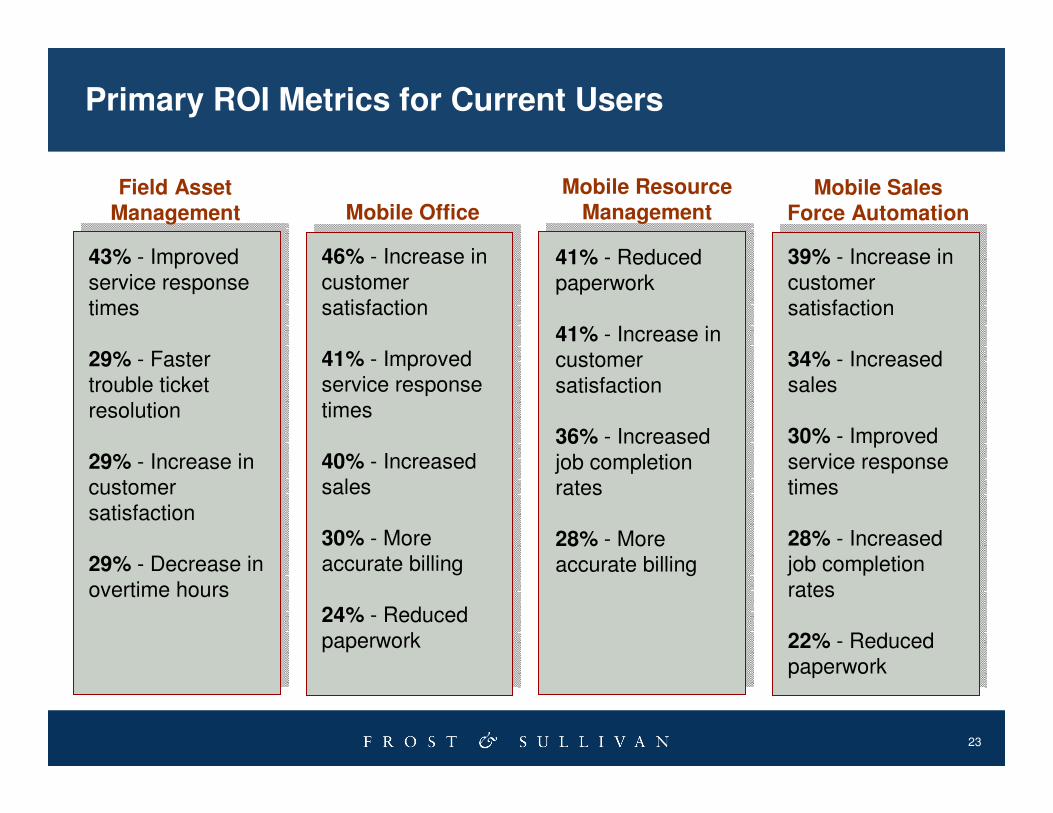
Primary ROI Metrics for Current Users
43% - Improved service response times
29% - Faster trouble ticket resolution
29% - Increase in customer satisfaction
29% - Decrease in overtime hours
46% - Increase in customer satisfaction
41% - Improved service response times
40% - Increased sales
30% - More accurate billing
24% - Reduced paperwork
Field Asset Management Mobile Office
Mobile Resource Management
41% - Reduced paperwork
41% - Increase in customer satisfaction
36% - Increased job completion rates
28% - More accurate billing
39% - Increase in customer satisfaction
34% - Increased sales
30% - Improved service response times
28% - Increased job completion rates
22% - Reduced paperwork
Mobile Sales Force Automation

24
Conclusions
• Premium mobile applications are already viewed as business enablers by a sizeable percentage of companies.
• Current users are ready to expand.
• Fence-sitters present a manageable array of concerns.
• Adoption barriers focus on lack of need, cost concerns, and security/privacy issues. These barriers vary in intensity by geography, company size, and organizational level.
• Marketing strategy is critical.
• These apps provide a competitive advantage now; but will soon morph to become a competitive requirement.
25
Next Steps
� Request a proposal for a Growth Partnership Service to support you and your team to accelerate the growth of your company. ([email protected])1-877-GoFrost (1-877-463-7678)
� Join us at our annual Growth, Innovation, and Leadership 2009: A Frost & Sullivan Global Congress on Corporate Growth, September 13-16 2009, Hyatt Scottsdale Resort & Spa at Gainey Ranch, Scottsdale, AZ(www.gil-global.com)
� Register for the next Chairman’s Series on Growth:
The CEO's Growth Team™: Research & Development Driving Growth and
Innovation (April 7th) (http://www.frost.com/growth)
� Register for Frost & Sullivan’s Growth Opportunity Newsletter and keepabreast of innovative growth opportunities(www.frost.com/news)

26
Poll Question
Which of the following would you like to discuss in more depth? (Select all that apply)
• A Growth Partnership Services Proposal: A discussion proposal which will illustrate how Frost & Sullivan works with you to accelerate growth
• Growth Strategy Dialogue: Schedule a one-on-one industry specific strategy session
• Review a proposal for conducting a 360 Degree Visionary Workshop
• Growth Consulting: consult with us on a specific project in progress: i.e. new product launch; geographic expansion strategy; M&A; etc.
• GIL 2009: Obtaining more information on attending the Growth, Innovation and Leadership Global Congress
*Turn off your pop-up blocker, so you can respond to the next polling question

27
Your Feedback is Important to Us
Growth Forecasts?
Competitive Structure?
Emerging Trends?
Strategic Recommendations?
Other?
Please inform us by taking our survey.
What would you like to see from Frost & Sullivan?

28
For Additional Information
Naylor Gray
Global Marketing
(210) 247-24376
Craig Hays
Director of Sales
Information and Communications Technologies
(210) 247-2460
Jeanine Sterling
Senior Industry Analyst
Mobile and Wireless Communications
(586) 263-4454