PREMIUM MEDICAL CANNABIS POWERED BY … · PREMIUM MEDICAL CANNABIS POWERED BY SUN Q2 2018 Investor...
21
PREMIUM MEDICAL CANNABIS POWERED BY SUNLIGHT
Transcript of PREMIUM MEDICAL CANNABIS POWERED BY … · PREMIUM MEDICAL CANNABIS POWERED BY SUN Q2 2018 Investor...

PREMIUM MEDICAL CANNABIS
POWERED BY SUNLIGHT

PREMIUM MEDICAL CANNABIS
POWERED BY SUN
Q2 2018 Investor Presentation
January 10, 2018
This documentation is a presentation (the “Presentation”) of general background information about Aphria Inc.’s (“Aphria”) activities current as of January 10, 2018, unless stated otherwise. It is information in a summary form and does not purport to be complete. It is not intended to be relied upon as advice to investors or potential investors and does not take into account the investment objectives, financial situation or needs of any particular investor. These should be considered, with or without professional advice, when deciding if an investment is appropriate.
This Presentation does not constitute or form part of any offer for sale or solicitation of any offer to buy or subscribe for securities nor shall it or any part of it form the basis of or be relied on in connection with, or act as any inducement to enter into, any contract or commitment whatsoever. Recipients of this Presentation who are considering acquiring securities of Aphria are reminded that any such purchase or subscription must not be made on the basis of the information contained in this Presentation but are referred to the entire body of publicly disclosed information regarding Aphria.
The information contained in this Presentation is derived solely from management of Aphria and otherwise publicly available information concerning Aphria and does not purport to be all-inclusive or to contain all the information that an investor may desire to have in evaluating whether or not to make an investment in Aphria. The information has not been independently verified and is subject to material updating, revision and further amendment, and is qualified entirely by reference to Aphria’s publicly disclosed information.
No representation or warranty, express or implied, is made or given by or on behalf of Aphria or any of its affiliates, directors, officers or employees as to the accuracy, completeness or fairness of the information or opinions contained in this Presentation and no responsibility or liability is accepted by any person for such information or opinions. Aphria does not undertake or agree to update this Presentation or to correct any inaccuracies in, or omissions from, this Presentation that may become apparent. No person has been authorized to give any information or make any representations other than those contained in this Presentation and, if given and/or made, such information or representations must not be relied upon as having been so authorized. The information and opinions contained in this Presentation are provided as at the date of this Presentation. The contents of this Presentation are not to be construed as legal, financial or tax advice. Each prospective investor should contact his, her or its own legal adviser, independent financial adviser or tax adviser for legal, financial or tax advice.
Certain statements in this Presentation may constitute forward-looking information, including future-oriented financial information and financial outlooks, within the meaning of applicable securities laws. Forward-looking information may relate to Aphria’s future outlook and anticipated events or results and may include statements regarding Aphria’s financial results, future financial position, expected growth of cash flows, business strategy, budgets, projected costs, projected capital expenditures, taxes, plans, objectives, potential synergies, industry trends and growth opportunities. Often but not always, forward-looking information can be identified by the use of words such as “anticipate”, “believe”, “expect”, “project”, “estimate”, “likely”, “intend”, “should”, “could”, “may”, “might”, “target”, “plan” and other similar expressions or variations (including negative variations) of such words and phrases. Forward-looking information contained in this Presentation is based on certain assumptions regarding expected growth, results of operations, performance, industry trends and growth opportunities.
While management considers these assumptions to be reasonable, based on information available, they may prove to be incorrect. Forward-looking statements involve known and unknown risks, uncertainties and other factors which may cause the actual results, performance or achievements of Aphria to be materially different from any future results, performance or achievements expressed or implied by the forward-looking statements. These risks, uncertainties and other factors include, but are not limited to risks associated with general economic conditions; adverse industry events; marketing costs; loss of markets; future legislative and regulatory developments involving medical marijuana; inability to access sufficient capital from internal and external sources, and/or inability to access sufficient capital on favourable terms; the medical marijuana industry in Canada generally, income tax and regulatory matters; the ability of Aphria to implement its business strategies; competition; crop failure; currency and interest rate fluctuations, and the other risks discussed under the heading “Risk Factors” in Aphria’s Annual Information Form dated January 10, 2018. The foregoing factors are not intended to be exhaustive.
Although Aphria has attempted to identify important factors that could cause actual actions, events or results to differ materially from those described in forward-looking statements, there may be other factors that cause actions, events or results to differ from those anticipated, estimated or intended. Forward-looking statements contained herein are made as of the date hereof and Aphria and its directors, officers and employees disclaim any obligation to update any forward-looking statements, whether as a result of new information, future events or results or otherwise. There can be no assurance that forward-looking statements will prove to be accurate, as actual results and future events could differ materially from those anticipated in such statements. Accordingly, you should not place undue reliance on forward-looking statements due to the inherent uncertainty therein. All forward-looking information is expressly qualified in its entirety by this cautionary statement.
Forward-looking information and other information contained herein concerning management’s general expectations concerning the medical marijuana industry are based on estimates prepared by management using data from publicly available industry sources as well as from market research and industry analysis and on assumptions based on data and knowledge of this industry which management believes to be reasonable. However, this data is inherently imprecise, although generally indicative of relative market positions, market shares and performance characteristics. While management is not aware of any misstatements regarding any industry data presented herein, industry data is subject to change based on various factors.
This Presentation may not be reproduced, further distributed or published in whole or in part by any other person. Neither this Presentation nor any copy of it may be taken or transmitted into or distributed in any other jurisdiction which prohibits the same except in compliance with applicable laws. Any failure to comply with this restriction may constitute a violation of applicable securities law. Recipients are required to inform themselves of, and comply with, all such restrictions or prohibitions and Aphria does not accept liability to any person in relation thereto.
DISCLAIMER
1APHRIA INC. | Q2 INVESTORS PRESENTATION

Investment highlights
High growth potential
Well capitalized
License to sell medical marijuana
provides critical barrier to entry
Largest footprint in the industry
Low costs underpin
attractive cash flow potential
Significant near and mid-term
opportunities for growth
Established operations and experienced management
2APHRIA INC. | Q2 INVESTORS PRESENTATION

TECHNOLOGY
GROWINGOPERATIONS
SCIENCE
BRANDING
INVESTMENT
INNOVATION
Leamington, ON (269 acres)265 Talbot Road (36)269 Talbot Road (11)239 Talbot Road (5)521 Mersea Road 8 (100)336 Mersea Road 3 (16)225 Talbot Road (1)GrowCo - Double Diamond (100)
Duncan, BC (5 acres)Broken Coast
Arizona (40 acres)Copperstate Farms (10%)
MassRootsResolve Digital Health
Broken CoastTokyo Smoke
Oil capsulesTopicalsNutraceuticals
CannaRoyalty
Copperstate Farms
Green Acre Capital
Liberty Health Sciences, Inc.
Nuuvera Corp.
Resolve Digital Health, Inc.
Scientus Pharma
TS BrandCo Holdings, Inc.(Tokyo Smoke)
Tetra Bio-Pharma (TBP)CannPalMedlab (Australia)PhyTo Pain (TBP)
Aphria at a glance
3APHRIA INC. | Q2 INVESTORS PRESENTATION

Highly experienced management team
4APHRIA INC. | Q2 INVESTORS PRESENTATION
Vic NeufeldChief Executive Officer
20+Years in pharma
CEO of Jamieson Laboratories 1993-2014
Demonstrated vision, growth & performance
Cole CacciavillaniCo-Founder &VP. Growing Operations
35+Years in agri-business
Greenhouse industry pioneer and veteran
First-hand knowledge of Aphria’s greenhouses
John CerviniCo-Founder &VP. Infrastructure + Technology
20+Years in agri-business
Fourth generation greenhouse grower
Proven growth and expansion track record
Seed shares represent ~ 15% of outstanding float

All-in costs equal to cost of sales (excluding any fair value of biological assets adjustments) divided by grams sold in quarter. Cash costs equal to cost of sales less amortization reported in cost of sales, all divided by grams sold in quarter.
One of the lowest cost producers in the Canadian industry
0.00
0.50
1.00
1.50
2.00
2.50
3.00
3.50
4.00
Q2 - 17 Q3 - 17
Cash All-in
1.31
1.731.85
2.23
Q4 - 17
1.11
1.67
Q1 - 18
0.95
1.61
Q2 - 18
1.45
2.13
APHRIA INC. | Q2 INVESTORS PRESENTATION 5APHRIA INC. | Q2 INVESTORS PRESENTATION

Unique drivers of cost savings
CAPEX benefit
Production Costs
APHRIA INC. | Q2 INVESTORS PRESENTATION
NEW GREENHOUSE BUILD OR RETROFIT
$55 square foot
INDOOR GROW
$250 - $300 square foot
* - Ontario based 6APHRIA INC. | Q2 INVESTORS PRESENTATION
=FERTILIZER SAVINGS• Aphria’s cost - $0.005 / L
• Competitor’s fertilizer cost - $0.22 / L
• Aphria’s costs are 2% of our competitors
ELECTRICAL SAVINGS• Aphria’s annual electrical
costs $5.50 / sq. ft.
• Indoor grower’s annual electrical costs $65.00 / sq. ft.
• Aphria’s costs are 8% of our competitors*
3X – hours usage 2X – light density 2X – Cooling
THEM APHRIA

Focus on quality and safety
Our Seed-to-Sale Certified quality promise is our commitment to protecting the health and safety of Canadians by ensuring that we only sell clean, safe and pure cannabis 100% of the time. No exceptions.
Our comprehensive quality management program has over 500 steps and was adopted from the highly restricted and regulated NHP and OTC industries and go above and beyond the GPP requirements of the ACMPR.
7APHRIA INC. | Q2 INVESTORS PRESENTATION

8APHRIA INC. | Q2 INVESTORS PRESENTATION
Ample capacity to meet growing demand

Strategic relationship with Double Diamond Farms• Created GrowCo (51% owned by Aphria,
49% owned by Double Diamond)
• To purchase 100 acre farm owned by Double Diamond
• Almost 32 acres of state-of-the-art, Dutch style newly built greenhouses plus 72,000 square feet of infrastructure (first planted crop will be cannabis)
• Supply agreement to supply at least 120,000 kgs of dried cannabis to Aphria
• Requires $80 - $100 million in capital to purchase farm (at appraised value) plus retrofits for growing cannabis, funded by $20 million in seed capital by the Parties. Remainder to financed by loans from a commercial lender, with Aphria to lend any shortfall.
GrowCo
9APHRIA INC. | Q2 INVESTORS PRESENTATION
Overview ofBroken Coast
10APHRIA INC. | Q2 INVESTORS PRESENTATION
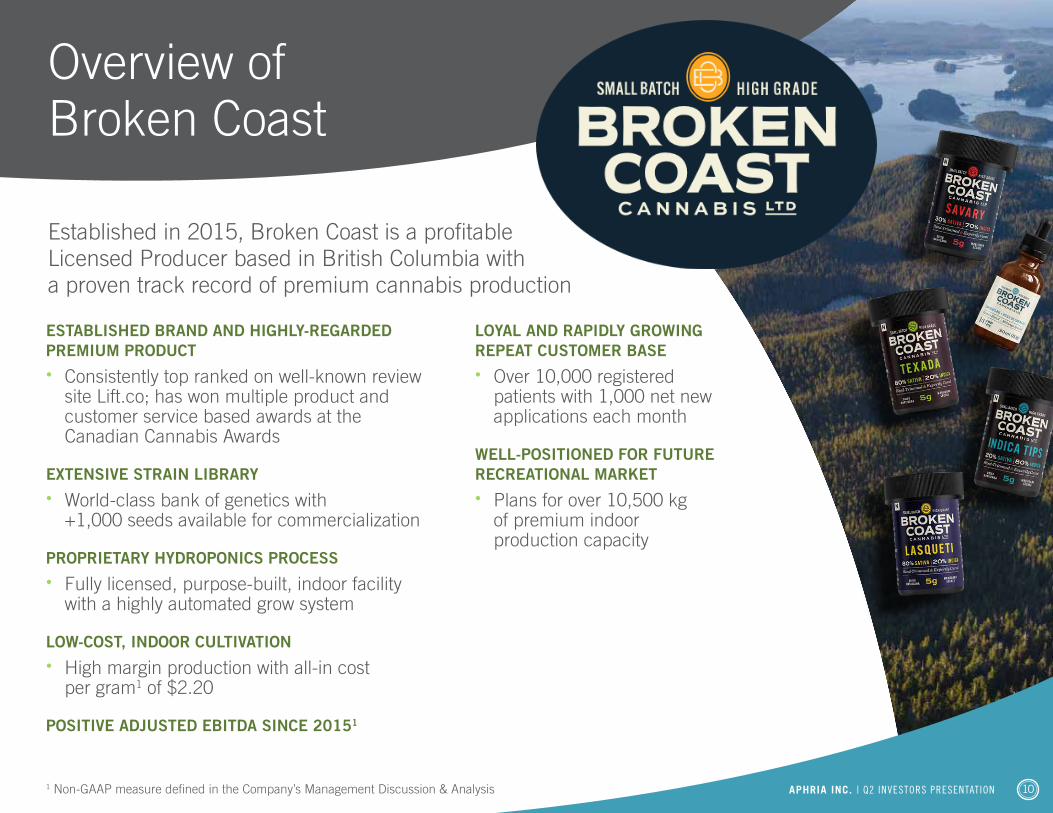
Established in 2015, Broken Coast is a profitable Licensed Producer based in British Columbia with a proven track record of premium cannabis production
ESTABLISHED BRAND AND HIGHLY-REGARDED PREMIUM PRODUCT • Consistently top ranked on well-known review
site Lift.co; has won multiple product and customer service based awards at the Canadian Cannabis Awards
EXTENSIVE STRAIN LIBRARY • World-class bank of genetics with
+1,000 seeds available for commercialization
PROPRIETARY HYDROPONICS PROCESS • Fully licensed, purpose-built, indoor facility
with a highly automated grow system
LOW-COST, INDOOR CULTIVATION • High margin production with all-in cost
per gram1 of $2.20
POSITIVE ADJUSTED EBITDA SINCE 20151
LOYAL AND RAPIDLY GROWING REPEAT CUSTOMER BASE • Over 10,000 registered
patients with 1,000 net new applications each month
WELL-POSITIONED FOR FUTURE RECREATIONAL MARKET • Plans for over 10,500 kg
of premium indoor production capacity
1 Non-GAAP measure defined in the Company’s Management Discussion & Analysis

Significant expansion of premium production
11APHRIA INC. | Q2 INVESTORS PRESENTATION
500
1,000
1,500
2,000
2,500
3,000
Timing of expansion plans based on when production is anticipated to be available.
2.5mm
FACI
LITY
SQU
ARE
FOOT
AGE
(000
s)
10126
44
104
301
2,401
50,000
100,000
150,000
200,000
250,000
2.3mm
PROD
UCTI
ON C
APAC
ITY
(Kg
PER
YEAR
)
9,0002,400
4,500
10,500
30,000
220,000
Aphria Broken Coast
FYE = Fiscal Year-End (Aphria – May 31)
CURRENT FYE 18 FYE 19 CURRENT FYE 18 FYE 19
Proforma marketpositioning
$70,000
$60,000
$50,000
$40,000
$30,000
$20,000
$10,000
$0
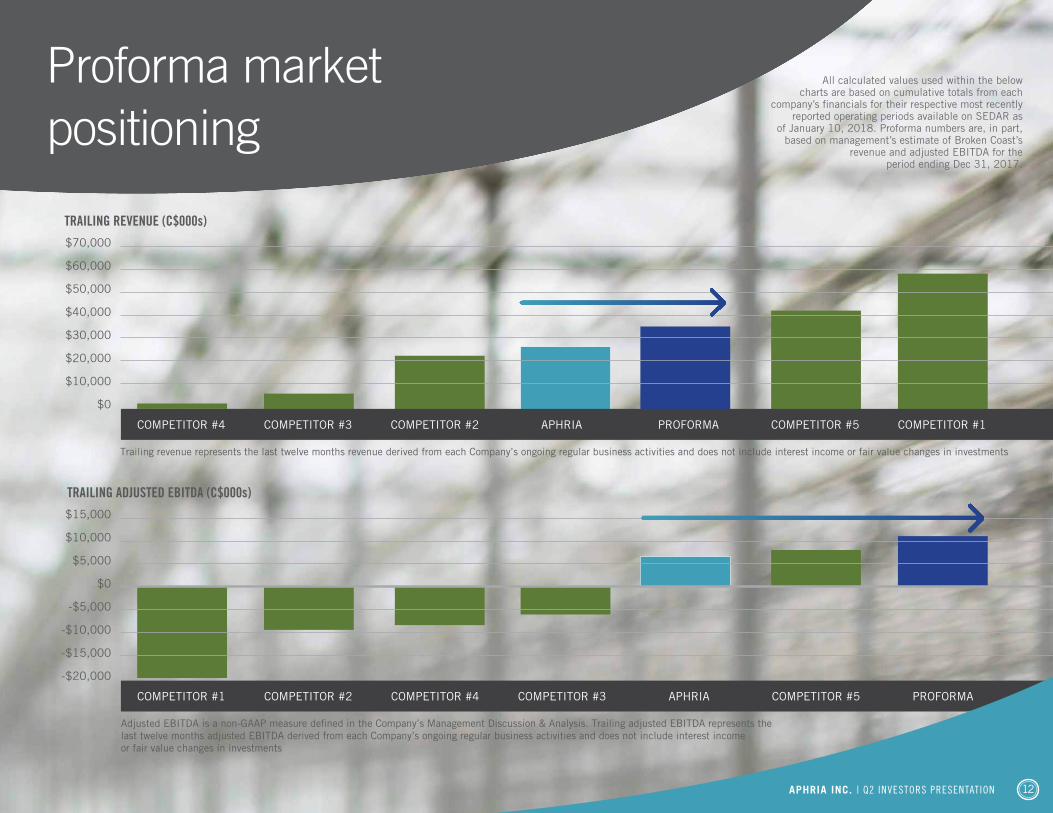
TRAILING REVENUE (C$000s)
Trailing revenue represents the last twelve months revenue derived from each Company’s ongoing regular business activities and does not include interest income or fair value changes in investments
COMPETITOR #4 COMPETITOR #3 COMPETITOR #2 COMPETITOR #5 COMPETITOR #1APHRIA PROFORMA
$15,000
$10,000
$5,000
$0
-$5,000
-$10,000
-$15,000
-$20,000
TRAILING ADJUSTED EBITDA (C$000s)
Adjusted EBITDA is a non-GAAP measure de�ned in the Company’s Management Discussion & Analysis. Trailing adjusted EBITDA represents the last twelve months adjusted EBITDA derived from each Company’s ongoing regular business activities and does not include interest income or fair value changes in investments
COMPETITOR #1 COMPETITOR #2 COMPETITOR #4 COMPETITOR #5 PROFORMACOMPETITOR #3 APHRIA
12APHRIA INC. | Q2 INVESTORS PRESENTATION
All calculated values used within the below charts are based on cumulative totals from each
company’s financials for their respective most recently reported operating periods available on SEDAR as
of January 10, 2018. Proforma numbers are, in part, based on management’s estimate of Broken Coast’s
revenue and adjusted EBITDA for the period ending Dec 31, 2017.

Leveraging two-pronged sales strategy
RETAIL• Strong distribution foundation
• Increasing patient sales
• Highly profitable (~ 70% margin with 30% costs below the line)
13APHRIA INC. | Q2 INVESTORS PRESENTATION
Unique cost structure enables Aphria to capitalize on wholesale advantages
WHOLESALE
• Sale of bulk product to other H.C. Licensed Producers and Licensed Dealers
• (~50% margin but no costs below the line)

Investment highlights
High growth potential
Well capitalized
License to sell medical marijuana
provides critical barrier to entry
Largest footprint in the industry
Low costs underpin
attractive cash flow potential
Significant near and mid-term
opportunities for growth
Established operations and experienced management
14APHRIA INC. | Q2 INVESTORS PRESENTATION

15APHRIA INC. | Q2 INVESTORS PRESENTATION
APPENDIX A Financials

Q2 - 2018 Q1 - 2018
Revenue (000’s) $ 8,504 $ 6,120
Kilograms sold 1,237.0 852.0
“All-in” cost of goods sold / gram $ 2.13 $ 1.61
Cash cost to produce / gram(Aphria’s definition)
$ 1.45 $ 0.95
Adjusted gross margin 68% 78%
Q2 Results
16APHRIA INC. | Q2 INVESTORS PRESENTATION

Revenue $ 8,504
Production costs 2,746
Gross profit before fair value adjustments 5,758
Fair value adjustment on sale of inventory 2,671
Fair value adjustment on growth of biological assets (3,115)
Gross profit 6,202
Expenses
General and administrative 1,973
Share-based compensation 2,200
Selling, marketing and promotion 2,819
Amortization 276
Research and development 80
7,348
Income of operations (1,146)
Other Items 7,898
Net Income before income taxes 6,752
Income taxes 297
Net income $ 6,455
Weighted average number of common shares – basic 138,839,530
Earnings per share – basic $ 0.05
Reconciling net income and earnings per share(Quarter 2 - ended November 30, 2017) (Unaudited - In thousands of Canadian dollars)
17APHRIA INC. | Q2 INVESTORS PRESENTATION
Under IFRS margins are 72.9% after excluding non-cash IFRS adjustments Gross Margins are 67.7%
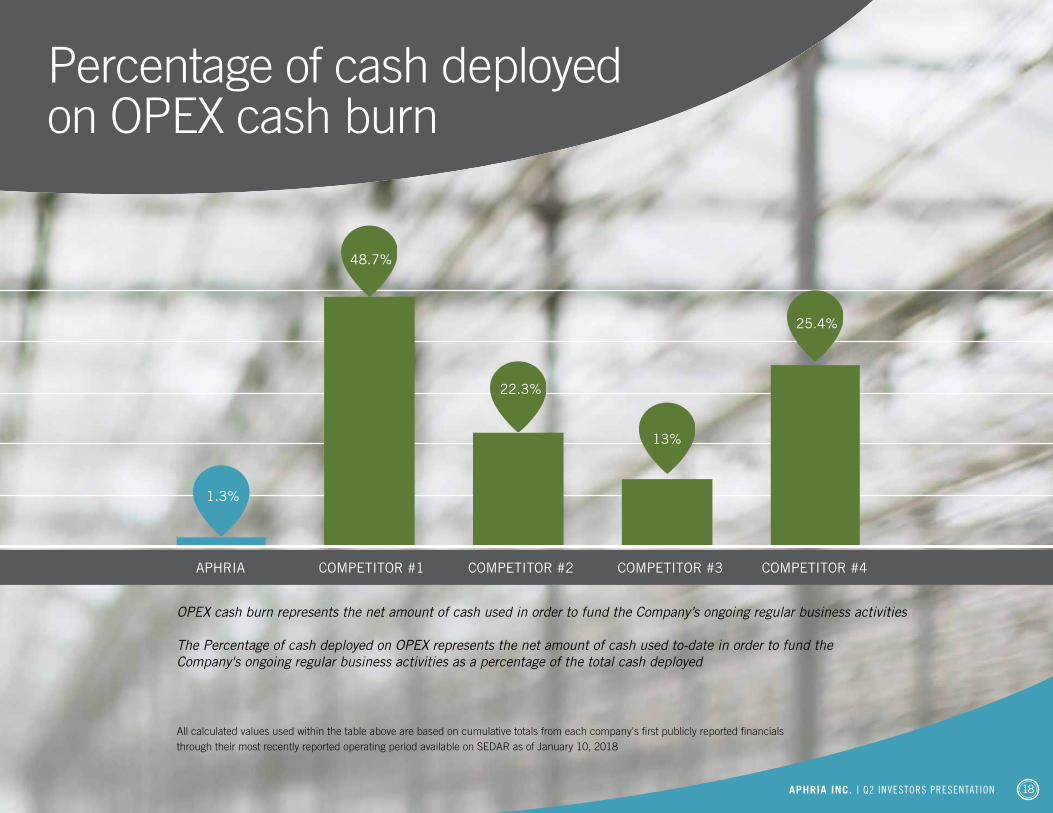
Percentage of cash deployed on OPEX cash burn
18APHRIA INC. | Q2 INVESTORS PRESENTATION
APHRIA COMPETITOR #1 COMPETITOR #2 COMPETITOR #3 COMPETITOR #4
OPEX cash burn represents the net amount of cash used in order to fund the Company’s ongoing regular business activities
The Percentage of cash deployed on OPEX represents the net amount of cash used to-date in order to fund the Company's ongoing regular business activities as a percentage of the total cash deployed
All calculated values used within the table above are based on cumulative totals from each company's first publicly reported financials through their most recently reported operating period available on SEDAR as of January 10, 2018
1.3%
48.7%
22.3%
13%
25.4%

EquitySTRONG WELL-CAPITALIZED BALANCE SHEET
(Quarter 2 - ended November 30, 2017)
STRONG BALANCE SHEET WITH $171.9 MILLION IN CASH AND NEAR CASH POSITION
CAPITAL STRUCTURE
19APHRIA INC. | Q2 INVESTORS PRESENTATION
• Working capital: $178.8 million
• Inventory: 2,346 Kilograms (or kilogram equivalents)
Amount Percentage Expiration
Common Shares Outstanding 151,871,247 93.1% -
Stock Options @ $0.60 2,500,000 1.5% June 2, 2019Stock Options @ $0.85 - $1.19 855,000 0.5% October 2017 to September 2020Stock Options @ $1.20 - $1.67 621,669 0.4% November 2018 to June 2021Warrants - RTO @ $1.50 2,880,550 1.8% December 2, 2019Warrants - Bought Deal @ $1.75 387,503 0.2% December 10, 2018Warrants @ $3.14 200,000 0.1% September 26, 2021Stock Options @$3.00 - $9.05 3,886,367 2.4% November 2, 2019 to June 2022
Fully Diluted Shares as at November 30, 2017 163,202,336 100.0%Bought Deal 8,363,651Shares issued on purchase of Broken Coast 14,579,191 Fully Diluted Shares as at January 15, 2018 186,145,178