Premium Horizons LTD
337
Financial Skills Workshop Jeff Lockhart
-
Upload
tural-kerimov -
Category
Business
-
view
44 -
download
1
Transcript of Premium Horizons LTD

Financial Skills WorkshopJeff Lockhart

Seminar Outline
Day 1
• Introduction to Advanced Financial Analysis
• Understanding and Analysing the Annual Financial Report
Day 2
• Financing the Business and Valuing the Business
• Cost Analysis and Management
Day 3
• Capital Budgeting & Investment Appraisal
• Budget Construction and Control

Introduction to Advanced Financial Analysis
Session One

What makes information useful?
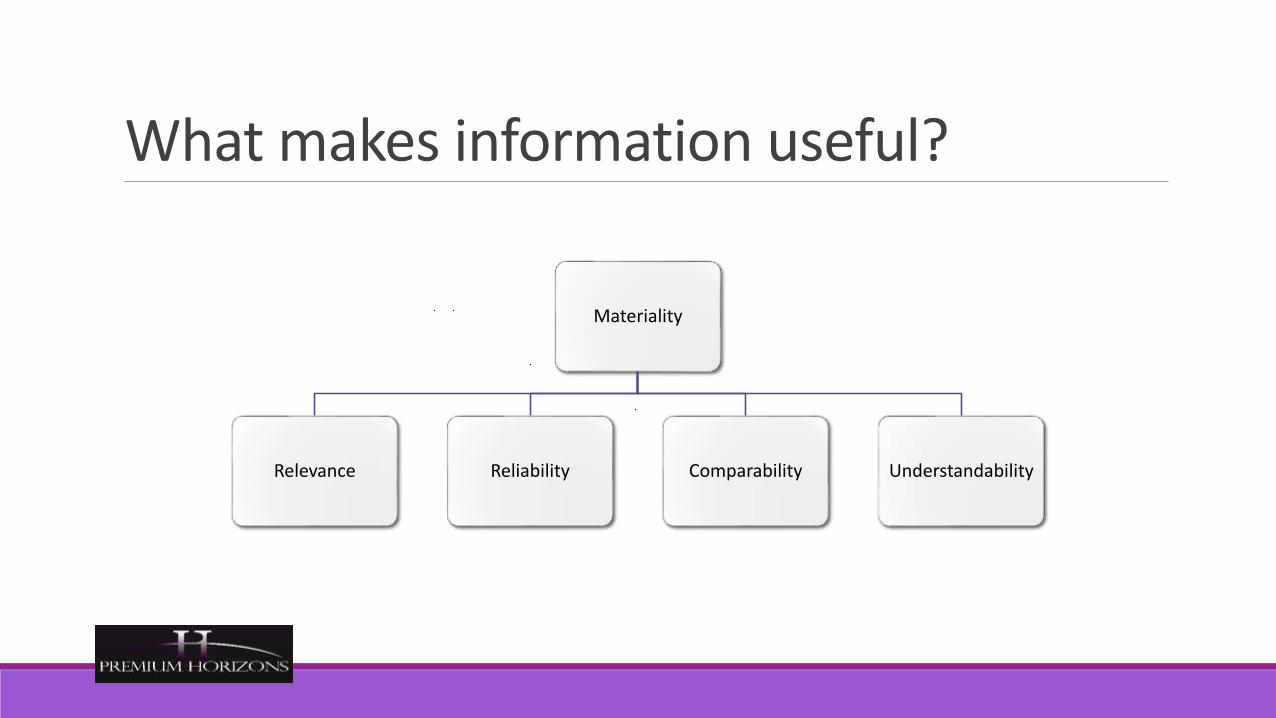
What makes information useful?
Materiality
Relevance Reliability Comparability Understandability

Financial Information
Accounting is a service provided for those who need information about an organisation’s financial performance,
its assets and it’s liabilities
• Information must be quantifiable, and converted into monetary terms;
• Performance is measured over a specified period of time;
• Assets relate to any possessions that the company owns;
• Liabilities relate to debts the organisation owes to third parties.

Financial InformationIs finance important?

Financial Objectives• The bottom line is the bottom line
• You cannot improve it if you do not know what is impacting upon it
• Financial management is critical to the planning process
• Good instinct will only get you so far
• To be knowledgeable is to be in control
• You must know what is driving performance in your business
• Unexpected surprises can destroy a business
• Knowing how to monitor your business is essential

Financial ObjectivesWhat are the financial objectives of a business?

Financial Objectives
• Classic economic theory assumes sole object of maximising profit
• The “classical theory of the firm”
• Neo-classicists assume profit maximisation cannot be achieved
• Objective is to satisfice a profit requirement
• Need a framework for managerial decision-making which recognises
• Diversity
• Management
• Decision-making process
• Environment

Financial ManagementWhat is the role and responsibility of Financial Management?

What is Financial Management ?
• The management of the finances of a business in orderto achieve financial objectives”
• The key objectives of financial management:
• Create wealth for the business
• Generate cash
• Provide a return on investment

Financial Management

Investment Decisions
Most important of the three decisions
• What is the optimal firm size?
• What specific assets should be acquired?
• What assets (if any) should be reduced or eliminated?
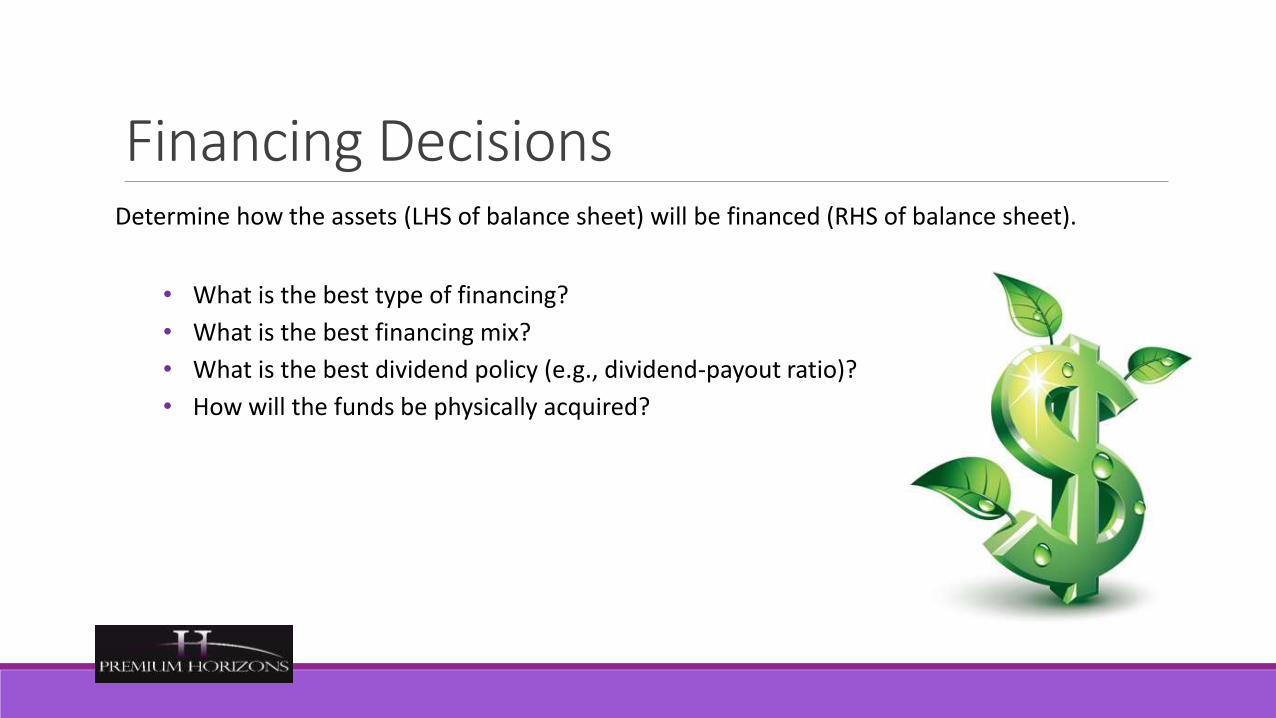
Financing DecisionsDetermine how the assets (LHS of balance sheet) will be financed (RHS of balance sheet).
• What is the best type of financing?
• What is the best financing mix?
• What is the best dividend policy (e.g., dividend-payout ratio)?
• How will the funds be physically acquired?

Asset Management Decisions
• How do we manage existing assets efficiently?
• Financial Manager has varying degrees of operating responsibility over assets.
• Greater emphasis on current asset management than fixed asset management.
The Principal-Agent ProblemHow do the owners of a large business know that the managers they have employed and who are making the key day-to-day decisions operate with the aim of maximising shareholder value in both the short term and the long run?

Principal Agent Problem
How do the owners of a large business know that the managers they have employed and who are making the key day-to-day decisions operate with the aim of maximising shareholder value in both the short term and the long run?

The Accounting Equation• The Accounting Equation
– Assets = Liabilities + Owners’ Equity
– Assets – Liabilities = Owners’ Equity (or Net Worth)
• Asset– Any economic resource that is expected to benefit a firm or an individual who owns it
• Liability– A debt that the firm owes to an outside party
• Owners’ Equity– Money that owners would receive if they sold all of a company’s assets and paid all of its liabilities

Financial Statements• Balance Sheets
– Supply detailed information about:
• Assets
– Current assets: Cash/assets that can be converted into cash within a year
– Fixed assets: Capital that has long-term use or value
– Intangible assets: Patents, trademarks, copyrights, etc.
• Liabilities
– Current liabilities: Debts that must be paid within one year, including accounts payable
– Long-term liabilities: Debts not due for at least a year
• Owners’ Equity
– Paid-in (invested) capital
– Retained earnings (net profits)
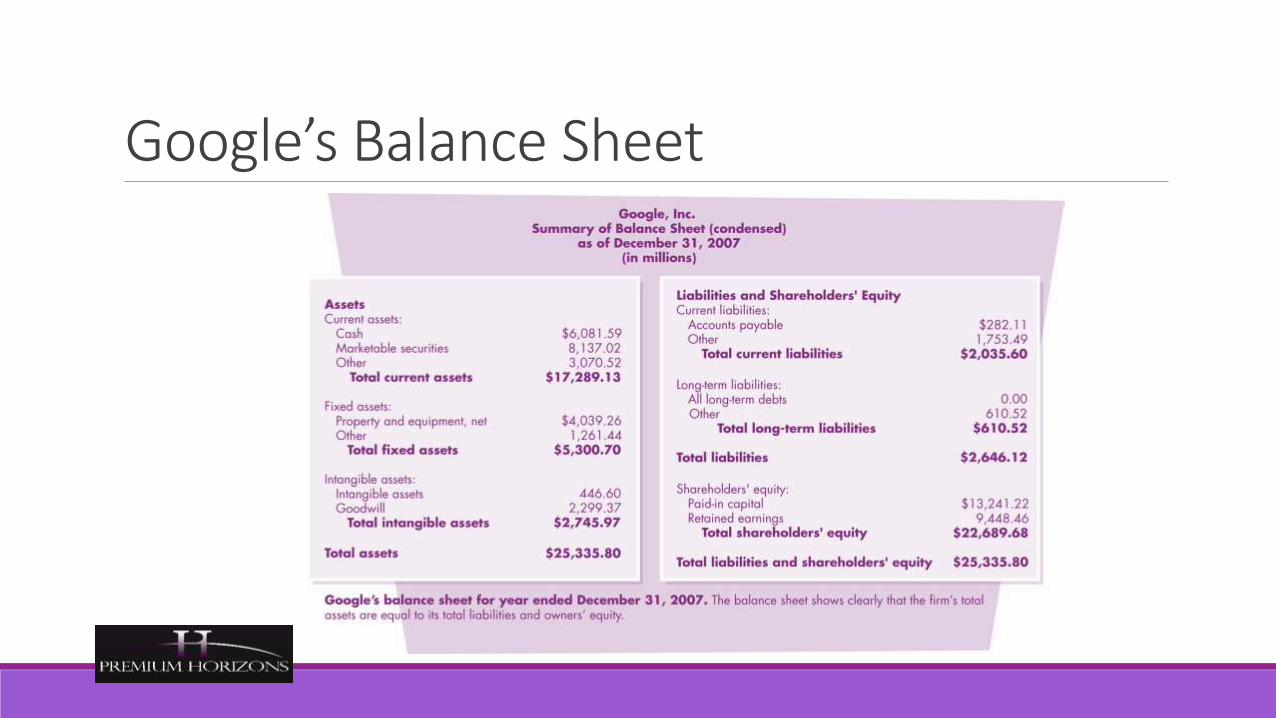
Google’s Balance Sheet
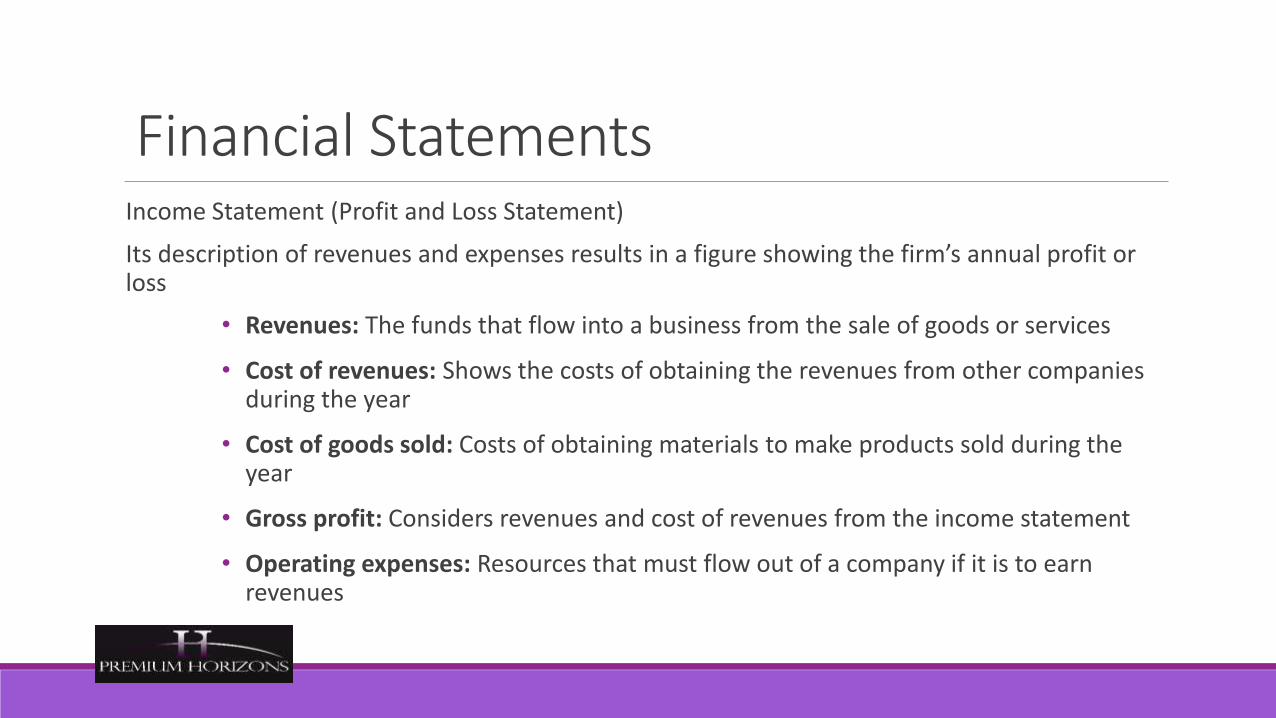
Financial StatementsIncome Statement (Profit and Loss Statement)
Its description of revenues and expenses results in a figure showing the firm’s annual profit or loss
• Revenues: The funds that flow into a business from the sale of goods or services
• Cost of revenues: Shows the costs of obtaining the revenues from other companies during the year
• Cost of goods sold: Costs of obtaining materials to make products sold during the year
• Gross profit: Considers revenues and cost of revenues from the income statement
• Operating expenses: Resources that must flow out of a company if it is to earn revenues
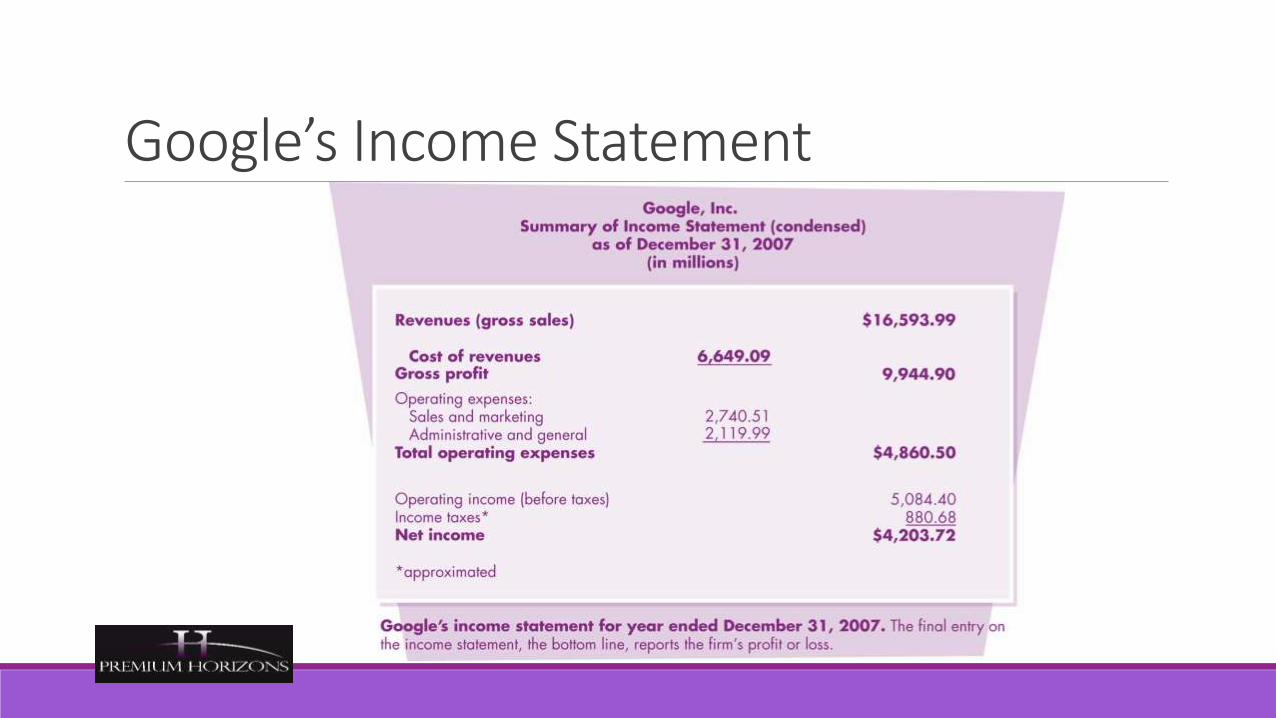
Google’s Income Statement

Financial Statements• Statements of Cash Flows
– Describes yearly cash receipts and cash payments
• Cash Flows from Operations: Concerns main operating activities: cash transactions involved in buying and selling goods and services
• Cash Flows from Investing: Net cash used in or provided by investing
• Cash Flows from Financing: Net cash from all financing activities
• The Budget
– A detailed report on estimated receipts and expenditures for a future period of time
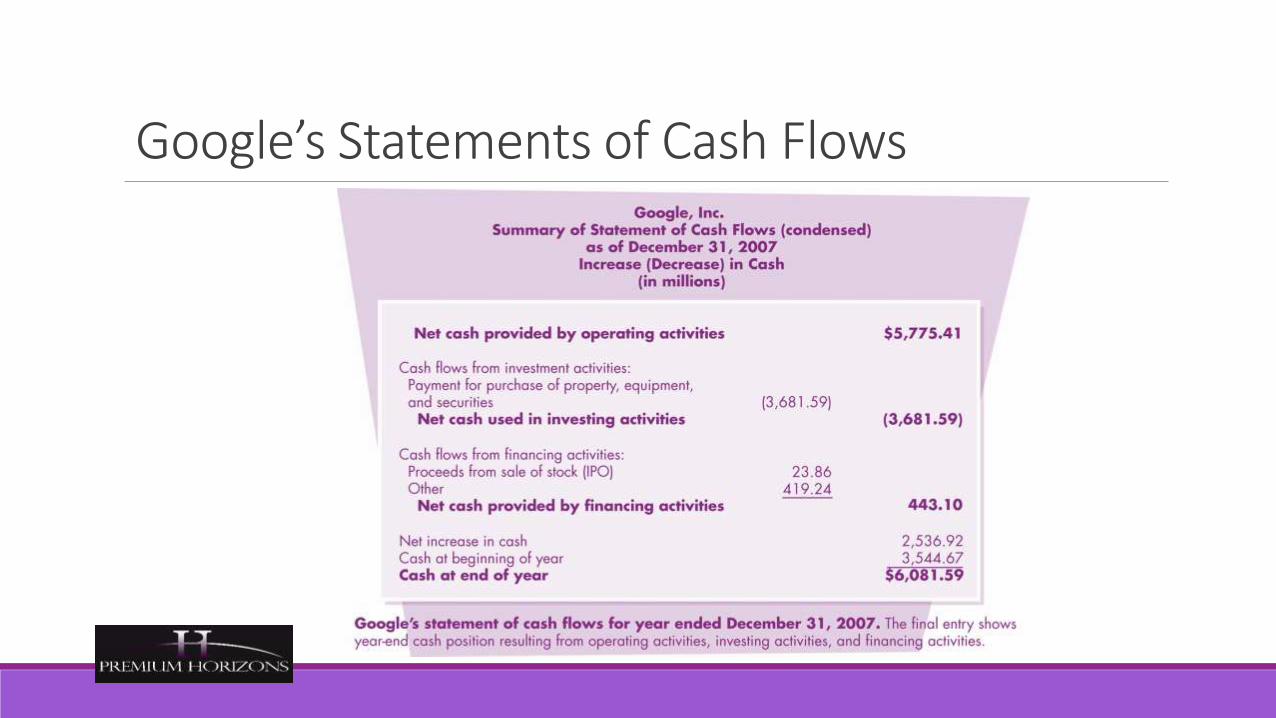
Google’s Statements of Cash Flows

Annual ReportsThe footnotes to financial statements are packed with information.
Significant accounting policies and practices
Income taxes
Pension plans and other retirement programs
Stock options
FINANCIAL DATA ANALYSIS

Management Discussion and Analysis (MD&A)Management’s explanation of the financial information and its significance
Publicly traded corporations are now required to include MD&A in their annual reports
Six General Principles
Allows readers to view company through management eyes
Complement and supplement financial statements
Be reliable, complete, fair, and balanced
Have a forward-looking perspective
Focus on management’s strategy for increasing investor value
Be written in plain language
FINANCIAL DATA ANALYSIS
Management Discussion and Analysis (MD&A)Company’s vision, core businesses, and strategy
Key performance indicators
Resources (capabilities) to reach targets
Results
Outline of risks
FINANCIAL DATA ANALYSIS
Additional Disclosures and Audit Reports
The annual reports of many companies contain this or a similar statement:
“See the Accompanying Notes to the Consolidated Financial Statements.”
or
“The Accompanying Notes are an Integral Part of the Financial Statements.”

Additional Disclosures and Audit Reports, Footnotes
Some examples of appropriate footnote data are:
Disclosure of the company’s policies for:
Depreciation
Amortization
Consolidation
Foreign Currency Translation
Earnings Per Share

Additional Disclosures and Audit Reports, Footnotes
Inventory Valuation Method: LIFO & FIFO
LIFO means that the costs on the income statement reflect the cost of inventories purchased or produced most recently.
FIFO means the income statement reflects the cost of the oldest inventories.

Additional Disclosures and Audit Reports, Footnotes
Inventory Valuation Method:
Indicates whether inventories shown on the balance sheet and used to determine the cost of goods sold on the income statement used a method such as
Last-In, First-Out (LIFO),
First-In, First-Out (FIFO), or
Average Cost.

Additional Disclosures and Audit Reports, Footnotes
Inventory Valuation Method: LIFO & FIFO
This is an extremely important consideration because the LIFO method reflects the most current costs in the income statement and does not overstate profits during inflationary times, whilst the FIFO valuation does
If not shown on the balance sheet, the composition of the inventories by raw materials, work-in-process, finished goods, and supplies should be presented.
Additional Disclosures and Audit Reports, Footnotes
Asset Impairment
Disclosure of details about impaired assets or assets to be disposed of.
Investments
Information about debt and equity securities classified as “trading”, “available-for-sale” or “held-to-maturity.”

Additional Disclosures and Audit Reports, Footnotes
Income Tax Provision
The breakdown by current and deferred taxes and its composition into federal, state, local and foreign tax, accompanied by a reconciliation from the statutory income tax rate to the effective tax rate for the company

Additional Disclosures and Audit Reports, Footnotes
Changes in Accounting Policy
Description of changes in accounting policy due to new accounting rules.
Nonrecurring Items
Details regarding nonrecurring items such as pension plan terminations or acquisitions/dispositions of significant business units.

Additional Disclosures and Audit Reports, Footnotes
Employment and Retirement Programs
Details regarding employment contracts, profit-sharing, pension and retirement plans and post retirement and post employment benefits other than pensions.
Stock Options
Details about stock options granted to officers and employees.
Additional Disclosures and Audit Reports, Footnotes
Employment and Retirement Programs
Disclosure of lease obligations on assets and facilities on a per year basis for the next several years and total lease obligations over the remaining lease period.
Long Term Debt
Details regarding the issuance and maturities of long term debt.

Additional Disclosures and Audit Reports, Footnotes
Contingent Liabilities
Disclosures relating to potential or pending claims or lawsuits that might affect the company.
Future Contractual Commitments
Terms of contracts in force that will affect future periods.
Additional Disclosures and Audit Reports, Footnotes
Off-Balance Sheet Credit and Market Risks
Details of off-balance-sheet credit and market risk associated with certain financial instruments. This includes: Interest rate swaps, forward and futures contracts and options contracts.
Off-balance-sheet risk is defined as potential for loss over and above the amount recorded on the balance sheet.
Additional Disclosures and Audit Reports, Footnotes
Regulations or Restrictions
Description of regulatory requirements and dividend or other restrictions.
Fair Value of Financial Instruments
Carried at Cost
Disclosure of fair market values of instruments carried at cost including long term debt and off-balance-sheet instruments, such as swaps and options.
Additional Disclosures and Audit Reports, Footnotes
Segment Sales, Operating Profits and Identifiable Assets
Information on each industry segment that account for more than 10% of a company’s sales, operating profits and/or assets.
Multinational corporations must also show sales and identifiable assets for each significant geographic area where sales or assets exceed 10% of the related consolidated amounts.

Additional Disclosures and Audit Reports, FootnotesMost people do not like to read footnotes because they are complicated and are rarely written in “plain English.”
This is unfortunate because the notes are very informative.
Moreover, they can reveal many critical and fascinating sidelights to the financial story.
Additional Disclosures and Audit Reports, Footnotes
Independent Audits
The report from the independent auditors is often referred to as the auditor’s opinion, and is printed in the annual report.
It should say these two things:
The audit steps taken to verify the financial statements meet the auditing profession’s approved standard of practice.

Additional Disclosures and Audit Reports, FootnotesThe financial statements prepared by management are management’s responsibility and follow generally accepted accounting principles.
As a result, when the annual report contains financial statements accompanied by an unqualified (often referred to as “clean”) option from independent auditors, there is added assurance that the figures can be relied upon as being fairly presented.
However, if the independent auditor’s report contains the qualifying words “except for”, the reader should be on the alert, cautions and questioning.
Additional Disclosures and Audit Reports, FootnotesThe reader should investigate the reason(s) behind such qualification(s), which should be summarily explained in that report and referenced to the footnotes.
In addition, while the auditor(s) may not qualify the opinion, a separate paragraph may be inserted to emphasize an important item.
Investors should carefully consider any matter so emphasized.

Tools of Financial Statement Analysis:The commonly used tools for financial statement analysis are:
• Financial Ratio Analysis
• Comparative financial statements analysis:
• Horizontal analysis/Trend analysis
• Vertical analysis/Common size analysis/Component Percentages

Financial Ratio AnalysisFinancial ratio analysis involves calculating and analysing ratios that use data fromone, two or more financial statements.
Ratio analysis also expresses relationships between different financial statements.
Financial Ratios can be classified into 5 main categories:
• Profitability Ratios
• Liquidity or Short-Term Solvency ratios
• Asset Management or Activity Ratios
• Financial Structure or Capitalisation Ratios
• Market Test Ratios

Financial Ratio AnalysisTo be useful, both the meaning and the limitations of the ratio chosen have to be understood
The viewpoint taken.
The objectives of the analysis.
The potential standards of comparison
Financial Ratio Analysis
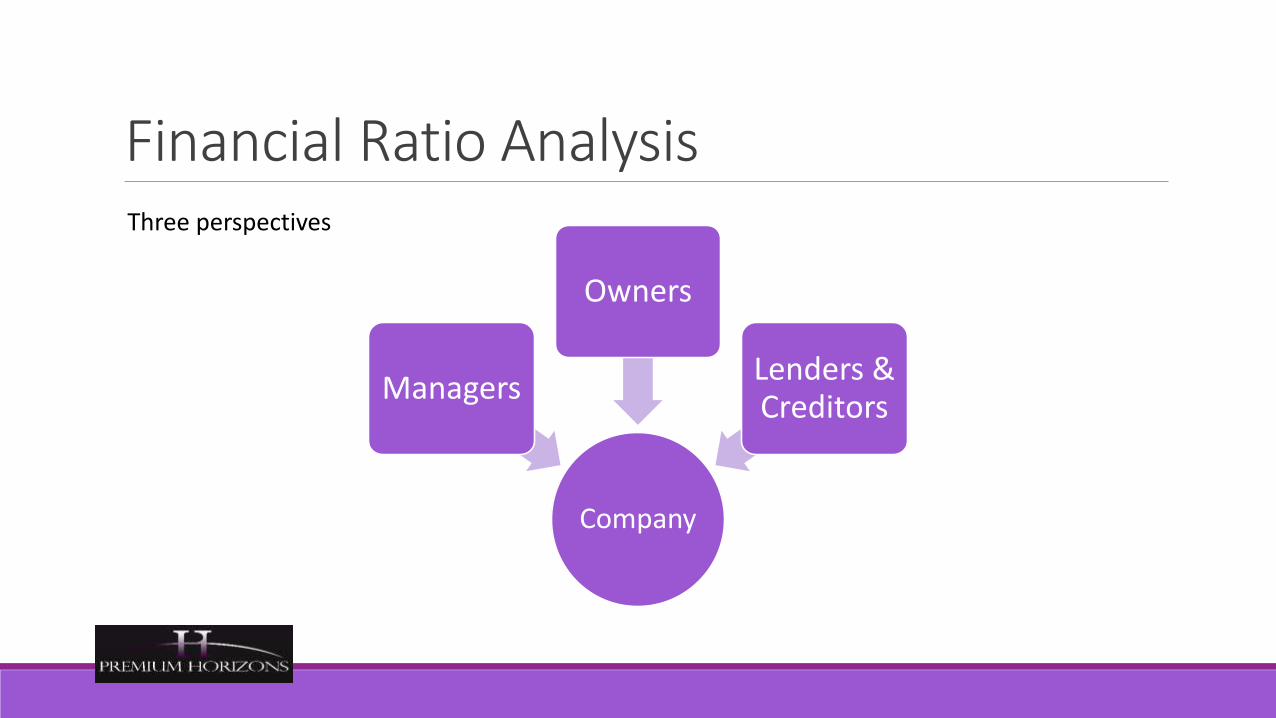
Company
Managers
Owners
Lenders & Creditors
Three perspectives

Managers Owners Lenders
Operational Analysis Investment Return Liquidity
Gross margin Profit margin EBIT; EBITDA NOPATOperating expense analysis Contribution analysis Operating leverageComparative analysis
Return on total net worth Return on common equity Earnings per share Cash flow per shareShare price appreciationTotal shareholder return
Current ratioAcid testQuick sale value
Resource Management Disposition of Earnings Financial Leverage
Asset turnover Working capital management• Inventory turnover • Accounts receivable patterns • Accounts payable patterns Human resource effectiveness
Dividends per share Dividend yield Payout/retention of earnings Dividend coverageDividends to assets
Debt to assetsDebt to capitalizationDebt to equity
Profitability Market Performance Debt Service
Return on assets (after taxes) Return before interest and taxes Return on current value basis EVA and economic profit Cash flow return on investment
Free cash flow
Price/earnings ratio Cash flow multiples Market to book value Relative price movements Value drivers
Value of the firm
Interest coverageBurden coverageFixed changes coverageCash flow analysis

Management Point of ViewManagement has a dual interest in the analysis of financial performance:
◦ To assess the efficiency and profitability of operations.
◦ To judge how effectively the resources of the business are being used.
Management Point of ViewJudging a company’s operations is largely done with an analysis of the income statement, while resource effectiveness is usually measured by reviewing both the balance sheet and the income statement.
In order to make economic judgments, however, it’s often necessary to modify the available financial data to reflect current economic values and conditions.
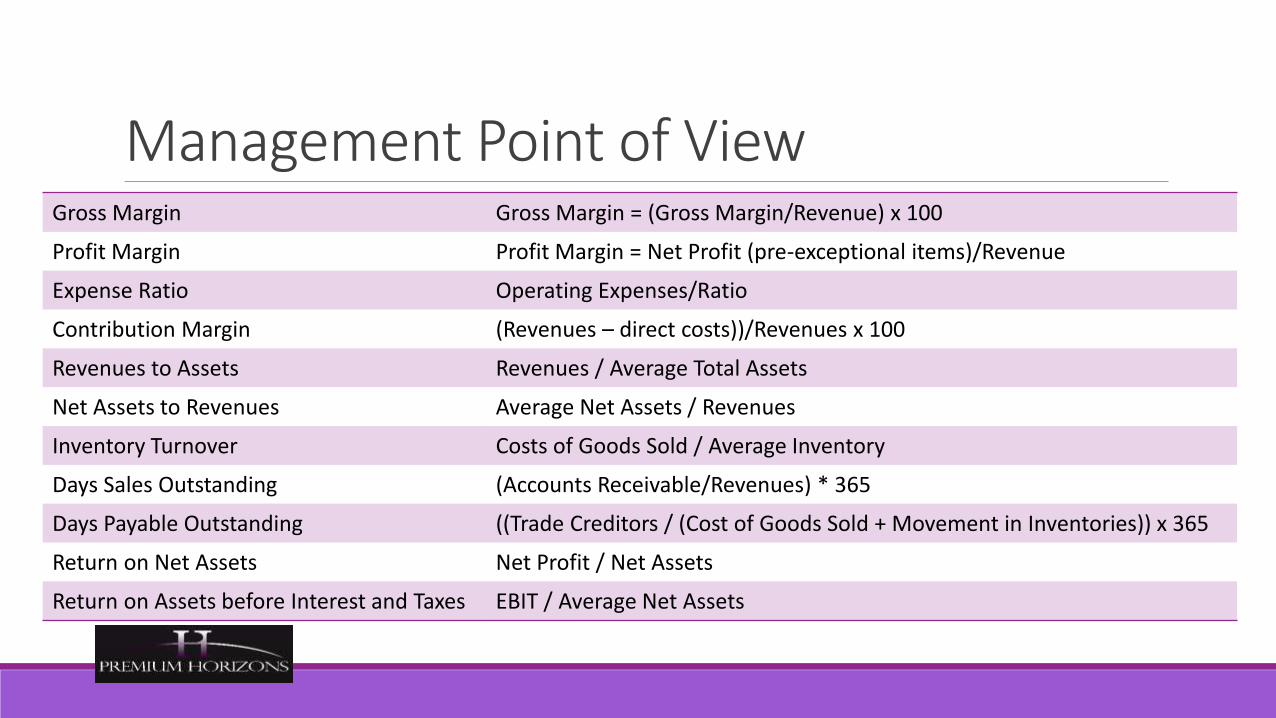
Management Point of ViewGross Margin Gross Margin = (Gross Margin/Revenue) x 100
Profit Margin Profit Margin = Net Profit (pre-exceptional items)/Revenue
Expense Ratio Operating Expenses/Ratio
Contribution Margin (Revenues – direct costs))/Revenues x 100
Revenues to Assets Revenues / Average Total Assets
Net Assets to Revenues Average Net Assets / Revenues
Inventory Turnover Costs of Goods Sold / Average Inventory
Days Sales Outstanding (Accounts Receivable/Revenues) * 365
Days Payable Outstanding ((Trade Creditors / (Cost of Goods Sold + Movement in Inventories)) x 365
Return on Net Assets Net Profit / Net Assets
Return on Assets before Interest and Taxes EBIT / Average Net Assets

Owners’ Point of ViewThe key interest of the owners of a business, or the shareholders in the case of a corporation, is investment return.
In this context, we are talking about the returns achieved, through the efforts of management, on the funds invested by the owners.

Owners’ Point of ViewReturn on Equity Net Profit / Shareholders Investment
Return on Common Equity (Net Profit – Preference Dividends) / Average Common Equity
Earnings per Share (Net Profit – Preference Dividends) / Average number of ordinary shares
Cash Flow per Share (Net Profit – Preference Dividends + Write Offs) / Average number of ordinary shares = Dollars per Share
Dividend Yield Annual dividend per share /Average market price per share
Payout Ratio Cash dividend per share / Earnings per share
Earnings multiple (Price/earnings ratio): Market price per share / Earnings per share) x Factor

Lenders’ Point of ViewLenders are interested in funding the needs of a successful business that will perform as expected.
At the same time, they must consider the possible negative consequences of default and liquidation.
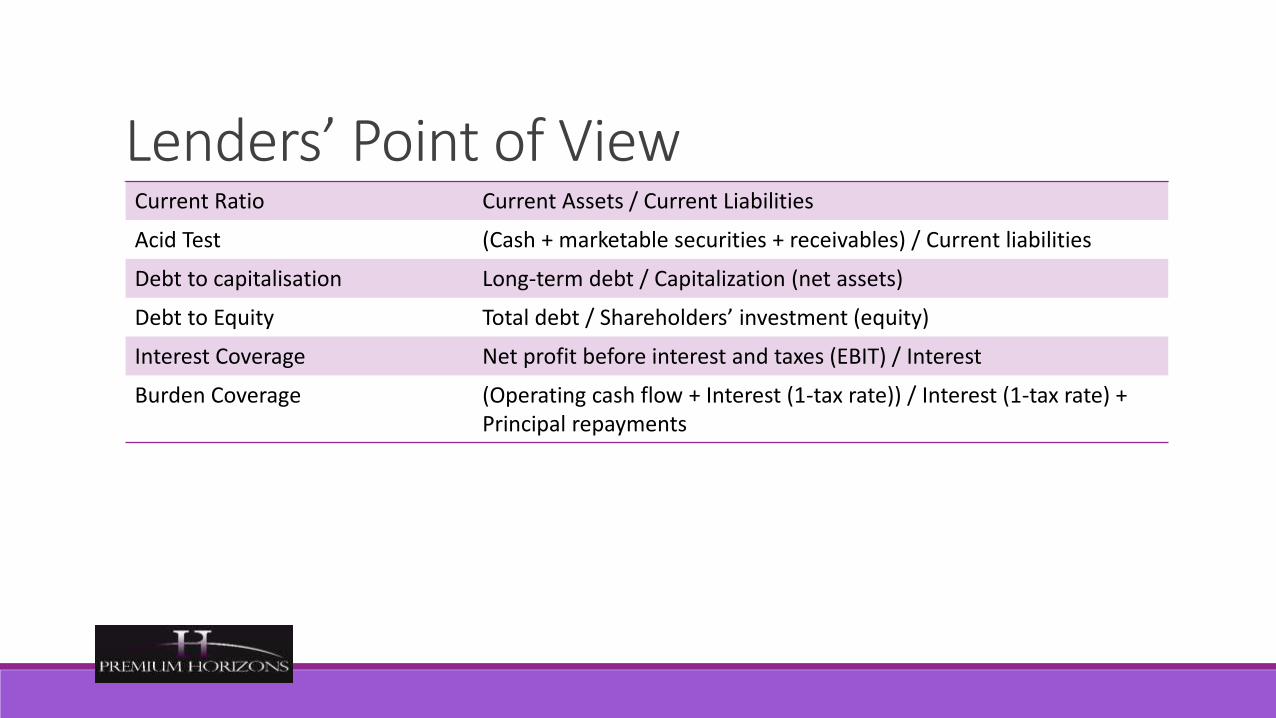
Lenders’ Point of ViewCurrent Ratio Current Assets / Current Liabilities
Acid Test (Cash + marketable securities + receivables) / Current liabilities
Debt to capitalisation Long-term debt / Capitalization (net assets)
Debt to Equity Total debt / Shareholders’ investment (equity)
Interest Coverage Net profit before interest and taxes (EBIT) / Interest
Burden Coverage (Operating cash flow + Interest (1-tax rate)) / Interest (1-tax rate) + Principal repayments

Financial Analysis
Why use ratio’s?
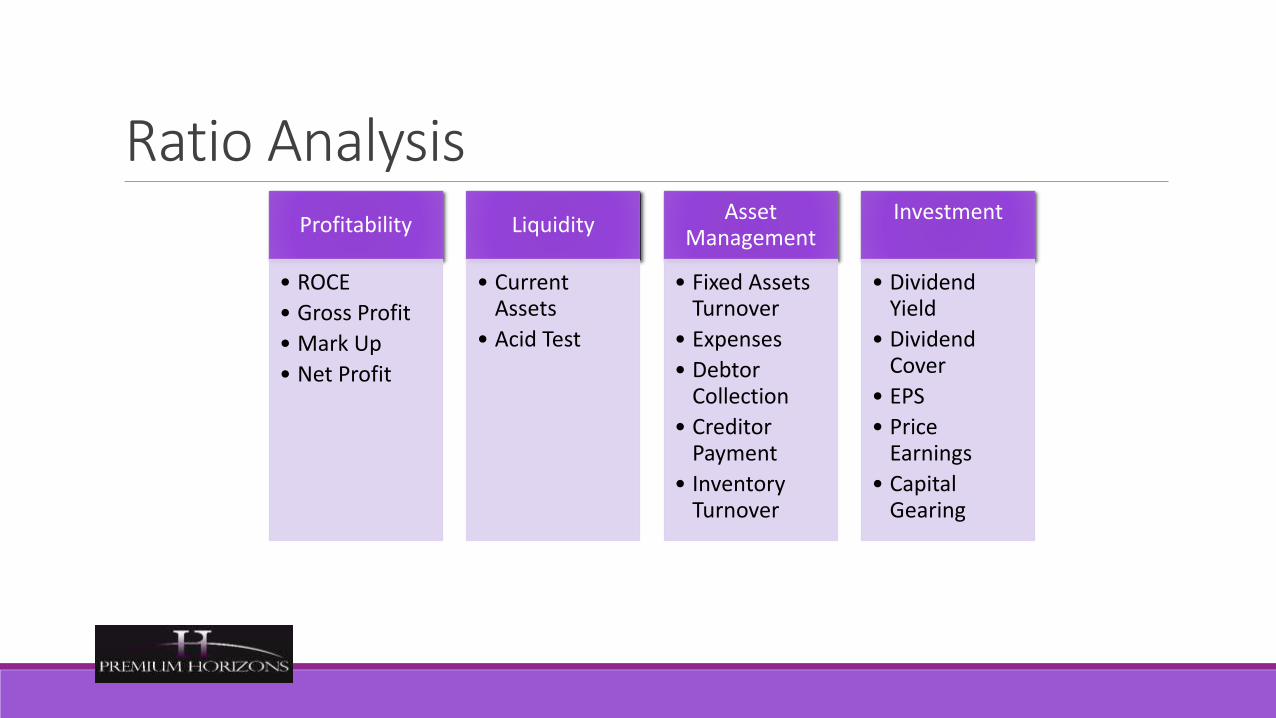
Ratio AnalysisProfitability
• ROCE
• Gross Profit
• Mark Up
• Net Profit
Liquidity
• Current Assets
• Acid Test
Asset Management
• Fixed Assets Turnover
• Expenses
• Debtor Collection
• Creditor Payment
• Inventory Turnover
Investment
• Dividend Yield
• Dividend Cover
• EPS
• Price Earnings
• Capital Gearing

Profitability RatiosReturn on Capital Employed (ROCE)
• Identifies profit earned by the investment
• Profit = net profit after-tax
• Capital = average shareholders funds
Gross Profit Ratio
• Measures profit in relation to sales
• If using “published accounts, sales may be described as “turnover”
Mark up Ratio
• Measures profit added to cost of goods sold
Net Profit Ratio
• Compare the net profit with the sales revenue
𝑁𝑒𝑡 𝑃𝑟𝑜𝑓𝑖𝑡
𝐶𝑎𝑝𝑖𝑡𝑎𝑙𝑥 100 = 𝑅𝑂𝐶𝐸 (%)
𝐺𝑟𝑜𝑠𝑠 𝑃𝑟𝑜𝑓𝑖𝑡
𝑆𝑎𝑙𝑒𝑠 𝑅𝑒𝑣𝑒𝑛𝑢𝑒𝑥 100 = 𝐺𝑃 (%)
𝐺𝑟𝑜𝑠𝑠 𝑃𝑟𝑜𝑓𝑖𝑡
𝐶𝑜𝑠𝑡 𝑜𝑓 𝐺𝑜𝑜𝑑𝑠 𝑆𝑜𝑙𝑑𝑥 100 = 𝑀𝑎𝑟𝑘 𝑈𝑝 (%)
𝑁𝑒𝑡 𝑃𝑟𝑜𝑓𝑖𝑡
𝑆𝑎𝑙𝑒𝑠 𝑅𝑒𝑣𝑒𝑛𝑢𝑒𝑥 100 = 𝑁𝑒𝑡 𝑃𝑟𝑜𝑓𝑖𝑡 (%)
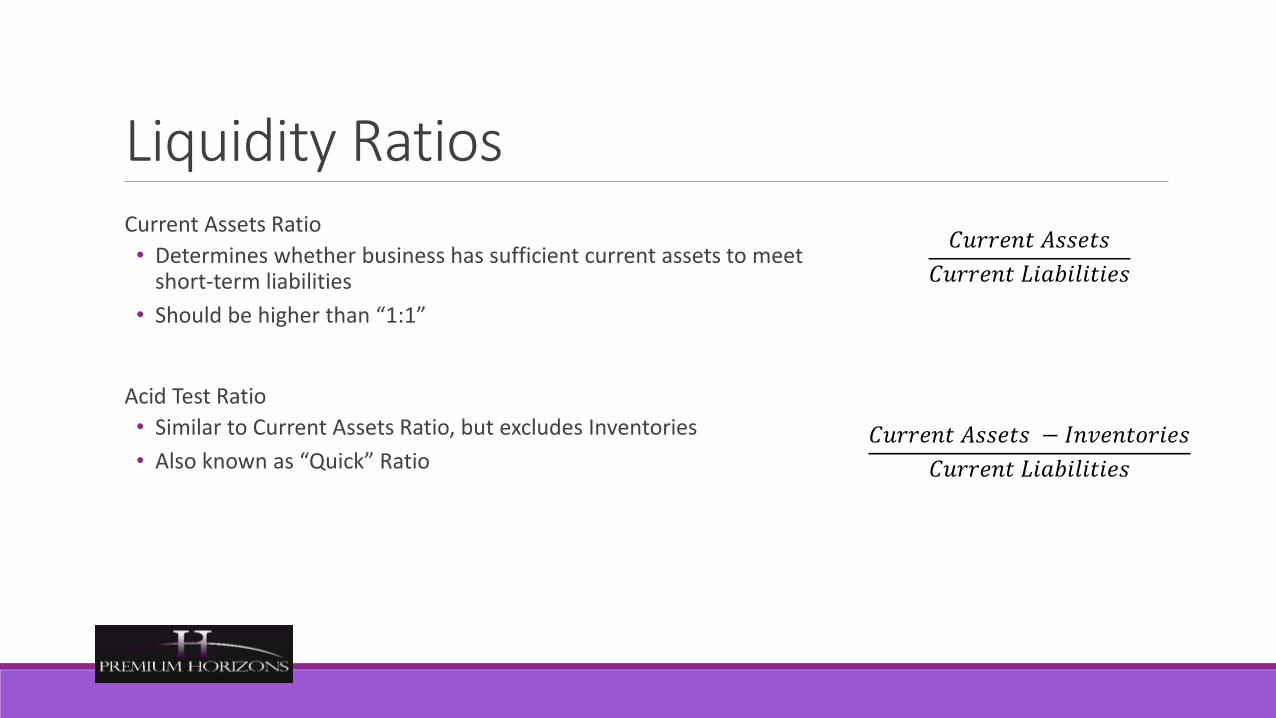
Liquidity RatiosCurrent Assets Ratio
• Determines whether business has sufficient current assets to meet short-term liabilities
• Should be higher than “1:1”
Acid Test Ratio
• Similar to Current Assets Ratio, but excludes Inventories
• Also known as “Quick” Ratio
𝐶𝑢𝑟𝑟𝑒𝑛𝑡 𝐴𝑠𝑠𝑒𝑡𝑠
𝐶𝑢𝑟𝑟𝑒𝑛𝑡 𝐿𝑖𝑎𝑏𝑖𝑙𝑖𝑡𝑖𝑒𝑠
𝐶𝑢𝑟𝑟𝑒𝑛𝑡 𝐴𝑠𝑠𝑒𝑡𝑠 − 𝐼𝑛𝑣𝑒𝑛𝑡𝑜𝑟𝑖𝑒𝑠
𝐶𝑢𝑟𝑟𝑒𝑛𝑡 𝐿𝑖𝑎𝑏𝑖𝑙𝑖𝑡𝑖𝑒𝑠
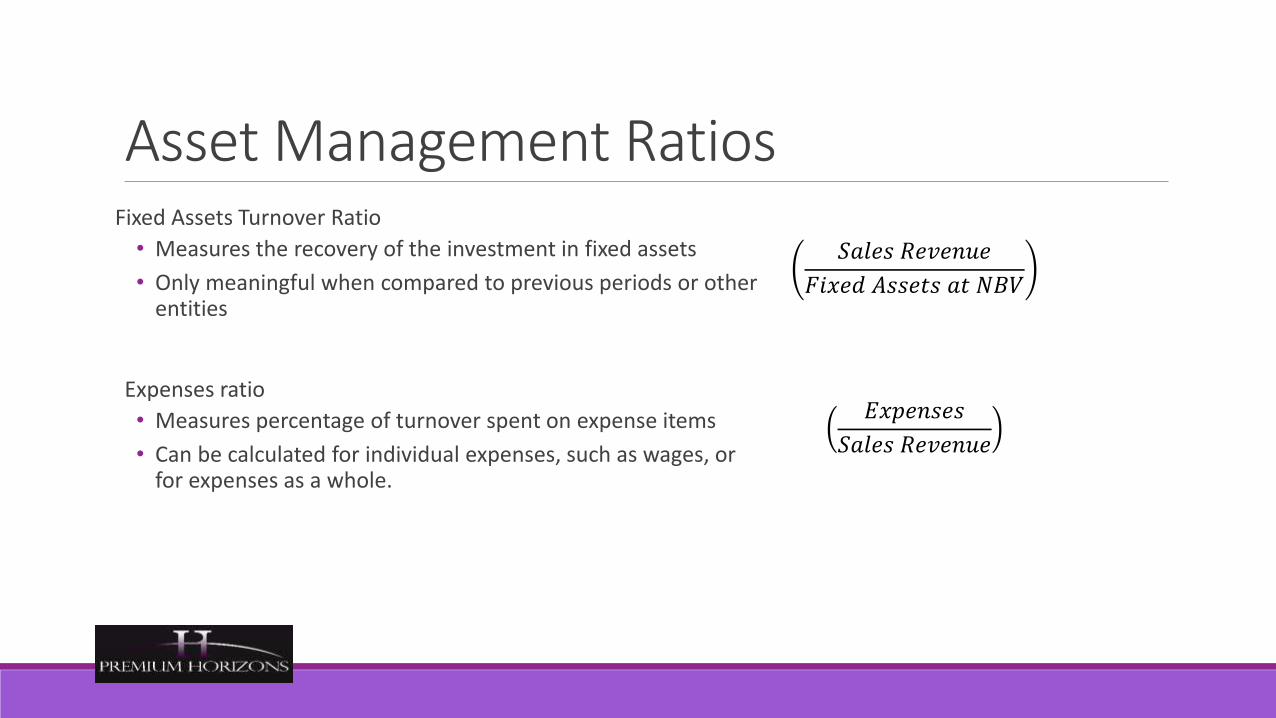
Asset Management RatiosFixed Assets Turnover Ratio
• Measures the recovery of the investment in fixed assets
• Only meaningful when compared to previous periods or other entities
Expenses ratio
• Measures percentage of turnover spent on expense items
• Can be calculated for individual expenses, such as wages, or for expenses as a whole.
𝑆𝑎𝑙𝑒𝑠 𝑅𝑒𝑣𝑒𝑛𝑢𝑒
𝐹𝑖𝑥𝑒𝑑 𝐴𝑠𝑠𝑒𝑡𝑠 𝑎𝑡 𝑁𝐵𝑉
𝐸𝑥𝑝𝑒𝑛𝑠𝑒𝑠
𝑆𝑎𝑙𝑒𝑠 𝑅𝑒𝑣𝑒𝑛𝑢𝑒

Asset Management RatiosStock Turnover Ratio
• (Opening Inventory less Closing Inventory) / 2
• Can also be calculated based on Closing Inventory
• Measures inventory efficiency
Trade Debtor Collection Period Ratio
• Measures the efficiency of debt collection
Trade Creditor Payment Period Ratio
• Measures how long the business takes to settle creditors accounts
𝐶𝑜𝑠𝑡 𝑜𝑓 𝐺𝑜𝑜𝑑𝑠 𝑆𝑜𝑙𝑑
𝐴𝑣𝑒𝑟𝑎𝑔𝑒 𝐼𝑛𝑣𝑒𝑛𝑡𝑜𝑟𝑦
𝑇𝑟𝑎𝑑𝑒 𝐷𝑒𝑏𝑡𝑜𝑟𝑠
𝑇𝑜𝑡𝑎𝑙 𝐶𝑟𝑒𝑑𝑖𝑡 𝑆𝑎𝑙𝑒𝑠x 365 = DSO
𝑇𝑟𝑎𝑑𝑒 𝐶𝑟𝑒𝑑𝑖𝑡𝑜𝑟𝑠
𝑇𝑜𝑡𝑎𝑙 𝐶𝑟𝑒𝑑𝑖𝑡 𝑃𝑢𝑟𝑐ℎ𝑎𝑠𝑒𝑠x 365 = DPO

Investment RatiosDividend Yield• Measures the rate of return that an investor gets by comparing the
cost of his shares with the dividend receivable (or paid)
Dividend Cover• Shows how many times that ordinary dividend could be paid out of
current earnings
Earnings Per Share• Examines profit from shareholders perspective
Price / Earnings Ratio• Compares earnings per share and market price
• Indicates the period before we recover the market price paid for the shares from the earnings.
• A high P/E Ratio means that the market thinks that the company’s future is good
𝐷𝑖𝑣𝑖𝑑𝑒𝑛𝑑 𝑝𝑒𝑟 𝑠ℎ𝑎𝑟𝑒
𝑀𝑎𝑟𝑘𝑒𝑡 𝑃𝑟𝑖𝑐𝑒 𝑝𝑒𝑟 𝑠ℎ𝑎𝑟𝑒x 100 = %
𝑁𝑒𝑡 𝑃𝑟𝑜𝑓𝑖𝑡 𝑙𝑒𝑠𝑠 𝑃𝑟𝑒𝑓𝑒𝑟𝑒𝑛𝑐𝑒 𝐷𝑖𝑣𝑖𝑑𝑒𝑛𝑑
𝐷𝑖𝑣𝑖𝑑𝑒𝑛𝑑𝑠 𝑝𝑎𝑖𝑑 𝑎𝑛𝑑 𝑝𝑟𝑜𝑝𝑜𝑠𝑒𝑑
𝑁𝑒𝑡 𝑃𝑟𝑜𝑓𝑖𝑡 𝑙𝑒𝑠𝑠 𝑃𝑟𝑒𝑓𝑒𝑟𝑒𝑛𝑐𝑒 𝐷𝑖𝑣𝑖𝑑𝑒𝑛𝑑
𝑊𝑒𝑖𝑔ℎ𝑡𝑒𝑑 𝑎𝑣𝑒𝑟𝑎𝑔𝑒 𝑛𝑢𝑚𝑏𝑒𝑟 𝑜𝑓 𝑜𝑟𝑑𝑖𝑛𝑎𝑟𝑦 𝑠ℎ𝑎𝑟𝑒𝑠
𝑀𝑎𝑟𝑘𝑒𝑡 𝑝𝑟𝑖𝑐𝑒 𝑝𝑒𝑟 𝑠ℎ𝑎𝑟𝑒
𝐸𝑎𝑟𝑛𝑖𝑛𝑔𝑠 𝑃𝑒𝑟 𝑆ℎ𝑎𝑟𝑒

Investment RatiosCapital Gearing Ratio
◦ The higher the loans, the more interest the company will have to pay, and that will affect the company’s ability to pay an ordinary dividend
◦ If the company cannot find the cash to repay its loans, the ordinary shareholders may not get any money back if the business goes into liquidation.
𝑃𝑟𝑒𝑓𝑒𝑟𝑒𝑛𝑐𝑒 𝑆ℎ𝑎𝑟𝑒𝑠 + 𝐿𝑜𝑛𝑔 𝑇𝑒𝑟𝑚 𝐿𝑜𝑎𝑛𝑠
𝑆ℎ𝑎𝑟𝑒ℎ𝑜𝑙𝑑𝑒𝑟𝑠 𝐹𝑢𝑛𝑑𝑠

Advantages & Limitations of ratios?“Accounting ratios are only as good as the data on which they are based”
Does Return on Capital Employed give a misleading impression of profitability?
Is ratio analysis useful in understanding how a business has performed?
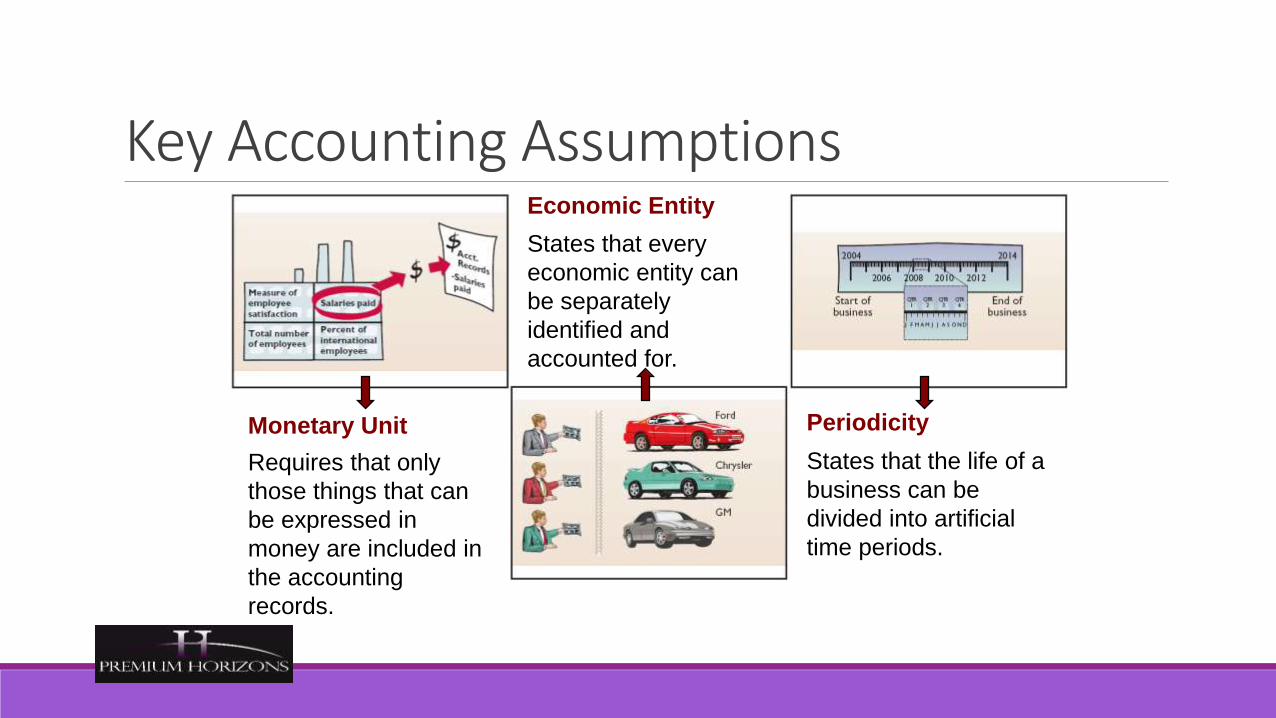
Monetary Unit Periodicity
Economic Entity
Requires that only
those things that can
be expressed in
money are included in
the accounting
records.
States that every
economic entity can
be separately
identified and
accounted for.
States that the life of a
business can be
divided into artificial
time periods.
Key Accounting Assumptions

Going Concern Accrual-Basis
Transactions are
recorded in the
periods in which the
events occur.
The business will
remain in operation
for the foreseeable
future.
Key Accounting Assumptions

Can a company be “too liquid”?

When debt is good

Financial distress and Altman's Z-ScoreDevised by Edward I. Altman, a professor at the Stern School of Business at New York University.
• used empirical data and regression
• scores above or below certain measures indicated the likelihood one would fall into bankruptcy.
Accuracy
95% - 12 months prior to such actual filing
72% - 24 months
48% - 36 months
Highly accurate by most measures.
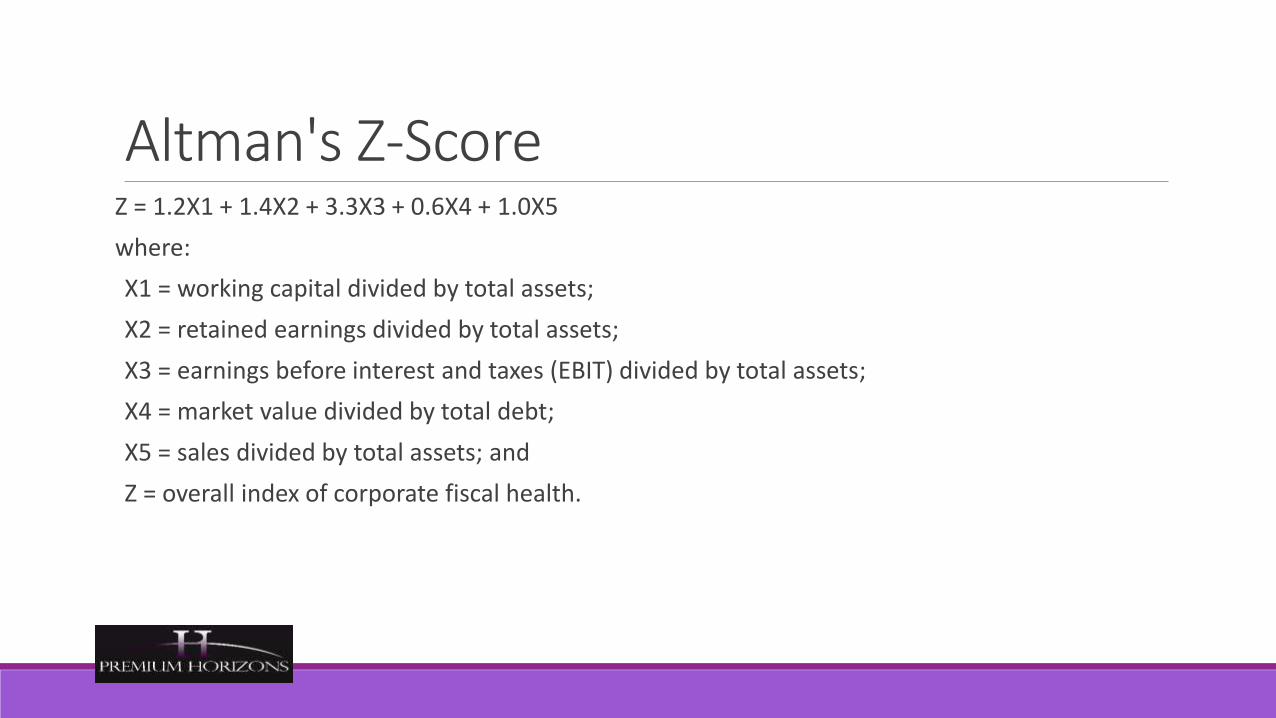
Altman's Z-ScoreZ = 1.2X1 + 1.4X2 + 3.3X3 + 0.6X4 + 1.0X5
where:
X1 = working capital divided by total assets;
X2 = retained earnings divided by total assets;
X3 = earnings before interest and taxes (EBIT) divided by total assets;
X4 = market value divided by total debt;
X5 = sales divided by total assets; and
Z = overall index of corporate fiscal health.
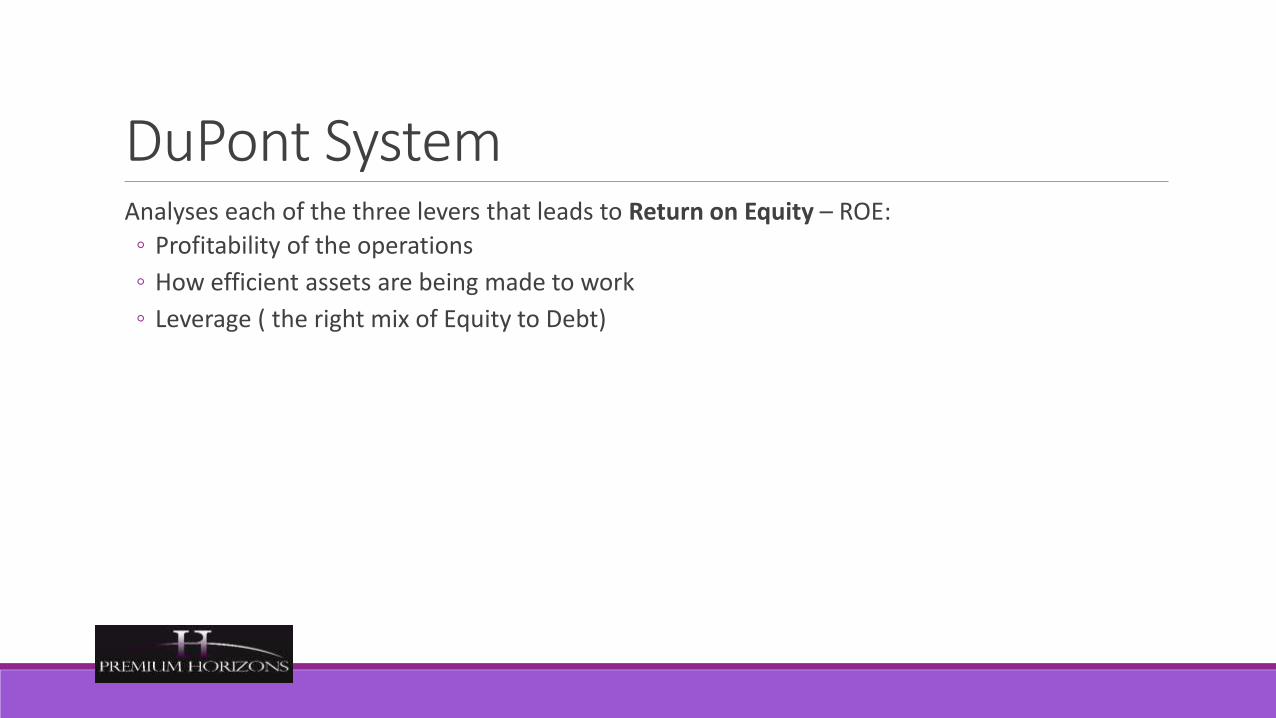
DuPont SystemAnalyses each of the three levers that leads to Return on Equity – ROE:
◦ Profitability of the operations
◦ How efficient assets are being made to work
◦ Leverage ( the right mix of Equity to Debt)

DuPont SystemDeveloped in 1919 by a finance executive at E.I. du Pont de Nemours and Co
A way of visualizing the information so that everyone can see it
Is a good tool for getting people started in understanding how they can have an impact on results
It is simple and straightforward
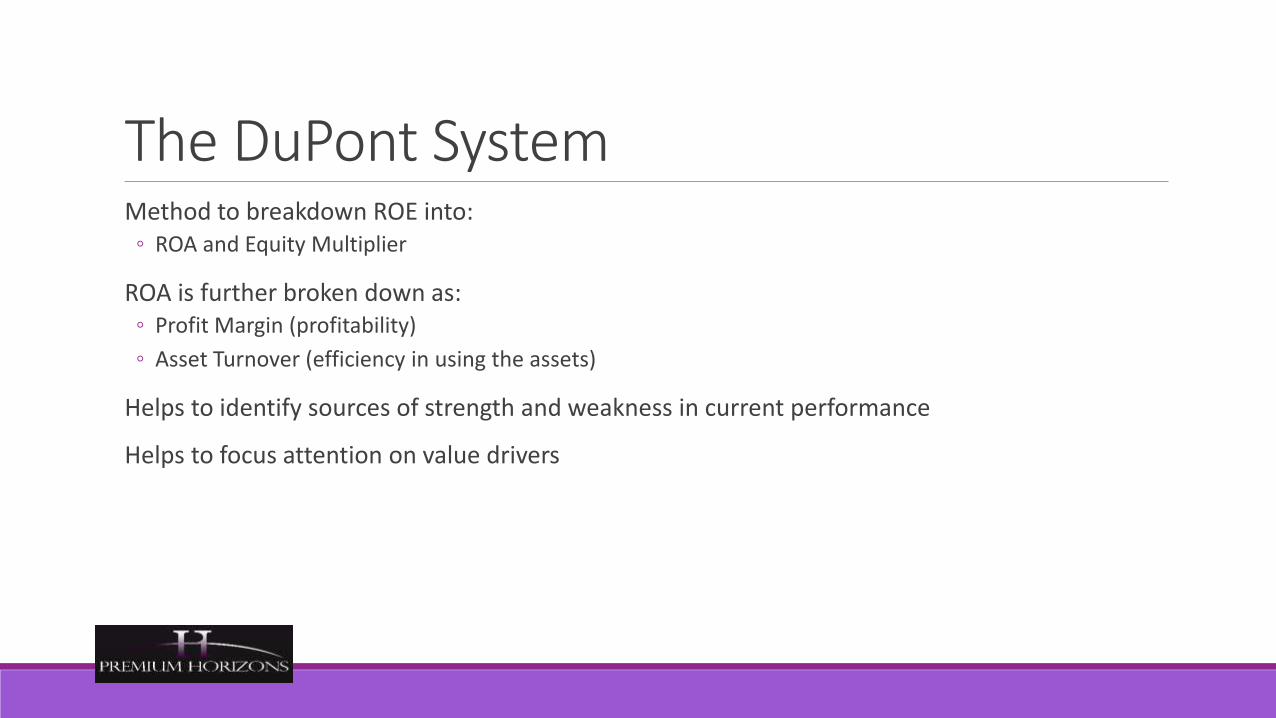
The DuPont SystemMethod to breakdown ROE into:
◦ ROA and Equity Multiplier
ROA is further broken down as:◦ Profit Margin (profitability)
◦ Asset Turnover (efficiency in using the assets)
Helps to identify sources of strength and weakness in current performance
Helps to focus attention on value drivers

DuPont SystemThe system identifies profitability as being impacted by three different levers:
Earnings & efficiency in earnings
Ability of your assets to be turned into profits
Financial leverageEarnings
Turnings
Leverage

Return on Equity - ROEThis represents the Net income generated by the Equity invested in the business
The Formula is:
◦ Net Income
Equity
◦ This represents $’s of profit per $ invested by the shareholders.

Net Income
Total Equity
=Net Income
Sales
X
Sales
Total Assets
Profitability Asset Usage Efficiency
Net Profit
MarginROE
Total Asset Turnover
X
Debt Ratio
Leverage
Total Assets
Total Equity
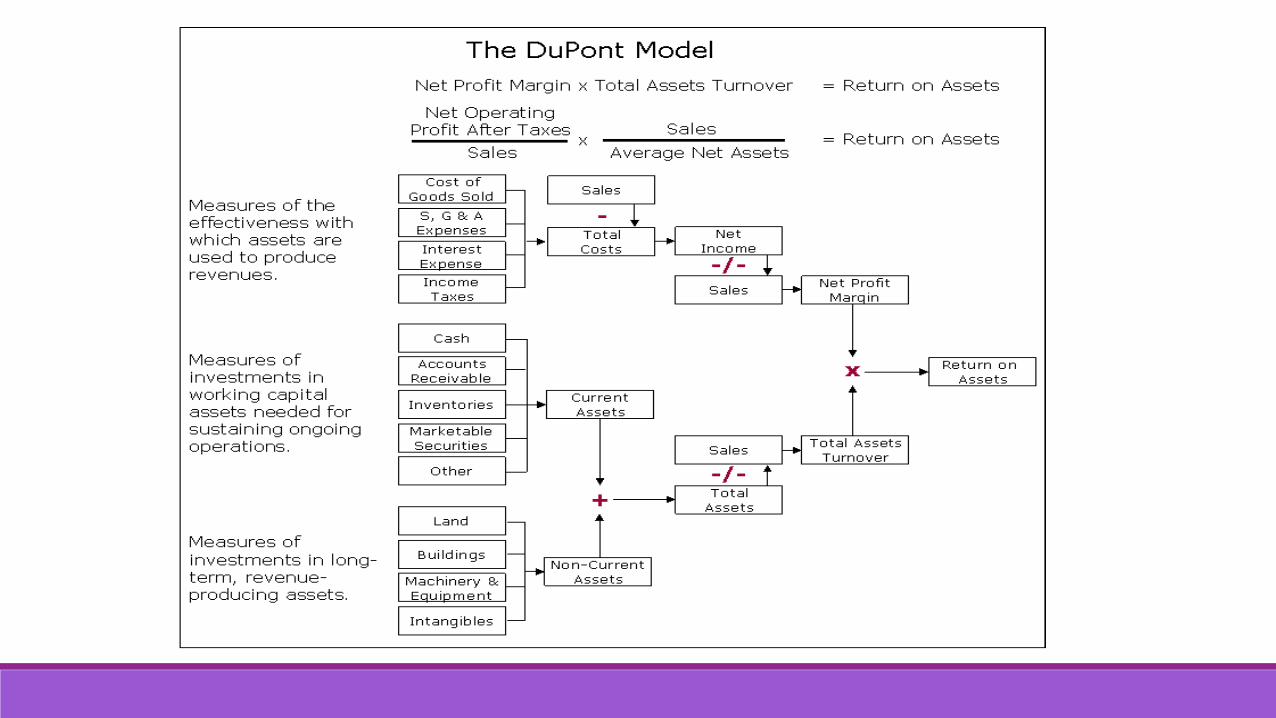
DuPont Analysis

DuPont AnalysisDuPont analysis tells us that ROE is affected by three things:
• Operating efficiency, which is measured by profit margin.
• Asset use efficiency, which is measured by total asset turnover.
• Financial leverage is measured by the equity multiplier

Financing the Business & Valuing the Business
Day Two
Sources of FundsNo business can live without funds. Throughout the life of a business, money is needed continuously.
Firms raise money mainly to meet the following three types of need:
1. To start a business as initial expenditure;
2. To fund continuous business activities and money flowing;
3. To expand the business

Sources of FundsWhere does a business get funds from?

Sources of Funds
Internal Sources
Profit Depreciation Sales of assets
External Sources
Long-term:Share CapitalLoan Capital
Short term:OverdraftLeasing
Credit card

The after-tax profit earned and retained by a business which is an important and inexpensive source of finance, for example, the retained earnings of the business. A large part of finance is funded from profit.
Profit
© PhotoDisc
Internal Sources of Funds

The financial provision for the replacement of worn-out machinery and equipment. Nearly all businesses use depreciation as a source of funds.
Depreciation
© PhotoDisc
Internal Sources of Funds

Definition: The activity that a business sells off assets to raise funds for the business.
Reasons: When a business can not raise finance from banks or other sources, it may be forced to sell some assets, such as company cars, land property; or even subsidiary or associated company to solve its urgent financial problems (this activity is called divestment).
© PhotoDisc
Internal Sources of Funds
Sales of Assets
External Long-term Sources of FundsShare capital:
The most important source of funds for a limited company. It is often considered as permanent capital as it is not repaid by the business, but the shareholder can have a share in the profit, called dividend.
What are the types of share capital and what are the differences?

External Long-term Sources of FundsThree types of shares are:
1. Ordinary shares: The most common types of shares, and the most riskiest shares since no guaranteed dividend. Dividend depends on how much profit is made by the firm. But all ordinary shareholders have voting rights.
2. Preference shares: The share owners receive a fixed rate of return. They carry less risk because shareholders are entitled to the dividend before the ordinary shares. But they are not strictly owners of the company.
3. Deferred shares: These shares are often held by the founders of the company. Deferred shareholders only receive the dividend after the ordinary shareholders have been paid.

External Long-term Sources of FundsSources will frequently include but not be limited to:
Initial principals of the company
Outside “angel” investors
Institutional investors
Strategic investors
What are the issues associated with each?

External Long-term Sources of FundsLoan capital
Definition:Any money which is borrowed for a long period of time by a business is called loan capital.

External Long-term Sources of FundsTypes: There are four major types of loan capital:
Loan Capital
Debentures
Mortgage
Loan specialists’
funds
Government assistance

External Long-term Sources of FundsDebentures:
The holder of a debenture is a creditor of the company, not an owner. Holders are paid with an agreed fixed rate of return, but having no voting rights. The amount of money borrowed must be repaid by the expiry date.

External Long-term Sources of FundsMortgage:
These are long-term bank loans (usually over one year period) from banks or other financial institutions. The borrower’s land or property must be used as a security on such as a loan.

External Long-term Sources of FundsLoan specialists’ funds:
These are venture capitalists or specialists who provide funds for small businesses, especially for high tech investment projects in their start-up stage. There are also individuals who invest in such businesses, which are often called ‘business angels’.

External Long-term Sources of FundsGovernment assistance:
To encourage small businesses and high employment, governments may be involved in providing finance for businesses.
In the USA, the Small Business Administration (SBA). SBA provides guarantees for small businesses’ loans and they even offer some loans themselves.

External Short-term Sources of FundsDefinition:
Short term sources of funds are usually the funds which are less than one year for maturity.
How “stable” are short-term sources compared with long-term sources?

External Short-term Sources of FundsTypes:
The main types of external short term sources of funds include:
Short Term
Overdraft
Loan
LeasingCredit Card
Trade Credit

External short-term sources of loansMajor types Main characteristics
Bank overdraft This is a short term financing from banks.The amount to be overdrawn depends on the needs of the business at the time and its credit standing.Interest is calculated from the time the account is overdrawn..
Bank loan This is a loan which requires a rigid agreement between the borrower and the bank. The amount borrowed must be repaid over a certain period or in regular installments.Sometimes, banks change persistent overdrafts into loans, so borrowers must repay at regular intervals.
Leasing Leasing allows businesses to buy plant, machinery or equipment without paying large sums of money immediately. The leasing company or bank hires or buys the equipment and for the use of the hire company for a certain period of time. If the user can never owns the equipment, it is an operating lease, while if it is given the choice to own the equipment at the expiry time, it is a finance lease. Lease payments are made by the hire company yearly or monthly, etc.

Major types Main characteristics
Credit card Credit cards can be used to pay for hotel bills, meals, shopping and materials, etc. They are convenient, and secure because it can avoid the use of cash and the payment of interests within credit periods.
Cards may not be suitable for certain purchases, especially a large sum of order because they have a credit limit.
Trade credit It is a common method for businesses to buy materials and to pay for them at a later date, usually between 30 and 90 days. Such trade credit given by the seller is usually an interest free way of short term financing.
External Short-term Sources of Funds

Factors affecting the choice of fundsWhat are the main factors affecting the choice of funds?
Factors affecting the choice of fundsCosts of the fund
Costs in terms of interest payments and other expenses: Long term and short term.
Use or purpose of funds
For example, the building of a new plant is usually financed by mortgage or share capital, while the purchase of raw materials by trade credit or bank overdraft.
Status and size of the business
For a large firm, there are more sources of finance and often with lower interest rates.
Financial situations of a firm
For example, a business in poor financial situation is forced to pay high interest rate for loans. And the bank often requires security or collaterals for their financing.
Factors affecting the choice of fundsGearing condition ratio of the firm
Gearing is the relationship between the loan capital and share capital of a business. High geared companies have a larger share of loan capital to share capital. Low geared ones have a small amount of loan capital.
What is the impact of “high” or “low” gearing on a business?

Factors affecting the choice of fundsHigh gearing may mean ‘no loss of ownership’ but high risk of liquidity since interest rates may change and loans must be repaid in time.
Low gearing may mean some loss of ownership but no burden of loans and interest payments.

Sources of FundsDebt capital—funds obtained through borrowing.
Equity capital—funds provided by the firm’s owners when they reinvest earnings, make additional contributions, or issue stock to investors.

Comparison of Debt and Equity Capital
Sources of FundsLong term Sources of Funds
◦ Leverage—technique of increasing the rate of return on an investment by financing it with borrowed funds
◦ The key to managing leverage is ensuring that the company’s earnings remain larger than its interest payments, which increases the leverage on the rate of return on shareholders’ investment

How Leverage Works

What is Leverage?Use of special forces and effects to magnify or produce more than the normal results from a given course of action
Leverage involves using fixed costs to magnify the potential return to a firm
◦ Can produce beneficial results in favourable conditions
◦ Can produce highly negative results in unfavourable conditions

Leverage in a BusinessDetermining type of fixed operational costs◦ Plant and equipment
◦ Can reduce expensive labour in production of inventory
◦ Expensive labour
◦ Lessens opportunity for profit but reduces risk exposure
Determining type of fixed financial costs◦ Debt financing
◦ Can produce substantial profits, but failure to meet contractual obligations can result in bankruptcy
◦ Selling equity
◦ May reduce potential profits for existing shareholders, but reduces their risk exposure

Sources of funds – debt and equityDebt-equity hybrid financing incorporates the fundamentals of a debt structure combined with an upside yield feature such that funders obtain a materially higher return expectation versus a standard senior debt lender.
Sources of funds – debt and equity
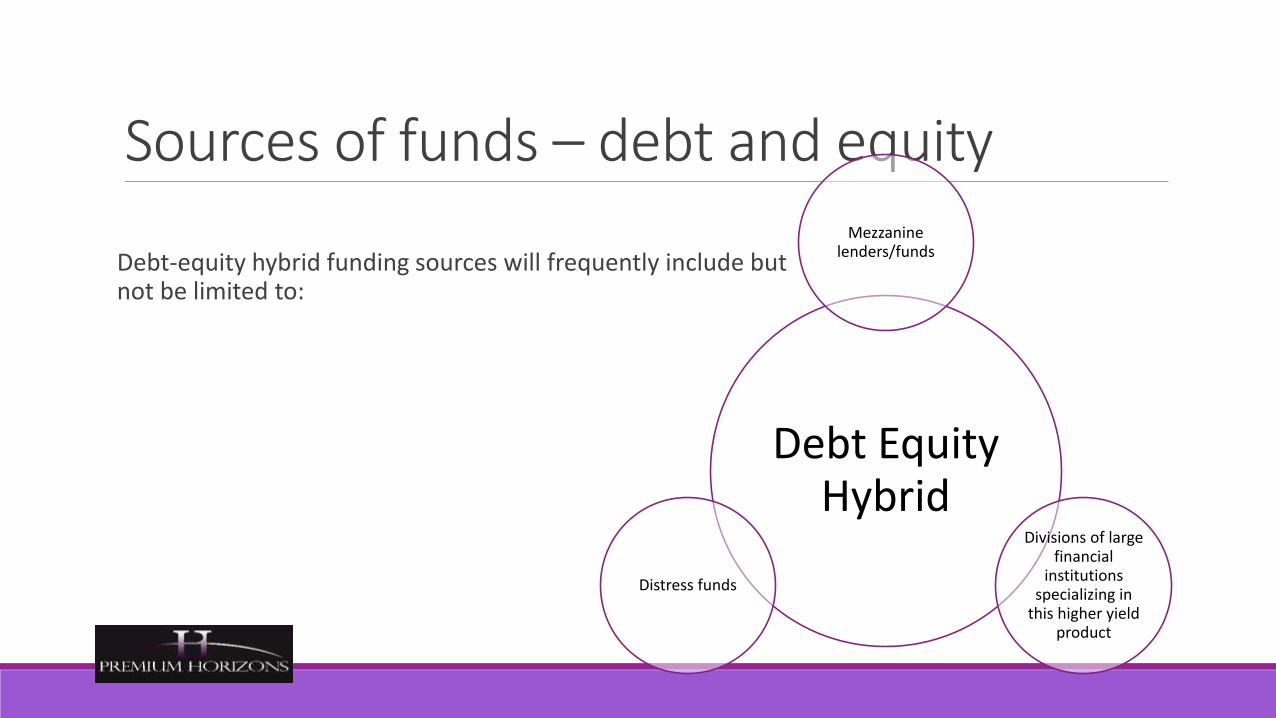
Debt-equity hybrid funding sources will frequently include but not be limited to:
Debt Equity Hybrid
Mezzanine lenders/funds
Divisions of large financial
institutions specializing in
this higher yield product
Distress funds

Sources of funds – debt and equityMezzanine funds specialize in moderately higher-risk lending transactions that provide the repayment characteristics of debt coupled with yields that in many cases may approach equity-type returns.
Divisions of large financial institutions that make loans are operating components separately identified to focus on a defined business segment.
Distress funds are special-purpose financing entities established to take advantage of defaults in the commercial real estate or commercial debt sectors within the U.S. or a foreign country. The belief is that these funds will obtain extremely attractive yields relative to risk as generally the values of the assets in question have already materially depreciated, so there is a lot less downside risk value-wise to the lender.

Cost of capital modelsA fundamental part of financial management is investment appraisal: into which long-term projects should a company put money?
Discounted cash flow techniques (DCFs), and in particular net present value (NPV), are generally accepted as the best ways of appraising projects.

Cost of capital modelsIn DCF, future cash flows are discounted so that allowance is made for the time value of money.
Two types of estimate are needed:
1. The future cash flows relevant to the project.
2. The discount rate to apply.
The cost of equityThe cost of equity is the relationship between the amount of equity capital that can be raised and the rewards expected by shareholders in exchange for their capital.
The dividend growth model
The capital asset pricing model (CAPM)

The dividend growth modelMeasure the share price (capital that could be raised) and the dividends (rewards to shareholders). The dividend growth model can then be used to estimate the cost of equity, and this model can take into account the dividend growth rate.
This formula predicts the current ex-dividend market price of a share ( ) where:
= the current dividend (whether just paid or just about to be paid)
= the expected dividend future growth rate
= the cost of equity.

The capital asset pricing model (CAPM) The capital asset pricing model (CAPM) equation is:
E(ri) = Rf + ßi(E(rm) – Rf)
Where:
E(ri) = the return from the investment
Rf = the risk free rate of return
ßi = the beta value of the investment, a measure of the systematic risk of the investment
E(rm) = the return from the market

Comparing the dividend growth model and CAPMThe dividend growth model allows the cost of equity to be calculated using empirical values readily available for listed companies.
Measure the dividends, estimate their growth (usually based on historical growth), and measure the market value of the share (though some care is needed as share values are often very volatile).

Cost of equityNote also that both of these approaches give you the cost of equity. They do not give you the weighted average cost of capital other than in the very special circumstances when a company has only equity in its capital structure.
What contributes to the risk suffered by equity shareholders, hence contributing to the beta value?
Cost of equityThere are two main components of the risk suffered by equity shareholders:
The nature of the business.
The level of gearing.

Cost of equityWhen we talk about, or calculate, the ‘cost of equity’ we have to be clear what we mean.
Is this a cost which reflects only the business risk, or is it a cost which reflects the business risk plus the gearing risk?

Cost of CapitalPositively related to risk
• Business
• Financial
WACC – The Weighted Average Cost of Capital
Cost of Equity (Ke) (ignoring transactions costs) is the return demanded by shareholders – i.e. the Dividend.
Cost of Debt (Kd) (ignoring transactions costs) is the return demanded by debt holders – i.e. Interest.

Limitations of WACC•The theory implicitly assumes that new capital is raised in the proportions specified.
•The theory assumes that the business risk of any new investment project is the same as that for the firm as a whole.
•In reality Risk Adjusted Discount Rates will be better than WACC.
Risk Adjusted Discount Rates?
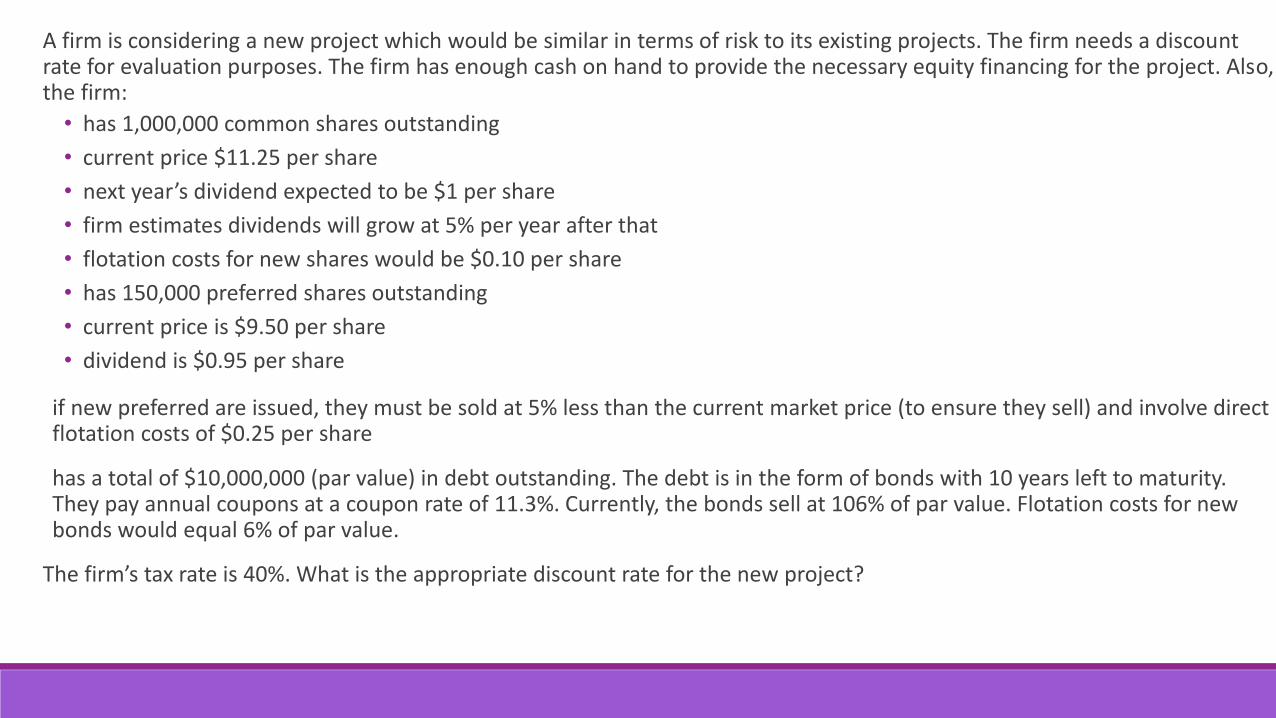
A firm is considering a new project which would be similar in terms of risk to its existing projects. The firm needs a discount rate for evaluation purposes. The firm has enough cash on hand to provide the necessary equity financing for the project. Also, the firm:
• has 1,000,000 common shares outstanding
• current price $11.25 per share
• next year’s dividend expected to be $1 per share
• firm estimates dividends will grow at 5% per year after that
• flotation costs for new shares would be $0.10 per share
• has 150,000 preferred shares outstanding
• current price is $9.50 per share
• dividend is $0.95 per share
if new preferred are issued, they must be sold at 5% less than the current market price (to ensure they sell) and involve directflotation costs of $0.25 per share
has a total of $10,000,000 (par value) in debt outstanding. The debt is in the form of bonds with 10 years left to maturity. They pay annual coupons at a coupon rate of 11.3%. Currently, the bonds sell at 106% of par value. Flotation costs for new bonds would equal 6% of par value.
The firm’s tax rate is 40%. What is the appropriate discount rate for the new project?
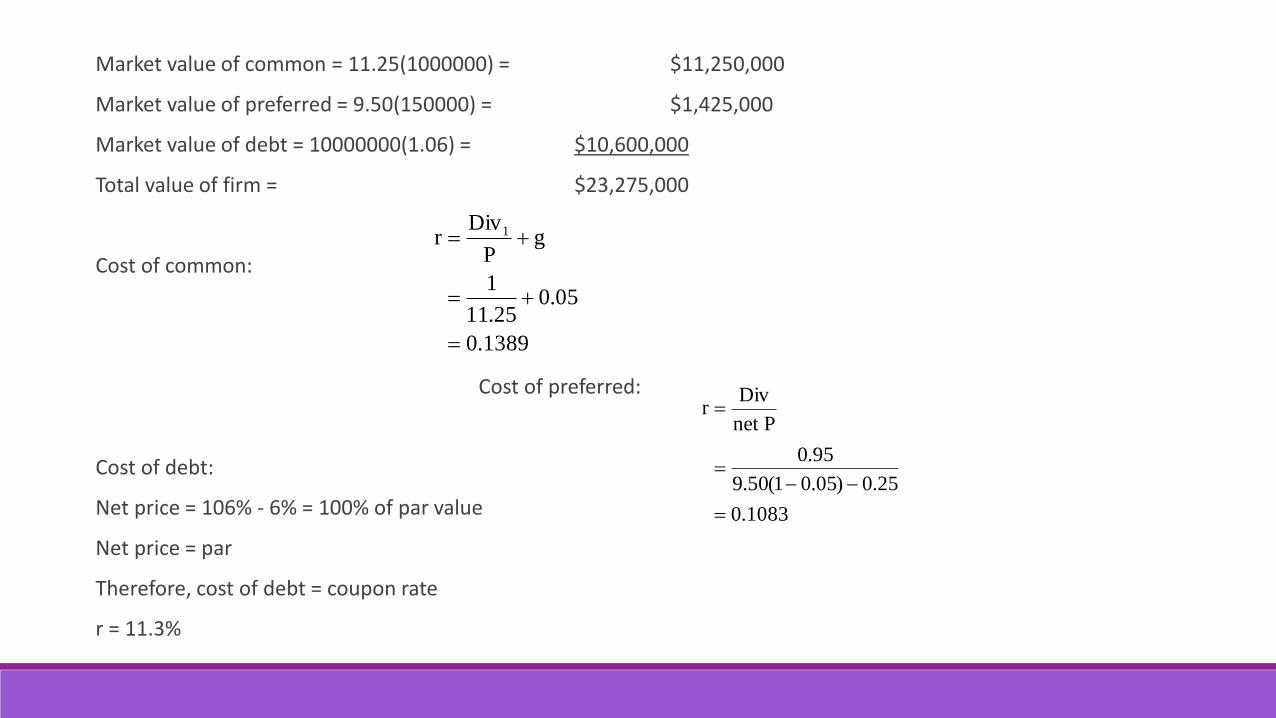
Market value of common = 11.25(1000000) = $11,250,000
Market value of preferred = 9.50(150000) = $1,425,000
Market value of debt = 10000000(1.06) = $10,600,000
Total value of firm = $23,275,000
Cost of common:
Cost of preferred:
Cost of debt:
Net price = 106% - 6% = 100% of par value
Net price = par
Therefore, cost of debt = coupon rate
r = 11.3%
1389.0
05.025.11
1
gP
Divr 1
1083.0
25.0)05.01(50.9
95.0
Pnet
Divr

%46.10
1046.0
4.01113.023275000
106000001083.0
23275000
14250001389.0
23275000
11250000WACC

Cost of equityGiven the premise that wealth is the present value of future cash flows discounted at the investors’ required return, the market value of a company is equal to the present value of its future cash flows discounted by its WACC.
The lower the WACC, the higher the market value of the company

Cost of equityIf we can change the capital structure to lower the WACC, we can then increase the market value of the company and thus increase shareholder wealth.
The search for the optimal capital structure becomes the search for the lowest WACC, because when the WACC is minimised, the value of the company/shareholder wealth is maximised.
WACCWhat mixture of equity and debt will result in the lowest WACC?
WACC is a simple average between the cost of equity and the cost of debt, one’s instinctive response is to ask which of the two components is the cheaper, and then to have more of the cheap one and less of expensive one, to reduce the average of the two.

WACCWhat factors will influence our decision?
The key question is which has the greater effect, the reduction in the WACC caused by having a greater amount of cheaper debt or the increase in the WACC caused by the increase in the financial risk.
AgencySince we are currently concerned with the issue of debt, we will assume there is no potential conflict of interest between shareholders and the management and that the management’s primary objective is the maximisation of shareholder wealth.
Therefore, the management may make decisions that benefit the shareholders at the expense of the debt-holders.
AgencyManagement may raise money from debt-holders stating that the funds are to be invested in a low-risk project, but once they receive the funds they decide to invest in a high risk/high return project.
This action could potentially benefit shareholders as they may benefit from the higher returns, but the debt-holders would not get a share of the higher returns since their returns are not dependent on company performance. Thus, the debt-holders do not receive a return which compensates them for the level of risk.
AgencyWhat might debt holders do to secure their investment?
To safeguard their investments, debt-holders often impose restrictive covenants in the loan agreements that constrain management’s freedom of action.
These restrictive covenants may limit how much further debt can be raised, set a target gearing ratio, set a target current ratio, restrict the payment of excessive dividends, restrict the disposal of major assets or restrict the type of activity the company may engage in.
AgencyWhat are the implications of cheaper debt?
Can we calculate the optimal capital structure for all firms?
Pecking Order TheoryCompanies simply follow an established pecking order which enables them to raise finance in the simplest and most efficient manner, the order is as follows:
◦ Use all retained earnings available;
◦ Then issue debt;
◦ Then issue equity, as a last resort.

Pecking Order TheoryThe justifications that underpin the pecking order are threefold:
Companies will want to minimise issue costs.
Companies will want to minimise the time and expense involved in persuading outside investors of the merits of the project.
The existence of asymmetrical information and the presumed information transfer that result from management actions.
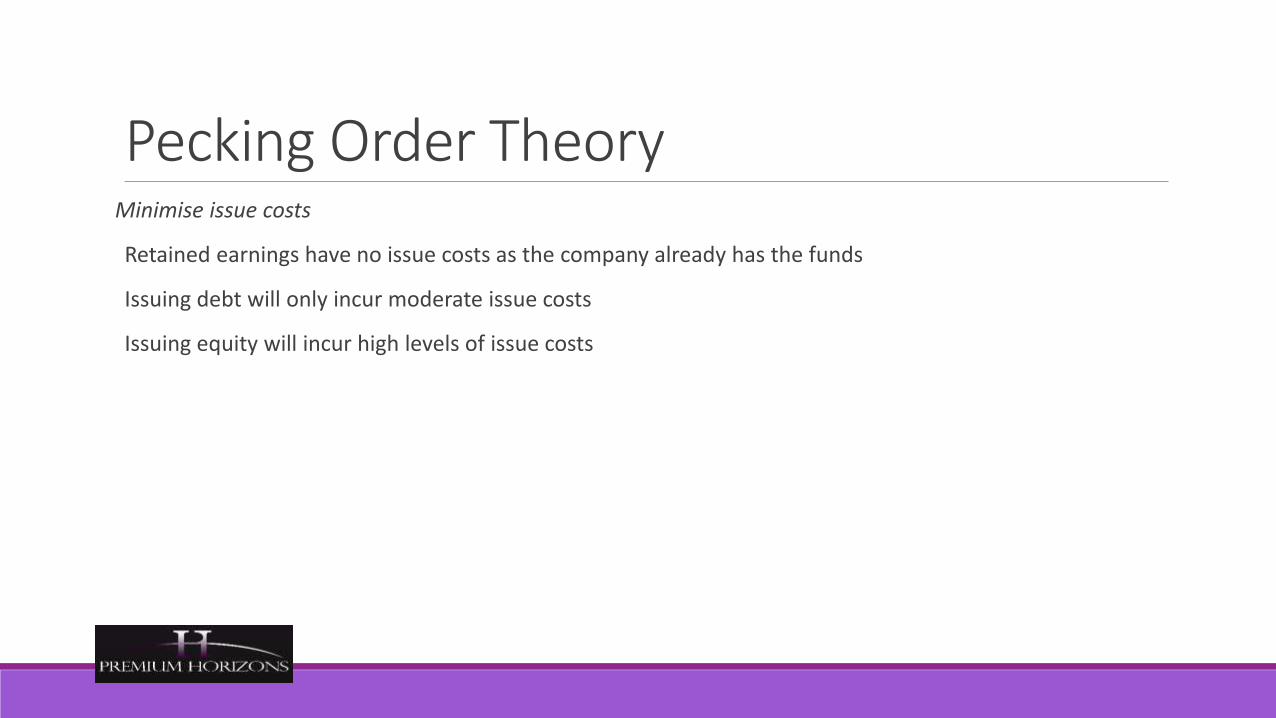
Pecking Order TheoryMinimise issue costs
Retained earnings have no issue costs as the company already has the funds
Issuing debt will only incur moderate issue costs
Issuing equity will incur high levels of issue costs

Pecking Order TheoryMinimise the time and expense involved in persuading outside investors
As the company already has the retained earnings, it does not have to spend any time persuading outside investors
The time and expense associated with issuing debt is usually significantly less than that associated with a share issue

Pecking Order TheoryThe existence of asymmetrical information
Managers know more about their companies’ prospects than the outside investors/the markets.
Managers know all the detailed inside information, whilst the markets only have access to past and publicly available information

Pecking Order TheoryWhat are the implications of Pecking Order Theory?
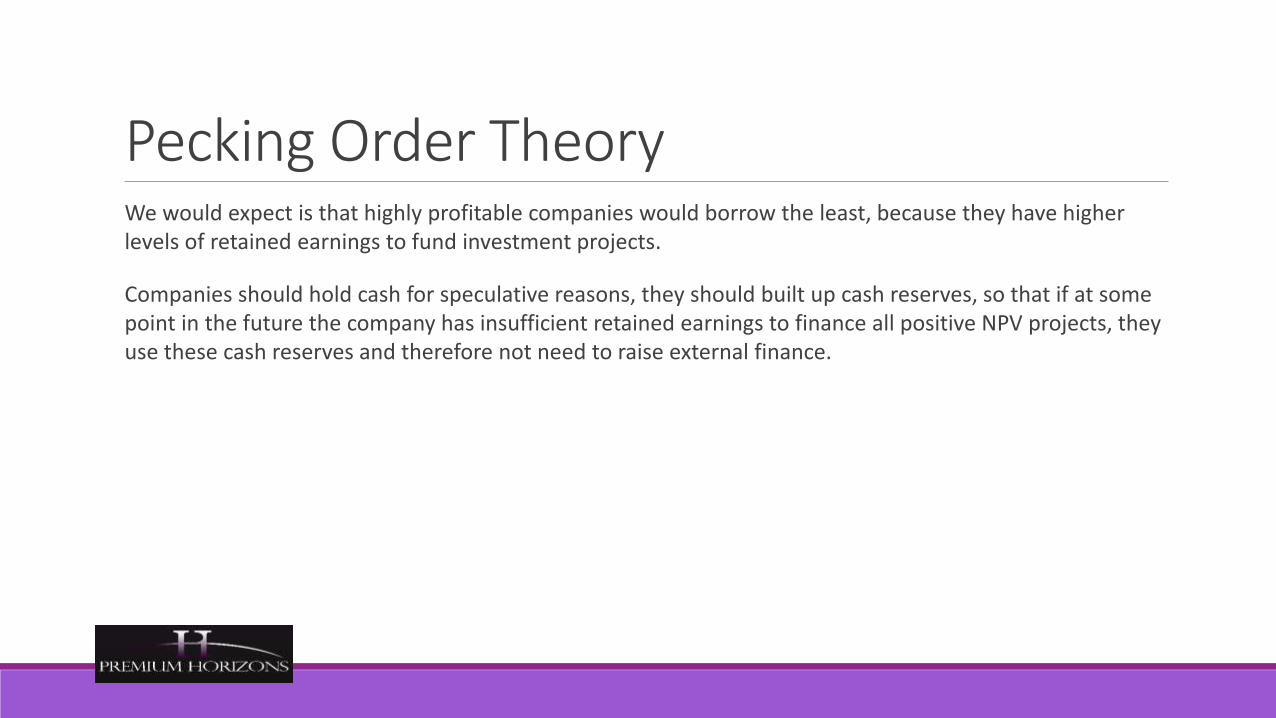
Pecking Order TheoryWe would expect is that highly profitable companies would borrow the least, because they have higher levels of retained earnings to fund investment projects.
Companies should hold cash for speculative reasons, they should built up cash reserves, so that if at some point in the future the company has insufficient retained earnings to finance all positive NPV projects, they use these cash reserves and therefore not need to raise external finance.

Free Cash FlowStarting point Pre-tax profit plus depreciation
Other money coming in Disposals and other cash incomes
“No choice” expenditure Tax and interest
Virtually “no choice” expenditure Dividends
What is left? What the board is left to spend – Free Cash Flow
But some firms create their “own brand”!!
• Boots• Cadbury Schweppes
FINANCIAL DATA ANALYSIS

Introduction to Free Cash FlowsDividends are the cash flows actually paid to stockholders
Free cash flows are the cash flows available for distribution.
Applied to dividends, the DCF model is the discounted dividend approach or dividend discount model (DDM). This chapter extends DCF analysis to value a firm and the firm’s equity securities by valuing its free cash flow to the firm (FCFF) and free cash flow to equity (FCFE).

Introduction to Free Cash FlowsAnalysts like to use free cash flow valuation models (FCFF or FCFE) whenever one or more of the following conditions are present:◦ the firm is not dividend paying,
◦ the firm is dividend paying but dividends differ significantly from the firm’s capacity to pay dividends,
◦ free cash flows align with profitability within a reasonable forecast period with which the analyst is comfortable, or
◦ the investor takes a control perspective.
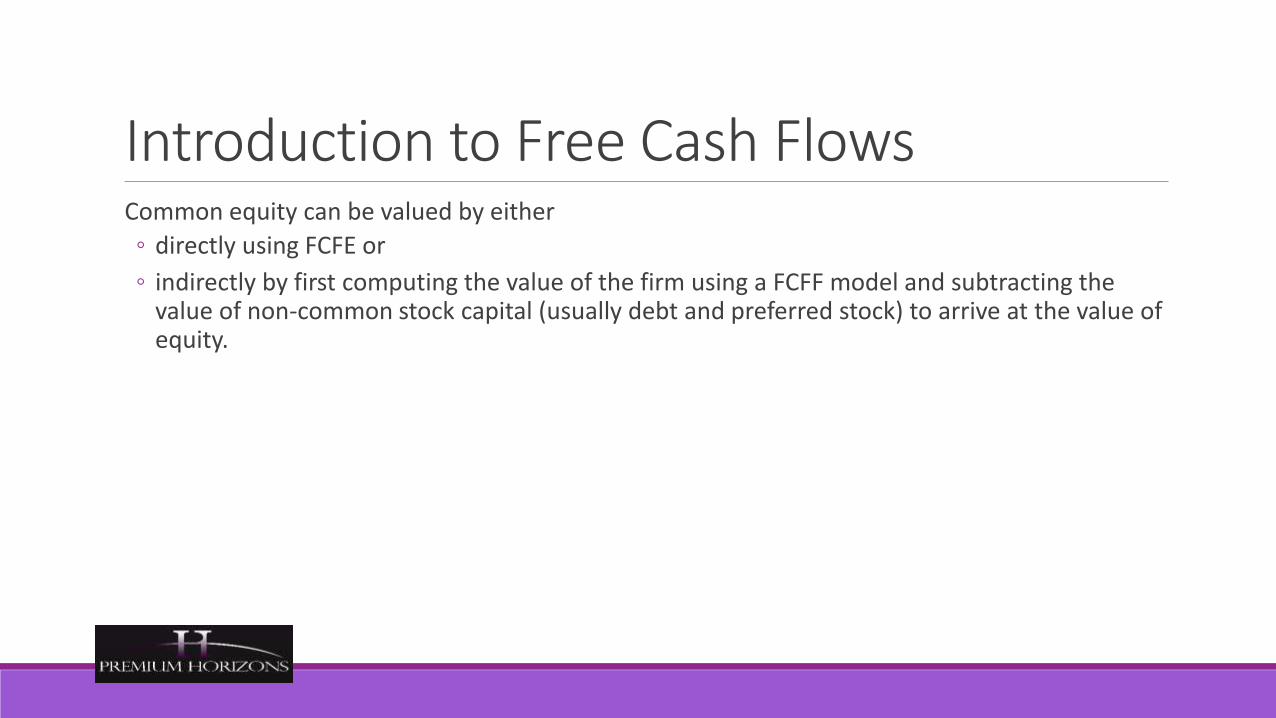
Introduction to Free Cash FlowsCommon equity can be valued by either
◦ directly using FCFE or
◦ indirectly by first computing the value of the firm using a FCFF model and subtracting the value of non-common stock capital (usually debt and preferred stock) to arrive at the value of equity.
Defining Free Cash FlowFree cash flow to equity (FCFE) is the cash flow available to the firm’s common equity holders after all operating expenses, interest and principal payments have been paid, and necessary investments in working and fixed capital have been made.
◦ FCFE is the cash flow from operations minus capital expenditures minus payments to (and plus receipts from) debt holders.
Forecasting free cash flowsComputing FCFF and FCFE based upon historical accounting data is straightforward. Often times, this data is then used directly in a single-stage DCF valuation model.
On other occasions, the analyst desires to forecast future FCFF or FCFE directly. In this case, the analyst must forecast the individual components of free cash flow. This section extends our previous presentation on computing FCFF and FCFE to the more complex task of forecasting FCFF and FCFE. We present FCFF and FCFE valuation models in the next section.

Forecasting free cash flowsGiven that we have a variety of ways in which to derive free cash flow on a historical basis, it should come as no surprise that there are several methods of forecasting free cash flow.
One approach is to compute historical free cash flow and apply some constant growth rate. This approach would be appropriate if free cash flow for the firm tended to grow at a constant rate and if historical relationships between free cash flow and fundamental factors were expected to be maintained.
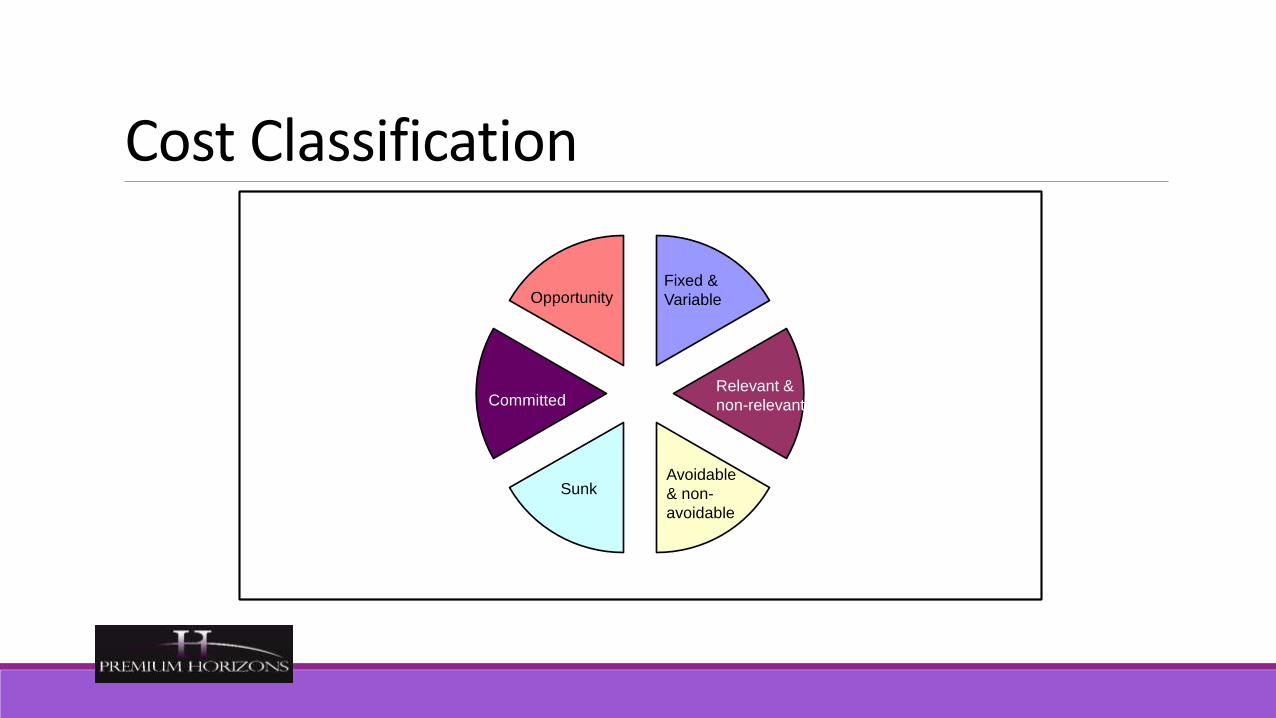
Cost Classification
Sunk
Fixed &
Variable
Relevant &
non-relevant
Avoidable
& non-
avoidable
Opportunity
Committed

• To introduce
- The process for dealing with overhead costs- Marginal costing - Absorption costing- Activity based costing
• To compare the three costing systems
Comparing Costing systems
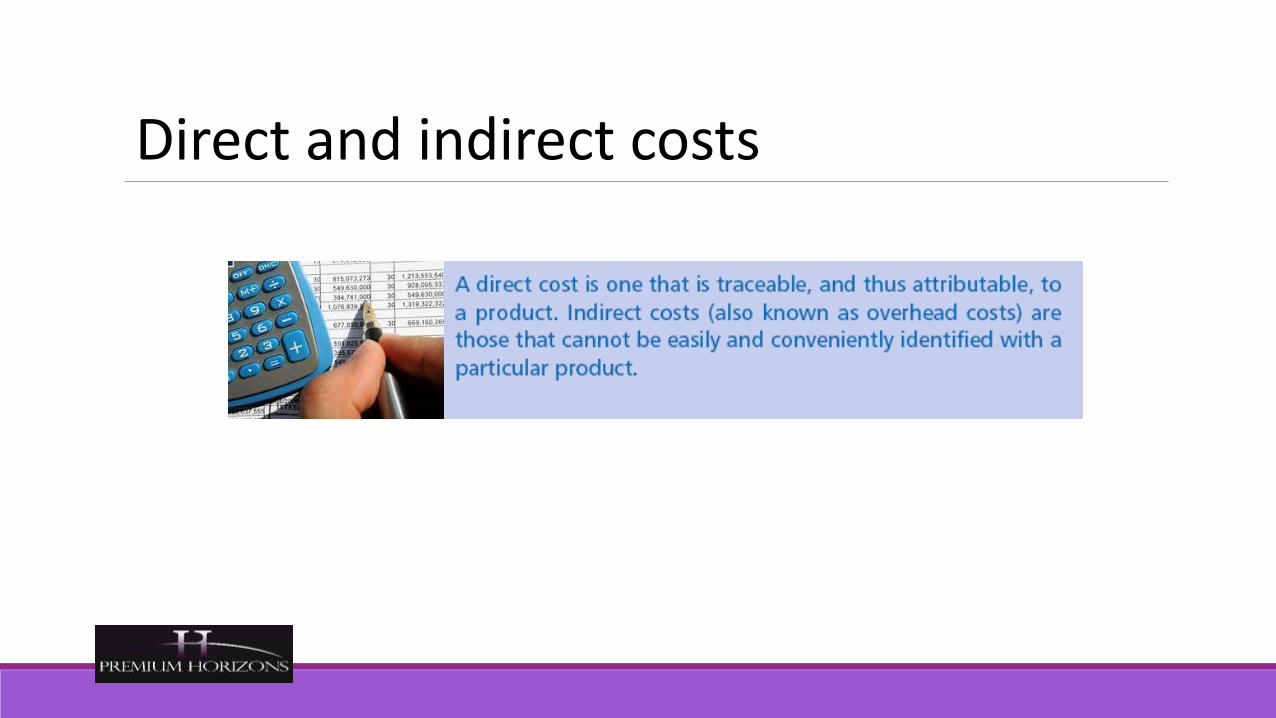
Direct and indirect costs
Full costing

Components of cost of goods sold
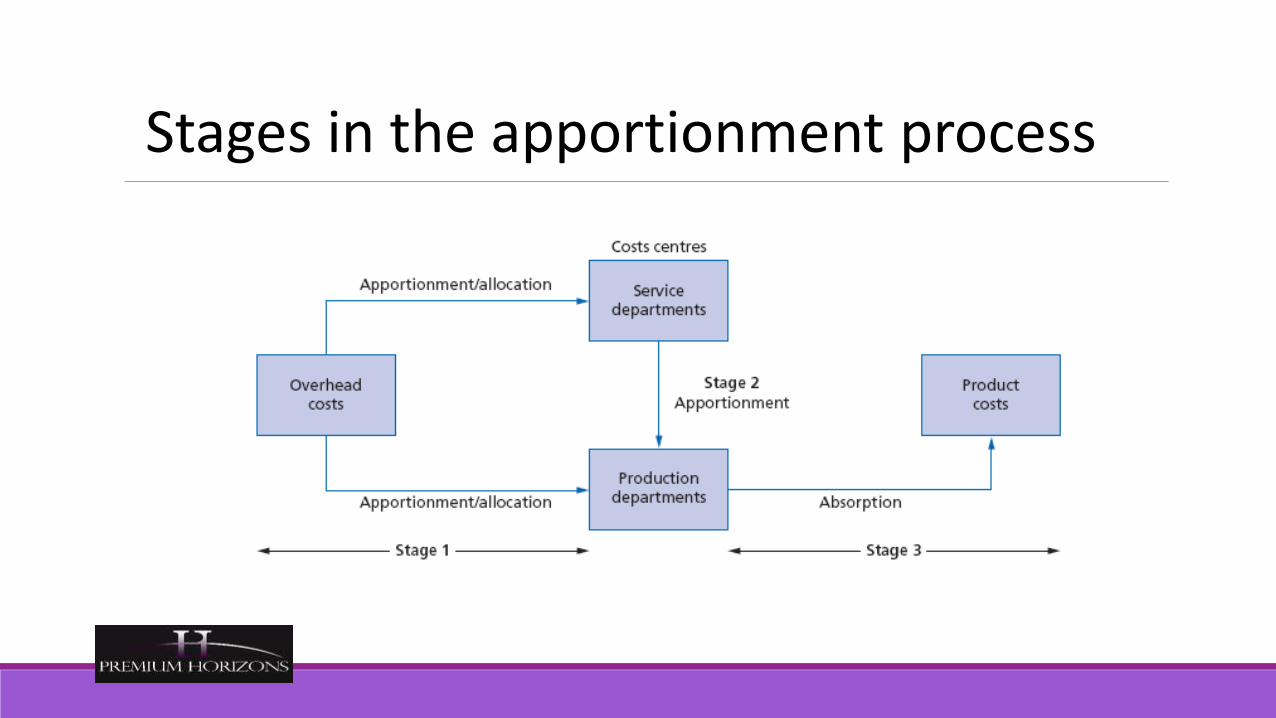
Stages in the apportionment process
Activity based costing

Marginal costing

Absorption costingAbsorption costing – uses predetermined overhead rates
• Budgeted costs / output
• Actual costs / output
• Difference between budget and actual = under or over absorption of overhead costs
Absorption Costing ExampleStroud Ltd is a small manufacturing company which operates from rented premises on a trading estate.The following is available regarding its overheads.The company is split into 5 cost centresCutting, Painting and Assembling, which are production departments, and two production-related service departments, maintenance and canteen.

Overhead information
Allocated overheads$
Cutting 20,000Painting 15,000Assembling 30,000Maintenance 10,000Canteen 8,000
Other overheads$
Rent & Rates 50,000Insurance 70,000Depreciation 25,000
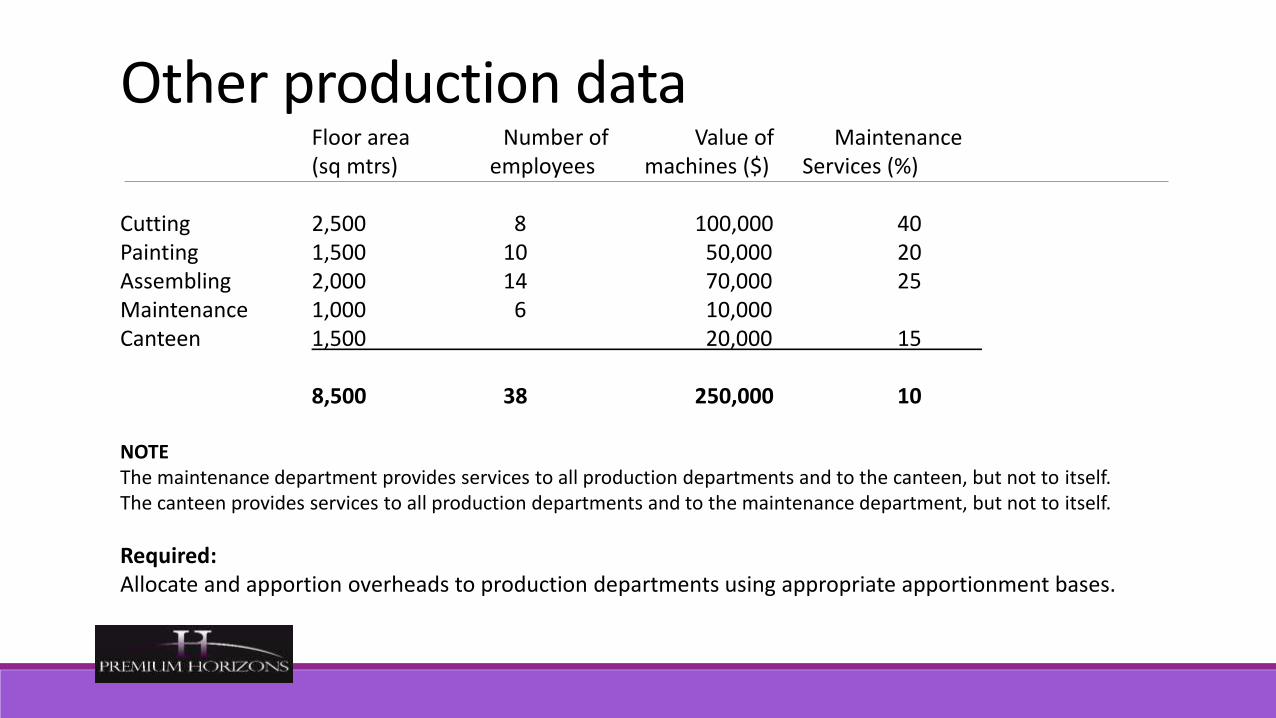
Other production data Floor area Number of Value of Maintenance(sq mtrs) employees machines ($) Services (%)
Cutting 2,500 8 100,000 40Painting 1,500 10 50,000 20Assembling 2,000 14 70,000 25Maintenance 1,000 6 10,000Canteen 1,500 20,000 15
8,500 38 250,000 10
NOTEThe maintenance department provides services to all production departments and to the canteen, but not to itself.The canteen provides services to all production departments and to the maintenance department, but not to itself.
Required:Allocate and apportion overheads to production departments using appropriate apportionment bases.
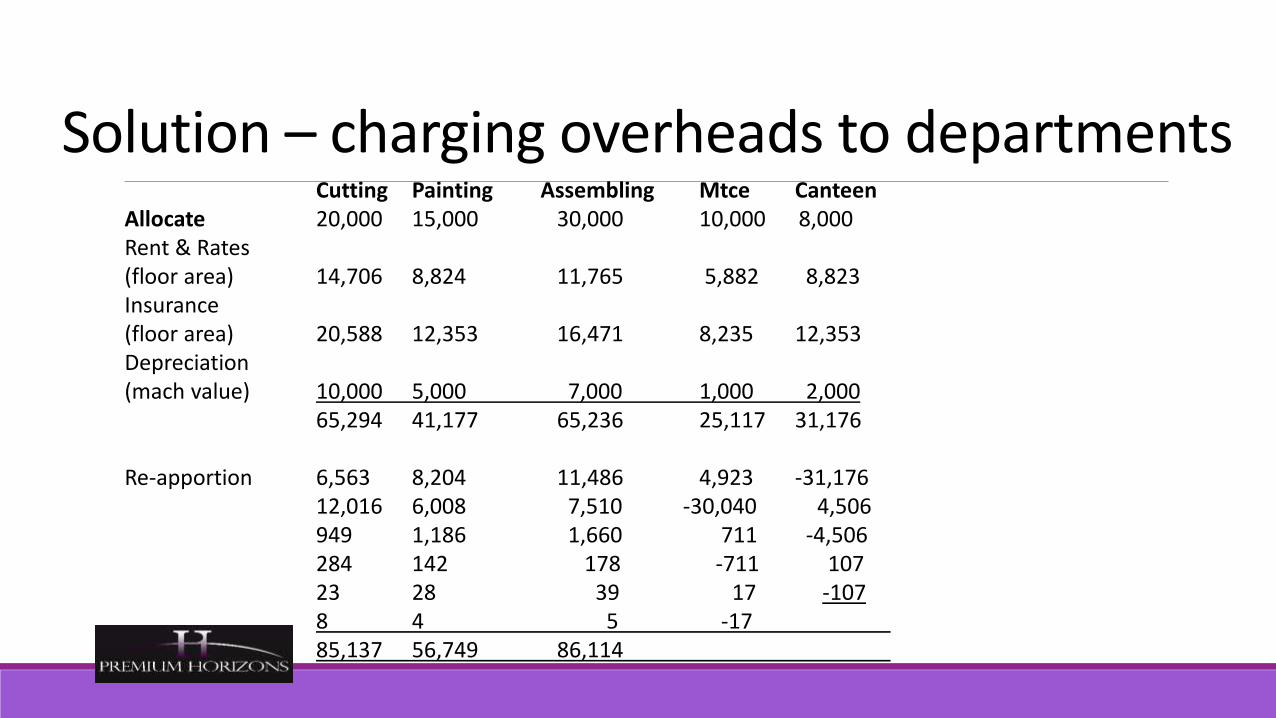
Solution – charging overheads to departmentsCutting Painting Assembling Mtce Canteen
Allocate 20,000 15,000 30,000 10,000 8,000Rent & Rates (floor area) 14,706 8,824 11,765 5,882 8,823Insurance (floor area) 20,588 12,353 16,471 8,235 12,353Depreciation (mach value) 10,000 5,000 7,000 1,000 2,000
65,294 41,177 65,236 25,117 31,176
Re-apportion 6,563 8,204 11,486 4,923 -31,17612,016 6,008 7,510 -30,040 4,506949 1,186 1,660 711 -4,506284 142 178 -711 10723 28 39 17 -1078 4 5 -1785,137 56,749 86,114

Apportionment basesThe company has provided data on one of its lines, "The Moreton" as shown below:The company expects to manufacture 5,000 units of this productDetails per unit are:Direct materials 4 Kg of materials @ $1.50 per Kg
Direct labourCutting Dept 2 hours @ $6.00 per hourPainting Dept 3 hours @ $4.00 per hourAssembling Dept 5 hours @ $5.50 per hour
Machine use in the Cutting Dept is expected to be 10,000 hours (ie 2 hours per unit)Required:Calculate the overhead absorption rates for each production department using the most appropriate apportionment base.

SolutionAppropriate apportionment basis
Cutting Dept 85,137/10,000 = $8.51 per machine hourPainting Dept 56,749/15,000 = $3.78 per labour hourAssembling Dept 86,114/25,000 = $3.44 per labour hour
Then:On the basis of the information you have been given and have calculated
Calculate the full cost of ONE unit of this product.

£ £Direct Materials 4 Kg @ £1.50 per Kg 6.00
Direct LabourCutting 2 hrs @ £6.00 12.00Painting 3 hrs @ £4.00 12.00Assembling 5 hrs @ £5.50 27.50
51.50
OverheadsCutting 2 mach. hrs @ £8.51 17.02Painting 3 labour hrs @ £3.78 11.34Assembling 5 labour hrs @ £3.44 17.20
45.56
Total unit cost 103.06
Solution Full cost of one unit of product

Details for 1 month's activity on Production Line "A”
Labour Maintenance
Hours Total Stores Hours Spare Batch
Product Volume per unit Hours Reqs Attended Parts Set-ups
W 5,000 0.75 3,750 40 14 6 2
X 800 1.5 1,200 10 27 18 4
Y 2,500 0.5 1,250 6 30 4 5
Z 750 1.0 750 10 6 4 1
6,950 66 77 32 12

Overhead Costs for Production Line "A" £
Stores costs 7,590
Maintenance costs 3,003
Spares administration 3,456
Set-up costs 4,176
18,225
Required:
Calculate the overhead absorption rate PER UNIT for each product
on a Labour Hours Basis
on an Activity Basis
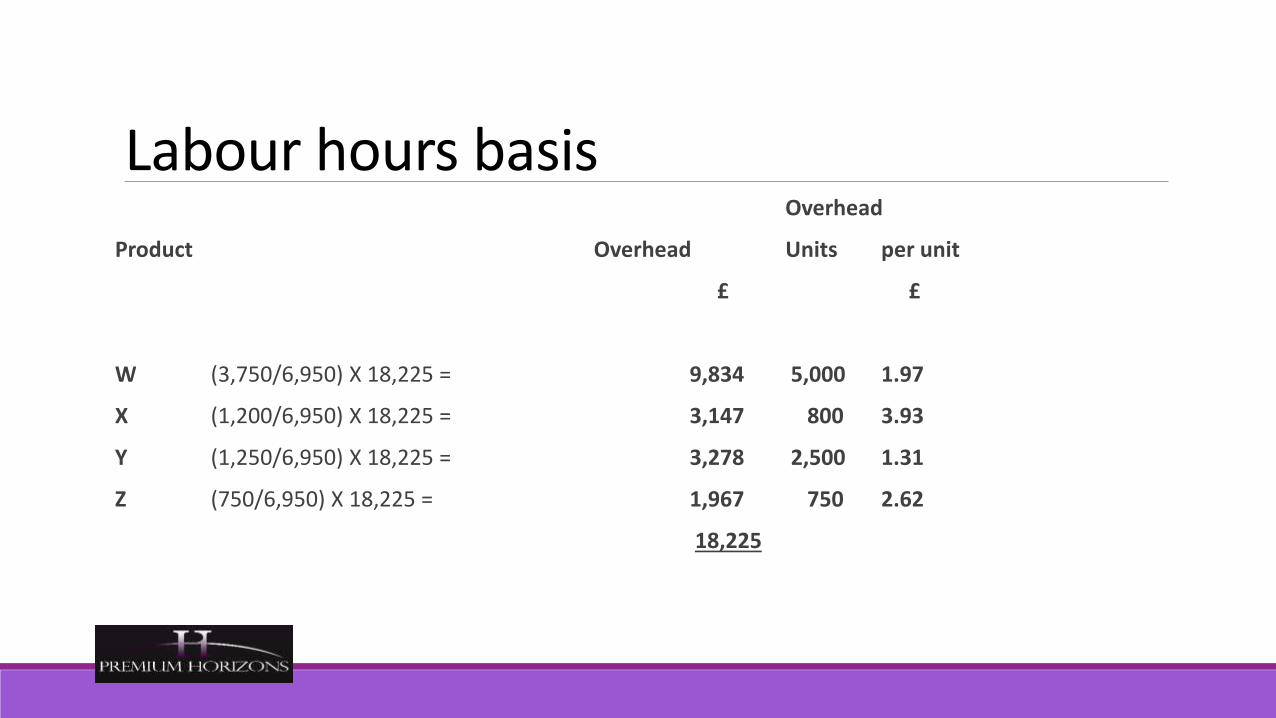
Labour hours basis Overhead
Product Overhead Units per unit
£ £
W (3,750/6,950) X 18,225 = 9,834 5,000 1.97
X (1,200/6,950) X 18,225 = 3,147 800 3.93
Y (1,250/6,950) X 18,225 = 3,278 2,500 1.31
Z (750/6,950) X 18,225 = 1,967 750 2.62
18,225

By Activity Stores Maint Spares Set-up
Overhead
Costs Costs Admin. Costs Total Units per unit
£
W 4,600 546 648 696 6,490 5,000 1.30
X 1,150 1,053 1,944 1,392 5,539 800 6.92
Y 690 1,170 432 1,740 4,032 2,500 1.61
Z 1,150 234 432 348 2,164 750 2.89
7,590 3,003 3,456 4,176 18,225 9,050

By Activity Summary of differences:
W X Y Z
Labour 1.97 3.93 1.31 2.62
Activity 1.30 6.92 1.61 2.89
(0.67) 2.99 0.30 0.27
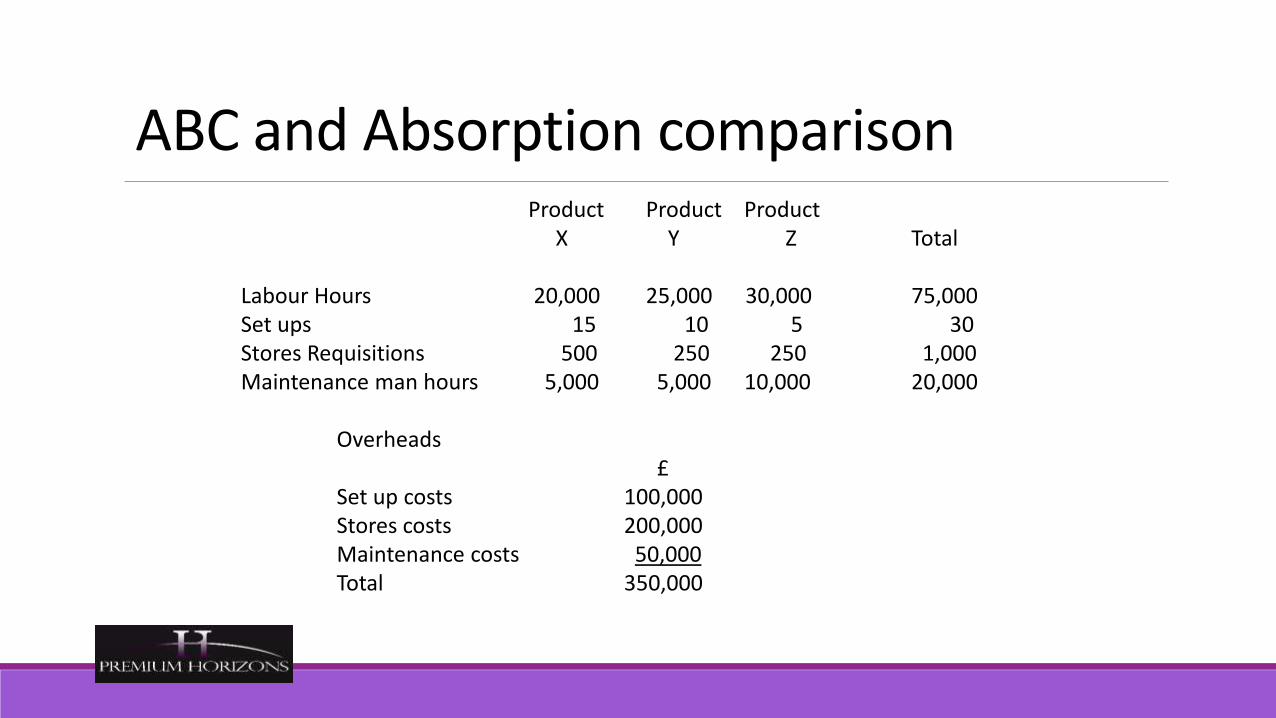
ABC and Absorption comparisonProduct Product Product
X Y Z Total
Labour Hours 20,000 25,000 30,000 75,000Set ups 15 10 5 30Stores Requisitions 500 250 250 1,000Maintenance man hours 5,000 5,000 10,000 20,000
Overheads£
Set up costs 100,000Stores costs 200,000Maintenance costs 50,000Total 350,000

ResultsApportion costs
Product Product ProductX Y Z Total
On labour hours basis 93,333 116,667 140,000 350,000
Using ABC - by cost driverSet up costs 50,000 33,333 16,667 100,000Stores costs 100,000 50,000 50,000 200,000Maintenance costs 12,500 12,500 25,000 50,000
162,500 95,833 91,667 350,000
Difference (over/under costed) -69,167 20,834 48,333
Cost and Cost TerminologyThere are two basic stages of accounting for costs:
• Cost accumulation
• Cost assignment to various cost objects

Cost and Cost Terminology
CostAccumulation
Cost Object
Cost Object
Cost Object
Cost Assignment
Direct Costs• Direct costs of a cost object are those that are related to a given cost object (product,
department, etc.) and that can be traced to it in an economically feasible way.
• Cost-Tracing describes the assignment of direct costs to the particular cost object
Indirect Costs• Indirect Costs are related to the particular cost object but cannot be traced to it in an
economically feasible way.
• Cost allocation describes the assigning of indirect costs to the particular cost object.
Cost Behaviour Patterns• Variable costs change in total in proportion to changes in the related level of total activity or
volume.
• Fixed costs do not change in total for a given time period despite wide changes in the related level of total activity or volume.

Cost Behaviour PatternsAssume that Smiths Bicycles buys a handlebar at £52 for each of its bicycles.
Total handlebar cost is an example of a cost that changes in total in proportion to changes in the number of bicycles assembled (variable cost).
What is the total handlebar cost when 1,000 bicycles are assembled?

Cost Behaviour Patterns• 1,000 units x £52 = £52,000
• What is the total handlebar cost when 3,500 bicycles are assembled?
• 3,500 units x £52 = £182,000

Cost Behaviour Patterns
0 1,000 3,500 Units
52
182
Total Costs£ 000

Cost Behaviour Patterns• Assume that Smiths Bicycles incurred £94,500 in a given year for the leasing of its plant.
• This is an example of fixed costs with respect to the number of bicycles assembled.
• These costs are unchanged in total over a designated range of the number of bicycles assembled during a given time span.

Cost Behaviour Patterns• What is the leasing (fixed) cost per bicycle when Smiths assembles 1,000 bicycles?
• £94,500 ÷ 1,000 = £94.50
• What is the leasing (fixed) cost per bicycle when Smiths assembles 3,500 bicycles?
• £94,500 ÷ 3,500 = £27

Cost Drivers• A cost driver is a factor, such as the level of activity or volume, that causally affects costs
(over a given time span).
• The cost driver of variable costs is the level of activity or volume whose change causes the (variable) costs to change proportionately.
• The number of bicycles assembled is a cost driver of the cost of handlebars.
Relevant Range• The relevant range is the band of the level of activity or volume in which a specific
relationship between the level of activity or volume and the cost in question is valid.
• Assume that fixed (leasing) costs are £94,500 for a year and that they remain the same for a certain volume range (1,000 to 5,000 bicycles).
• 1,000 to 5,000 bicycles is the relevant range.
• If annual demand for Smiths bicycles increases, and the company needs to assemble more than 5,000 bicycles, it would need to lease additional space which would increase its fixed costs.
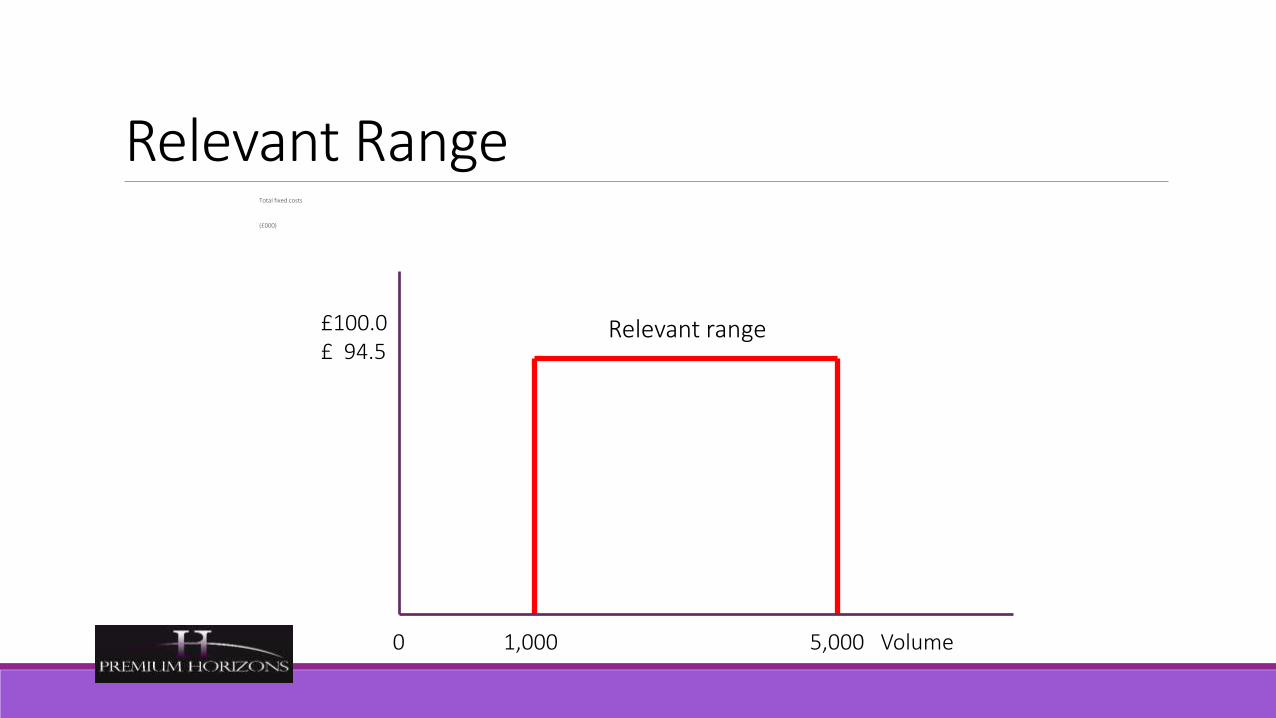
Relevant RangeTotal fixed costs
(£000)
0 1,000 5,000 Volume
£100.0 £ 94.5
Relevant range

Total Costs and Unit Costs• A unit cost (also called an average cost) is computed by dividing some amount of cost total by
some number of units.
• The “units”may be expressed in various ways:
• Hours worked
• Packages delivered
• Bicycles assembled
Total Costs and Unit Costs• What is the unit cost (leasing and handlebars) when Smiths Bicycles assembles 1,000
bicycles?
• Total fixed cost £94,500 + Total variable cost £52,000 = £146,500
• £146,500 ÷ 1,000 = £146.50
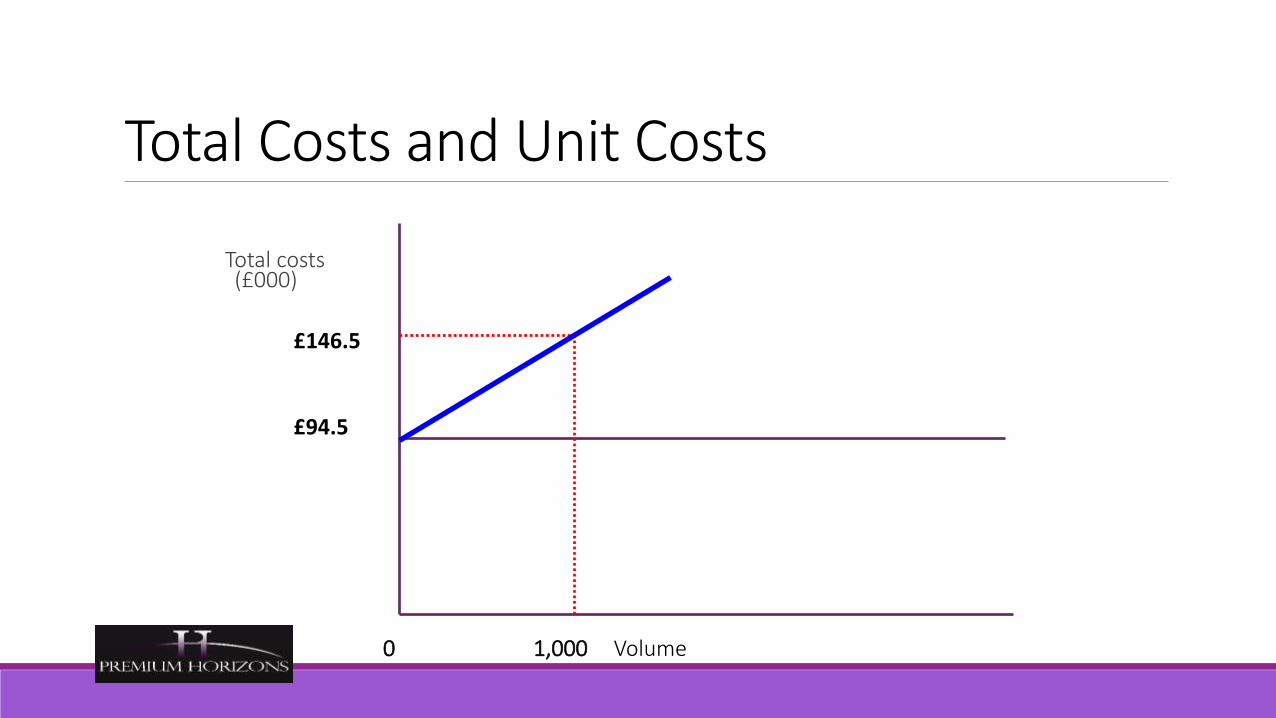
Total Costs and Unit Costs
Total costs (£000)
0 1,000 Volume
£146.5
£94.5

Use Unit Costs Cautiously• Assume that Smith Bicycles management uses a unit cost of £146.50 (leasing and
handlebars).
• Management is budgeting costs for different levels of production.
What is their budgeted cost for an estimated production of 600 bicycles?
600 × £146.50 = £87,900
What is their budgeted cost for an estimated production of 3,500 bicycles?
3,500 × £146.50 = £512,750

Use Unit Costs CautiouslyWhat should the budgeted cost be for an estimated production of 600 bicycles?
Total fixed cost £ 94,500
Total variable cost (£52 × 600) = 31,200
Total £125,700
£125,700 ÷ 600 = £209.50
Using a cost of £146.50 per unit would underestimate actual total costs if output is below 1,000 units.
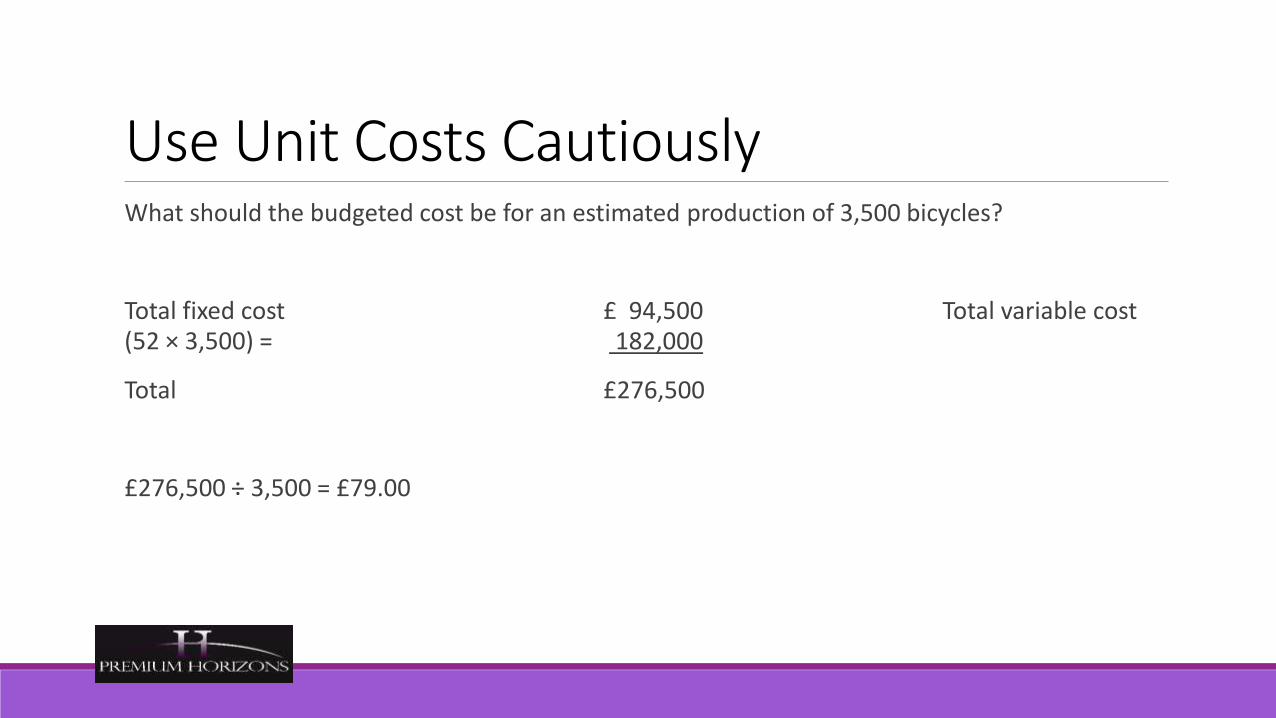
Use Unit Costs CautiouslyWhat should the budgeted cost be for an estimated production of 3,500 bicycles?
Total fixed cost £ 94,500 Total variable cost (52 × 3,500) = 182,000
Total £276,500
£276,500 ÷ 3,500 = £79.00
Use Unit Costs Cautiously• Using a cost of £146.50 per unit instead of £79.00 would overestimate actual total costs if
output is above 1,000 units.
• For decision making, managers should think in terms of total costs rather than unit costs.

Marginal Cost• Marginal Cost is defined as the amount at any given volume of output by which aggregate costs
are changed if the volume of output is increased or decreased by one unit.
• The marginal cost should be lower than the marginal revenue

Marginal CostWhy isn’t marginal costing used as the basis for all selling prices?
• Contribution from all sales must first meet the cost of the fixed expenses before any net profit is made
• First application of marginal costing was as a technique for use in times of trade recession, when plant & resources were under-utilised
Marginal Cost
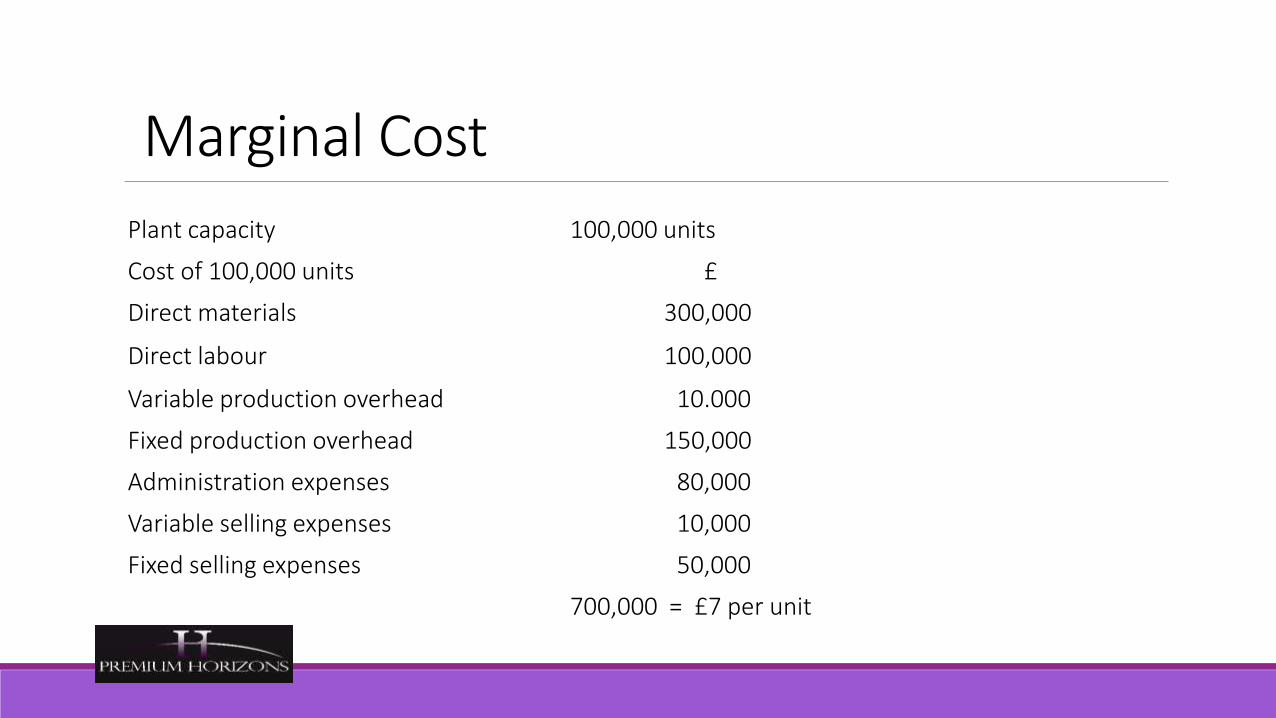
Plant capacity 100,000 units
Cost of 100,000 units £
Direct materials 300,000
Direct labour 100,000
Variable production overhead 10.000
Fixed production overhead 150,000
Administration expenses 80,000
Variable selling expenses 10,000
Fixed selling expenses 50,000
700,000 = £7 per unit
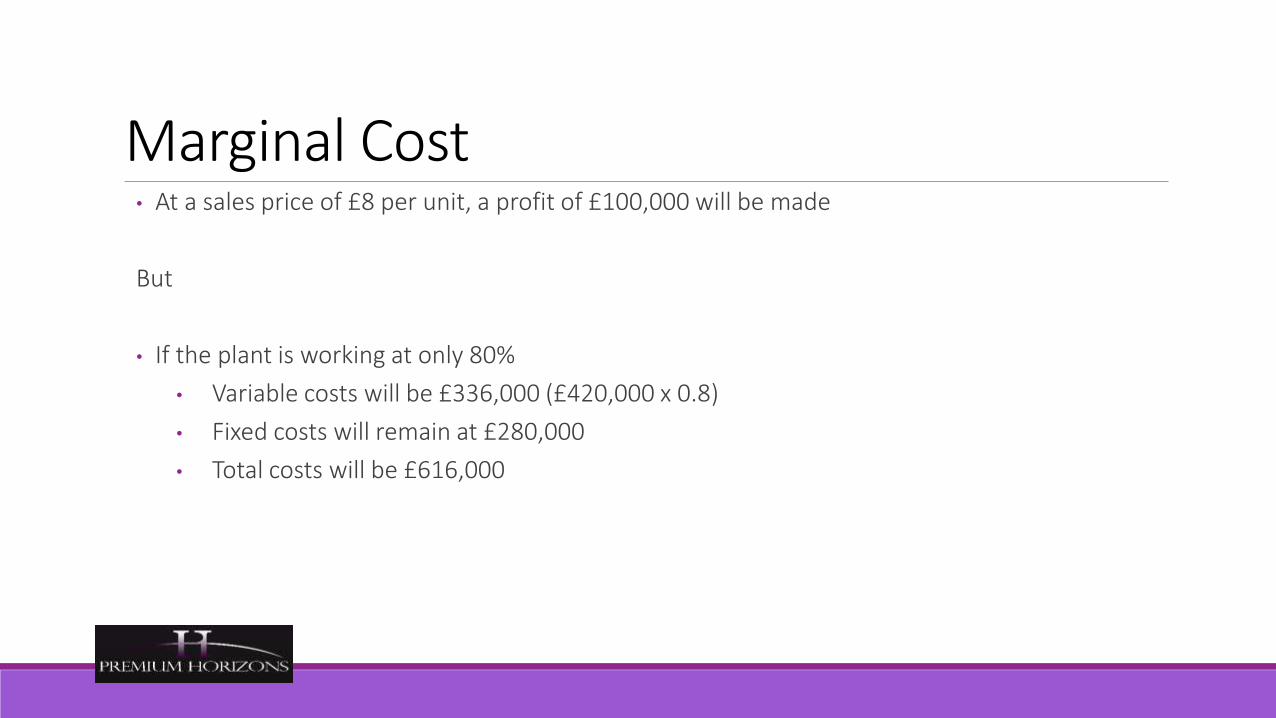
Marginal Cost• At a sales price of £8 per unit, a profit of £100,000 will be made
But
• If the plant is working at only 80%
• Variable costs will be £336,000 (£420,000 x 0.8)
• Fixed costs will remain at £280,000
• Total costs will be £616,000
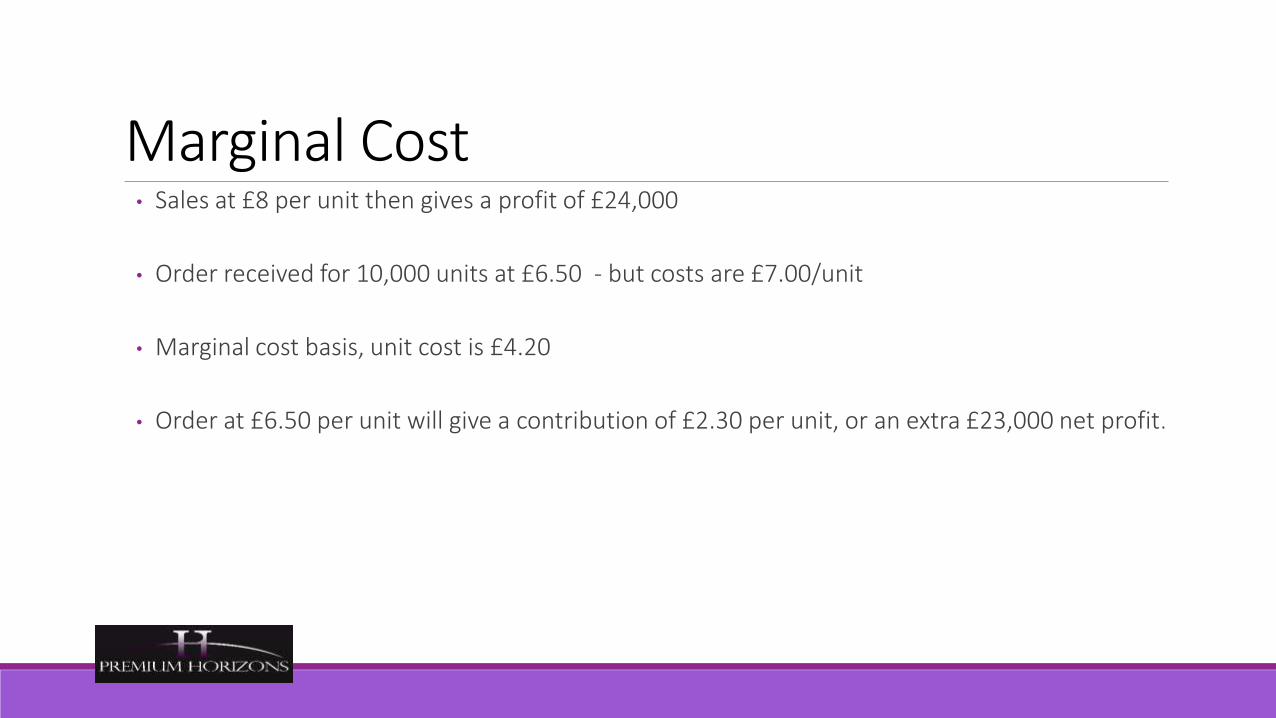
Marginal Cost• Sales at £8 per unit then gives a profit of £24,000
• Order received for 10,000 units at £6.50 - but costs are £7.00/unit
• Marginal cost basis, unit cost is £4.20
• Order at £6.50 per unit will give a contribution of £2.30 per unit, or an extra £23,000 net profit.
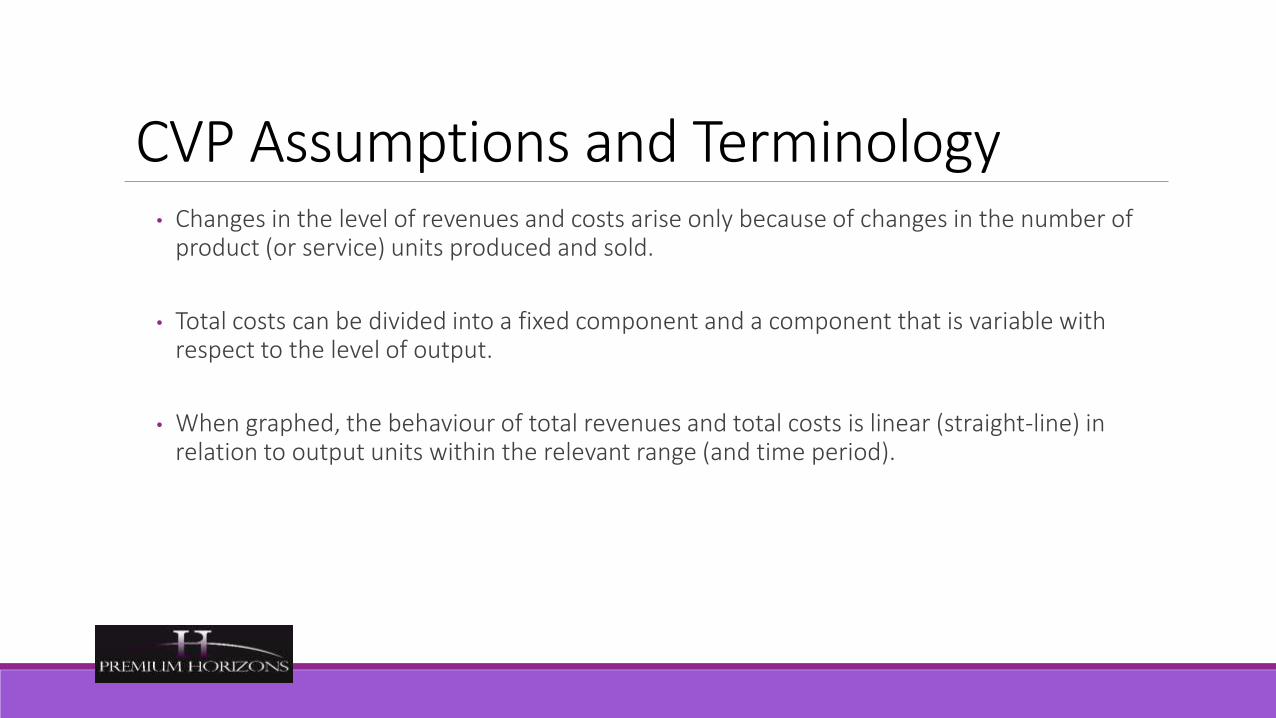
CVP Assumptions and Terminology• Changes in the level of revenues and costs arise only because of changes in the number of
product (or service) units produced and sold.
• Total costs can be divided into a fixed component and a component that is variable with respect to the level of output.
• When graphed, the behaviour of total revenues and total costs is linear (straight-line) in relation to output units within the relevant range (and time period).

CVP Assumptions and Terminology• The unit selling price, unit variable costs, and fixed costs are known
and constant.
• The analysis either covers a single product or assumes that the sales mix when multiple products are sold will remain constant as the level of total units sold changes.
• All revenues and costs can be added and compared without taking into account the time value of money.

Contribution Margin v’s Gross MarginContribution income statement emphasizes contribution margin.
• Revenues – Variable cost of goods sold –Variable operating costs = Contribution margin
• Contribution margin – Fixed operating costs = Operating income
Financial accounting income statement emphasizes gross margin.
• Revenues – Cost of goods sold = Gross margin
• Gross margin – Operating costs = Operating income


Luboil ExampleLubeoil’s profit budget for its next financial year is:
Sales: £1m
Overall gross margin: 45 per cent
Budgeted sales volume: 100,000 units
Fixed costs: £400,000
What are:
◦ The company’s unit variable costs?
◦ The company’s unit fixed costs?
◦ The company’s unit average total costs?
What is Lubeoil’s budgeted contribution?
What sales volume is required to break even?
What sales volume is needed to earn an operating profit of £100,000 assuming no change in fixed assets?
Margin of Safety
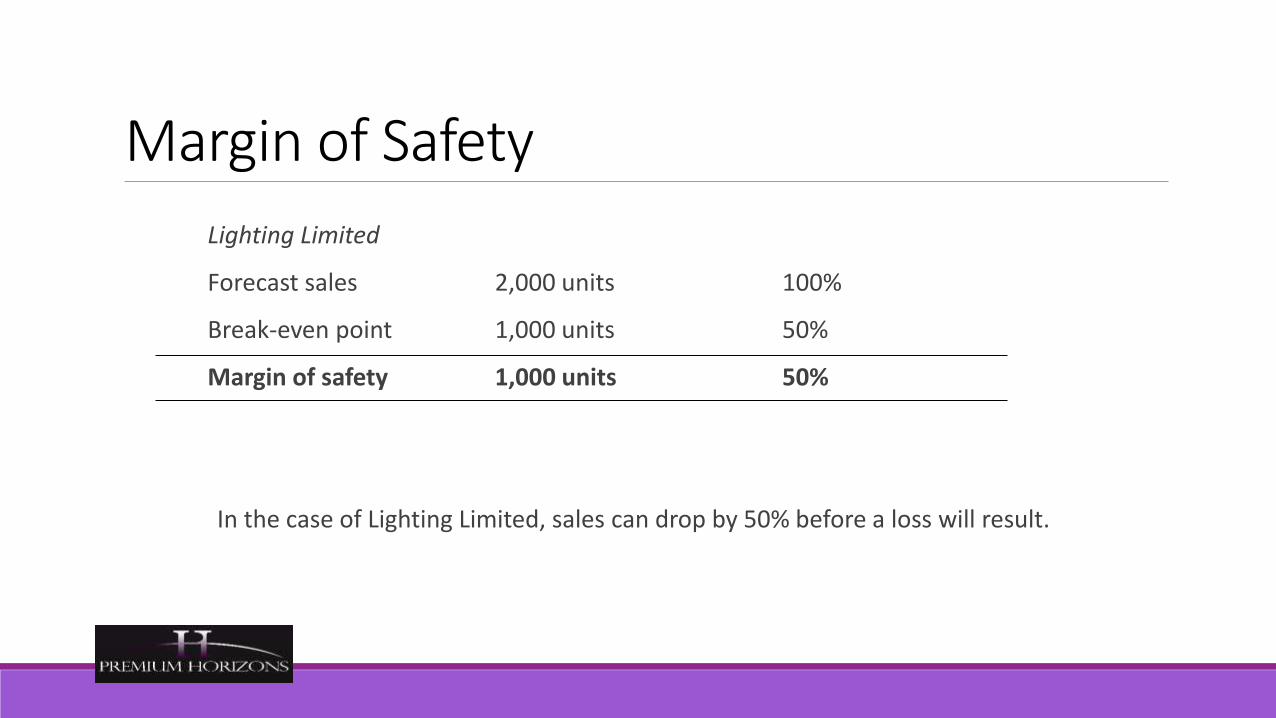
Lighting Limited
Forecast sales 2,000 units 100%
Break-even point 1,000 units 50%
Margin of safety 1,000 units 50%
In the case of Lighting Limited, sales can drop by 50% before a loss will result.

Margin of SafetyThe margin of safety allows a company to assess its degree of risk. For example, a margin of safety of only 1% would indicate that if sales fell by more than 1% of the budgeted figure a loss would result.
We can also calculated the margin of safety as follows:
Margin of safety x 100
Forecast sales
1,000 x 100 = 50%
2,000
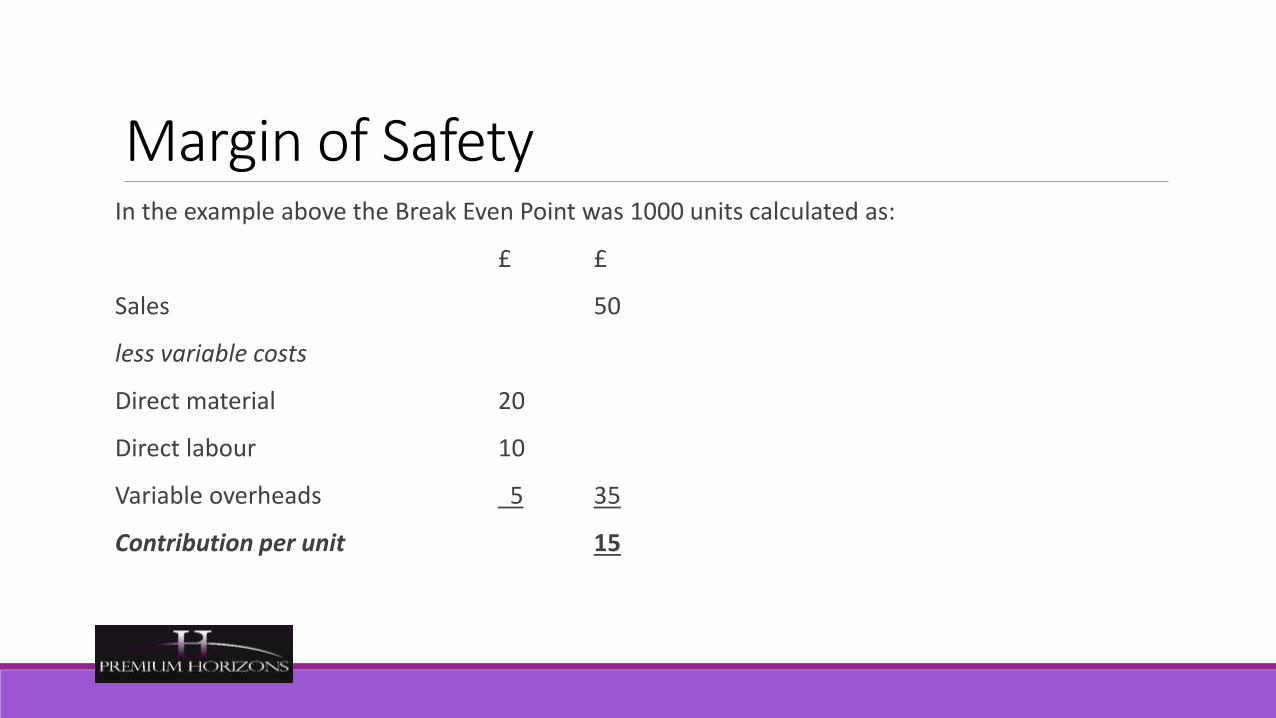
Margin of SafetyIn the example above the Break Even Point was 1000 units calculated as:
£ £
Sales 50
less variable costs
Direct material 20
Direct labour 10
Variable overheads 5 35
Contribution per unit 15

Margin of SafetyBreak-even point (units) = Total Fixed costs
Contribution per unit
£15,000 = 1,000 units£15
SensitivityWhat happens if Raw Material increases to £30 per unit, i.e. if Raw Material was a Sensitive Factor?

Margin of SafetyBreak-even point (units) = Total Fixed costs
Contribution per unit
£15,000 = 1,000 units£15

SensitivityIf Raw Material increases to £30 per unit,
Sales 50
less variable costs
Direct material 30
Direct labour 10
Variable overheads 5 45
Contribution per unit 5
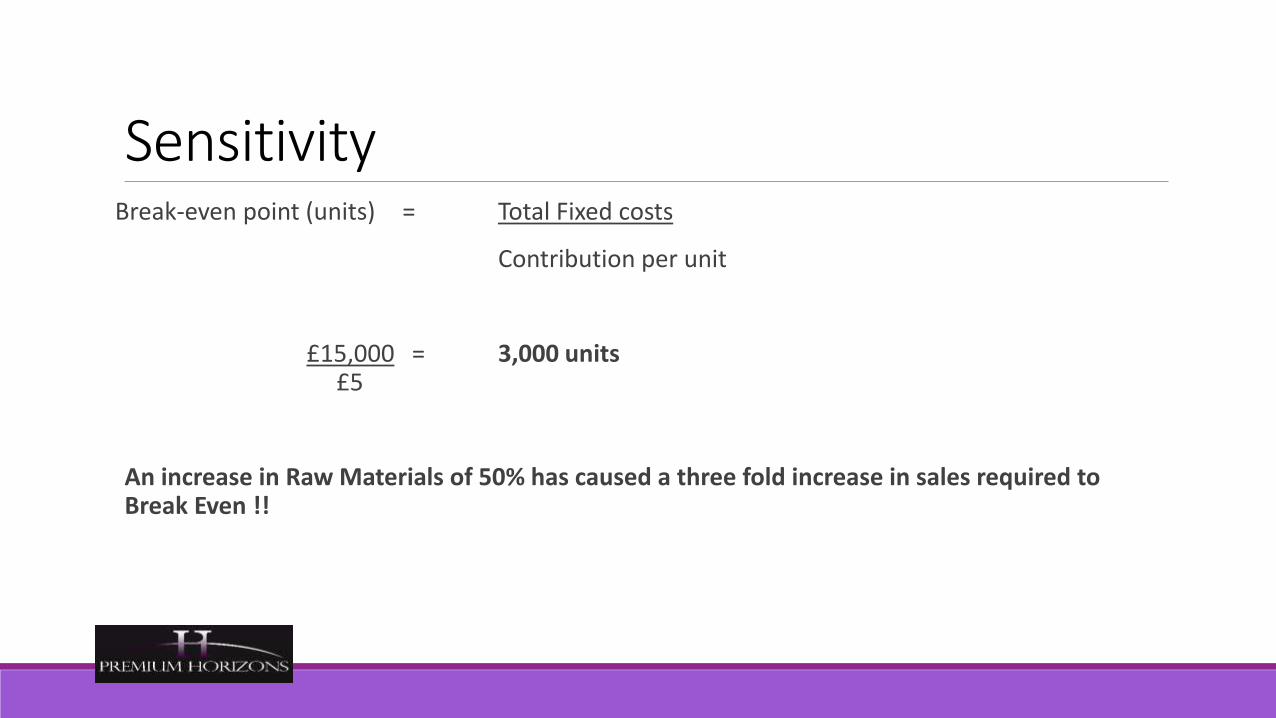
SensitivityBreak-even point (units) = Total Fixed costs
Contribution per unit
£15,000 = 3,000 units£5
An increase in Raw Materials of 50% has caused a three fold increase in sales required to Break Even !!

Sensitivity
So what should we do?
We appear very Sensitive to increases in Raw Materials
A 50% increase in Raw Material has caused a threefold increase in sales required to Break Even !!

Budgeting
Day Three

Discussion ExerciseWhat is a budget?

What are the purposes of Budgets?Budgets compel planning
◦ Formalising agreed objectives of the organisation through a budget preparation system can ensure that plans are achievable
◦ What resources are required to produce desired outputs?
◦ When will resources be needed?
What are the purposes of Budgets?Budgets communicate and co-ordinate
◦ All relevant personnel will be working towards the same ends
◦ Anticipated problems should be resolved and areas of potential confusion clarified during budget setting process

What are the purposes of Budgets?Goal congruence - all parts of the organization working towards the same ends

What are the purposes of Budgets?Budgets can be used to authorise
◦ Once agreed, budget can become authority to follow a course of action or spend money
◦ Further “permissions” unnecessary
What are the purposes of Budgets?Budgets can be used to monitor and control
◦ Management is able to monitor actual results against the budget
◦ “Where we are” versus “where we want to be”
◦ Corrective action is possible

What are the purposes of Budgets?Budgets can be used to motivate
◦ Can be part of an organisations techniques for motivating and rewarding staff
◦ However – must be perceived as “fair and equitable”

Four basic rules about budgets• A budget is a plan for spending money to reach
specific goals within a certain time period1• Any budget or plan is only as good as the time,
effort, and information people put into it. 2• No budget or plan is perfect because none of us
can totally predict the future3• In order to reach the goals, all budgets and plans
must be monitored and changed as time goes on4
BudgetSet for specific periods of time (one or more budget periods)
Prepared within a framework of objectives (targets or goals) and policies, determined by senior management
For specific projects
Analyzed in the specific period of time that it takes the budget to last: the budget period
Can be for both the whole business and for various parts of the business
Essential elements in planning a viable budget
Line managers will ignore formally produced accounting information when they perceive it to be of little relevance to their tasks
Budgeting remains aconceptually simple exercisewhatever the size of theorganization involved or theapproach taken; it is thelogistics of the process, thepath toward credible figuresthat represents the sourceof difficulty.

Budgets in contextStrategic planning is the process of deciding on the goals of the organisation and the formulation of the broad strategies to be used in attaining these goals.
Management control is the process by which management assures that the organisation carries out its strategies
Operational or task control is the process of assuring that specific tasks are carried out effectively and efficiently

Types of BudgetingThree main methods
• Incremental Budgeting
• Zero-Based Budgeting
• Activity Based Budgeting

Incremental BudgetingTraditional method of budget preparation
Adjusts previous years budget/actuals to reflect new situations
◦ Increases in costs
◦ Increases in prices
◦ Costs of additional activities
◦ Reductions caused by ceasing activities
Can be prepared quickly and with little fuss
But
Incremental budgeting can mean activities are not examined fully

Incremental Budgeting – ExampleQuenchit Ltd is a water bottling company
Transport costs for last year amounted to £120,000.
Planned expansion is expected to result in £10,000 additional transport costs (estimated at current prices)
Inflation is expected to be 3%
The transport budget for next year could be based on:
£120,000 + £10,000 = £130,000 to allow for expansion
then £130,000 x 103% = £133,900 to allow for inflation

Incremental BudgetingAdvantages
◦ Budget is stable and change is gradual and planned
◦ Managers can operate their departments on a consistent basis
◦ The system is relatively simple to operate and easy to understand
◦ Conflicts should be avoided if departments can be seen to be treated equitably
◦ Impact of change is readily apparent
Disadvantages
◦ Assumes all activities will continue in the same manner as before
◦ No incentive to reduce costs
◦ Budgets may become out of date and no longer relate to operations
◦ Resource priorities may have changed since original budget
◦ Budgetary slack may accumulate from previous over-estimates

Zero-Based BudgetingDeveloped in the 1970’s with a view to eliminating some of the problems associated with incremental budgeting
Opposite view to incremental budgeting
Budget starts from a base of “zero” each period
Budgets for proposed activities are then put forward, assessed and prioritised, them allocated funds in order of priority
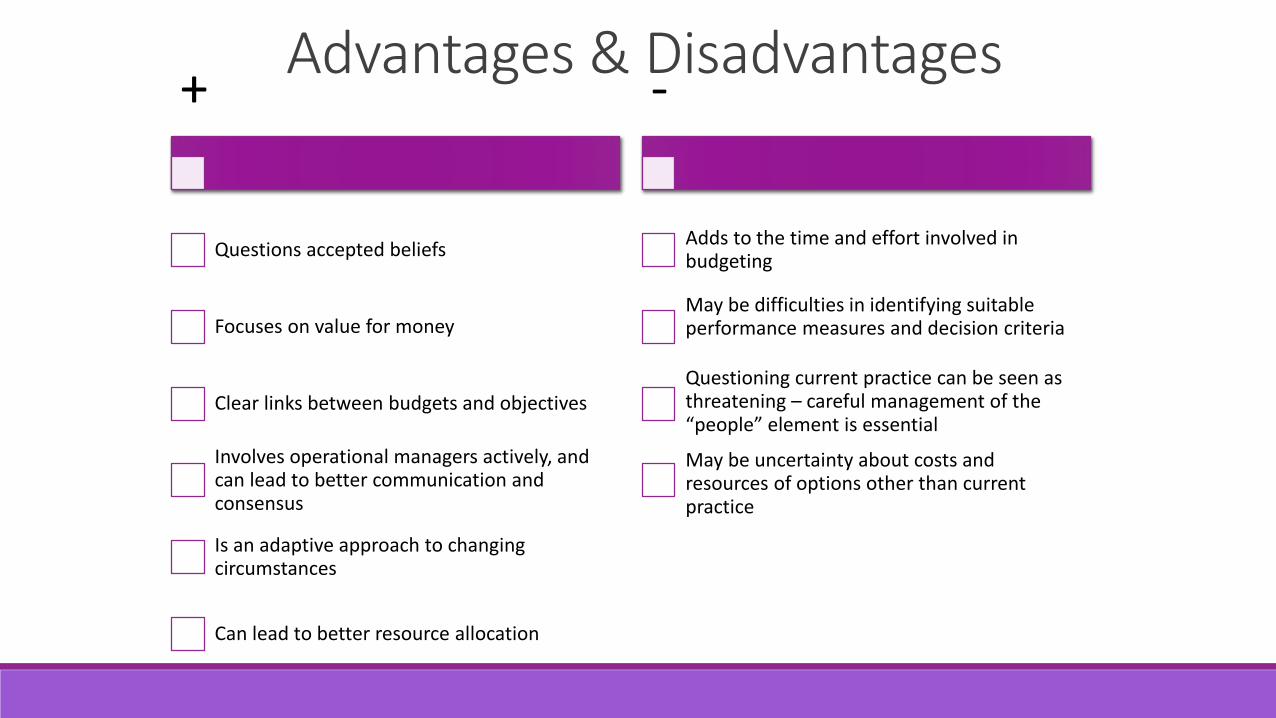
Advantages & Disadvantages+
Questions accepted beliefs
Focuses on value for money
Clear links between budgets and objectives
Involves operational managers actively, and can lead to better communication and consensus
Is an adaptive approach to changing circumstances
Can lead to better resource allocation
-
Adds to the time and effort involved in budgeting
May be difficulties in identifying suitable performance measures and decision criteria
Questioning current practice can be seen as threatening – careful management of the “people” element is essential
May be uncertainty about costs and resources of options other than current practice
ExerciseBarry Stuart runs the Airfield Services activity at the City Airport. He has been asked to prepare a forecast for runway maintenance expenditure for the current financial year.
The latest management accounts show that actual maintenance costs for the first six months were £117,000. The budgeted costs for the same period were £131,000. The full year budget is £265,000.
Barry anticipates that an unexpected (non-budgeted) provision will be required for additional maintenance costs of £27,000 in the last month of the financial year.
What forecast should Barry submit for runway maintenance expenditurefor the full financial year?

Activity Based BudgetingPlanning process linked to the objectives of the organisation
Use of well proven activity analysis techniques
Identification of cost improvement opportunities
Analysis of discretionary spending options and priority ranking
Establishment of performance targets for control
Integration with activity planning & accounting to provide effective control
A participative process to control and sustain continuous improvement

Putting the pieces together
Setting objectives
Analysing available resources
Negotiating to estimate budget components
Coordinating and reviewing components
Obtaining final approval
Distributing the approved budget

“Games Managers Play”Steele & Albright identified 5 types
Sandbagger – understated budget outcomes
Magician – cover up faults in the business
Lone Agent – claim special merit consideration
Visionary – often based on emotions rather than fact
Hostage Taker – potential danger if plans do not materialise

Why do Managers Play Games?Managerial game-playing can reflect a lack of skill and know-how
Indicative of deeper “flaws. E.g. poor “team players”, lack of focus
Highlight lack of clarity about goals and expectations
May be the product of corporate cultures and values
• Sales oriented businesses produce “lone agents” and “hostage takers”
• Finance centric businesses produce “sandbaggers” and “magicians”

Change the rulesGet it on the table
• Acknowledge human tendency to distort facts in their own favour
Paint a picture of “The Ideal”
• Create a profile of behaviours and values that ought to be exhibited
Deal positively with disruptive behaviour
• Be ready to respond appropriately
Put peer pressure to work
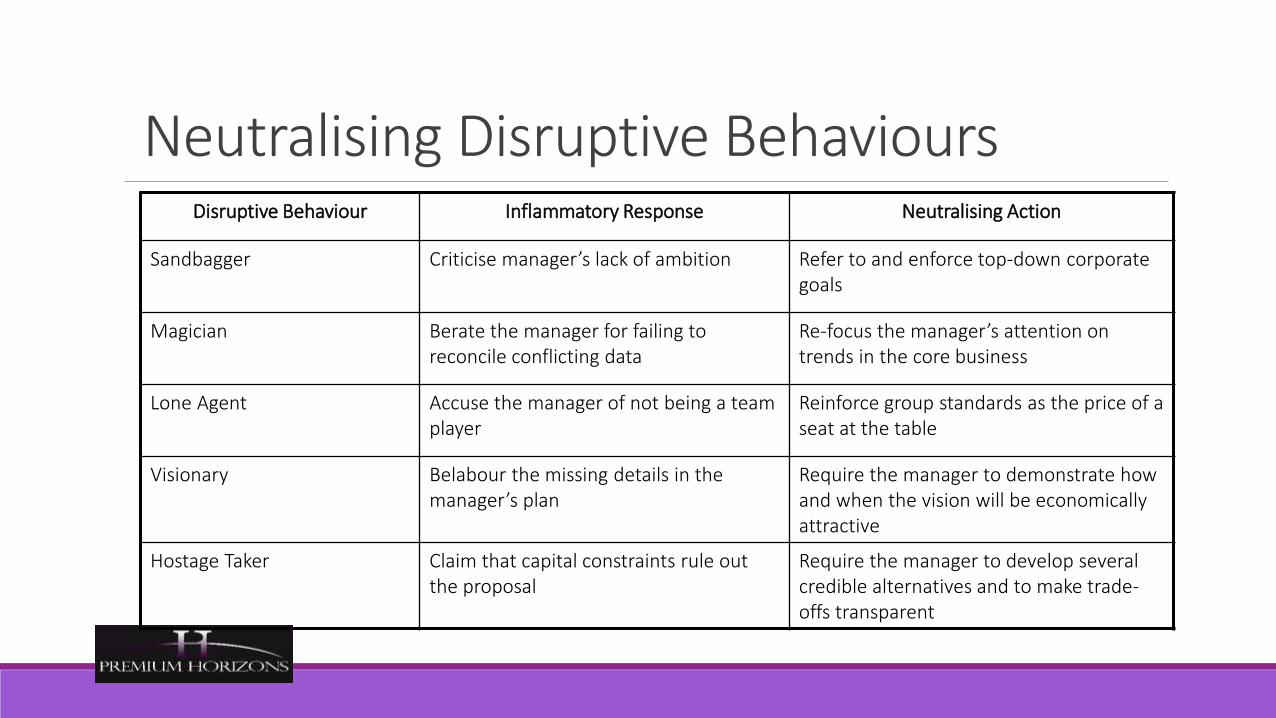
Neutralising Disruptive BehavioursDisruptive Behaviour Inflammatory Response Neutralising Action
Sandbagger Criticise manager’s lack of ambition Refer to and enforce top-down corporate goals
Magician Berate the manager for failing to reconcile conflicting data
Re-focus the manager’s attention on trends in the core business
Lone Agent Accuse the manager of not being a team player
Reinforce group standards as the price of a seat at the table
Visionary Belabour the missing details in the manager’s plan
Require the manager to demonstrate how and when the vision will be economically attractive
Hostage Taker Claim that capital constraints rule out the proposal
Require the manager to develop several credible alternatives and to make trade-offs transparent

Budget Psychology
Keep one eye on the numbers but another on manager behaviour
Dealing with bad behaviour makes budgets more productive
• Confirm competencies and behaviours required for a “performance-oriented culture”
• Links behaviours and values to strategy and capital-allocation decisions
Aligns “means” and “ends” of delivering business performance

Essential Elements of Budgets• Budgets are simple.... it's just the logistics that cause the problems.
• Data Collection
• Information disaggregation
• Line managers will ignore formally produced accounting information if they do not think it is relevant to their tasks

Budgeting Process Problems• Lack of support from line managers
• Lack of corporate control
• Poor use of manager's expertise
• It takes too much time
• No communication of assumptions

Putting the pieces together1. Setting objectives
2. Analysing available resources
3. Negotiating to estimate budget constraints
4. Co-ordinating and reviewing components
5. Obtaining final approval
6. Distributing the approved budget

Administering a budgetA comprehensive — or master — budget is a formal statement of management’s expectation regarding sales, expenses, volume, and other financial transactions for the coming period.
3 Elements
• pro forma income statement
• pro forma balance sheet,
• cash budget.

Administeringa budget
Operational Budget
Sales budget
Production budget
Direct Materials budget
Direct Labour budget
Factory overhead budget
Selling/Admin Expense budget
Pro forma income statement
Financial Budget
Cash budget
Pro forma balance sheet

Five steps in preparing a budget
Prepare a sales forecast
Determine expected
production volume
Estimate manufacturing
expenses & operating expenses
Determine cash flow &
other financial effects
Formulate projected financial
statements

The Budget

The Sales BudgetStarting point for Budgeting exercise – as far as numbers are concerned!
The sales budget reflects forecasted sales volume and is influenced by previous sales patterns, current and expected economic conditions, activities of competitors
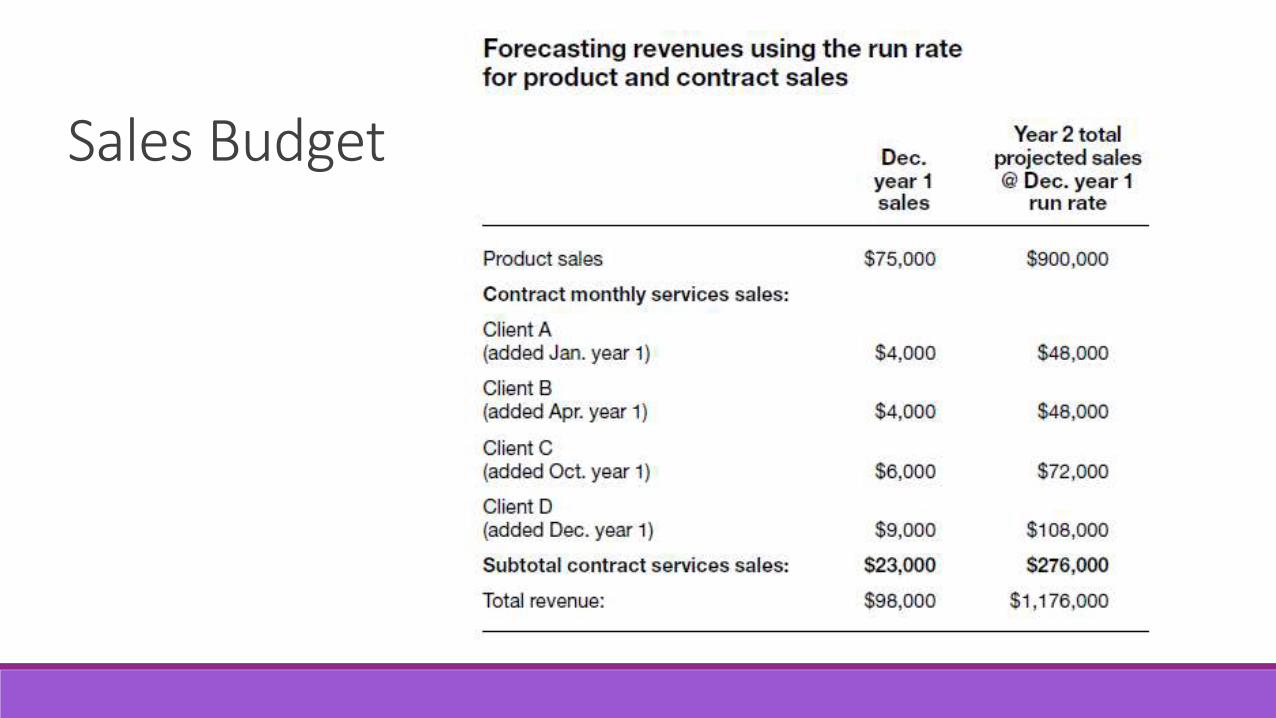
Sales Budget
The Sales BudgetWhat issues would we have with using the “run rate!”?

The Sales Budget

The Sales BudgetWhat issues would we have with using the “last year plus!”?
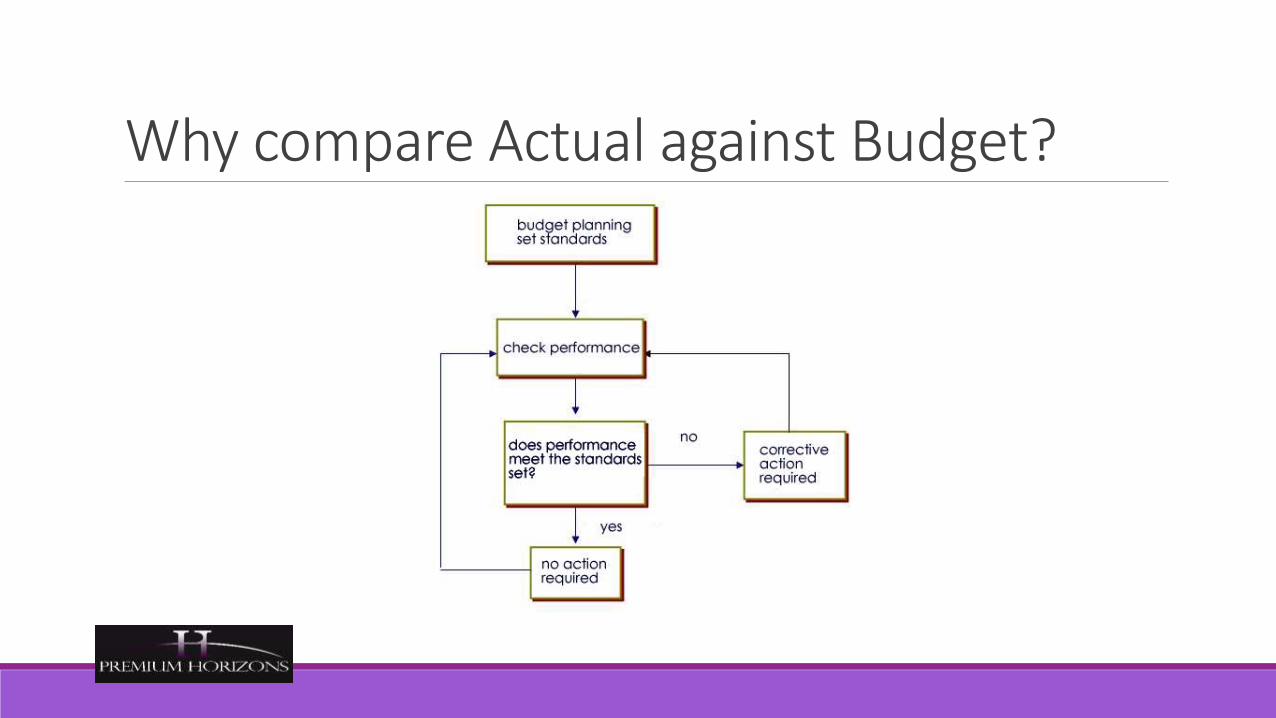
Why compare Actual against Budget?
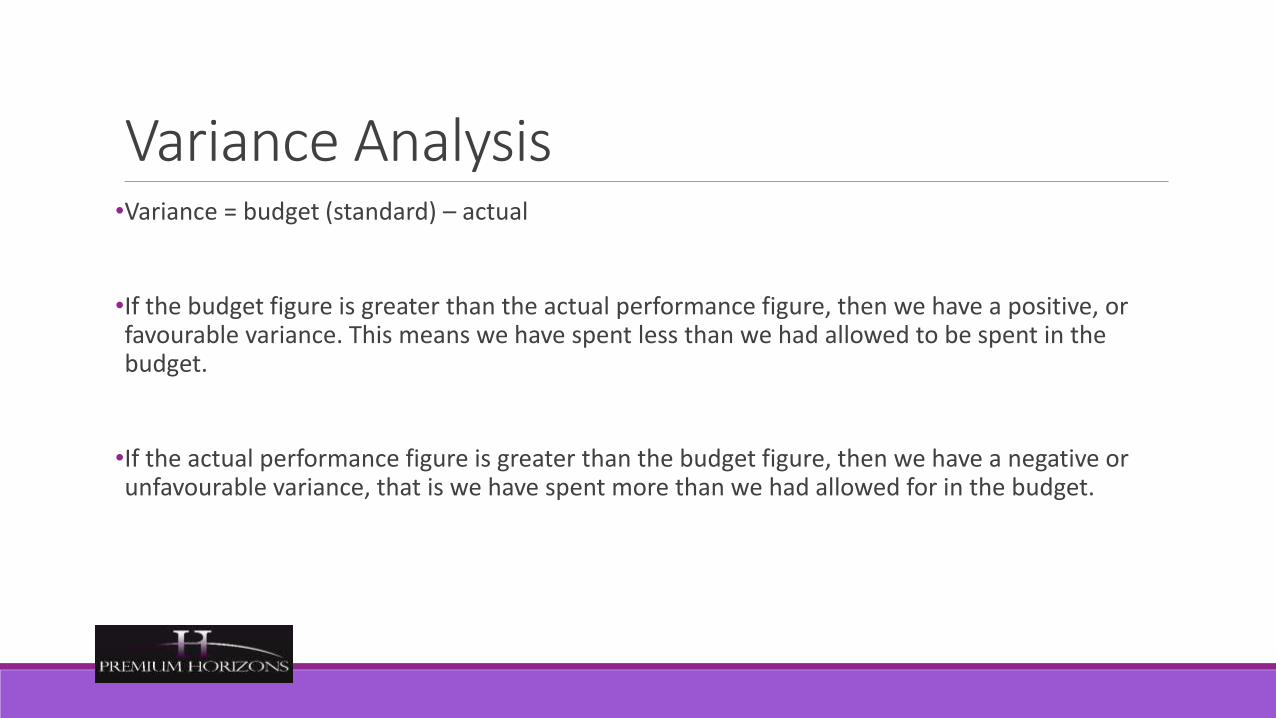
Variance Analysis•Variance = budget (standard) – actual
•If the budget figure is greater than the actual performance figure, then we have a positive, or favourable variance. This means we have spent less than we had allowed to be spent in the budget.
•If the actual performance figure is greater than the budget figure, then we have a negative or unfavourable variance, that is we have spent more than we had allowed for in the budget.

Variance Analysis•When we check performance against the standard, or the budget figure, and have identified a variance we need to do two things:
• Determine the size of the variance
• Decide on action to be taken to correct that variance

QuestionWhat could we do with a variance?
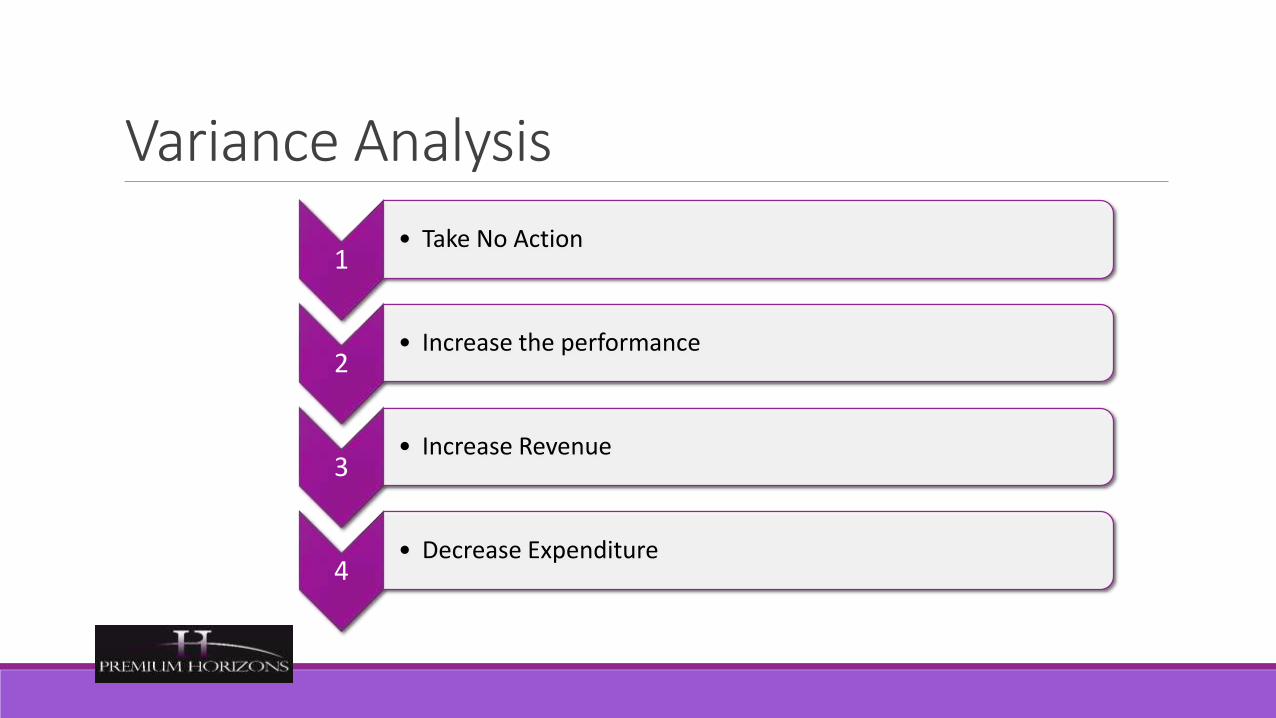
Variance Analysis
1• Take No Action
2• Increase the performance
3• Increase Revenue
4• Decrease Expenditure

VariancesAre variances bad?

Strauss Table CompanyStrauss Table Company manufactures tables for schools. The coming years operating budget is based on sales of 20,000 units at $100 per table.
Operating income is anticipated to be $120,000.
Budgeted variable costs are $64 per unit, while fixed costs total $600,000
Income last year was a surprising $354,000 on actual sales of 21,000 units at $104 each.
Actual variable costs were $60 per unit and fixed costs totalled $570,000.
Prepare a variance analysis report with both flexible-budget and sales volume variances

Strauss Table CompanyActual Results
Flexible Variances
FlexibleBudget
Sales Volume Variances
Static Budget
Units Sold
Sales
Variable Cost
CM
Fixed Cost
Profit

Management Control System

Organisational Planning and Control Framework
Planning is a long run activity used to plot the direction in which the firm should be moving
Control is the process by which we are able to
direct someone or something to behave in
the way we want

Management Control System• Ensures that managers have thought ahead about how they will utilize resources to achieve company
policy in their area.
Planning
• A regular reporting system can be established so that the extent to which plans are, or are not, being met is clear
Control
• Ensure that no one department is out of line with the action of others.
Co-ordination
• An aid to defining or clarifying the lines of horizontal or vertical communication within the enterprise.
Communication
• Budgets become useful tools for evaluating how the manager or department is performing.
Performance evaluation
• Motivates managers to strive towards budget expectations.
Motivation
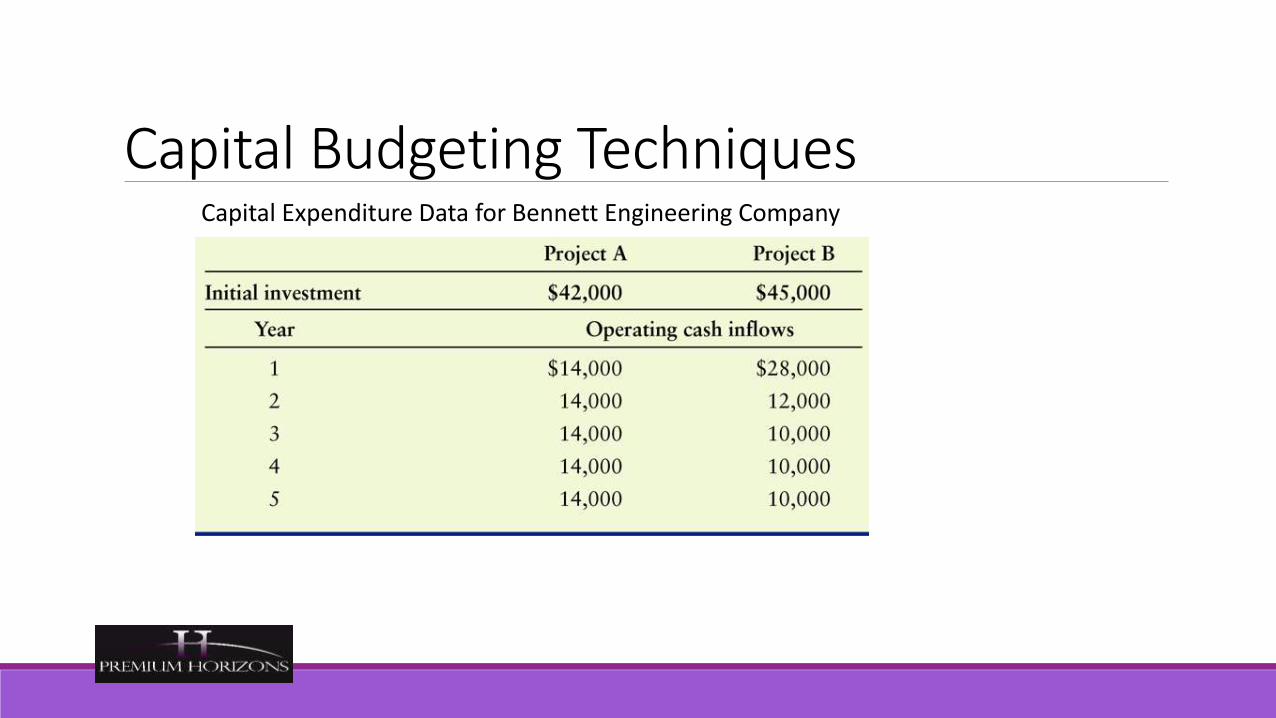
Capital Budgeting TechniquesCapital Expenditure Data for Bennett Engineering Company

Capital Budgeting TechniquesBennett Engineering Company’s Projects A and B

Payback PeriodThe payback method simply measures how long (in years and/or months) it takes to recover the initial investment.
The maximum acceptable payback period is determined by management.
If the payback period is less than the maximum acceptable payback period, accept the project.
If the payback period is greater than the maximum acceptable payback period, reject the project.

Pros and Cons of Payback PeriodsThe payback method is widely used by large firms to evaluate small projects and by small firms to evaluate most projects.
It is simple, intuitive, and considers cash flows rather than accounting profits.
It also gives implicit consideration to the timing of cash flows and is widely used as a supplement to other methods such as Net Present Value and Internal Rate of Return.

Pros and Cons of Payback PeriodOne major weakness of the payback method is that the appropriate payback period is a subjectively determined number.
It also fails to consider the principle of wealth maximization because it is not based on discounted cash flows and thus provides no indication as to whether a project adds to firm value.
Thus, payback fails to fully consider the time value of money.
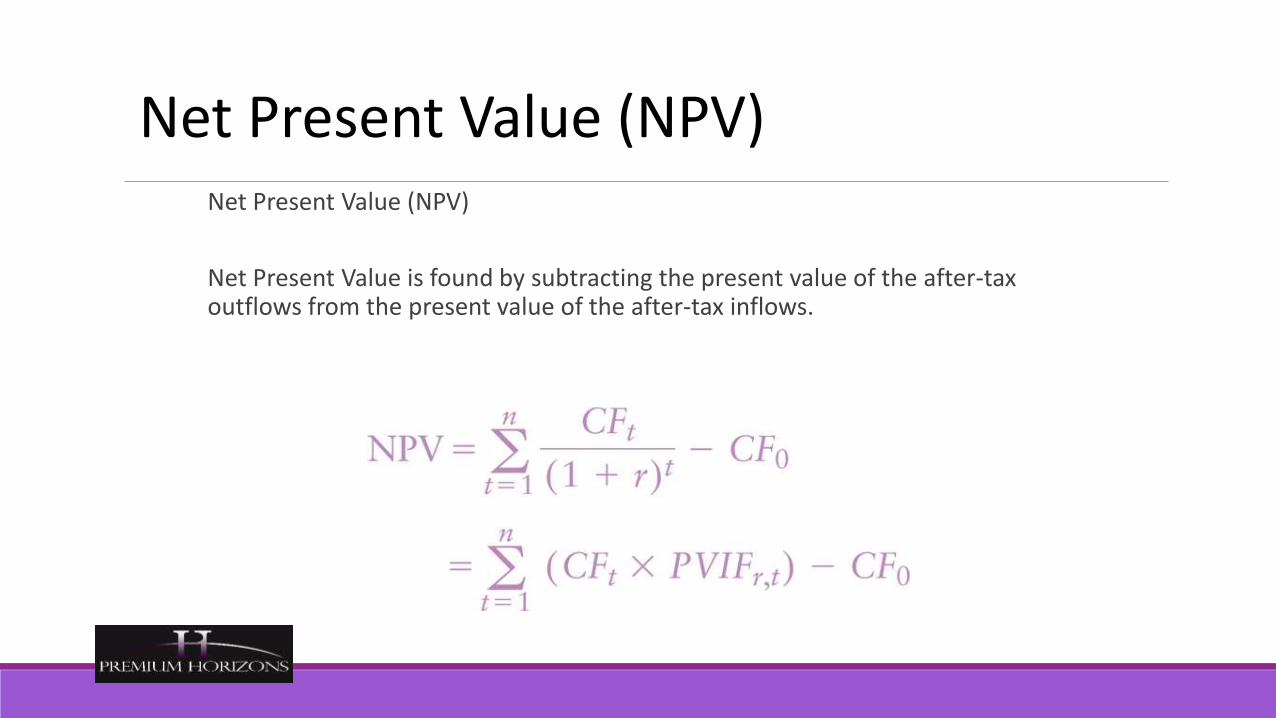
Net Present Value (NPV)
Net Present Value is found by subtracting the present value of the after-tax outflows from the present value of the after-tax inflows.
Net Present Value (NPV)

Decision Criteria
If NPV > 0, accept the project
If NPV < 0, reject the project
If NPV = 0, technically indifferent
Net Present Value (NPV)Net Present Value (NPV):
Net Present Value is found by subtracting the present value of the after-tax outflows from the present value of the after-tax inflows.

Using the Bennett Engineering Company data, assume the firm has a 10%
cost of capital.
Based on the given cash flows and cost of capital (required return), the
NPV can be calculated as follows.
Net Present Value (NPV)

Net Present Value (NPV)Calculation of NPVs for Bennett Engineering Company’s Capital Expenditure Alternatives

Net Present Value (NPV)

Internal Rate of Return (IRR)The Internal Rate of Return (IRR) is the discount rate that will equate the present value of the outflows with the present value of the inflows.
The IRR is the project’s intrinsic rate of return.

Decision Criteria
If IRR > cost of capital, accept the project
If IRR < cost of capital, reject the project
If IRR = cost of capital, technically indifferent
Internal Rate of Return (IRR)The Internal Rate of Return (IRR) is the discount rate that will equate the present value of the outflows with the present value of the inflows.
The IRR is the project’s intrinsic rate of return.

Calculation of IRR
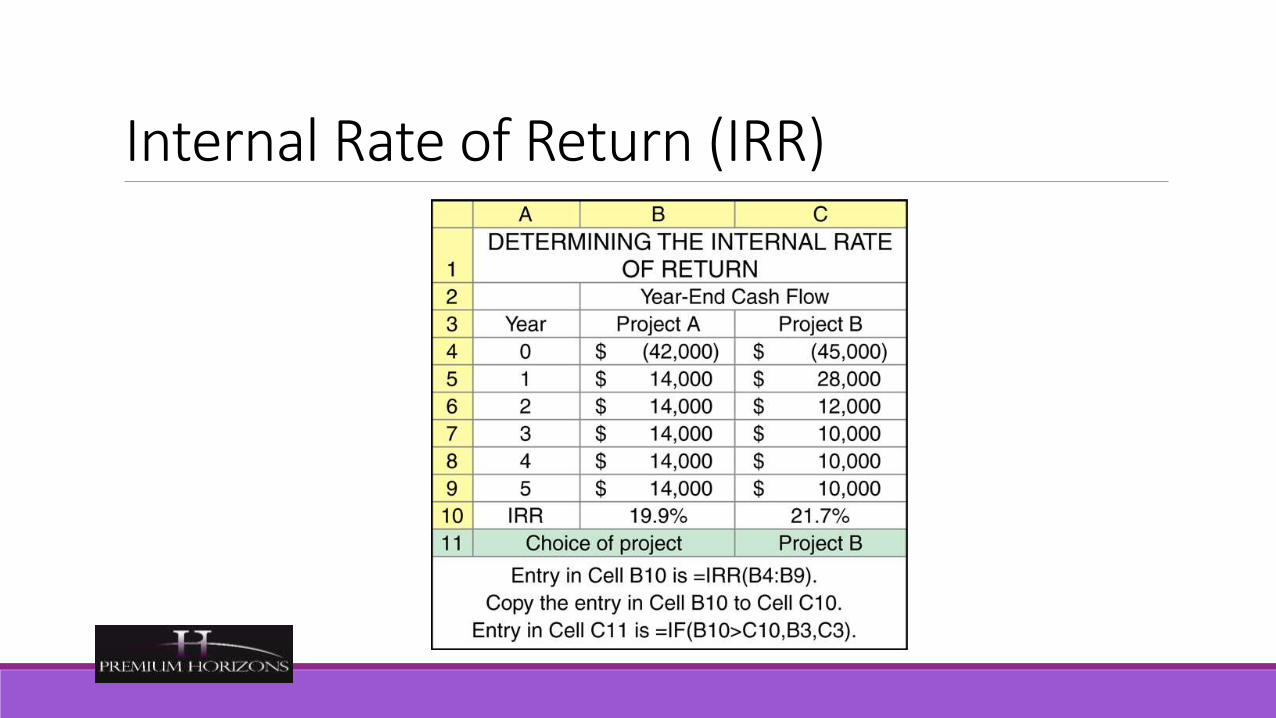
Internal Rate of Return (IRR)
To prepare NPV profiles for Bennett Company’s projects A and B, the
first step is to develop a number of discount rate-NPV coordinates and
then graph them as shown in the following table and figure.
Net Present Value ProfilesNPV Profiles are graphs that depict project NPVs for various discount rates and provide an excellent means of making comparisons between projects.
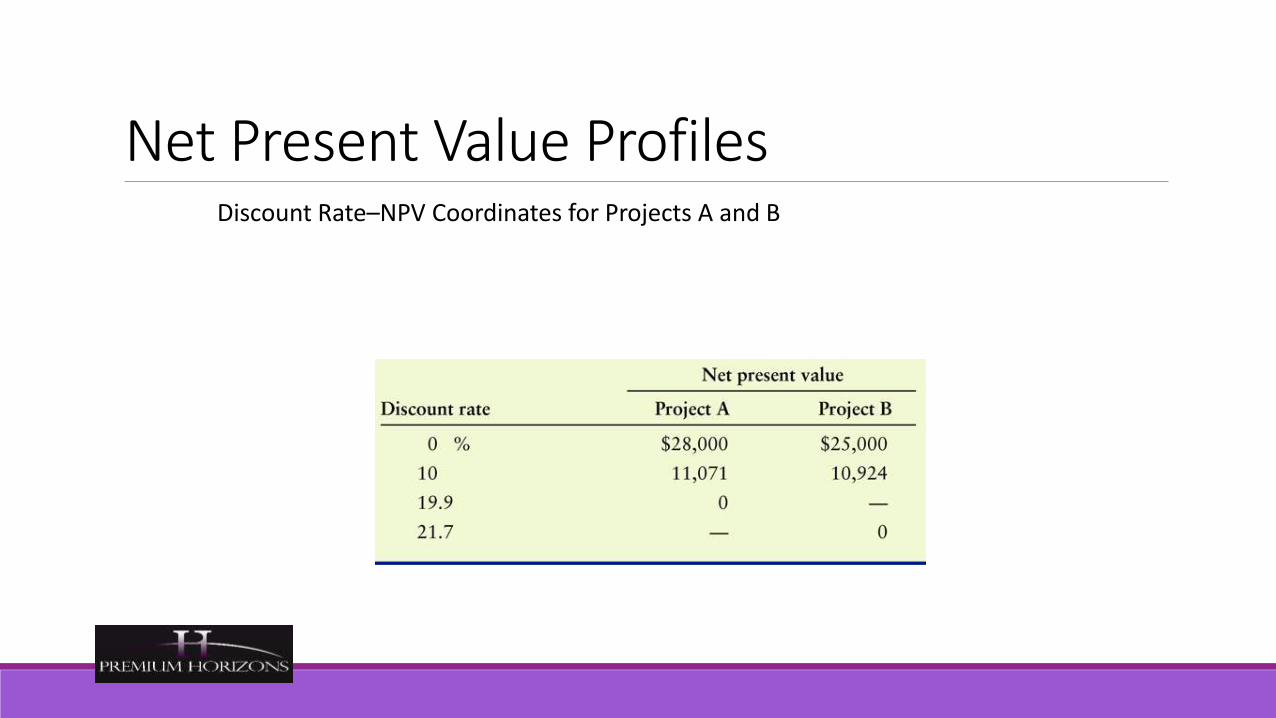
Net Present Value ProfilesDiscount Rate–NPV Coordinates for Projects A and B
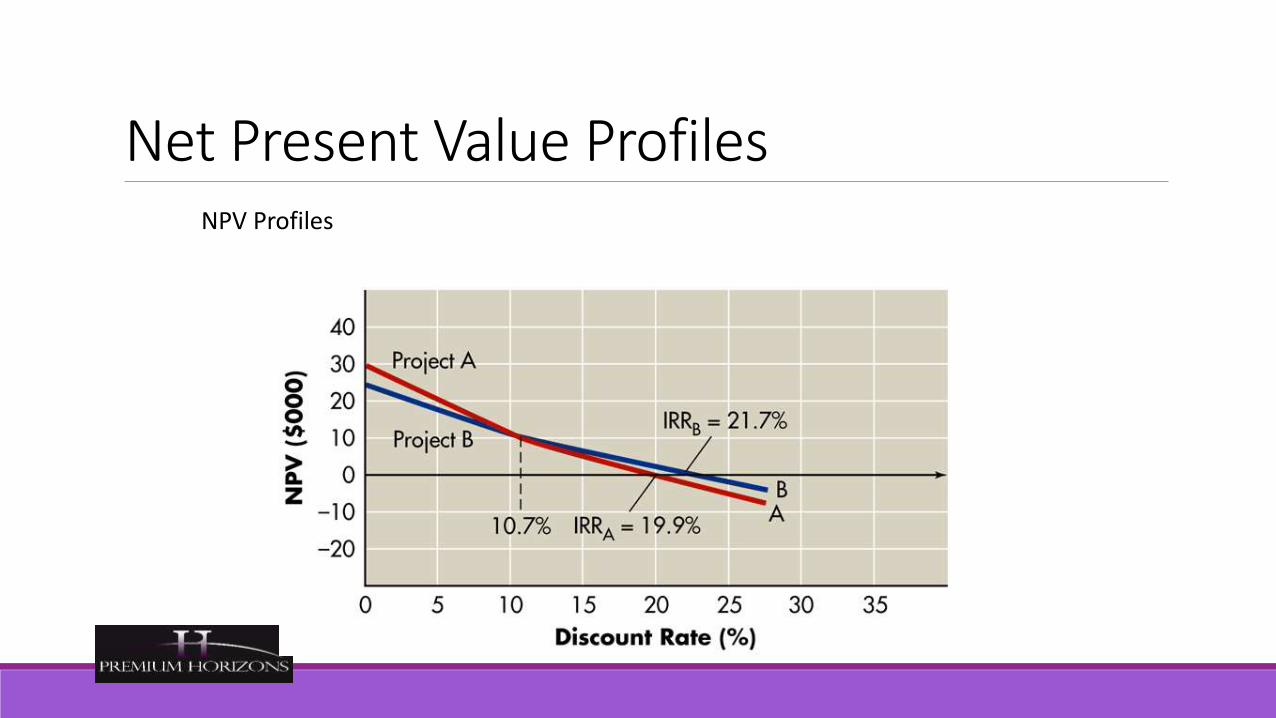
Net Present Value ProfilesNPV Profiles

Conflicting RankingsConflicting rankings between two or more projects using NPV and IRR sometimes occurs because of differences in the timing and magnitude of cash flows.
This underlying cause of conflicting rankings is the implicit assumption concerning the reinvestment of intermediate cash inflows—cash inflows received prior to the termination of the project.
NPV assumes intermediate cash flows are reinvested at the cost of capital, while IRR assumes that they are reinvested at the IRR.
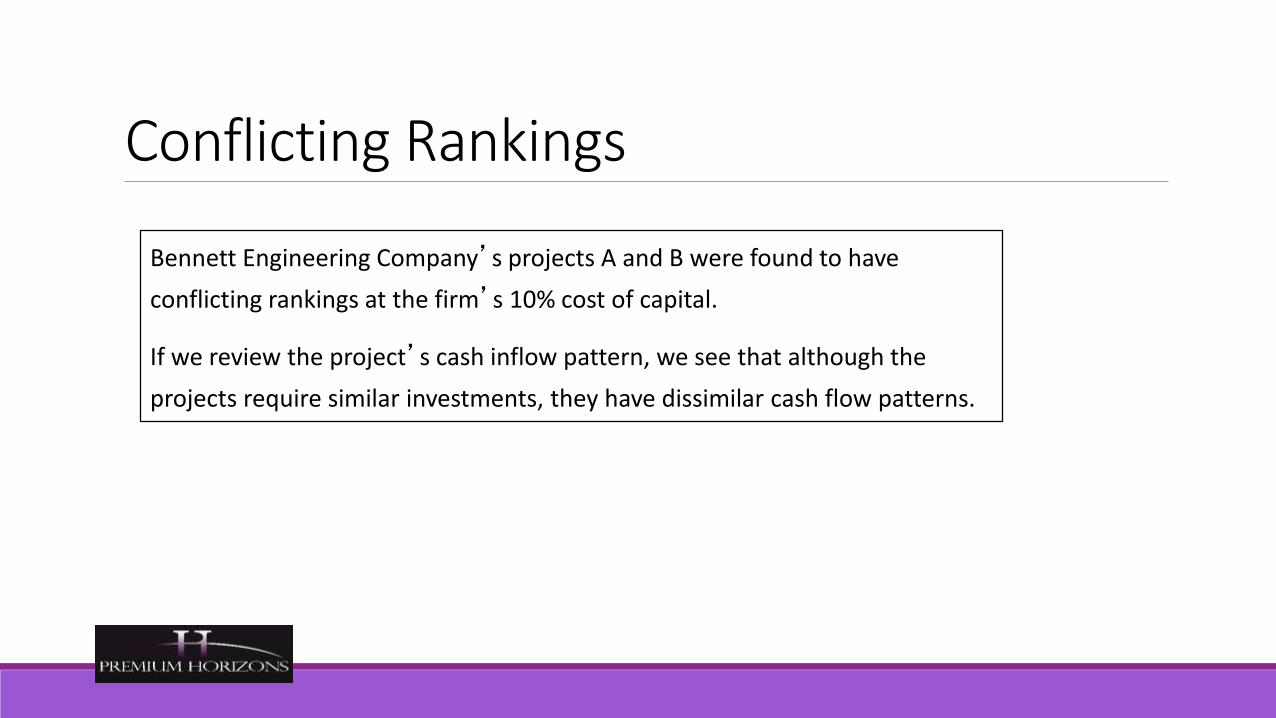
Bennett Engineering Company’s projects A and B were found to have
conflicting rankings at the firm’s 10% cost of capital.
If we review the project’s cash inflow pattern, we see that although the
projects require similar investments, they have dissimilar cash flow patterns.
Conflicting Rankings
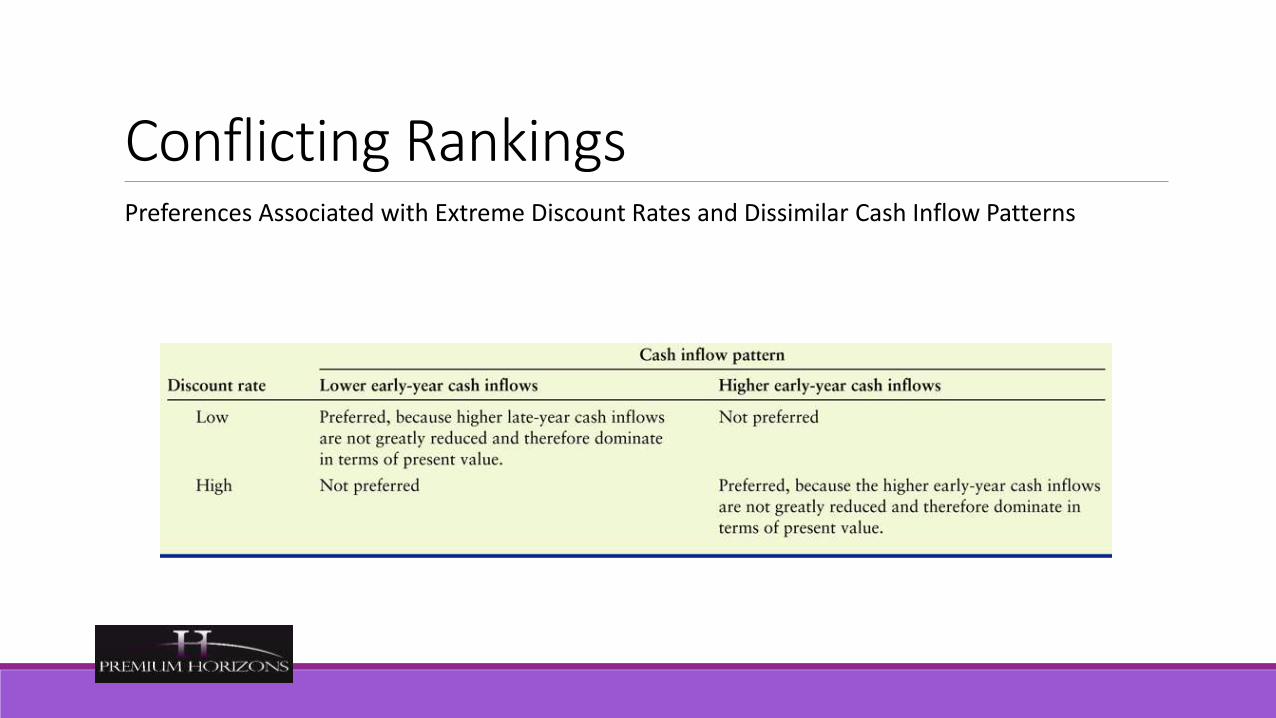
Conflicting RankingsPreferences Associated with Extreme Discount Rates and Dissimilar Cash Inflow Patterns
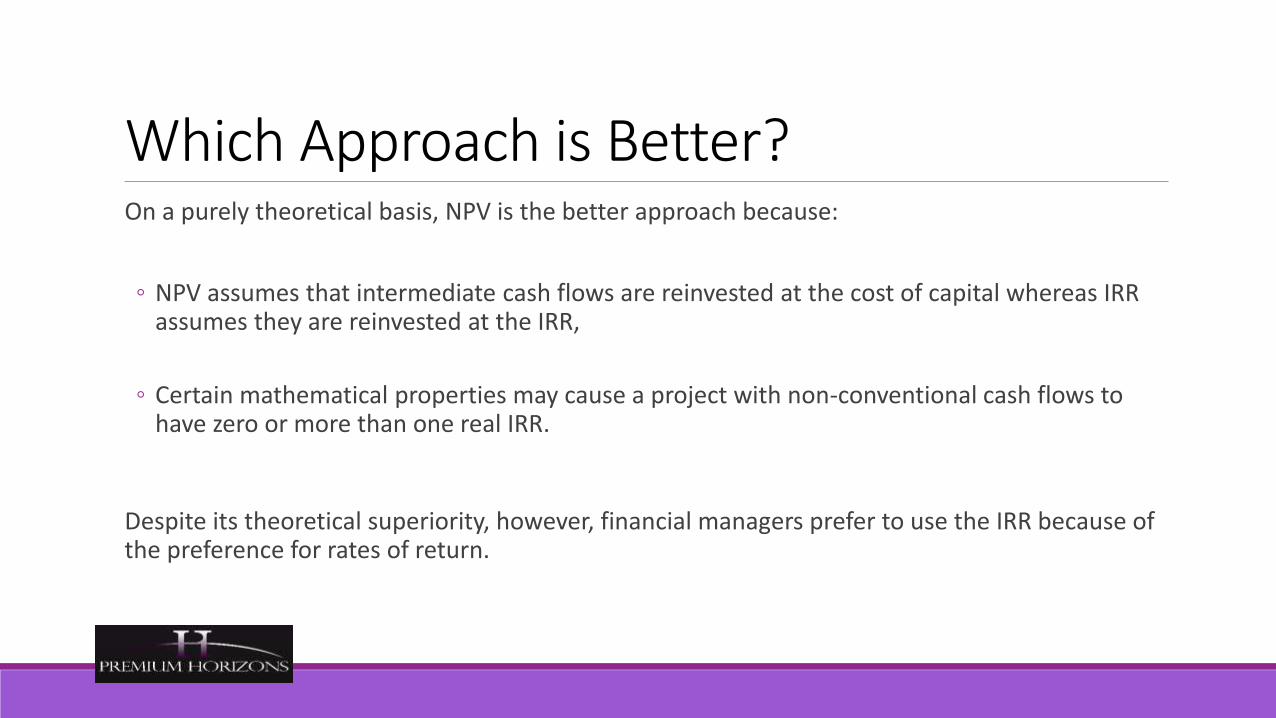
Which Approach is Better?On a purely theoretical basis, NPV is the better approach because:
◦ NPV assumes that intermediate cash flows are reinvested at the cost of capital whereas IRR assumes they are reinvested at the IRR,
◦ Certain mathematical properties may cause a project with non-conventional cash flows to have zero or more than one real IRR.
Despite its theoretical superiority, however, financial managers prefer to use the IRR because of the preference for rates of return.
Recognizing Real OptionsReal options are opportunities that are embedded in capital projects that enable managers to alter their cash flows and risk in a way that affects project acceptability (NPV)
Real options are also sometimes referred to as strategic options.
Some of the more common types of real options are described in the table on the following slide.

Recognizing Real Options

Assume that a strategic analysis of Bennett Engineering Company’s projects
A and B finds no real options embedded in Project A but two real options
embedded
in B:
1. During it’s first two years, B would have downtime that results in unused
production capacity that could be used to perform contract manufacturing;
2. Project B’s computerized control system could control two other machines,
thereby reducing labor costs.
NPVstrategic = NPVtraditional + Value of Real Options
Recognizing Real Options

Bennett’s management estimated the NPV of the contract manufacturing option to be $1,500
and the NPV of the computer control sharing option to be $2,000. Furthermore, they felt there
was a 60% chance that the contract manufacturing option would be exercised and a 30%
chance that the computer control sharing option would be exercised.
Value of Real Options for B = (60% x $1,500) + (30% x $2,000)
$900 + $600 = $1,500
NPVstrategic = $10,924 + $1,500 = $12,424
NPVA = $12,424; NPVB = $11,071; Now choose A over B.
Recognizing Real Options
Capital RationingFirm’s often operate under conditions of capital rationing—they have more acceptable independent projects than they can fund.
In theory, capital rationing should not exist—firms should accept all projects that have positive NPVs.
However, research has found that management internally imposes capital expenditure constraints to avoid what it deems to be “excessive” levels of new financing, particularly debt.
Thus, the objective of capital rationing is to select the group of projects within the firm’s budget that provides the highest overall NPV or IRR.

Tate Company, a fast growing plastics company with a cost of capital of 10%, is confronted with
six projects competing for its fixed budget of $250,000. The initial investment and IRR for each
project are shown below:
Capital Rationing

Capital Rationing: IRR ApproachInvestment Opportunities Schedule
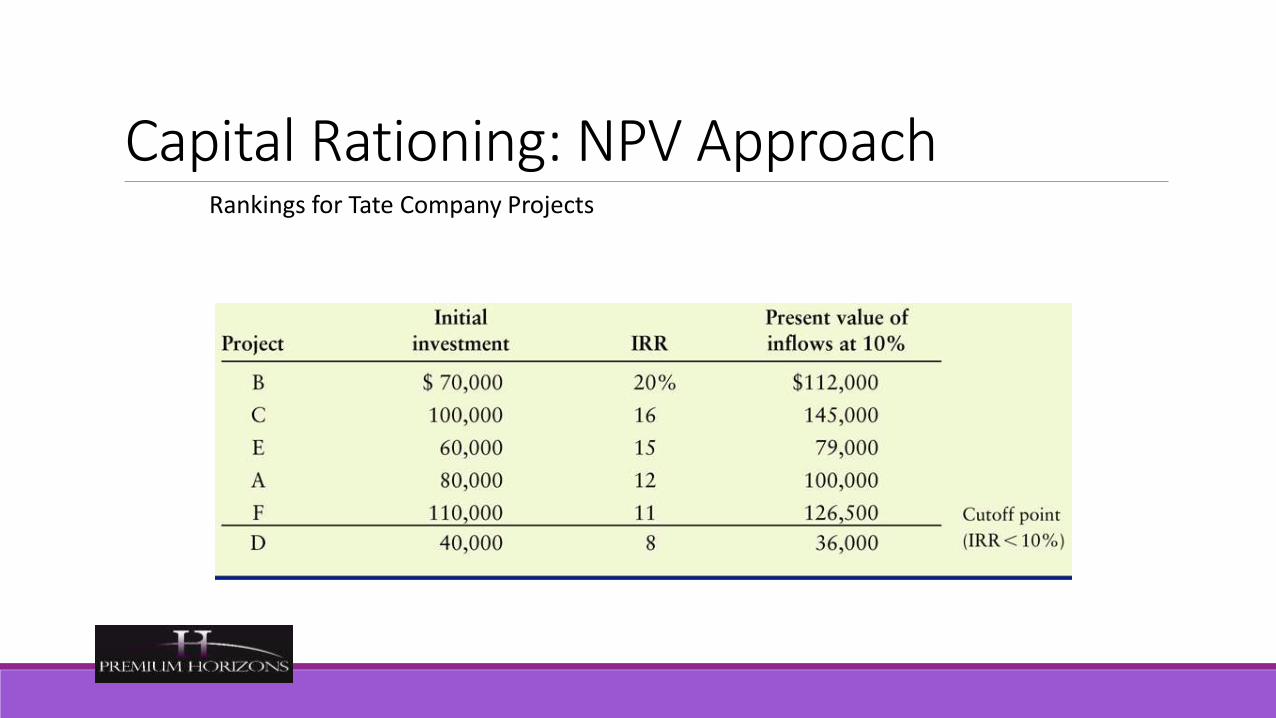
Capital Rationing: NPV ApproachRankings for Tate Company Projects
Introduction to Risk in Capital BudgetingThus far in our exploration of capital budgeting, all projects were assumed to be equally risky.
The acceptance of any project would not alter the firm’s overall risk.
In actuality, these situations are rare—project cash flows typically have different levels of risk and the acceptance of a project does affect the firm’s overall risk.
Behavioral Approaches for Dealing with RiskIn the context of the capital budgeting projects discussed here, risk results almost entirely from the uncertainty about future cash inflows, because the initial cash outflow is generally known.
These risks result from a variety of factors including uncertainty about future revenues, expenditures and taxes.
Therefore, to asses the risk of a potential project, the analyst needs to evaluate the riskiness of the cash inflows.
Scenario AnalysisScenario analysis is a behavioral approach similar to sensitivity analysis but is broader in scope.
This method evaluates the impact on the firm’s return of simultaneous changes in a number of variables, such as cash inflows, outflows, and the cost of capital.
NPV is then calculated under each different set of variable assumptions.
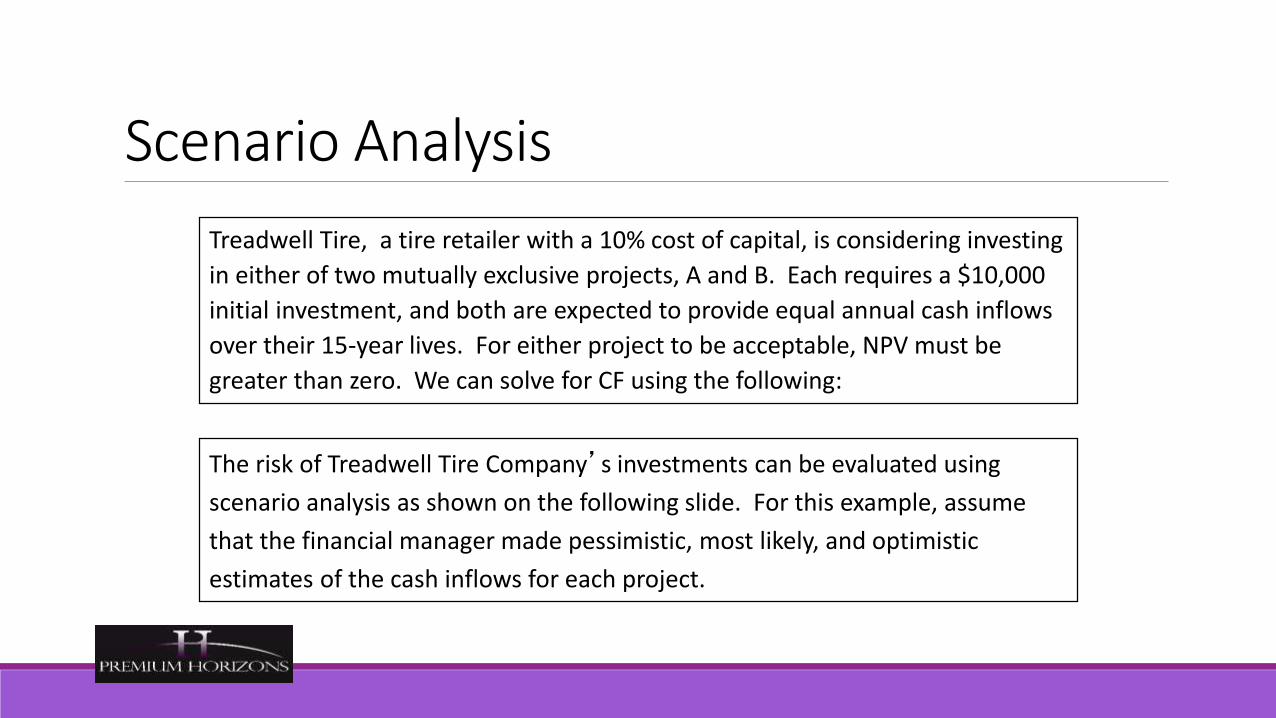
Treadwell Tire, a tire retailer with a 10% cost of capital, is considering investing
in either of two mutually exclusive projects, A and B. Each requires a $10,000
initial investment, and both are expected to provide equal annual cash inflows
over their 15-year lives. For either project to be acceptable, NPV must be
greater than zero. We can solve for CF using the following:
Scenario Analysis
The risk of Treadwell Tire Company’s investments can be evaluated using
scenario analysis as shown on the following slide. For this example, assume
that the financial manager made pessimistic, most likely, and optimistic
estimates of the cash inflows for each project.

Risk & Cash InflowsScenario Analysis of Treadwell’sProjects A and B

Decision Tree for NPV
Decision Trees

SimulationSimulation is a statistically-based behavioral approach that applies predetermined probability distributions and random numbers to estimate risky outcomes.
The use of computers has made the use of simulation economically feasible, and the resulting output provides an excellent basis for decision-making.

Decision Trees
NPV Simulation
International Risk ConsiderationsExchange rate risk is the risk that an unexpected change in the exchange rate will reduce NPV of a project’s cash flows.
In the short term, much of this risk can be hedged by using financial instruments such as foreign currency futures and options.
Long-term exchange rate risk can best be minimized by financing the project in whole or in part in the local currency.

International Risk ConsiderationsPolitical risk is much harder to protect against once a project is implemented.
A foreign government can block repatriation of profits and even seize the firm’s assets.
Accounting for these risks can be accomplished by adjusting the rate used to discount cash flows—or better—by adjusting the project’s cash flows.

Since a great deal of cross-border trade among MNCs takes place between subsidiaries, it is also important to determine the net incremental impact of a project’s cash flows overall.
As a result, it is important to approach international capital projects from a strategic viewpoint rather than from a strictly financial perspective.
International Risk Considerations

Risk-Adjusted Discount RatesRisk-adjusted discount rates are rates of return that must be earned on given projects to compensate the firm’s owners adequately—that is, to maintain or improve the firm’s share price.
The higher the risk of a project, the higher the RADR—and thus the lower a project’s NPV.
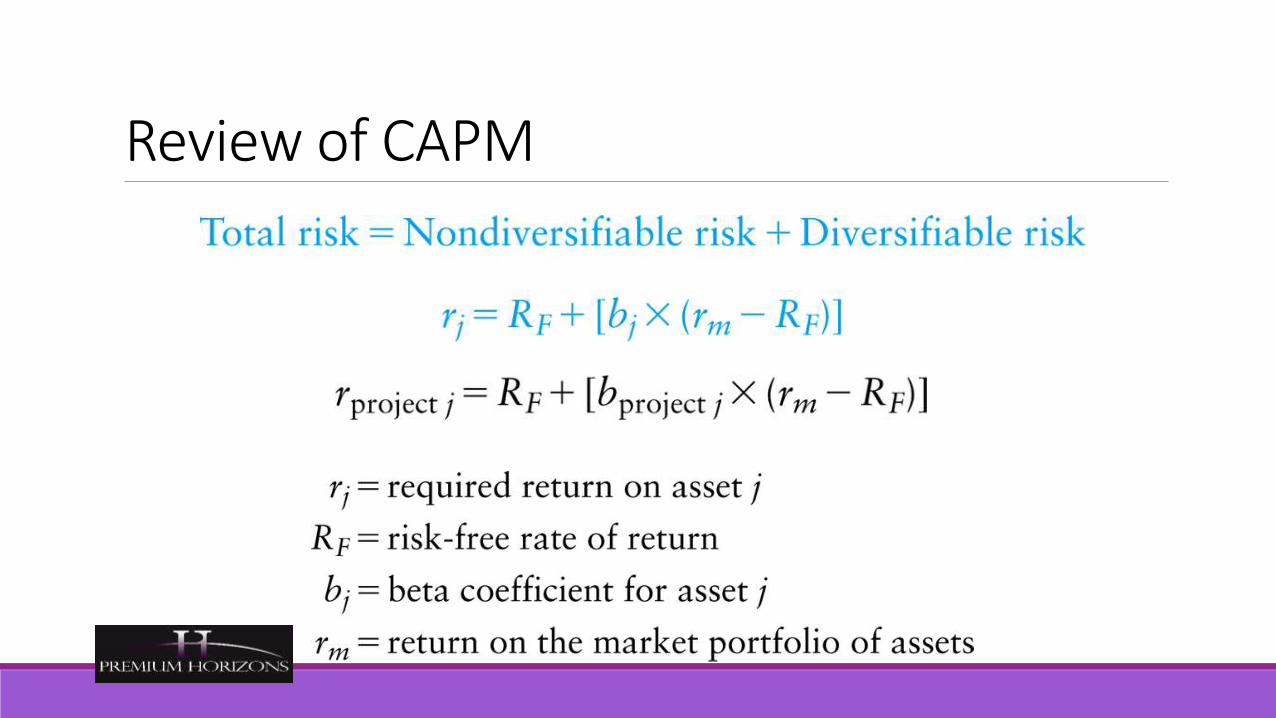
Review of CAPM

Bennett Engineering Company wishes to apply the Risk-Adjusted Discount
Rate (RADR) approach to determine whether to implement Project A or B.
In addition to the data presented earlier, Bennett’s management assigned
a “risk index” of 1.6 to project A and 1.0 to project B as indicated in the
following table. The required rates of return associated with these indexes
are then applied as the discount rates to the two projects to determine
NPV.
Applying RADRs
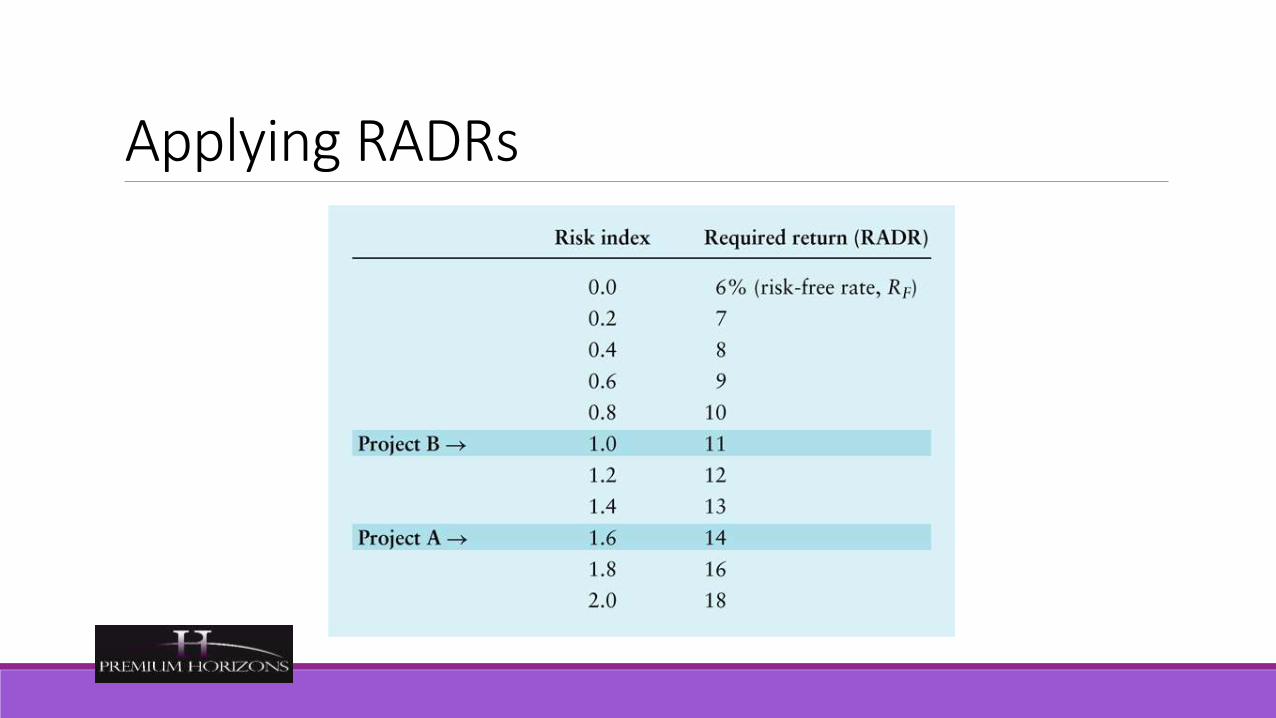
Applying RADRs

Calculation of NPVs for Bennett Company’s Capital Expenditure Alternatives Using RADRs
Applying RADRs

Applying RADRs

Bennett Engineering Company’s Risk Classes and RADRs
Applying RADRs
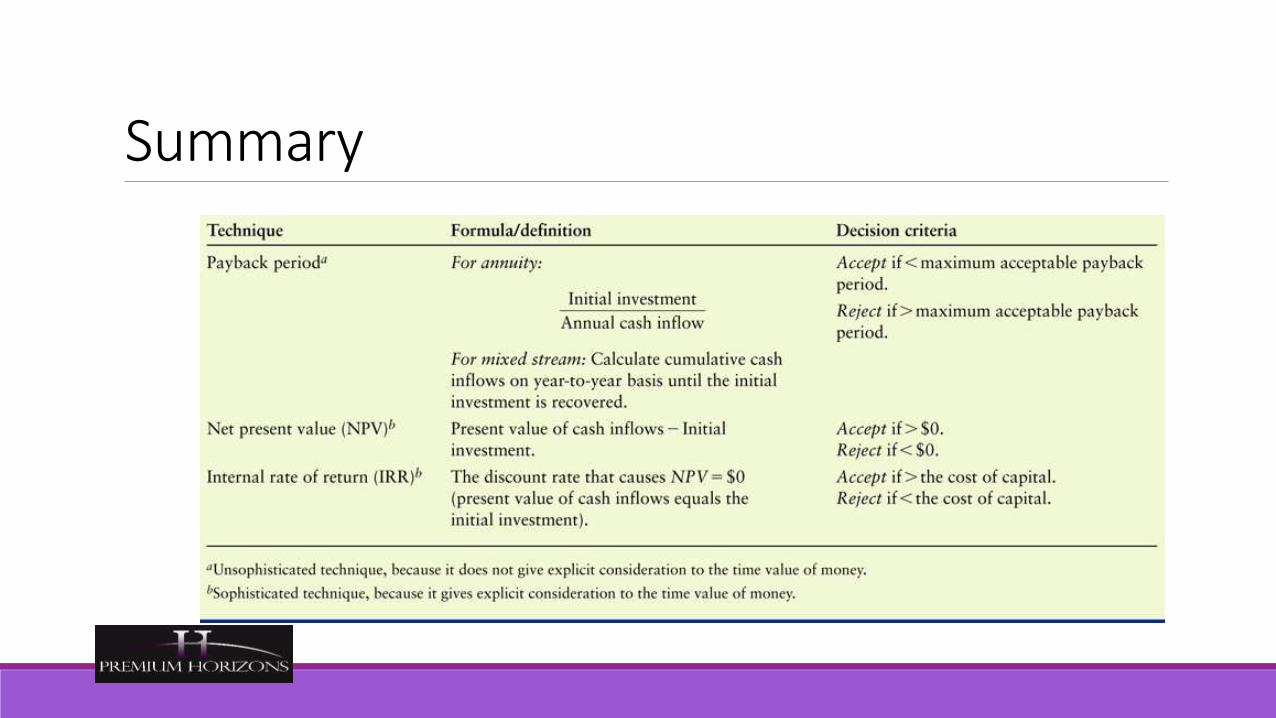
Summary
Financial and Non-financial MeasuresAlmost all organizations use a combination of financial and non-financial performance measures rather than relying exclusively on either type.
Control may be exercised by observation of workers.

Balanced Scorecard Hall of Fame
Saatchi & Saatchi
+ $2b
ATT Canada
+ $7b
Chemical Bank
• 99% Merged Target
Asset Retention
UPS
Southern GardenWells Fargo
Cigna
+ $3b
Brown & Root
• #1 in growth &
profitability
City of Charlotte Duke Children’s
Mobil
• Last to first
• Cash flow +$1.2b
• ROI 6% --> 16%
Hilton Hotels
• Least Cost Producer
3 years
• Customer Satisfaction
• Market Revenue
Index
• Revenues 9%
• Net Income 33%
• # Customers 450%
• Best Online Bank
• Customer Satisfaction =
70%
• Public Official Award
• Customer Satisfaction #1
• Cost/Case 33%
3 years
2-5 years 3 years
3-5 years 3 years
3 years 2 years
3 years 3 years
2-5 years
2 years

STRATEGY
HUMAN RESOURCES
BUSINESS UNITS EXECUTIVE TEAM
INFORMATIONTECHNOLOGY
BUDGETS AND CAPITAL INVESTMENTS
The Balanced Scorecard process allows an organization to align and focus all its resources on its strategy
Focusing Resources on Strategy

The Action Gap
MISSIONWhy we exist
VALUESWhat’s important to us
VISIONWhat we want to be
STRATEGYOur game plan
EMPOWERMENT / PERSONAL OBJECTIVESWhat I need to do
TOTAL QUALITY MANAGEMENTWhat we must improve
A Gap Exists Between Mission-Vision-Strategyand Employees’ Every Session Actions

VISIONWhat we want to be
STRATEGYOur game plan
BalancedScorecard
BALANCED SCORECARDTranslate, Focus and Align
STRATEGIC INITIATIVESWhat are the priorities
MISSIONWhy we exist
VALUESWhat’s important to us
STRATEGIC OUTCOMES
SatisfiedSHAREHOLDERS
Delighted CUSTOMERS
Efficient and EffectivePROCESSES
Motivated & PreparedWORKFORCE
EMPOWERMENT / PERSONAL OBJECTIVESWhat I need to do
TOTAL QUALITY MANAGEMENTWhat we must improve

Balanced ScorecardBalance between
• Financial measures of performance
• Long-range competitive abilities

Balanced Scorecard
Four perspectives
• Financial
• Customer
• Business processes
• Innovation & learning

BalancedScorecard

Financial PerspectiveHow do we look to stockholders?
• Survive
• Succeed
• Prosper
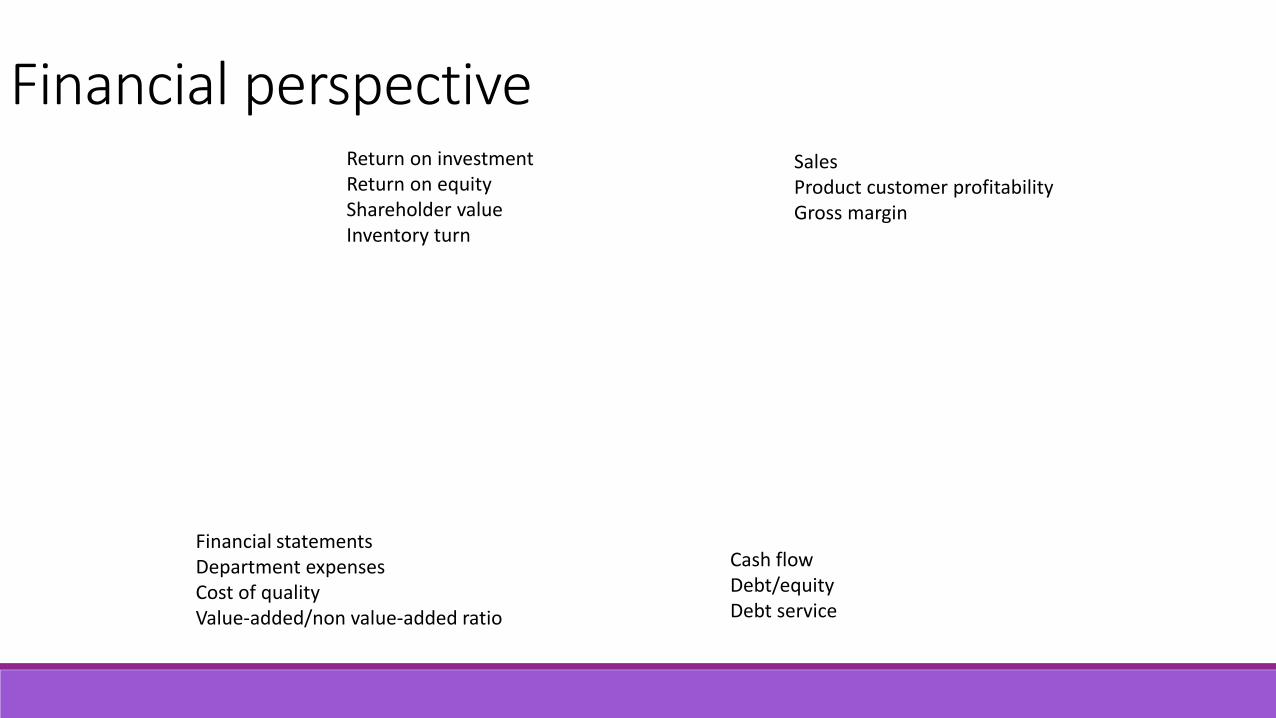
Financial perspective
Cash flowDebt/equityDebt service
Financial statementsDepartment expensesCost of qualityValue-added/non value-added ratio
Return on investmentReturn on equityShareholder valueInventory turn
SalesProduct customer profitabilityGross margin

Customer PerspectiveHow do our customers see us?
• New products
• Responsiveness
• Quality

Customer perspective
CUSTOMER
Time
Quality
ServiceCost
Market
Share
Product development cycleOrder to delivery cycleService cycleProduct/service mix
Innovations & competency
ResponsivenessCustomer satisfaction surveys
Product qualityService quality
Price/valueCost of ownership

Business Process perspectiveAt what must we excel currently?
• Manufacturing/service excellence
• New product/service introduction
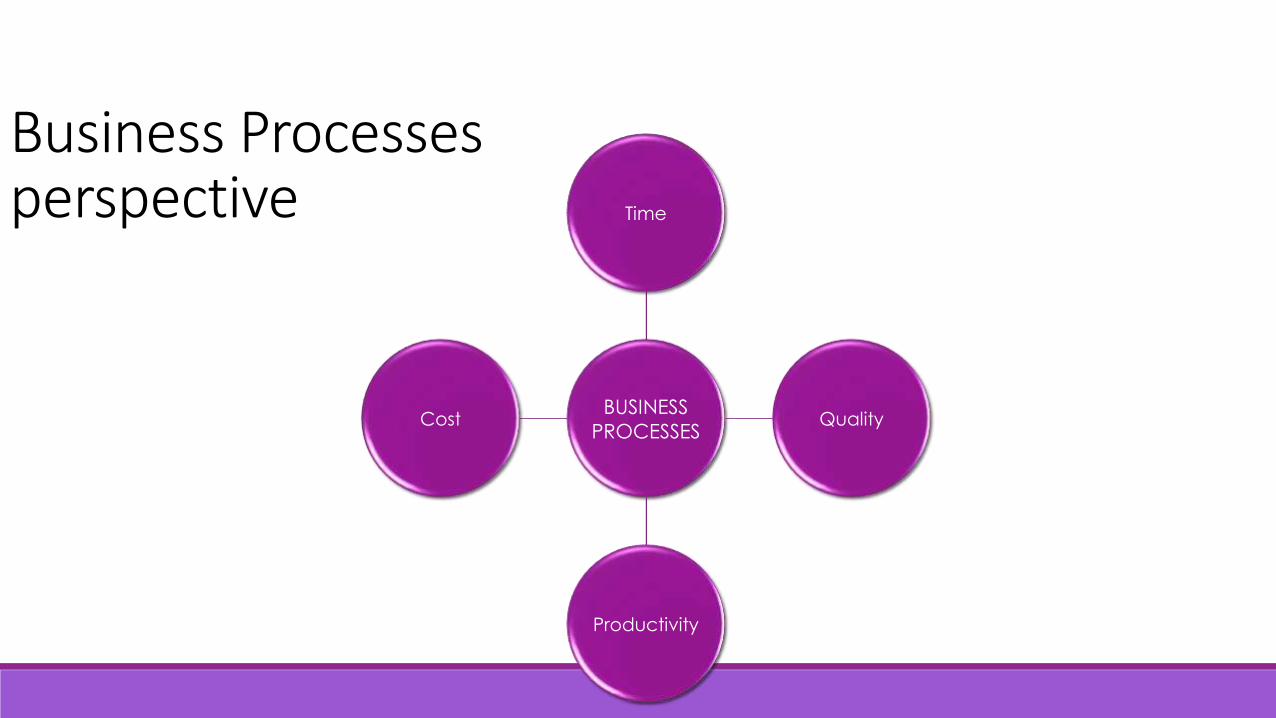
Business Processesperspective
BUSINESS
PROCESSES
Time
Quality
Productivity
Cost

Innovation & learning perspectiveCan we continue to improve and create value?
•Technological leadership
•Time to market
•Employee training and satisfaction

Innovation & learningperspective
INNOVATION
& LEARNING
Core
competencies
Morale &
corporate
culture
Internal
rewards &
recognition
Education
& training
Perspectives are InterrelatedInnovation pleases customers which are necessary for good financial results
Good financial results make financing improvements possible

Overall ConceptsNot just a set of measures
• Measures must relate to strategy
◦ Critical success factors
• Measures are interrelated
◦ Must understand how the perspectives influence each other

Overall ConceptsNot a quick process
• Implementation requires
◦ Thought
◦ Analysis
◦ Data-gathering
◦ Time

Overall ConceptsThought
• What is our strategy?
• What is critical to implementing the strategy?
• How can we measure our progress?

Overall ConceptsAnalysis
• What are the linkages between functions?
• What drives the achievement of goals?
• What measures correlate with the drivers?

Overall ConceptsData-gathering
• What data is available? What isn’t?
• How should it be gathered? Reported?

Overall Concepts
Time
• Cannot be done in an afternoon
• Successful implementation may take several months
• Never-ending process
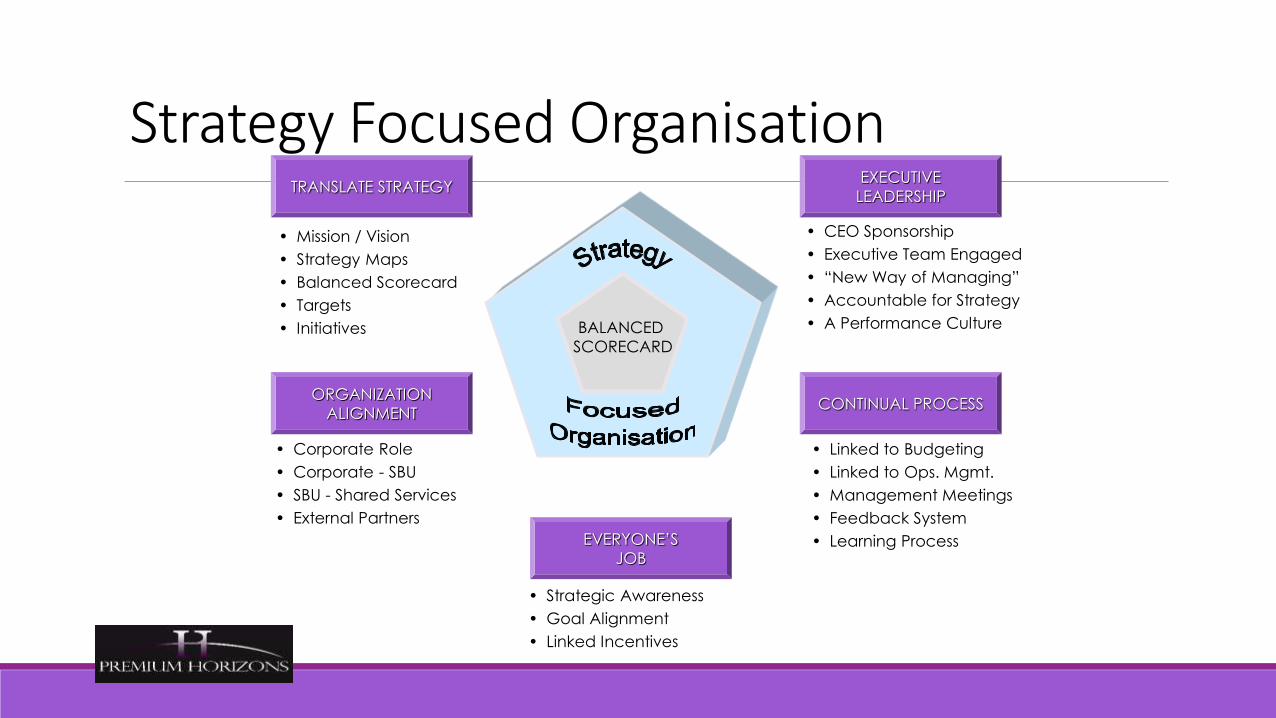
Strategy Focused OrganisationTRANSLATE STRATEGY
CONTINUAL PROCESSORGANIZATION
ALIGNMENT
EVERYONE’S
JOB
EXECUTIVE
LEADERSHIP
• CEO Sponsorship
• Executive Team Engaged
• “New Way of Managing”
• Accountable for Strategy
• A Performance Culture
• Mission / Vision
• Strategy Maps
• Balanced Scorecard
• Targets
• Initiatives
• Linked to Budgeting
• Linked to Ops. Mgmt.
• Management Meetings
• Feedback System
• Learning Process
• Corporate Role
• Corporate - SBU
• SBU - Shared Services
• External Partners
• Strategic Awareness
• Goal Alignment
• Linked Incentives
BALANCED
SCORECARD
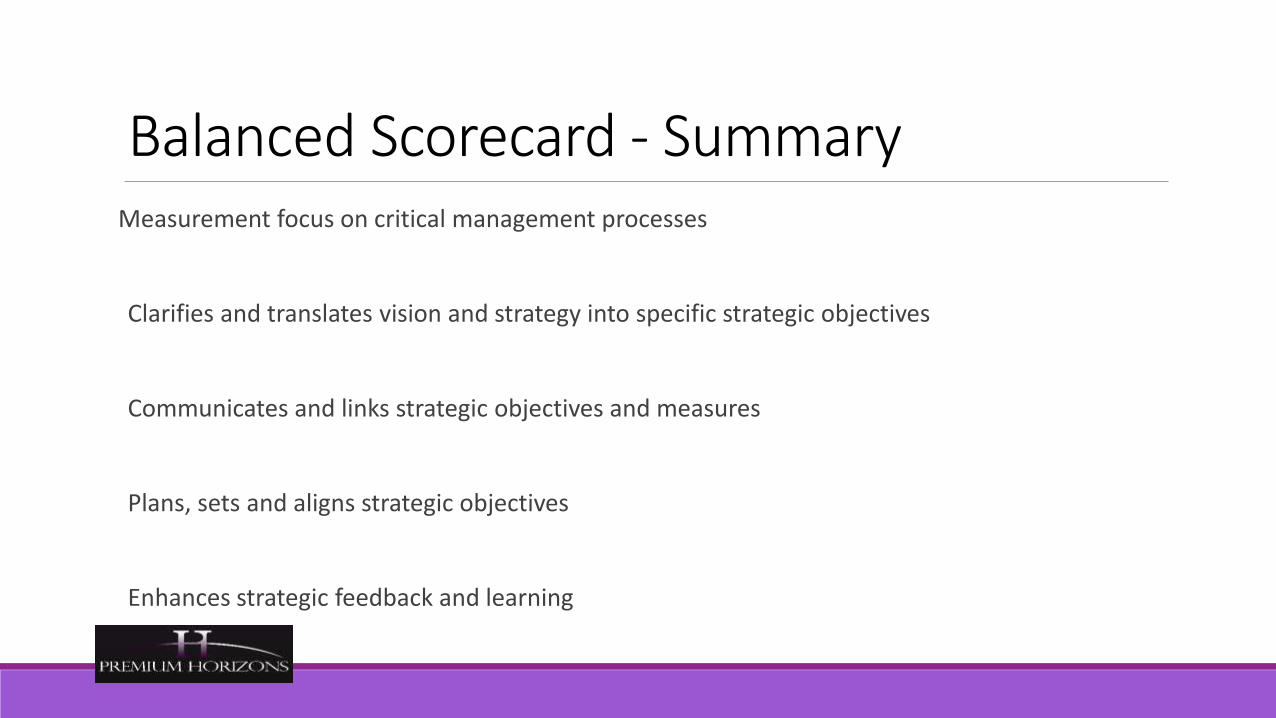
Balanced Scorecard - SummaryMeasurement focus on critical management processes
Clarifies and translates vision and strategy into specific strategic objectives
Communicates and links strategic objectives and measures
Plans, sets and aligns strategic objectives
Enhances strategic feedback and learning
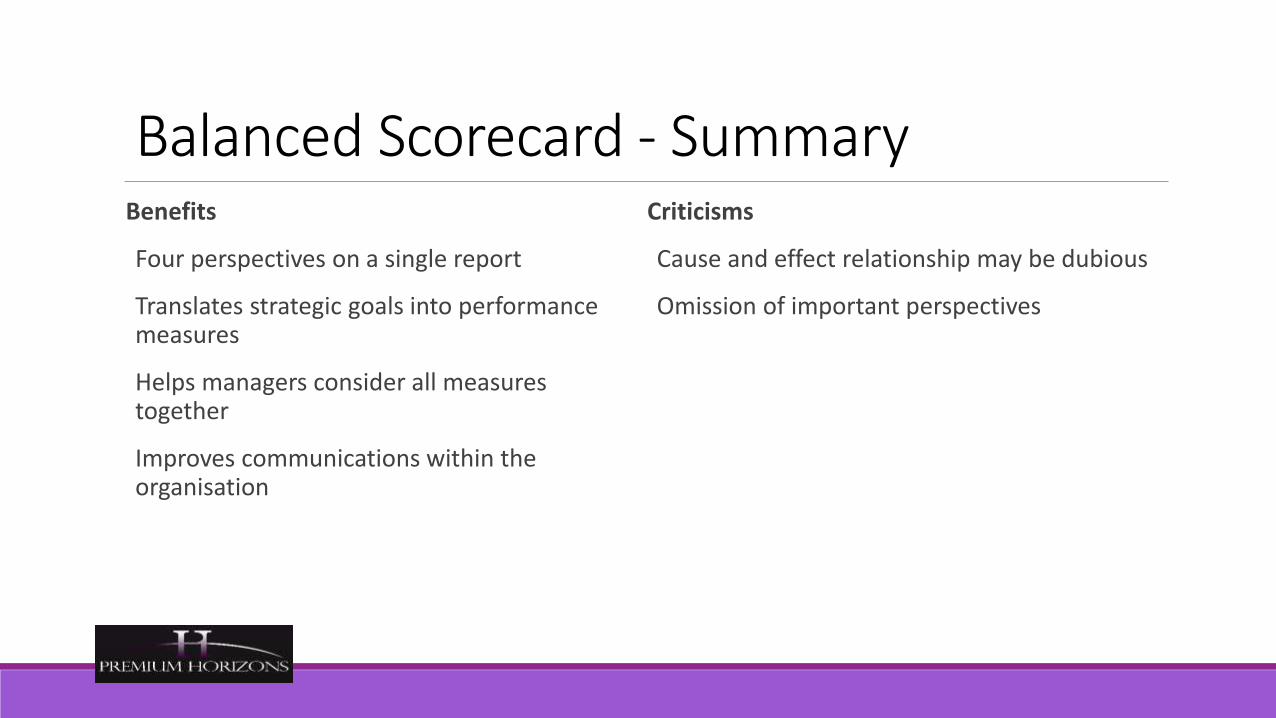
Balanced Scorecard - SummaryBenefits
Four perspectives on a single report
Translates strategic goals into performance measures
Helps managers consider all measures together
Improves communications within the organisation
Criticisms
Cause and effect relationship may be dubious
Omission of important perspectives

337
Solar House915 High RoadNorth FinchleyLondon N12 8Q
Tel.: +442083436060, Fax: +442083436000 Mob.: +447438026910 e-mail: [email protected]