
Rapid Innovation Group Escape the City Workshop slides, 9 March 2013

* Contacts: School of Agriculture Policy and Development, University of Reading, Early Gate, Whiteknights
Road, RG6 6AR, Reading, UK. E-mail: [email protected].
This research was supported by the ESRC/DFID Grant ‘The Diffusion of Innovation in Low Income Countries’
(ES/J008699/1). We would like to thank Marc Ventresca, Douglas Gollin, and Abhijeet Singh for helpful
comments and suggestions. We are also grateful for comments from participants at the Development Studies
Association (DSA) 2014 Annual conference in London (UK) and Seminar at the Oxford Department of
International Development.
PRELIMINARY VERSION
Innovation and productivity in formal and informal firms in
Ghana
Xiaolan Fu, Pierre Mohnen, and Giacomo Zanello*
March 13, 2016
Abstract
Despite the high profile of the issue in current policy formulations in low-
income countries (LICs), there is little empirical evidence on innovativeness
and firm performance in formal and informal establishments. This paper
aims to fill this gap in the literature using a revised Crépon-Duguet-
Mairesse (CDM) structural model to analyse data from a unique innovation
survey of 501 manufacturing firms in Ghana. We find that innovation
positively impacts the labour productivity of firms, and non-technological
instead of technological based innovations are the significant drivers. The
effect is significantly greater for informal establishments. We suggest that
surviving of some informal firms may be linked to their ability to innovate.
Keyword: Innovation, firm’s productivity, technology and knowledge
transfer, Africa, Ghana

2
“I survive because I innovate”
Food processing entrepreneur of an informal firm, Accra (Ghana)
1. Introduction
The economic growth of low-income countries (LICs) is a product of ideas, skills, capital,
and the organization of society and firms. It has not been different in the economic history of
current developed countries, where main industrial revolutions were all linked to an
application and spread of an innovation – steam power, electricity, and informatics –
resulting in a remarkable increase in t total factor productivity, changes in the society, and
ultimately in the wealth and welfare of nations. The past also shows that the real impact of
technologies and knowledge is when those are diffused and adopted by a large range of
actors, within a country and in other countries as well. Yet, hosting countries not only have to
face financial constraints to acquire the technology, but also to develop an absorptive
capacity (knowledge and skills) able to adopt and possibly reproduce such technologies
(Cohen and Levinthal, 1989). The steam engine is a demonstrative example: it was invented
in the United Kingdom at the end of the 18th
century, but its diffusion to other countries took
decades. Even if the Chinese empire came across this technology during the First Opium War
(1839-1842), its potential impact was not fully realized at first, and then it took two decades
to overcome the knowledge and skills gaps (mainly in term of technical drawing and machine
tools) for the Chinese to adopt and produce steam engines (Wang, 2010). The first steam
engine built in China was manufactured in 1869, almost hundred years after its invention in
the United Kingdom. At that time, the second industrial revolution was in its infancy in
Europe, and the streets of European capitals were soon starting to have electric lighting.
In the macroeconomic literature, it is widely recognised that innovation is a major driver of
economic growth (Grossman and Helpman, 1991). As extensively documented in Fagerberg
et al. (2010), two factors have been identified as critical factors in the endogenous economic
growth models: adoption of technologies developed elsewhere and indigenous innovative
capacity. However, the technology diffusion to, and adoption by, developing countries is
costly and conditional on factors that support the process (Keller, 2004). It relies on
substantial and well-directed technological efforts (Lall, 1992) as well as sufficient human,
financial resources and absorptive capacity (Cohen and Levinthal, 1989; Keller, 1996). As
highlighted in Fu and Gong (2011), it also requires appropriate institutions and policies to
guide incentives and facilitate the process, in addition to strong local capabilities to identify
the right technology and appropriate transfer mechanism, and to absorb and make adaptations
according to local economic, social, technical and environmental conditions. Trade (import
and export) and foreign direct investments can become important sources of growth for
catching-up countries.

3
The macro-level evidence is supported by empirical studies that strongly suggest that the
level of technological innovation contributes significantly to economic performance,
particularly at the firm and industry level (see for example Kleinknecht and Mohnen, 2002).
Firms’ growth is seen as a learning process in which firms that are able to adopt and create
technologies and knowledge grow and survive, while firms that do not innovate decline and
fail (Jovanovic, 1982). This is particularly relevant in the context of LICs in which the
learning process is the major factor enabling innovation activities in firms (Bell and Pavitt,
1992; Lall, 1992). Low-income countries face severe constraints and, as argued by Lundvall
et al. (2010), technological capabilities in these countries encompass more than just research
and development (R&D). In such environments, learning-based innovations – such as
adoption or adaptation of both technological and no-technological innovations – are
significant factors for the industrial development.
The richness of data on innovation in emerging and developed countries has allowed
researchers to implement an econometric approach, such as the widely used Crépon-Duguet-
Mairesse (CDM) structural model (Crepon et al., 1998), in which firm performance is a
function of product and/or process innovations, which in turn are explained by R&D and
other innovation expenditures. In the context of developing countries, the lack of data at
longitudinal level and the fact that for the vast majority of firms R&D activities are only a
marginal determinant in innovation activities have posed several challenges in modelling
innovation and growth. Nonetheless, in recent years an increasing number of empirical
studies have analysed the role of innovation in LICs firms, both exploring its determinants
(Goedhuys, 2007; Robson et al., 2009) and the impact it has on various firm performance
indicator (Gebreeyesus, 2009; Goedhuys et al., 2008, 2014). Most of the latter studies focus
on product and process innovation and their impact on productivity. However, as argued by
various scholars (Bloom et al., 2013; Bruhn et al., 2010; Mano et al., 2012) in the current
state of development of LICs it is important to recognize the impact of a range of
innovations, including management and marketing innovations, the impact of which could go
further than an improvement in productivity.
In analysing the contribution of innovation to firm performance, it is important to recognize
that in most of the developing countries a dual-economy system existswith formally
registered firms and an informal sector. In a recent survey on informality and development,
La Porta and Shleifer (2014) provide five stylized facts of the informal economy in
developing countries. The informal sector employs a large proportion of workers and tends to
escape taxation and controls from the authorities. Moreover, it is characterized by small and
inefficient firms, which are ran by poorly educated entrepreneurs, and as a consequence its
productivity is very low. Capturing the magnitude and impact of the informal sector is
problematic because of its intrinsic nature, but it has been estimated that the weighted
average size of the shadow economy (as a percentage of GDP in the period 1999-2007) in
Sub-Saharan Africa around 40 per cent (Schneider et al., 2011) and up to 80 per cent of non-

4
agricultural employment (Chen et al., 1999). The different capabilities of firms in the formal
and the informal sectors are likely to shape the innovation adoption and diffusion. For
example, formal establishments may have the human and capital resources to collaborate in
innovation activities with other firms, research and development institutions, or, for larger
firms, with foreign institutions (Oyelaran-Oyeyinka et al., 1996). Informal firms, by contrast,
are unlikely to have strong capabilities and, therefore, may be more likely to innovate from
entrepreneurs’ initiatives and in response to specific constraints given by the context in which
operate (Robson et al., 2009).
According to received wisdom, whereas the role of innovation in firms’ growth in developed
countries is largely documented, its impact in developing countries is still only partially
understood. Difficulties related to data availability and how to measure innovation have
limited the empirical studies on the link between innovation and firms’ growth in LICs. This
paper aims to fill this gap investigating the role of innovation in the performance of Ghanaian
manufacturing firms. Because of the development level of the institutions and education
system, Ghana provides a potential fertile soil for innovation in the context of developing
countries making this a relevant case study. However, it also shares many of its structural
characteristics with other LICs. In the past thirty years, Ghana has undertaken a series of
structural reforms aimed to strengthen the role of the private sector firms as a pillar of
economic growth. In 2010, the Industrial Policy was set within the context of Ghana’s long-
term strategic vision of achieving middle-income status by 2020, through the transformation
of the country into an industry-driven economy. Remarkably, the Industrial Policy
acknowledged the role of innovation and put in place policies aimed at increasing the overall
level of science, technology, research and development for innovation in the industry.
However, despite policy reforms, the majority of firms are still small and embedded in the
informal sector, and larger firms are constrained by finance, managerial, and technical skills.
In this study we use data from an innovation survey that was designed to investigate the
innovation activities of firms in a granular way, capturing the conventional and unstructured
way firms of different level of formality, size, and absorptive capacity typically innovate.
Adopting a reduced form of the CDM structural model we are able to capture the impact of
innovation on formal and informal firms’ growth.
Despite the high profile of the issue in current policy formulations in low-income countries
(LICs), there is little empirical evidence on innovativeness and firm performance in formal
and informal establishments, and under severe institutional and resource constraints. This
paper aims to fill this gap in the literature analysing data from a unique innovation survey of
500 manufacturing firms in Ghana. Two main research questions motivate this study:
1. Is there innovation in LICs, specifically in the informal sector? If yes, what kind of
innovation?

5
2. How does innovation affect firm’s growth? Are there differences between formal and
informal firms?
Our results show that innovation positively impacts labour productivity, and non-
technological-based innovations are the significant factor. The effect is significantly greater
for informal establishments.
The remaining of the paper is structured as follows. Section 2 provides the literature review
while Section 3 reports the model and the estimation strategy. This is followed in Section 4
by the description of the data at hand with a focus on the nature of innovation and the
formal/informal status of firms. Section 5 reports and discusses the results. Finally, Section 6
concludes.
2. Literature review
Until a decade ago, innovation in the private sector in LICs was the focus of only a handful of
studies every year (Zanello et al., 2015). Until then, innovation was often associated with
patents or ground-breaking discoveries. Those are the results of costly, risky and lengthy
processes that require intense knowledge and capital investment to create something “new”.
The Oslo Manual has been a standard reference for surveys of innovation in advanced
economies and, since its third edition, in developing countries. Its definition of innovation as
“[…] the implementation of a new or significantly improved product (good or service), or
process, a new marketing method, or a new organisational method in business practices,
workplace organisation or external relations” (OECD, 2005: 46) highlights two important
features. First, innovation can take a multitude of forms (product innovations, process
innovations, marketing innovations, and managerial/ organisational innovations). Second,
innovation can be result from an original idea but can also emerge from diffusion, absorption,
or imitation of new methods developed elsewhere. Because of that, an innovation could
simply be new to the firm and not necessarily new to the market and yet have an impact on
productivity and employment.
The recognized growing role of innovation in developing countries has opened a new sub-
field of research at the intersection of innovation and management studies and development
studies. The so-called inclusive innovation focuses on the impact of innovation on the people
living in the lowest income groups (Chataway et al., 2013). In particular, it refers to the
production or delivery of new products and services for and/or by the people that are largely
excluded from the formal markets. At the same time, the constrained ingenuity and resilience
of the people living below the poverty line have been recognized as an incubator for local
innovation. This focus on ‘frugal innovation’ (Bhatti and Ventresca, 2012) introduces further
considerations to understand the sources and impact of innovation in LICs. In order to access

6
effectively new markets, companies may need to re-think the production and delivery of
goods, often re-engineering products in order to reduce the complexity and cost of
production. The innovation process could involve reverse diffusion (Govindarajan and
Ramamurti, 2011), when an innovation is adopted first in LICs before spreading to advanced
industrial economies, jugaad innovations (Gulati, 2010), in case the innovation involves
arrangement or work-around and is born out of lack of resources by improvisation, or user
innovations, when consumers are involved in the design of a product or service (Von Hippel,
1998).
2.1 Innovation and firms’ growth in low-income countries
Fagerberg et al. (2010) review the literature and provide large and strong evidence on how
worldwide countries that are more active in innovation have higher productivity and income
than the less-innovative ones. Many scholars have argued that in developed economies the
growth of firms depends on their ability to learn about their environment, linking their
strategies to the changing environment (Geroski, 1989; Klepper, 1996). This is even more
relevant in LICs, where infrastructure is often poor, markets tend to be underdeveloped, and
potential local customers have limited disposable income. In such an environment micro,
small, and medium-size firms – many of them working in the informal sector – are
particularly vulnerable because of the limited absorptive capacity and restricted access to
financial and knowledge resources. Firms located in LICs that are able to successfully
undertake innovation activities will survive, and the innovating firms that are able to make
the best use of the resources available have the potential to lead the market.
In recent years, an increasing number of studies have explored in great detail the role of
innovation in LIC firms. Most of these studies have looked at the impact of product or
process innovations on various performance outcomes. A survey of SMEs combined with in-
depth case studies found a positive association between innovativeness and growth in small
manufacturing firms in Tanzania (Mahemba and Bruijn, 2003). More recently, Gebreeyesus
(2009) investigated the role of innovation in Ethiopian SMEs and found strong evidence that
innovators grow faster than non-innovators in terms of employment. Using a rich dataset of
SMEs operating in Sri Lanka, De Mel et al. (2009) find an association between innovation
and profits.
Overall, the evidence emerging from the literature suggests a positive impact of innovation
on firms’ performance measured as either profit or employment growth. However, recent
studies on the role of innovation on firms’ productivity found a much weaker impact.
Goedhuys et al. (2008, 2014) focus on the importance of various sources of technological
knowledge on firms’ productivity in developing countries. In Tanzania, they find that firm
productivity is not enhanced by R&D, nor by product or process innovation, but business
7
environment seems to play a more relevant role. Those conclusions suggest that the
relationship between R&D, innovation, and productivity is weaker in developing than in
developed countries. In a subsequent study in which three sectors (food processing, textiles
and garment and leather products) and five countries (Brazil, Ecuador, South Africa,
Tanzania, and Bangladesh) are considered, they conclude that the link between knowledge
and productivity is sector - rather than country - specific. In the food processing sector firms
that import or license machinery and equipment are more productive, whereas no such
evidence emerges in other sectors.
Especially in the context of developing countries, it is useful to differentiate between
technological and non-technological innovations (often defined as the introduction of new
organisational methods or new marketing methods). Although these are highly interconnected
(the commercialisation of product innovations often requires new marketing methods, and
new production techniques need to be supported by changes in the organisation), the factors
that drive the different types of innovation are likely to be different. A decade ago, Hausman
(2005) highlighted how much of the existing research had examined product and process
innovations and neglected non-technological innovation, such as new management practices.
Since then, management and managerial skills have received increased attention as a factor
explaining differences in firms’ performance in developing countries with evidence spanning
various geographical areas (Bloom et al., 2013; Drexler et al., 2014; Karlan and Valdivia,
2011; Mano et al., 2012). Moreover, there is some qualitative and narrative evidence of the
benefit of market innovations, mainly in the informal sector (Hall et al., 2012; Ramani et al.,
2012).
2.2 Informality, innovation, and firms’ growth
Exploring the different ways in which formal and informal firms innovate and the impact it
has on firm growth is important given the size of the informal sector in developing countries.
In addition, there is increasing evidence that the cure for informality is economic growth, as
reported in La Porta and Shleifer (2014), and therefore, innovation could play a key role in
such a transformation. Although we have a fair knowledge of the characteristics of the
informal sector, there is not a single widely-accepted definition of informal firms. As
reviewed in Benjamin and Mbaye (2014), scholars have used different criteria based on firm
size, registration status, employer social security contributions, legal form of organization,
and character (sincerity) of financial accounts. However, a consensus has emerged on the fact
that there are degrees of formality and informality along a continuum rather than mutually
distinct sectors (Trebilcock, 2005). Therefore, using a single indicator is likely to capture
only partially the formal character of the firm. Using various indicators to capture the
informal sector, La Porta and Shleifer (2008) found that it accounts for 30-40 per cent of total
economic activity in the poorest countries, and an even higher share of employment.

8
Limited empirical evidence is available specifically on the role of innovation and firms’
growth in the informal sector of developing countries (De Mel et al., 2009; Gebreeyesus,
2009). However, a few studies explore the determinants of innovation adoption, including
firms’ characteristics, such as size and the entrepreneur’s level of education. Firm size, which
captures the scale of operations and has been recognized as one of the defining characteristics
of informal establishments, has been identified as a barrier to innovation in various studies
(De Mel et al., 2009; Gebreeyesus, 2009; Robson et al., 2009). The level of education of
entrepreneurs is regarded as an important, although not a sufficient, condition for innovation.
Bradley et al. (2012) advocate that capital is not a “silver bullet”, and education and human
capital are the major constraints of innovation in Kenyan small firms. The lack of resources
in the education system in many LICs makes the non-formal training the main source for
learning, together with ‘learning by doing’ (Oyelaran-Oyeyinka and Lal, 2006).
Although ingenuity has been considered an engine of innovation activities for informal
businesses (Prahalad, 2012), most of the literature has tended to look at observable indicators
(e.g. firm size, age, education of workers and entrepreneur) in estimating the determinants of
innovation. In most cases data constraints have prevented the inclusion of soft skills – such as
entrepreneurship and management skills – which may be equally important in the process of
adoption and impact of innovation. An exception is the work of De Mel and colleagues
(2009) who use a range of various indicators to provide evidence that the success of informal
businesses in Sri Lanka is determined not only by the skills but also the acumen of
entrepreneurs. Such findings reinforce the evidence that the role of the entrepreneur is more
evident in small enterprises in every strategic aspect, including innovation activities
(Donckels and Fröhlich, 1991).
3. The innovation model: Econometric specification and estimation
The innovations found in LICs are shaped by the context to an extent that those can take
multiple forms and determinants. A recent literature review highlighted how most of the
innovations in LICs have an adaptive or incremental nature, and, therefore, innovations in
such settings are unlikely to leapfrog or redefine value creation processes (Zanello et al.,
2015). In fact, given the limited financial and knowledge resources and absorptive capacity of
firms in LICs R&D-based innovations are uncommon. The vast majority of innovation
activities derive from the adoption (and adaptation) of innovations through the so-called
“technological capability”, the firms’ ability to employ existing technologies and knowledge
in order to adopt, adapt, and change existing technologies (Fransman, 1985; Lall, 1992).
Therefore, in developing countries innovation is a phenomenon that involves institutional and
environmental factors as much as personal and entrepreneurial characteristics. Firm owners’
entrepreneurial acumen is as critical as firms’ characteristics for innovation adoption.
Empirical evidence on this is limited but notably De Mel et al. (2009) control for both
9
entrepreneurs and firm characteristics in the adoption of innovations. We have adapted the
CDM model to suit these conditions; in particular we had to take into account the lack of
formal R&D activities1 and the role of firm owners’ entrepreneurial acumen in adopting
innovations. We therefore apply a structural model, which takes the following basic form: a
firm innovates based on characteristic of the entrepreneur together with other inputs and then
the fruit of the innovation activity is a determinant of productivity.
The model, therefore, includes two equations. Let 𝒊 = 𝟏, … , 𝑵 index the firm, the first
equation captures the knowledge production 𝑰∗:
𝑰𝒊∗ = 𝒛𝒊
′𝜷 + 𝜺𝒊, (1)
where we consider 𝑰𝒊∗ as an unobserved latent variable, and where 𝒛𝒊 is a vector of
determinants of innovation effort, including firm owners’ entrepreneurial acumen, 𝜷 is a
vector of parameters of interest, and 𝜺𝒊 an error term. We use a probit model to estimate (1)
as such
𝑰𝒊 = {𝟏 𝒊𝒇 𝑰𝒊
∗ > 𝟎𝒐𝒕𝒉𝒆𝒓𝒘𝒊𝒔𝒆
(2)
where 𝑰𝒊 is the observed binary variable equal to 1 if a firm undertook any innovation activity
in the past three years and 𝑰𝒊∗ is the respective latent variable.
In the second step, we estimate a production equation
𝒚𝒊 = 𝒘𝒊′𝜶𝟏 + 𝑰𝒊
∗𝜶𝟐 + 𝒗𝒊 (3)
where 𝒚𝒊 is labour productivity (log of output per worker), 𝒘𝒊 is a vector of determinants of
productivity, 𝑰𝒊 is the latent variable for innovation activity and 𝒗𝒊 an error term. In our
estimation, we take care of the endogeneity of 𝑰𝒊 by using in the estimation the predicted
values from the knowledge production function equations and instrumented it in (3) using a
two-stage least squares (2SLS) regression approach and correct the standard errors
accordingly.
In order to test our hypotheses, we expanded the basic model in two directions to capture the
different nature of innovations and formal character of firms. First we decompose the
innovation activity (𝑰𝒊) into technological (𝑻𝒊) and non-technological (𝑳𝒊) based innovation.
Technological innovation includes product and process innovation, while non-technological
innovation includes marketing and management innovations. The first step of the estimation
is expanded to include two knowledge productions
𝑻𝒊∗ = 𝒛𝒊𝟏
′ 𝜷𝟏 + 𝜺𝒊 (4a)
1 In our sample less than 6 per cent of the firms developed innovation through a formal R&D department.

10
𝑳𝒊∗ = 𝒛𝒊𝟐
′ 𝜷𝟐 + 𝜺𝒊 (4b)
where the starred dependent variables are latent variable. We jointly estimated model (4a)
and (4b) with a bivariate probit
𝑻𝒊 = {𝟏 𝒊𝒇 𝑻𝒊
∗ > 𝟎𝟎 𝒐𝒕𝒉𝒆𝒓𝒘𝒊𝒔𝒆
(5a)
𝑳𝒊 = {𝟏 𝒊𝒇 𝑳𝒊
∗ > 𝟎𝟎 𝒐𝒕𝒉𝒆𝒓𝒘𝒊𝒔𝒆
(5b)
where 𝑻𝒊 and 𝑳𝒊 are respective observed binary variable equal to 1 if a firm undertook any
technological and non-technological innovation activity in the past three years. The predicted
values from (5a) and (5b) are then separately instrumented and included in the productivity
equation
𝒚𝒊 = 𝒘𝒊′𝜸𝟎 + 𝑻𝒊
∗𝜸𝟏 + 𝑳𝒊∗𝜸𝟐 + 𝒗𝒊 (6)
Secondly, in order to capture the effect of innovation activities on the degree of formality of
the firms, we estimated (3) and (6) interacting the two variables
𝒚𝒊 = 𝒘𝒊′𝜶𝟏 + 𝑰𝒊
∗𝜶𝟐 + 𝑵𝒊𝜶𝟑 + 𝑰𝒊∗ × 𝑵𝒊𝜶𝟒 + 𝒗𝒊 (7)
𝒚𝒊 = 𝒘𝒊′𝜸𝟎 + 𝑻𝒊
∗𝜸𝟏 + 𝑳𝒊∗𝜸𝟐 + 𝑵𝒊𝜸𝟑 + 𝑻𝒊
∗ × 𝑵𝒊𝜸𝟒 + 𝑳𝒊∗ × 𝑵𝒊𝜸𝟓 + 𝒗𝒊 (8)
where 𝑵𝒊 represents the degree of formality of a firm and 𝑰𝒊∗, 𝑻𝒊
∗, and 𝑳𝒊∗ are respectively the
predicted value from models (2), (5a), and (5b).
In the estimation of our models we addressed two econometric issues, endogeneity of
innovation and exclusion restrictions to identify the impact of innovation on productivity.
The reliability of the results relies on having valid exclusion restrictions, i.e. the inclusion of
at least one significant explanatory variable in the knowledge production that does not appear
in the productivity model. This variable should affect innovation, but affects productivity
only through innovation. From an extensive qualitative research based on 32 in-depth
interviews in 10 formal and informal firms that preceded the survey emerged that access to
credit was one of the main constraints to innovation. In fact, at the time of the survey the
current loan interest rate (~20%) was unaffordable for most of the firms. We therefore used
access to subsidised loan as exclusion restriction in our analysis being confident that the
impact of credit would affect productivity through investment in innovation. In addition to
the exclusion restrictions we also needed to consider that productivity and innovation are
thought to be endogenous. More productive firms may have higher profits and more
opportunities for knowledge exchange with other firms, which may result in greater
innovation activities. At the same time, innovation is a driver of productivity. In the original
model CDM model in the productivity equation innovation is instrumented with the R&D

11
expenses (Crepon et al., 1998). In our case, we use a measure of ingenuity that largely
depends on the personal characteristics of the entrepreneur.
4. Descriptive statistics
4.1 The nature of innovation
For this study we conducted with the support of the Science and Technology Policy Research
Institute (STEPRI) an innovation survey of 501 manufacturing firms in Ghana. The data were
collected between November 2013 and January 2014 and include detailed information on
innovation activities undertaken by the firms during the three-year period 2010-2013. We
recognise that the development and adoption of innovations are not a static process but one
that spans through a period of time. Although the dataset is cross-sectional in nature, we
recorded some data (such as turnover) both for 2010 and 2013 allowing us to have a partial
view of the dynamics and behaviour of firms during the three years under review. More
details on the survey methodology can be found in Fu et al. (2014).
The data at hand include different levels of the formal character of the firms, expanding the
literature on innovation in developing countries that has concentrated on innovation in
formally registered firms (Ayyagari et al., 2011). Since informal firms cannot be recorded on
official firms’ databases, we use a different sampling framework in order to avoid under-
representing the whole informal sector. We, therefore, sampled half of the sample from
sources that were likely to capture mainly informal firms and the other half from sources
containing mainly formal firms. For informal firms, we randomly sampled 25 firms in 10
clusters spread in five regions. The choice of clusters and regions was determined to have a
sector and geographical representation of the Ghanaian informal economy. The population of
firms from which we draw the sample of the formal firms was compiled merging difference
sources2. The sample was then randomly selected with three levels of stratification: industrial
sector, firm size, and regional location.
The data collected cover only manufacturing firms. Half of the firms in the sample are
equally distributed in the food processing and wearing and textile sector. Fifteen per cent are
active in the manufacture of furniture and metal products, and ten per cent work in wood and
the manufacturing of wooden products. The remaining ten per cent are active in a multitude
of sectors, from manufactured paper products and rubber and plastics products to the
manufacture of leather or chemicals products.
2 Specifically we used the latest available National Industrial Census (2003) by Ghana Statistical Service, Micro,
Small and Medium Enterprises database from Ministry of Trade and Industry, Dun & Bradstreet database of
Ghanaian firms, and the list of members of the Association of Ghana Industries (AGI).
12
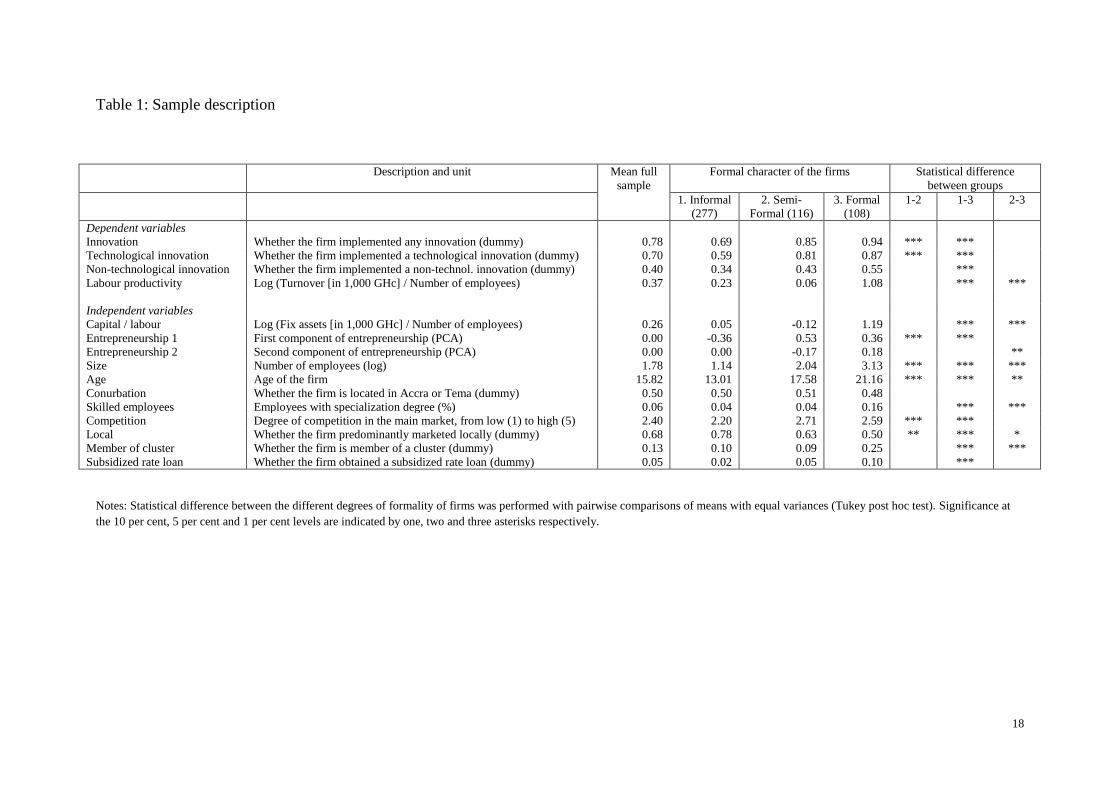
Descriptive statistics of the firms in the sample are reported in Table 1. From our sample we
see how innovation is a widespread phenomenon in the private sector in Ghana, where
between 2010 and 2013 most of the firms (78 per cent) were active in some innovation
activity. When we break down the nature of innovations, we observe that most of the firms
(68 per cent) are involved in some technological innovation, which may include process or
product innovation. This may reflect the fact that often firms in LICs work far from the
technological frontier, and improvements are relatively easy or affordable to implement.
Non-technological innovations, including management and marketing innovations, were
implemented by 40 per cent of the firms. The vast majority of innovations introduced by the
firms have an imitative and incremental nature, rather than being innovations that leapfrog or
redefine value creation processes. Innovations that were born from a technology that was
originally developed by others and licensed to the firm (with or without adaptation or
modification) or developed in a formal R&D department within the company by scientists
and engineers, amounted to respectively six and two per cent.
Firms have been active on average for almost 16 years and employed 23 employees between
2010 and 2013. However, the distribution of the number of employees is heavily right-
skewed with 73 per cent of the firms employing less than 9 workers (micro firms), 17 per
cent with 10 to 29 employees (small firms), and the remaining 10 per cent is equally
distributed between medium (30-99 employees) and large firms, with more than 100
employees. The value of fixed assets greatly varies across the sample. On average, firms own
assets for almost 55 million GHc, although most of the firms have fixed assets of not more
than 6 thousand GHc.3 The percentage of employees with a technical specialization degree,
used as a proxy for the absorptive capacity of the firm, is on average 6 per cent. Finally, half
of the firms sampled are located in the capital, Accra, or Tema, a nearby industrial area, and
only five per cent of firms predominantly trade outside Ghana.
We capture entrepreneurship using a principal component analysis (PCA) on a series of
questions that aim to capture the skills and attitude of the entrepreneurs. Those are more
common in the entrepreneurial psychology literature and go beyond the level of education of
the entrepreneur. A similar set of questions were used by De Mel et al. (2009) in a study of
Sri Lankan firms. The variables included in the PCA are listed in Table 2 and include the
degree of optimism, pro-active attitude, curiosity, and tenacity. All these factors may
influence the diffusion and creation of innovation. From the PCA we identified two
components. The first component captures the level of entrepreneurship with individuals that
are ingenuous, pro-active, methodical, and optimistic. The second component instead
captures individuals that are more impulsive, less tenacious and unwilling to take risks.
4.2 The formal character of firms in the sample 3 The average exchange rate was GHc 2.24/£ and GHc 1.45/$ in 2010 and GHc 3.45/£ and GHc 2.13/$ in 2013.

13
We do recognize that there is not a standard definition of formal and informal firms
(Benjamin and Mbaye, 2012). We, therefore, collected a self-reported formal character of the
firm asking the respondents “How do you define the nature of the firm?” and providing a
spectrum of options that included different degrees of formality (informal, semi-formal,
formal), in line with the idea that formality follows a continuum (Trebilcock, 2005).
Moreover, during the survey administration, the local enumerators were trained to cross-
check this specific information based on the visit of the firm’s premises and observing its
activity. In our sample most of the firms (55 per cent) are active predominantly in the
informal sector, a figure in line with other estimations of the informal establishments in
Ghana and Sub-Saharan Africa (Institute of Statistical Social and Economic Research, 2013;
Schneider et al., 2011). The remaining firms were similarly divided between semi-formal (23
per cent) and formal (22 per cent).
Formal and informal firms differ in most dimensions. Informal firms are significantly less
innovative than formal firms, both in technological and non-technological innovation
activities. Informal firms also tend to have lower productivity, significantly smaller
endowments, and poorer entrepreneurial skills than formal firms confirming the
characterization of informal firms reported in La Porta and Shleifer (2014). Informal firms
are on average younger than formal firms (13 years old as opposed to 21 years old) and
smaller in size, with on average only five employees compared to an average work force of
84 workers in formal firms. Despite the difference in size, the Ghana Statistical Service
estimated that 48 per cent of the population in working age (16-64 years old) is employed in
informal establishments (GSS, 2008). Absorptive capacity is also greater in formal firms,
with 15 per cent of employees with a specialization degree compared to only four per cent of
employees for the informal firms. Formal and informal firms also tend to be predominantly
active in different markets, with half of the formal firms active in the national or international
markets and three quarters of informal firms in the local market.
Semi-formal firms share characteristics with both formal and informal firms, yet their profile
is unique. Despite being as innovative as the formal firms, their intensity of non-
technological innovation activities is similar to the informal firms. Their productivity is
significantly lower than the one we find in formal firms. Semi-formal firms are significantly
younger than formal firms and at the same time older than informal ones. Yet, regarding size,
absorptive capacity, and location they resemble the latter. Such findings provide an insightful
picture of semi-formal firms in Ghana, highlighting how these are to a large extent in
transition – and possibly trapped – between informality and formality.
5. Discussion
5.1 Innovation activities in low-income countries
14
Table 3 reports the results from the first stage of the innovation model. Formal firms are more
likely to innovate than informal firms, yet when we split innovation into technological and
non-technological innovations, we find the effect to be significant only for the former. This
highlights how even informal firms are equally able to adopt management and marketing
innovations, which by nature are likely to be more affordable and determined by the capacity
of the entrepreneur. In fact, entrepreneurship is a critical factor fostering innovation activities
across all the specifications in our model. This reinforces the view that innovation adoption
and creation in developing countries is still greatly influenced by the acumen and skills of
entrepreneurs, to an extent that we do not find in developed countries where much of the
innovation is driven by R&D activities. In less structured establishment, innovation is driven
by people with characteristics that make them overcome the constraints distinctive of LICs.
Entrepreneurial skills and attitude, including marked curiosity and inclination to personal
relationships, are important factors in the diffusion and adoption of innovations (Bruhn et al.,
2010; De Mel et al., 2009).
Firm size and the number of years a firm operated are positively correlated with higher non-
technological innovation activities. Such findings are in line with previous studies of firms in
Ethiopia and Ghana (Gebreeyesus, 2009; Robson et al., 2009). Firms located in the
conurbation area which comprises the capital, Accra, and Tema, the industrial harbour not far
from the capital, are also associated with innovation activities, particularly non-technological
innovations. Large towns provide entrepreneurs the opportunities for personal interactions,
and exchange of information increase the likelihood that the entrepreneurs are exposed to
new ideas (Robson et al., 2009).
Other results are in line with the previous literature. A larger proportion of skilled employees
in the firms is associated with innovation activities, and the correlation is significant for both
technological and non-technological innovations. This supports the Bradley et al. (2012)
study of Kenyan firms, in which education and human capital were the main constraints to
innovation. Competition seems to be a driver of innovation as well in the Ghanaian firms,
pushing firms that work in competitive markets to innovate in order to remain in business.
Market competition can nurture innovation capabilities and self-selecting firms that are able
to thrive (Kumar and Saqib, 1996). Finally, access to subsidised rate loan is also correlated
with innovation activities. This reinforces our a priori expectation that credit is one of the
main constraints to innovation. The variable also proved to be a suitable exclusion restriction
in the structural model.
5.2 Informality, innovation, and productivity
Labour productivity greatly varies across the different levels of formality of the firms (Figure
1). Informal and semi-formal firms have a similar distribution, with higher concentration of
informal firms at the extremes. At the far end of the spectrum, we only find formal firms that
have the highest labour productivity in the sample. Such representation is in line with
15
previous studies of large firm datasets that have highlighted the difference in productivity
level of firms (Porta and Shleifer, 2008). It does, however, provide a new insight on the
relatively low labour productivity of semi-formal firms, which is not significantly different to
that of the informal firms.
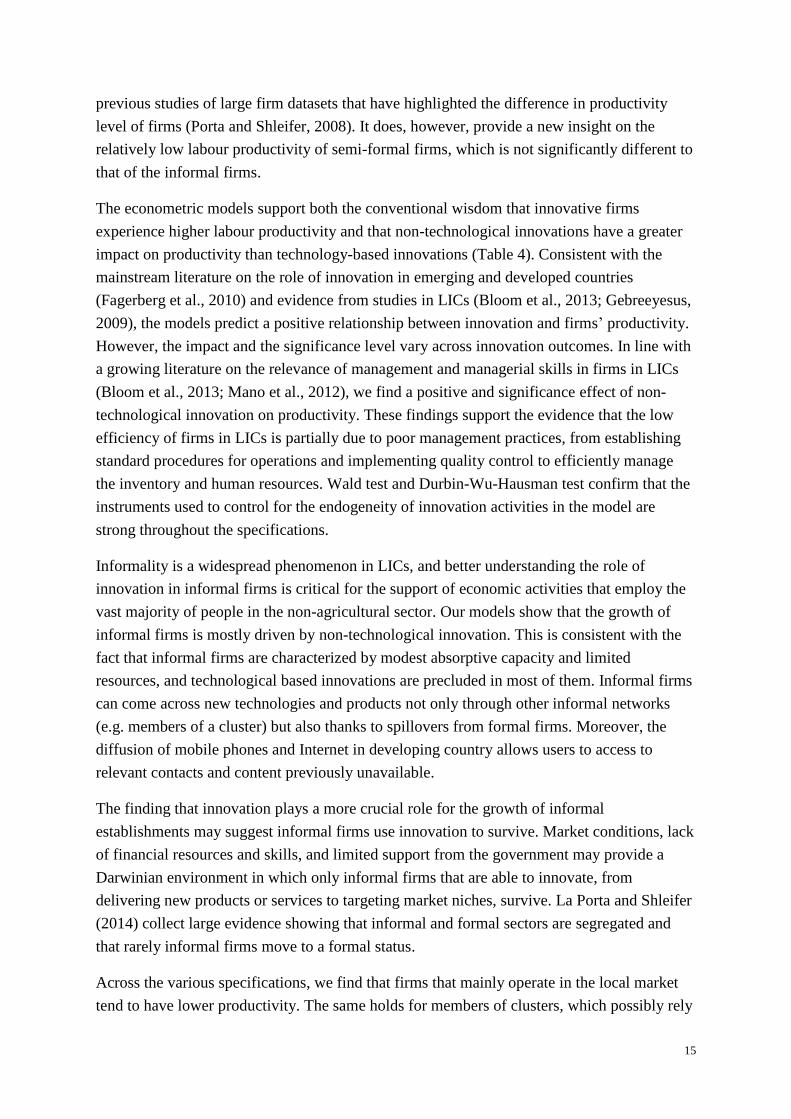
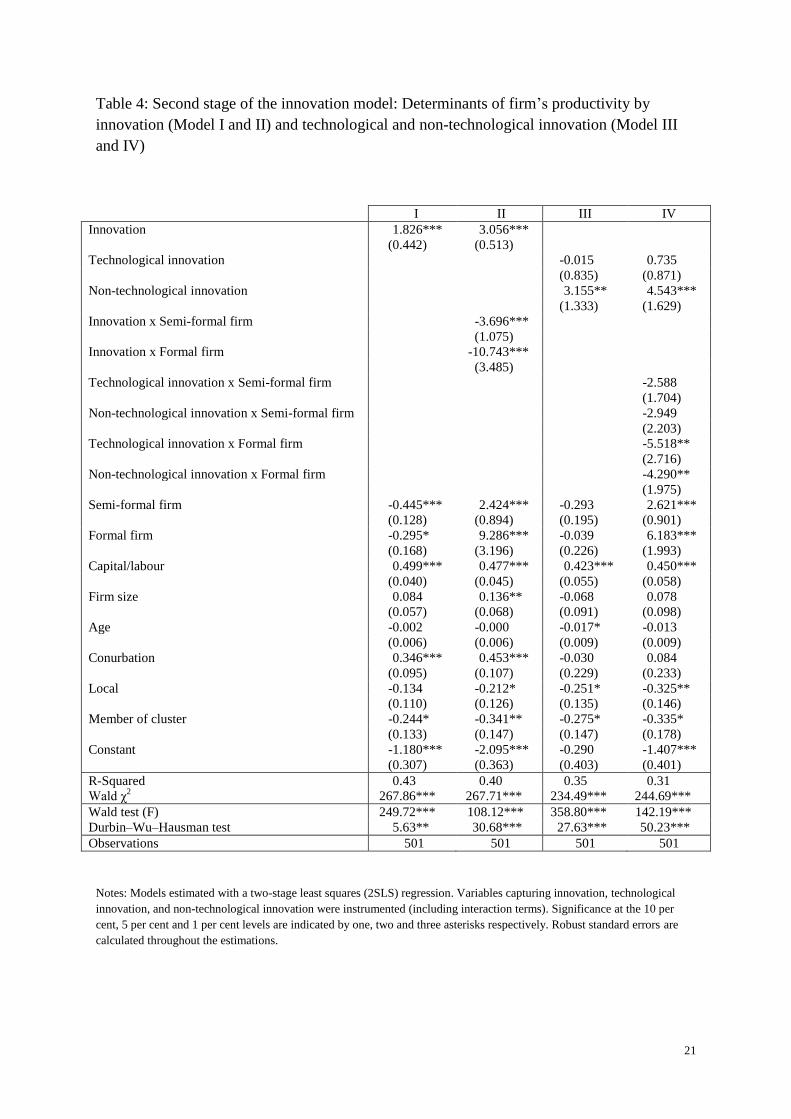
The econometric models support both the conventional wisdom that innovative firms
experience higher labour productivity and that non-technological innovations have a greater
impact on productivity than technology-based innovations (Table 4). Consistent with the
mainstream literature on the role of innovation in emerging and developed countries
(Fagerberg et al., 2010) and evidence from studies in LICs (Bloom et al., 2013; Gebreeyesus,
2009), the models predict a positive relationship between innovation and firms’ productivity.
However, the impact and the significance level vary across innovation outcomes. In line with
a growing literature on the relevance of management and managerial skills in firms in LICs
(Bloom et al., 2013; Mano et al., 2012), we find a positive and significance effect of non-
technological innovation on productivity. These findings support the evidence that the low
efficiency of firms in LICs is partially due to poor management practices, from establishing
standard procedures for operations and implementing quality control to efficiently manage
the inventory and human resources. Wald test and Durbin-Wu-Hausman test confirm that the
instruments used to control for the endogeneity of innovation activities in the model are
strong throughout the specifications.
Informality is a widespread phenomenon in LICs, and better understanding the role of
innovation in informal firms is critical for the support of economic activities that employ the
vast majority of people in the non-agricultural sector. Our models show that the growth of
informal firms is mostly driven by non-technological innovation. This is consistent with the
fact that informal firms are characterized by modest absorptive capacity and limited
resources, and technological based innovations are precluded in most of them. Informal firms
can come across new technologies and products not only through other informal networks
(e.g. members of a cluster) but also thanks to spillovers from formal firms. Moreover, the
diffusion of mobile phones and Internet in developing country allows users to access to
relevant contacts and content previously unavailable.
The finding that innovation plays a more crucial role for the growth of informal
establishments may suggest informal firms use innovation to survive. Market conditions, lack
of financial resources and skills, and limited support from the government may provide a
Darwinian environment in which only informal firms that are able to innovate, from
delivering new products or services to targeting market niches, survive. La Porta and Shleifer
(2014) collect large evidence showing that informal and formal sectors are segregated and
that rarely informal firms move to a formal status.
Across the various specifications, we find that firms that mainly operate in the local market
tend to have lower productivity. The same holds for members of clusters, which possibly rely

16
more on economies of scale and collaborations to mitigate structural, financial, and
managerial constraints. Firms located in the conurbation area have a higher productivity,
likely taking advantage of better infrastructure, larger pool of skilled labour market, and
market opportunity.
Our results show a more relevant role of innovation on firms’ growth than the recent findings
from the work of Goedhuys et al. (2008, 2014), who found that supportive business
environments have a greater influence on firms’ performance than innovation activities. We
also estimated different specifications in which we consider only technological innovations
(products and process innovations) and the results are consistent with our main model
(Appendix I). Three differences between the studies can explain the dissimilar results. First,
there might be some difference because of the industry composition of the samples in the two
studies, although food and garments represent half of our sample. Secondly, we have
corrected for the endogeneity of innovation, something Goedhuys et al. (2008, 2014) have not
done. Given the measurement errors inherent in the technological indicators, not
instrumenting innovation may lead to an attenuation bias. But most importantly, our setting
focuses only on firms located in one country and, therefore, potential cross-country
differences in business environments are not captured, only cross-industry differences.
6. Conclusion
Low-income countries rely on the transfer of technologies and knowledge from more
advanced countries to increase the local wealth and welfare, reduce internal inequalities, and
ultimately accelerate the process of catching up. The current developmental state of most
LICs suggests that the diffusion to and adoption of major technologies in LICs are likely to
be a faster process than what we witnessed with the diffusion of major innovations, such as
the steam engine that took hundred years to be adopted in China. Economies nowadays are
intrinsically more interconnected and lower-tech innovations have the potential to be adopted
by LICs, favoured by emerging countries to LICs trade and collaborations. The rationale is
that the knowledge transferred to LICs is likely to be more appropriate since it comes from
countries with not too dissimilar a factor endowment, and the absorptive capacity of an LIC
recipient may also be more effective in receiving a similar level of technologies. We are
witnessing an initial process in which manufacturing industries are eventually relocated from
industrialized countries to places where labour is cheaper – such as in African countries – and
where worldwide low-tech goods have been assembled and produced for decades. Nowadays
the diffusion of information and communication technologies holds the potential to promote
the diffusion of information in places that until recently were disconnected and remote, and
the increased capability with which people can move and travel is a powerful vector to
support absorptive capacity of LICs with the injection of knowledge and skills.
17
In such a scenario, our results aim at providing a better understanding of the critical role of
innovation on firms’ growth in LICs. These firms have characteristics and work in an
environment that is very different to many firms in emerging countries and most of the firms
in advanced economies. The vast majority of the firms in LICs are informal; they employ a
large proportion of the population but work extremely inefficiently and in a low productivity
regime. Moreover, the historical, socio-economic, and political environment of LICs provides
strong challenges to firms, which face acute obstacles, from knowledge to market and
resources constraints. We found that in such environment innovation is a determinant factor
for the growth of firms. This is particularly evident in informal firms, suggesting they use
innovation to strive and survive.
A stronger emphasis among policy-makers should be placed in the fact that innovation is not
the outcome of development but a means for development. Policies can play a critical role in
accelerating the diffusion and creation of innovation and mitigating the obstacles LICs face.
Too often in LICs, in the informal economy in particular, innovations are not recognized and
innovation efforts in the firms are not properly supported. Therefore, new thinking and
policies to recognize and support innovation, for example by mitigating financial and labour
skill constraints, are necessary in the context of LICs for long-term growth and development.
18
Table 1: Sample description
Description and unit Mean full
sample
Formal character of the firms Statistical difference
between groups
1. Informal
(277)
2. Semi-
Formal (116)
3. Formal
(108)
1-2 1-3 2-3
Dependent variables
Innovation Whether the firm implemented any innovation (dummy) 0.78 0.69 0.85 0.94 *** ***
Technological innovation Whether the firm implemented a technological innovation (dummy) 0.70 0.59 0.81 0.87 *** ***
Non-technological innovation Whether the firm implemented a non-technol. innovation (dummy) 0.40 0.34 0.43 0.55 ***
Labour productivity Log (Turnover [in 1,000 GHc] / Number of employees) 0.37 0.23 0.06 1.08 *** ***
Independent variables
Capital / labour Log (Fix assets [in 1,000 GHc] / Number of employees) 0.26 0.05 -0.12 1.19 *** ***
Entrepreneurship 1 First component of entrepreneurship (PCA) 0.00 -0.36 0.53 0.36 *** ***
Entrepreneurship 2 Second component of entrepreneurship (PCA) 0.00 0.00 -0.17 0.18 **
Size Number of employees (log) 1.78 1.14 2.04 3.13 *** *** ***
Age Age of the firm 15.82 13.01 17.58 21.16 *** *** **
Conurbation Whether the firm is located in Accra or Tema (dummy) 0.50 0.50 0.51 0.48
Skilled employees Employees with specialization degree (%) 0.06 0.04 0.04 0.16 *** ***
Competition Degree of competition in the main market, from low (1) to high (5) 2.40 2.20 2.71 2.59 *** ***
Local Whether the firm predominantly marketed locally (dummy) 0.68 0.78 0.63 0.50 ** *** *
Member of cluster Whether the firm is member of a cluster (dummy) 0.13 0.10 0.09 0.25 *** ***
Subsidized rate loan Whether the firm obtained a subsidized rate loan (dummy) 0.05 0.02 0.05 0.10 ***
Notes: Statistical difference between the different degrees of formality of firms was performed with pairwise comparisons of means with equal variances (Tukey post hoc test). Significance at
the 10 per cent, 5 per cent and 1 per cent levels are indicated by one, two and three asterisks respectively.

19
Table 2: Entrepreneurship: Principal component (eigenvectors) and variable used.
Sample mean Component 1 Component 2
A. I plan tasks carefully 4.20 0.398 -0.055
B. I make up my mind quickly 3.54 0.127 0.715
C. I will pursue my goal despite many failures and oppositions 4.27 0.436 -0.080
D. I am well organised and good at multi-tasking 4.02 0.390 0.088
E. I browse internet a lot and like to meet new people 2.16 0.168 0.630
F. I am fully prepared to take risks 3.94 0.383 -0.088
G. I am always optimistic about my future 4.24 0.396 -0.219
H. A person can get rich by taking risks 3.75 0.389 -0.139
Notes: Responses to all questions are coded on a scale of one to five, with one indicating “strongly disagree” and five “strongly agree”.

20
Table 3: First stage of innovation model: Determinants of innovation (Model I) and
technological and non-technological innovation (Model IIa and IIb)
I IIa IIb
Semi-formal firm 0.260 0.453*** -0.064
(0.189) (0.176) (0.162)
Formal firm 0.576** 0.485** -0.147
(0.291) (0.241) (0.214)
Entrepreneurship 1 0.134*** 0.132*** 0.111***
(0.036) (0.033) (0.036)
Entrepreneurship 2 -0.194** -0.169** 0.009
(0.075) (0.067) (0.064)
Capital/labour 0.031 0.043 0.093*
(0.056) (0.051) (0.050)
Firm size 0.068 0.084 0.162**
(0.079) (0.074) (0.072)
Age -0.001 -0.005 0.015**
(0.009) (0.008) (0.007)
Conurbation 0.451*** 0.205 0.503***
(0.156) (0.139) (0.131)
Local 0.209 0.123 0.274*
(0.186) (0.163) (0.159)
Skilled employees 1.983*** 1.235** 0.902*
(0.712) (0.587) (0.502)
Competition 0.209*** 0.186*** 0.141***
(0.061) (0.057) (0.054)
Subsidized rate loan 0.935** 0.814** 0.898***
(0.427) (0.352) (0.312)
Constant -0.360 -0.423* -1.666***
(0.277) (0.251) (0.254)
Correlation rho (𝜌) 0.089
(0.086)
Wald χ2 80.71*** 166.48***
Correctly classified 81.24% 74.45% 68.86%
Observations 501 501
Notes: Coefficients are reported. Model I was estimated with a probit, while a bivariate probit was used to estimate Model
IIa and IIb. Significance at the 10 per cent, 5 per cent and 1 per cent levels are indicated by one, two and three asterisks
respectively. Robust standard errors are calculated throughout the estimations.
21
Table 4: Second stage of the innovation model: Determinants of firm’s productivity by
innovation (Model I and II) and technological and non-technological innovation (Model III
and IV)
I II III IV
Innovation 1.826*** 3.056***
(0.442) (0.513)
Technological innovation -0.015 0.735
(0.835) (0.871)
Non-technological innovation 3.155** 4.543***
(1.333) (1.629)
Innovation x Semi-formal firm -3.696***
(1.075)
Innovation x Formal firm -10.743***
(3.485)
Technological innovation x Semi-formal firm -2.588
(1.704)
Non-technological innovation x Semi-formal firm -2.949
(2.203)
Technological innovation x Formal firm -5.518**
(2.716)
Non-technological innovation x Formal firm -4.290**
(1.975)
Semi-formal firm -0.445*** 2.424*** -0.293 2.621***
(0.128) (0.894) (0.195) (0.901)
Formal firm -0.295* 9.286*** -0.039 6.183***
(0.168) (3.196) (0.226) (1.993)
Capital/labour 0.499*** 0.477*** 0.423*** 0.450***
(0.040) (0.045) (0.055) (0.058)
Firm size 0.084 0.136** -0.068 0.078
(0.057) (0.068) (0.091) (0.098)
Age -0.002 -0.000 -0.017* -0.013
(0.006) (0.006) (0.009) (0.009)
Conurbation 0.346*** 0.453*** -0.030 0.084
(0.095) (0.107) (0.229) (0.233)
Local -0.134 -0.212* -0.251* -0.325**
(0.110) (0.126) (0.135) (0.146)
Member of cluster -0.244* -0.341** -0.275* -0.335*
(0.133) (0.147) (0.147) (0.178)
Constant -1.180*** -2.095*** -0.290 -1.407***
(0.307) (0.363) (0.403) (0.401)
R-Squared 0.43 0.40 0.35 0.31
Wald χ2 267.86*** 267.71*** 234.49*** 244.69***
Wald test (F) 249.72*** 108.12*** 358.80*** 142.19***
Durbin–Wu–Hausman test 5.63** 30.68*** 27.63*** 50.23***
Observations 501 501 501 501
Notes: Models estimated with a two-stage least squares (2SLS) regression. Variables capturing innovation, technological
innovation, and non-technological innovation were instrumented (including interaction terms). Significance at the 10 per
cent, 5 per cent and 1 per cent levels are indicated by one, two and three asterisks respectively. Robust standard errors are
calculated throughout the estimations.

22
Figure 1: Distribution of labour productivity by level of formality of the firms.

23
Reference
Ayyagari, M., Demirguc-Kunt, A., and Maksimovic, V. (2011). Firm innovation in emerging markets: The role of finance, governance, and competition. Journal of Financial and Quantitative Analysis 46, 1545-1580.
Bell, M., and Pavitt, K. (1992). Accumulating technological capability in developing-countries. World Bank Economic Review, 257-281.
Benjamin, N. C., and Mbaye, A. A. (2012). The informal sector, productivity, and enforcement in West Africa: A firm-level analysis. Review of Development Economics 16, 664-680.
Benjamin, N. C., and Mbaye, A. A. (2014). "Informality, growth, and development in Africa." UNU-WIDER, Helsinki (Finland).
Bhatti, Y., and Ventresca, M. (2012). The emerging market for frugal innovation: Fad, fashion, or fit? Available at SSRN: http://ssrn.com/abstract=2005983.
Bloom, N., Eifert, B., Mahajan, A., McKenzie, D., and Roberts, J. (2013). Does Management Matter? Evidence from India. Quarterly Journal of Economics 128, 1-51.
Bradley, S. W., McMullen, J. S., Artz, K., and Simiyu, E. M. (2012). Capital is not enough: Innovation in developing economies. Journal of Management Studies 49, 684-717.
Bruhn, M., Karlan, D., and Schoar, A. (2010). What capital is missing in developing countries? American Economic Review: Papers & Proceedings 100, 629-33.
Chataway, J., Hanlin, R., and Kaplinsky, R. (2013). Inclusive innovation: An architecture for policy development. IKD Working Paper No. 65.
Chen, M., Sebstad, J., and O'Connell, L. (1999). Counting the invisible workforce: The case of homebased workers. World Development 27, 603-610.
Cohen, W. M., and Levinthal, D. A. (1989). Innovation and learning: The two faces of R&D. The Economic Journal 99, 569-596.
Crepon, B., Duguet, E., and Mairesse, J. (1998). Research, innovation and productivity: An econometric analysis at the firm level. Economics of Innovation and New Technology 7, 115-158.
De Mel, S., McKenzie, D., and Woodruff, C. (2009). "Innovative firms or innovative owners? Determinants of innovation in micro, small, and medium enterprises." The World Bank, Washington DC (US).
Donckels, R., and Fröhlich, E. (1991). Are family businesses really different? European experiences from STRATOS. Family Business Review 4, 149-160.
Drexler, A., Fischer, G., and Schoar, A. (2014). Keeping it simple: Financial literacy and rules of thumb. American Economic Journal: Applied Economics 6, 1-31.
Fagerberg, J., Srholec, M., and Verspagen, B. (2010). Innovation and economic development. In "Handbook of the Economics of Innovation" (H. H. Bronwyn and N. Rosenberg, eds.), Vol. 2, pp. 833-872. North-Holland.
Fransman, M. (1985). Conceptualizing technical change in the Third-World in the 1980s: An Interpretive Survey. Journal of Development Studies 21, 572-652.
Fu, X., and Gong, Y. (2011). Indigenous and foreign innovation efforts and drivers of technological upgrading: Evidence from China. World Development 39, 1213-1225.
Fu, X., Zanello, G., Essegbey, G. O., Hou, J., and Mohnen, P. (2014). "Innovation in low income countries: A survey report." TMCD and DEGRP, Oxford (UK).
Gebreeyesus, M. (2009). Innovation and microenterprises growth in Ethiopia. In "Entrepreneurship, innovation, and economic development" (A. Szirmai, W. A. Naudé and M. Goedhuys, eds.). Oxford University Press, Oxford (UK).
Geroski, P. A. (1989). Entry, innovation and productivity growth. The Review of Economics and Statistics, 572-578.
Goedhuys, M. (2007). Learning, product innovation, and firm heterogeneity in developing countries: Evidence from Tanzania. Industrial and Corporate Change 16, 269-292.
24
Goedhuys, M., Janz, N., and Mohnen, P. (2008). What drives productivity in Tanzanian manufacturing firms: technology or business environment? European Journal of Development Research 20, 199-218.
Goedhuys, M., Janz, N., and Mohnen, P. (2014). Knowledge-based productivity in "low-tech" industries: evidence from firms in developing countries. Industrial and Corporate Change 23, 1-23.
Govindarajan, V., and Ramamurti, R. (2011). Reverse innovation, emerging markets, and global strategy. Global Strategy Journal 1, 191-205.
Grossman, G. M., and Helpman, E. (1991). "Innovation and growth in the global economy," The MIT Press, Cambridge, MA (US).
GSS (2008). "Ghana Living Standards Survey: Report of the 5th round." Ghana Statistical Service, Accra, Ghana.
Gulati, R. (2010). Management Lessons From the Edge. Academy of Management Perspectives 24, 25-27.
Hall, J., Matos, S., Sheehan, L., and Silvestre, B. (2012). Entrepreneurship and innovation at the Base of the Pyramid: A recipe for inclusive growth or social exclusion? Journal of Management Studies 49, 785-812.
Hausman, A. (2005). Innovativeness among small businesses: Theory and propositions for future research. Industrial Marketing Management 34, 773-782.
Institute of Statistical Social and Economic Research (2013). The State of Ghanaian Economy in 2012. Legon University Press, Accra, Ghana.
Jovanovic, B. (1982). Selection and the evolution of industry. Econometrica 50, 649-670. Karlan, D., and Valdivia, M. (2011). Teaching entrepreneurship: Impact of business training on
microfinance clients and institutions. Review of Economics and Statistics 93, 510-527. Keller, W. (1996). Absorptive capacity: On the creation and acquisition of technology in
development. Journal of Development Economics 49, 199-227. Keller, W. (2004). International technology diffusion. Journal of Economic Literature 42, 752-782. Kleinknecht, A., and Mohnen, P. A. (2002). "Innovation and firm performance: Econometric
explorations of survey data," Palgrave, Basingstoke (UK). Klepper, S. (1996). Entry, exit, growth, and innovation over the product life cycle. American
Economic Review 86, 562-583. Kumar, N., and Saqib, M. (1996). Firm size, opportunities for adaptation and in-house R&D activity in
developing countries: The case of Indian manufacturing. Research Policy 25, 713-722. La Porta, R., and Shleifer, A. (2008). "The unofficial economy and economic development." The
Brookings Institution, Washington DC, USA. La Porta, R., and Shleifer, A. (2014). Informality and development. Journal of Economic Perspectives
28, 109-26. Lall, S. (1992). Technological capabilities and industrialization. World Development 20, 165-186. Lundvall, B.-Å., Joseph, K. J., Chaminade, C., and Vang, J. (2010). "Handbook of Innovation Systems
and Developing Countries: Building Domestic Capabilities in a Global Setting," Edward Elgar Publishing, Cheltenham, UK.
Mahemba, C. M., and Bruijn, E. J. (2003). Innovation activities by small and medium-sized manufacturing enterprises in Tanzania. Creativity and Innovation Management 12, 162-173.
Mano, Y., Iddrisu, A., Yoshino, Y., and Sonobe, T. (2012). How can micro and small enterprises in Sub-Saharan Africa become more productive? The impacts of experimental basic managerial training. World Development 40, 458-468.
OECD (2005). "Oslo Manual: Guidelines for collecting and interpreting innovation data," 3rd/Ed. OECD Publishing, Paris.
Oyelaran-Oyeyinka, B., Laditan, G. O. A., and Esubiyi, A. O. (1996). Industrial innovation in Sub-Saharan Africa: The manufacturing sector in Nigeria. Research Policy 25, 1081-1096.
25
Oyelaran-Oyeyinka, B., and Lal, K. (2006). Learning new technologies by small and medium enterprises in developing countries. Technovation 26, 220-231.
Porta, R. L., and Shleifer, A. (2008). "The Unofficial Economy and Economic Development." National Bureau of Economic Research, Washington, DC (USA).
Prahalad, C. K. (2012). Bottom of the Pyramid as a source of breakthrough innovations. Journal of Product Innovation Management 29, 6-12.
Ramani, S. V., Sadre Ghazi, S., and Duysters, G. (2012). On the diffusion of toilets as bottom of the pyramid innovation: Lessons from sanitation entrepreneurs. Technological Forecasting and Social Change 79, 676-687.
Robson, P. J. A., Haugh, H. M., and Obeng, B. A. (2009). Entrepreneurship and innovation in Ghana: Enterprising Africa. Small Business Economics 32, 331-350.
Schneider, F., Buehn, A., and Montenegro, C. E. (2011). Shadow economies all over the world: New estimates for 162 countries from 1999 to 2007. International Economic Journal 24, 443-461.
Trebilcock, A. (2005). "Decent work and the informal economy." UNU-WIDER, Helsinki (Finland). Von Hippel, E. (1998). "The sources of innovation," Oxford University Press, Oxford (UK). Wang, H. C. (2010). Discovering steam power in China, 1840s-1860s. Technology and Culture 51, 31-
54. Zanello, G., Fu, X., Mohnen, P., and Ventresca, M. (2015). The creation and diffusion of innovation in
developing countries: A systematic literature review. Journal of Economic Surveys.

26
APPENDIX A
Table A: First stage of innovation model: Determinants of technological innovation (Model I)
and non-technological innovation (Model II)
I II
Semi-formal firm 0.450** -0.065
(0.176) (0.161)
Formal firm 0.484** -0.152
(0.240) (0.215)
Entrepreneurship 1 0.131*** 0.111***
(0.033) (0.036)
Entrepreneurship 2 -0.168** 0.011
(0.067) (0.064)
Capital/labour 0.043 0.093*
(0.051) (0.051)
Firm size 0.083 0.163**
(0.074) (0.072)
Age -0.005 0.015**
(0.008) (0.007)
Conurbation 0.202 0.501***
(0.139) (0.131)
Local 0.126 0.274*
(0.163) (0.159)
Skilled employees 1.267** 0.903*
(0.590) (0.504)
Competition 0.188*** 0.143***
(0.057) (0.054)
Subsidized rate loan 0.818** 0.897***
(0.350) (0.312)
Constant -0.426* -1.671***
(0.251) (0.255)
Wald χ2 92.20*** 75.34***
Correctly classified 74.45% 68.86%
Observations 501 501
Notes: Model I and II are estimated with a probit.. Coefficients are reported. Significance at the 10 per cent, 5 per cent and 1
per cent levels are indicated by one, two and three asterisks respectively. Robust standard errors are calculated throughout
the estimations.

27
Table B: Second stage of the innovation model: Determinants of firm’s productivity by
technological innovation (Model I and II) and non-technological innovation (Model III and
IV)
I II III IV
Technological innovation 1.750*** 2.891***
(0.419) (0.484)
Non-technological innovation 3.138*** 5.220***
(0.696) (0.942)
Technological innovation x Semi-formal firm -3.320***
(0.959)
Technological innovation x Formal firm -7.126***
(2.173)
Non-technological innovation x Semi-formal firm -5.750***
(1.345)
Non-technological innovation x Formal firm -6.679***
(1.507)
Semi-formal firm -0.561*** 1.826** -0.294** 1.793***
(0.143) (0.751) (0.120) (0.535)
Formal firm -0.320* 5.422*** -0.038 2.667***
(0.172) (1.833) (0.167) (0.658)
Capital/labour 0.493*** 0.484*** 0.423*** 0.482***
(0.041) (0.043) (0.049) (0.050)
Firm size 0.071 0.119* -0.069 0.106
(0.058) (0.066) (0.076) (0.087)
Age -0.000 -0.000 -0.017** -0.009
(0.006) (0.006) (0.007) (0.007)
Conurbation 0.455*** 0.524*** -0.026 0.124
(0.092) (0.100) (0.143) (0.148)
Local -0.088 -0.151 -0.250* -0.251*
(0.106) (0.117) (0.128) (0.135)
Member of cluster -0.257* -0.325** -0.275* -0.321*
(0.134) (0.145) (0.147) (0.182)
Constant -1.030*** -1.728*** -0.297* -1.375***
(0.275) (0.314) (0.167) (0.270)
R-Squared 0.43 0.41 0.36 0.29
Wald χ2 267.11*** 276.62*** 232.92*** 233.17***
Wald test (F) 350.76*** 138.97*** 157.90*** 64.28***
Durbin–Wu–Hausman test 8.98*** 30.92*** 30.31*** 41.84***
Observations 501 501 501 501
Notes: Models estimated with a two-stage least squares (2SLS) regression. Variables capturing innovation, technological
innovation, and non-technological innovation were instrumented (including interaction terms). Significance at the 10 per
cent, 5 per cent and 1 per cent levels are indicated by one, two and three asterisks respectively. Robust standard errors are
calculated throughout the estimations.

28