Preliminary Report on Race and Washington's Criminal ...
49
623 Preliminary Report on Race and Washington’s Criminal Justice System Research Working Group * Task Force on Race and the Criminal Justice System ** * The Research Working Group is grateful to the Report’s co-publishers, the Gonzaga Law Review, 47 GONZ. L. REV. 251 (2012), the Seattle University Law Review, 35 SEATTLE U. L. REV. 623 (2012), and the Washington Law Review, 87 WASH. L. REV. 1 (2012). We would like to thank the members of the Research Working Group for their work in researching and drafting this Report. The team included: Katherine Beckett, Professor, Sociology, University of Washington; Robert Chang, Professor of Law and Director, Korematsu Center, Seattle University School of Law; Julius Debro, Professor Emeritus, Law, Societies and Justice Program, University of Washington; Kerry Fitz-Gerald, Reference Librarian, Seattle University School of Law; Taki Flevaris, Advocacy Fellow, Korematsu Center, Seattle University School of Law; Jason Gillmer, John J. Hemmingson Chair in Civil Liberties, Gonzaga University School of Law; Alexes Harris, Associate Professor, Sociology, University of Washington; Carl McCurley, Manager, Washington State Center for Court Research; David Perez, Assistant Director, Korematsu Center, Seattle Univer- sity School of Law; Charles Reasons, Professor and Department Chair, Law and Justice, Central Washington University; Mary Whisner, Reference Librarian, University of Washington School of Law; and Stephanie Wilson, Head of Reference Services, Seattle University School of Law. We are grateful for the assistance of the Office of Financial Management, the Washington State Center for Court Research, and the Washington Association of Sheriffs and Police Chiefs for providing us with data. ** The primary task force website can be found at Race and Criminal Justice, SEATTLE UNIV. SCH. OF LAW, www.law.seattleu.edu/x8777.xml (last visited Jan. 25, 2012). Organizations and insti- tutions on the Task Force include: Administrative Office of the Courts; American Civil Liberties Union of Washington; Central Washington University; Department of Law and Justice; the Defender Association/Racial Disparity Project; Filipino Lawyers of Washington; Fred T. Korematsu Center for Law and Equality, Seattle University School of Law; Gonzaga University School of Law; the Korean American Bar Association of Washington; Latina/o Bar Association of Washington; Loren Miller Bar Association; Middle Eastern Legal Association of Washington; Mother Attorneys Men- toring Association of Seattle; QLaw: the GLBT Bar Association of Washington; Seattle City Attor- ney’s Office; Seattle University School of Law; University of Washington, College of Arts and Sciences; University of Washington School of Law; Vietnamese American Bar Association of Washington; Washington Defender Association; Washington State Access to Justice Board; Wash- ington State Bar Association; Washington State Commission on Asian Pacific American Affairs; Washington State Commission on Hispanic Affairs; Washington State Criminal Justice Training Commission; Washington State Gender and Justice Commission; Washington State Minority and Justice Commission; Washington Women Lawyers.
Transcript of Preliminary Report on Race and Washington's Criminal ...
623
Preliminary Report on Race and Washington’s Criminal Justice System
Research Working Group* Task Force on Race and the Criminal Justice System**
* The Research Working Group is grateful to the Report’s co-publishers, the Gonzaga Law Review, 47 GONZ. L. REV. 251 (2012), the Seattle University Law Review, 35 SEATTLE U. L. REV. 623 (2012), and the Washington Law Review, 87 WASH. L. REV. 1 (2012). We would like to thank the members of the Research Working Group for their work in researching and drafting this Report. The team included: Katherine Beckett, Professor, Sociology, University of Washington; Robert Chang, Professor of Law and Director, Korematsu Center, Seattle University School of Law; Julius Debro, Professor Emeritus, Law, Societies and Justice Program, University of Washington; Kerry Fitz-Gerald, Reference Librarian, Seattle University School of Law; Taki Flevaris, Advocacy Fellow, Korematsu Center, Seattle University School of Law; Jason Gillmer, John J. Hemmingson Chair in Civil Liberties, Gonzaga University School of Law; Alexes Harris, Associate Professor, Sociology, University of Washington; Carl McCurley, Manager, Washington State Center for Court Research; David Perez, Assistant Director, Korematsu Center, Seattle Univer-sity School of Law; Charles Reasons, Professor and Department Chair, Law and Justice, Central Washington University; Mary Whisner, Reference Librarian, University of Washington School of Law; and Stephanie Wilson, Head of Reference Services, Seattle University School of Law. We are grateful for the assistance of the Office of Financial Management, the Washington State Center for Court Research, and the Washington Association of Sheriffs and Police Chiefs for providing us with data. ** The primary task force website can be found at Race and Criminal Justice, SEATTLE UNIV. SCH. OF LAW, www.law.seattleu.edu/x8777.xml (last visited Jan. 25, 2012). Organizations and insti-tutions on the Task Force include: Administrative Office of the Courts; American Civil Liberties Union of Washington; Central Washington University; Department of Law and Justice; the Defender Association/Racial Disparity Project; Filipino Lawyers of Washington; Fred T. Korematsu Center for Law and Equality, Seattle University School of Law; Gonzaga University School of Law; the Korean American Bar Association of Washington; Latina/o Bar Association of Washington; Loren Miller Bar Association; Middle Eastern Legal Association of Washington; Mother Attorneys Men-toring Association of Seattle; QLaw: the GLBT Bar Association of Washington; Seattle City Attor-ney’s Office; Seattle University School of Law; University of Washington, College of Arts and Sciences; University of Washington School of Law; Vietnamese American Bar Association of Washington; Washington Defender Association; Washington State Access to Justice Board; Wash-ington State Bar Association; Washington State Commission on Asian Pacific American Affairs; Washington State Commission on Hispanic Affairs; Washington State Criminal Justice Training Commission; Washington State Gender and Justice Commission; Washington State Minority and Justice Commission; Washington Women Lawyers.
624 Seattle University Law Review [Vol. 35:623 Gonzaga Law Review Washington Law Review
TABLE OF CONTENTS MESSAGE FROM THE TASK FORCE CO-CHAIRS ............................................... 626 EXECUTIVE SUMMARY .................................................................................... 627 DEFINITIONS ........................................................................................ 630 I. INTRODUCTION .................................................................................... 632 II. RACIAL DISPROPORTIONALITY WITHIN WASHINGTON STATE’S
CRIMINAL JUSTICE SYSTEM ................................................................. 639 III. PROFFERED CAUSES FOR RACIAL DISPROPORTIONALITY .................... 641
A. Crime Commission Rates ............................................................. 641 B. Structural Racism: Facially Neutral Policies with Racially
Disparate Effects ......................................................................... 644 1. Racial Disparity in Juvenile Justice ....................................... 645 2. Prosecutorial Decision-Making ............................................. 647 3. Confinement Sentencing Outcomes ...................................... 648 4. Variability and Ethnic Disparity in the Assessment of
“Legal Financial Obligations” in Washington State Courts .................................................................................... 648
5. Racial and Ethnic Disparity in Pretrial Release Decisions in Washington State Courts ................................... 650
6. Racial Disparity in Drug Law Enforcement .......................... 651 7. Drug-Related Asset Forfeiture Distorts Law
Enforcement Priorities in Washington State .......................... 653 8. Racial Disparity in Traffic Enforcement ................................ 656 9. Racial Disparity in Driving While License Suspended
(DWLS) Cases ....................................................................... 658 10. Summary ................................................................................ 661
C. Bias ................................................................................................. 661 1. Explicit Bias as Reflected in Survey Data ............................. 662 2. Implicit Bias Distorts Decisions Throughout the
Criminal Justice System ........................................................ 663 a. Overview on Implicit Bias .............................................. 663 b. Implicit Biases Are Pervasive ......................................... 664 c. Implicit Bias Research on Race and Crime .................... 665 d. Criminal Investigations and Arrests Are Influenced
by the Race of Potential/Actual Suspects, and Often Are Based on a Faulty Application of Majoritarian Cultural Norms .......................................... 666
e. Determinations of Guilt and Sentencing Likely Are Influenced by the Race of Defendants, in Conjunction with Other Extra-Legal Factors .................. 667
2012] Task Force Report 625
f. Cross-Racial Eyewitness Identification Is Substantially Less Accurate, and Cross-Racial Lineup Construction Is Less Fair .................................... 668
3. Bias and Outcomes .................................................................. 669 IV. CONCLUSION ............................................................................................. 670
626 Seattle University Law Review [Vol. 35:623 Gonzaga Law Review Washington Law Review
MESSAGE FROM THE TASK FORCE CO-CHAIRS We are pleased to present the Preliminary Report on Race and
Washington’s Criminal Justice System, authored by the Research Work-ing Group of the Task Force on Race and the Criminal Justice System. The Research Working Group’s mandate was to investigate dispropor-tionalities in the criminal justice system and, where disproportionalities existed, to investigate possible causes. This fact-based inquiry was de-signed to serve as a basis for making recommendations for changes to promote fairness, reduce disparity, ensure legitimate public safety objec-tives, and instill public confidence in our criminal justice system.
The Task Force came into being after a group of us met to discuss remarks on race and crime reportedly made by two sitting justices on the Washington State Supreme Court. This first meeting was attended by representatives from the Washington State Bar Association, the Washing-ton State Access to Justice Board, the commissions on Minority and Jus-tice and Gender and Justice, all three Washington law schools, leaders from nearly all of the state’s specialty bar associations, and other leaders from the community and the bar.
We agreed that we shared a commitment to ensure fairness in the criminal justice system. We developed working groups, including the Research Working Group, whose Preliminary Report finds that race and racial bias affect outcomes in the criminal justice system and matter in ways that are not fair, that do not advance legitimate public safety objec-tives, and that undermine public confidence in our criminal justice sys-tem. All of our working groups—Oversight, Community Engagement, Research, Recommendations/Implementation, and Education—are coor-dinating together to develop solutions. We are fortunate to have the for-mal participation of a broad range of organizations and institutions, with each week bringing new participants. We also have many people contrib-uting in an individual capacity, including many judges.
We have come together to offer our time, our energy, our expertise, and our dedication to achieve fairness in our criminal justice system.
Sincerely, Justice Steven C. González, Past Chair, Washington State Access to Justice Board Professor Robert S. Chang, Director, Fred T. Korematsu Center for Law and Equality Co-Chairs, Task Force on Race and the Criminal Justice System
2012] Task Force Report 627
EXECUTIVE SUMMARY In 1980, of all states, Washington had the highest rate of dispropor-
tionate minority representation in its prisons.1 Today, minority racial and ethnic groups remain disproportionately represented in Washington State’s court, prison, and jail populations, relative to their share of the state’s general population.2 The fact of racial and ethnic disproportionali-ty in our criminal justice system is indisputable.
Our research focused on trying to answer why these disproportion-alities exist. We examined differential commission rates, facially neutral policies with disparate impacts, and bias as possible contributing causes.
We found that the assertion attributed to then Justice Sanders of the Supreme Court of Washington that “African-Americans are overrepre-sented in the prison population because they commit a disproportionate number of crimes,”3 is a gross oversimplification. Studies of particular Washington State criminal justice practices and institutions find that race and ethnicity influence criminal justice outcomes over and above com-mission rates.4 Moreover, global assertions about differential crime commission rates are difficult to substantiate. Most crime victims do not report crimes and most criminal offenders are never arrested.5 We never truly know exact commission rates.6 Even if arrest rates are used as a proxy for underlying commission rates, 2009 data show that 45% of Washington’s imprisonment disproportionality cannot be accounted for by disproportionality at arrest.7
We reviewed research that focused on particular areas of Washing-ton’s criminal justice system and conclude that much of the dispropor-tionality is explained by facially neutral policies that have racially dis-parate effects. For the areas, agencies, and time periods that were studied, the following disparities were found:
1. Scott Christianson, Corrections Law Developments: Racial Discrimination and Prison Con-finement—A Follow-Up, 16 CRIM. L. BULL. 616, 617 (1980). 2. See discussion infra Part II. 3. Steve Miletich, Two State Supreme Court Justices Stun Some Listeners with Race Com-ments, SEATTLE TIMES (Oct. 21, 2010), http://seattletimes.nwsource.com/html/localnews/20132263 10_justices22m.html. 4. See discussion infra Part III.B. 5. See infra text accompanying note 89. 6. See discussion infra Part III.A. 7. Task Force researchers analyzed 2009 data obtained from the Washington State Association of Sheriffs and Police Chiefs, and then replicated the commission versus disparity figure, originally compiled by Crutchfield et al., and found that 55% of the black-white disproportionality in impris-onment rates is attributable to index crime arrest rates. In other words, 45% of the racial dispropor-tionality in imprisonment cannot be explained by and is not attributable to racial differences in arrest rates. See discussion infra Part III.A.
628 Seattle University Law Review [Vol. 35:623 Gonzaga Law Review Washington Law Review
• Youth of color in the juvenile justice system face harsher sen-tencing outcomes than similarly situated white youth, as well as disparate treatment by probation officers.8
• Defendants of color were significantly less likely than similarly situated white defendants to receive sentences that fell below the standard range.9
• Among felony drug offenders, black defendants were 62% more likely to be sentenced to prison than similarly situated white defendants.10
• With regard to legal financial obligations,11 similarly situated Latino defendants receive significantly greater legal financial obligations than their white counterparts.12
• Disparate treatment exists in the context of pretrial release deci-sions, which systematically disfavors minority defendants.13
• In Seattle, the black arrest rate for delivery of a drug other than marijuana is twenty-one times higher than the white arrest rate for that offense, one of the highest levels of disparity found across the country.14 Research suggests that this disparity does not primarily reflect different levels of involvement with illicit drugs.15
8. George S. Bridges & Sara Steen, Racial Disparities in Official Assessments of Juvenile Offenders: Attributional Stereotypes as Mediating Mechanisms, 63 AM. SOC. REV. 554, 567 (1998); see also discussion infra Part III.B.1. 9. ROBERT D. CRUTCHFIELD ET AL., WASH. STATE MINORITY & JUSTICE COMM’N, WASH. STATE SUPREME COURT, RACIAL/ETHNIC DISPARITIES AND EXCEPTIONAL SENTENCES IN WASHINGTON STATE 72 tbl.13B (1993), available at http://www.courts.wa.gov/committee/pdf/1993 SeptRacia%20EthnicDisparitiesReport.pdf; see also discussion infra Part III.B.2. But see CRUTCHFIELD ET AL., supra, at 72 tbl.13A (showing that whites were significantly more likely than blacks to receive sentences above the standard range). 10. Sara Steen et al., Images of Danger and Culpability: Racial Stereotyping, Case Processing, and Criminal Sentencing, 43 CRIMINOLOGY 435, 451 (2005); see also discussion infra Part III.B.3. 11. See WASH. REV. CODE. § 9.94A.760 (Supp. 2011) (defining a legal financial obligation and when it may be imposed). 12. See discussion infra Part III.B.4. 13. See discussion infra Part III.B.5. 14. KATHERINE BECKETT, RACE AND DRUG LAW ENFORCEMENT IN SEATTLE 56 tbl.10, 57 (2008), available at http://faculty.washington.edu/kbeckett/Race%20and%20Drug%20Law%20En forcement%20in%20Seattle_2008.pdf. 15. See discussion infra Part III.B.6.
2012] Task Force Report 629
• Minority drivers are more likely to be searched by the Washing-ton State Patrol than white motorists, although the rate at which searches result in seizures is highest for whites.16
In all of these areas, facially neutral policies result in disparate treatment of minorities over time.
Implicit and explicit racial bias also contributes to this dispropor-tionality by influencing decision-making within the criminal justice sys-tem.17 Race and racial stereotypes play a role in the judgments and deci-sion-making of human actors within the criminal justice system. The in-fluence of such bias is subtle and often undetectable in any given case, but its effects are significant, cumulative, and observable over time.18 When policymakers determine policy, when official actors exercise dis-cretion, and when citizens proffer testimony or jury service, bias often plays a role.19
To summarize: • We find the assertion that the overrepresentation of black peo-
ple in the Washington State prison system is due solely to dif-ferential crime commission rates inaccurate.
• We find that facially race-neutral policies that have a disparate impact on people of color contribute significantly to disparities in the criminal justice system.
• We find that racial and ethnic bias distorts decision-making at various stages in the criminal justice system, contributing to disparities.
• We find that race and racial bias matter in ways that are not fair, that do not advance legitimate public safety objectives, that produce disparities in the criminal justice system, and that un-dermine public confidence in our legal system.
16. See discussion infra Part III.B.8. 17. See, e.g., Robin S. Engel & Richard Johnson, Toward a Better Understanding of Racial and Ethnic Disparities in Search and Seizure Rates, 34 J. CRIM. JUST. 605, 611–12 (2006); Sandra Graham & Brian S. Lowery, Priming Unconscious Racial Stereotypes About Adolescent Offenders, 28 LAW & HUM. BEHAV. 483, 487, 499 (2004); Richard R. Johnson, Race and Police Reliance on Suspicious Non-Verbal Cues, 30 POLICING: INT’L J. POLICE STRATEGIES & MGMT. 277, 280, 286–87 (2007); Ronald Mazzella & Alan Feingold, The Effects of Physical Attractiveness, Race, Socioeco-nomic Status, and Gender of Defendants and Victims on Judgments of Mock Jurors: A Meta-Analysis, 24 J. APPLIED SOC. PSYCHOL. 1315, 1333 (1994); Laura T. Sweeney & Craig Haney, The Influence of Race on Sentencing: A Meta-Analytic Review of Experimental Studies, 10 BEHAV. SCI. & L. 179, 192–93 (1992). 18. See Elizabeth A. Phelps et al., Performance on Indirect Measures of Race Evaluation Pre-dicts Amygdala Activation, 12 J. COGNITIVE NEUROSCI. 729, 729–30 (2000). 19. See discussion infra Part III.C.
630 Seattle University Law Review [Vol. 35:623 Gonzaga Law Review Washington Law Review
DEFINITIONS
What We Mean by “Disproportionality” and “Disparity” Although the terms disproportionality and disparity often are used
interchangeably, there is an important distinction between these two con-cepts. We have found it useful to distinguish between racial inequities that result from differential crime commission rates and racial inequities that result from practices or policies. In this Report, we use dispropor-tionality to refer to a discrepancy between reference groups’ representa-tion in the general population and in criminal justice institutions. In con-trast, we use disparity when similarly situated groups of individuals are treated differently within those institutions, or to refer to overrepresenta-tion of particular groups in the criminal justice system that stems from criminal justice practices or policies.
What We Mean by “Imprisonment” and “Incarceration” Imprisonment refers to being held in state prisons. Incarceration re-
fers to being held in state prisons or local jails. Many local jails do not collect and report on ethnicity, i.e., whether someone is Latino or of His-panic origin.
What We Mean by “Rate” and “Ratio” When discussing incarceration or imprisonment (as well as other
aspects of the criminal justice system), we often discuss the rate of incar-ceration or imprisonment in comparison to a particular population. Thus, the white incarceration rate is measured by taking the number of whites incarcerated, dividing it by the number of whites in the general popula-tion, and then multiplying by 100,000 to determine the number of whites incarcerated per 100,000 whites in the general population. To compare black and white incarceration, we take the black incarceration rate and divide it by the white incarceration rate—a ratio that provides a useful measure of comparison.
What We Mean by “Race” and “Ethnicity” An inherent problem with race is that not many understand what
“race” means. Widely accepted understandings of race focus on biology, invariably pointing to physical differences among humans that are used
2012] Task Force Report 631
to define, in genetic terms, different racial groups.20 The distinctions that we employ today to categorize humans, such as black, white, and Latino, date back only a few centuries or less.21 These labels do not signal genet-ically separate branches of humankind, for there is only one human race; no other biological race of humanity exists. Racial distinctions are large-ly social constructs based upon perception and history.22
Not only are these distinctions socially constructed, but they are al-so in constant flux and under perpetual siege by those who dispute the arbitrary lines that they draw.23 The problem is compounded by the fact that different institutions use the terms differently. This lack of common nomenclature makes some comparisons difficult. When a term like “Asian” may encompass over two billion individuals, its ability to pre-cisely and accurately describe an individual, much less a group of indi-viduals, becomes challenging. Similar difficulties imperil the classifica-tions of “Hispanic” and “Latino,” which are used to describe not only Dominicans whose descendants may be from Africa,24 but also Argen-tines whose ancestry may be traced to Italy,25 and Peruvians whose fore-fathers may have emigrated from Japan.26 Additionally, these traditional categories have come under increasing strain because one in seven mar-riages within the United States is now “interracial” or “interethnic,” ren-dering single labels less accurate.27
In this Report, we use “race” to refer to groups of people loosely bound together by history, ancestry, and socially significant elements of their physical appearance. For instance, when using the term “Lati-na/o”—which we will use where possible rather than “Hispanic”—we mean to describe those individuals whose ancestry is traced back to Latin America, Spain, and Portugal. This definition contemplates race and eth-nicity as social phenomena, wherein certain characteristics (i.e., history and morphology) are given meanings by society. In this way, race and
20. Ian F. Haney López, The Social Construction of Race: Some Observations on Illusion, Fabrication, and Choice, 29 HARV. C.R.-C.L. L. REV. 1, 6 (1994). 21. Id. at 7–8. 22. Id. 23. Id. 24. Benjamin Bailey, Dominican-American Ethnic/Racial Identities and United States Social Categories, 35 INT’L MIGRATION REV. 677, 677–78 (2001) (“The majority of Dominicans have sub-Saharan African ancestry, which would make them ‘black’ by historical United States ‘one-drop’ rules.” (footnote omitted)). 25. See Samuel L. Baily, Chain Migration of Italians to Argentina: Case Studies of the Agnonesi and the Sirolesi, STUDI EMIGRAZIONE, Mar. 1982, at 73, 75–76. 26. See J. F. NORMANO & ANTONELLO GERBI, THE JAPANESE IN SOUTH AMERICA 3−4 (1943). 27. Susan Saulny, Counting by Race Can Throw off Some Numbers, N.Y. TIMES, Feb. 10, 2011, at A1, available at http://www.nytimes.com/2011/02/10/us/10count.html?scp=1&sq=race%20 counting&st=cse.
632 Seattle University Law Review [Vol. 35:623 Gonzaga Law Review Washington Law Review
ethnicity are not objective observations rooted in biology, but rather self-reinforcing processes rooted in the daily decisions we make as individu-als and as institutions. Although socially constructed and enacted, race and ethnicity have important consequences for people’s lived experienc-es.
What We Mean by “Structural Racism” A structurally racist system can be understood best as a system in
which a society’s institutions are embedded with a network of policies and practices that, overtly or subtly, advantage one racial group over an-other, thereby facilitating racially disparate outcomes. Within such sys-tems, notions and stereotypes about race and ethnicity shape actors’ iden-tities, beliefs, attitudes, and value orientations.28 In turn, individuals in-teract and behave in ways that reinforce these stereotypes. Thus, even with facially race-neutral policies, implementation decisions are in-formed by actors’ understandings (or lack thereof) about race and eth-nicity, often leading to disparities in treatment of people of color. As a consequence, structural racism produces cumulative and persistent racial and ethnic inequalities.29
Racism should not be viewed as an ideology or an orientation to-ward a certain group but instead as a system: “[A]fter a society becomes racialized, racialization develops a life of its own. Although it interacts with class and gender structurations in the social system, it becomes an organizing principle of social relations itself.”30 The persistent inequality experienced by blacks and other people of color in America is, in part, the result of this racial structure.31 The contemporary racial structure is distinct from that of the past in that it is covert, is embedded within the regular practices of institutions, does not rely on a racial vocabulary, and is invisible to most whites.32
I. INTRODUCTION Washington State has a mixed history when it comes to its treat-
ment of racial and ethnic minorities. It was founded through the dis-
28. Eduardo Bonilla-Silva, Rethinking Racism: Toward a Structural Interpretation, 62 AM. SOC. REV. 465, 475–76 (1997). 29. Id. at 475. 30. Id. 31. Id. 32. Id. at 467.
2012] Task Force Report 633
placement of its native peoples by legal and extralegal means.33 Washing-ton’s early history included severe anti-immigrant sentiment expressed first toward Chinese immigrants34 and then Japanese immigrants, who were the target of the state’s Alien Land Laws.35 Yet unlike other states that instituted de jure segregation of schools and severely limited partici-pation in the legal system,36 Washington did not mandate school segrega-tion by law and was the only western state that did not ban interracial marriage.37 In fact, Washington became so well known for its openness that interracial couples would often travel there solely to get married.38 A ready coalition of four distinct racial minorities—blacks, Chinese, Filipi-nos, and Japanese—worked together during the 1930s to defeat various policies that targeted racial minorities.39 These initial campaigns laid the groundwork for future collaboration that would cut across racial lines.40
Despite this coalition, troubling manifestations of racial discrimina-tion in the public and private spheres continued, demonstrating that Washington was hardly immune to racial bias. For instance, in March 1942, 14,400 persons of Japanese descent lived in Washington, including 33. See generally 31 HUBERT HOWE BANCROFT, HISTORY OF WASHINGTON, IDAHO, AND MONTANA 1845–1889 (S.F., The History Co. 1890). 34. See, e.g., DOUG CHIN, SEATTLE’S INTERNATIONAL DISTRICT: THE MAKING OF A PAN-ASIAN AMERICAN COMMUNITY 22 (2001) (documenting the 1886 attempted forcible removal of 350 Chinese immigrants from Seattle); ROGER DANIELS, ASIAN AMERICA: CHINESE AND JAPANESE IN THE UNITED STATES SINCE 1850, at 59–60 (1988) (documenting the forcible removal of Chinese from Tacoma throughout 1885 and 1886). 35. See Mark L. Lazarus III, An Historical Analysis of Alien Land Law: Washington Territory & State 1853-1889, 12 U. PUGET SOUND L. REV. 197, 235–36 (1989). 36. See, e.g., CAL. EDUC. CODE §§ 8003, 8004 (Deering 1944) (repealed 1947) (authorizing the segregation of children of Chinese, Japanese, or Mongolian parentage, and Indians under certain circumstances); People v. Hall, 4 Cal. 399 (1854) (interpreting a statute that excluded “Blacks” and “Indians” from testifying against white defendants, and classifying Chinese persons as either “Indi-an” or “Black” in order to exclude the testimony of a Chinese witness against the white defendant). 37. Stefanie Johnson, Blocking Racial Intermarriage Laws in 1935 and 1937: Seattle’s First Civil Rights Coalition, SEATTLE C.R. & LAB. HIST. PROJECT (2005), http://depts.washington.edu/ civilr/antimiscegenation.htm. The Washington Territory, however, did ban interracial marriage from 1866-1868. Act of Jan. 20, 1866, § 2(3), 1865-1866 Wash. Sess. Laws 80, 81 (“Marriages . . . are prohibited . . . [w]hen either of the parties is a white person and the other a negro or Indian, or a person of one-half or more negro or Indian blood.”), repealed by Act of Jan. 23, 1868, § 1, 1867-1868 Wash. Sess. Laws 47, 47-48; Act of Jan. 29, 1855, § 1, 1854-1855 Wash. Sess. Laws 33, 33 (“[A]ll marriages heretofore solemnized in this territory, where one of the parties to such marriage shall be a white person, and the other possessed of one-fourth or more negro blood, or more than one-half Indian blood, are hereby declared void.”). 38. RONALD TAKAKI, STRANGERS FROM A DIFFERENT SHORE: A HISTORY OF ASIAN AMERICANS 342 (1989). 39. Johnson, supra note 37 (“Four distinct racial minorities—blacks, Filipinos, Japanese, and Chinese—dominated the Seattle’s [sic] civil rights politics over the 1930s, and each group brought something different to the political table . . . .”). 40. Id. (“The 1935 and 1937 campaigns laid the groundwork for future multi-ethnic collabora-tion on subsequent civil rights and progressive issues.”).
634 Seattle University Law Review [Vol. 35:623 Gonzaga Law Review Washington Law Review
9600 in King County alone.41 Of these, nearly 13,000 were incarcerated and placed into internment camps.42 Over 30% of those forcibly removed from Seattle never returned to their homes.43 After World War II, Seat-tle’s black population experienced its own backlash, as restrictive cove-nants and other forms of housing discrimination proliferated throughout Washington between 1940 and 1960.44 These covenants were so effective in Seattle that they functionally concentrated 78% of the black communi-ty into the area known as the “Central District.”45 While residential dis-crimination is no longer sanctioned by the law, its effects continue to re-verberate even today.46
Even after Japanese American incarceration ended and residential discrimination became less overt, one area continued to produce racialized outcomes: the criminal justice system. In 1980, scholar Scott Christianson published findings showing that Washington led the nation in disproportionate imprisonment of blacks.47 While every state dispro-portionately imprisoned blacks, the overrepresentation of blacks relative to the size of the black population was greatest in Washington.48 In a 2005 report discussing Christianson’s finding, Robert Crutchfield found that while blacks in 1980 constituted approximately 28% of the prison population, they constituted approximately 3% of the general popula-tion.49 The black share of the prison population was more than nine times greater than the black share of the general population.50 Nationally, the black share of the prison population was four times greater than the black share of the general population.51
41. DAVID A. TAKAMI, DIVIDED DESTINY: A HISTORY OF JAPANESE AMERICANS IN SEATTLE 46 (1998). 42. Id. at 50. 43. Robert S. Chang & Catherine E. Smith, John Calmore’s America, 86 N.C. L. REV. 739, 748–49 (2008). 44. QUINTARD TAYLOR, THE FORGING OF A BLACK COMMUNITY: SEATTLE’S CENTRAL DISTRICT FROM 1870 THROUGH THE CIVIL RIGHTS ERA 178–80 (1994). 45. Id. at 179. 46. Henry W. McGee, Jr., Seattle’s Central District, 1990-2006: Integration or Displacement?, 39 URB. LAW. 167, 214–16 (2007). 47. Christianson, supra note 1. 48. Id. at 616. 49. See Exhibit 2: Declaration and Report of Robert D. Crutchfield, Ph.D. at 244–45, Farra-khan v. Gregoire, No. 2:96-cv-00076-RHW (E.D. Wash. Jan. 27, 2006), ECF No. 233-4, available at http://moritzlaw.osu.edu/electionlaw/litigation/documents/exhibitsstatementofmaterialfactspart3. pdf. 50. Id. 51. Id.
2012] Task Force Report 635
Christianson’s findings sparked a firestorm of concern among poli-cymakers, researchers, and citizens in Washington State.52 The state leg-islature responded by commissioning a study to determine whether racial disparity existed in Washington’s criminal justice system.53 The 1986 Crutchfield and Bridges study was the first in a series of studies over the last twenty-five years to find that racial bias exists at various points in Washington’s criminal justice system.54 In particular, this first study found that race affects the processing of felony cases in Washington State, even after controlling for legally relevant factors.55 That is, all things being equal, outcomes were worse for defendants who were black than for defendants who were white.56
In the wake of the 1986 Crutchfield and Bridges report, the state legislature established the Washington State Minority and Justice Task Force to study “the treatment of minorities in the state court system, to recommend reforms and to provide an education program for the judici-ary.”57 Among other findings, the 1990 report concluded that minorities perceive “that bias pervades the entire legal system in general and hence [minorities] do not trust the court system to resolve their disputes or ad-minister justice evenhandedly.”58 In particular, this perception of bias extended to criminal proceedings, where minorities reported that they received disparate treatment from prosecutors, law enforcement authori-ties, and public defenders.59 The report concluded that more research was needed to determine how race affects individual experiences with various aspects of Washington’s criminal justice system, such as pretrial release, bail, prosecutorial discretion, and quality of counsel.60
52. The Washington State Legislature began to focus on racial disproportionality within the criminal justice system after Christianson’s 1980 report came out. In response, the legislature com-missioned the original Crutchfield and Bridges study of 1986, which spawned many of the other studies cited in this Report. Cumulatively, these studies make Washington one of the most, if not the most studied state when it comes to racial disproportionality in the criminal justice system. See id. at 244. 53. Id. 54. Id. 55. GEORGE S. BRIDGES & ROBERT D. CRUTCHFIELD, INST. FOR PUB. POLICY & MGMT., UNIV. OF WASH., RACIAL AND ETHNIC DISPARITIES IN IMPRISONMENT 26 (1986). 56. Id. at 34. 57. CHARLES Z. SMITH, WASH. STATE MINORITY & JUSTICE TASK FORCE, WASH. STATE SUPREME COURT, FINAL REPORT, at xxi (1990), available at http://www.courts.wa.gov/committee/ pdf/TaskForce.pdf. 58. Id. at 10. 59. Id. at 25–33. 60. Id. at 21–22.
636 Seattle University Law Review [Vol. 35:623 Gonzaga Law Review Washington Law Review
Decades later, the perception that racial bias permeates the criminal justice system persists.61 But now there is substantial evidence to support the notion that racial inequities do permeate the criminal justice system. Subsequent studies commissioned since 1986 have confirmed that Wash-ington cannot justify its disproportionate minority incarceration rates on the sole basis that minorities commit more crimes.62 For instance, the extant research concerning the Washington State Patrol suggests that race does not affect police discretion with regard to stops but does affect searches.63 Other research indicates that Seattle drug arrest patterns and outcomes are shaped by race.64 Another study found that even after con-trolling for legally relevant factors, racial differences affect how cases are processed: minorities were more likely than whites to be held in cus-tody prior to trial, less likely than whites to be released on personal re-cognizance following arrest, and more likely to receive monetary bail.65 While these and other studies have focused on different decision-making points in the criminal justice system, one troubling conclusion, in par-
61. See, e.g., SAM PAILCA, OFFICE OF PROF’L ACCOUNTABILITY, SEATTLE POLICE DEP’T, REPORT ON SEATTLE’S RESPONSE TO CONCERNS ABOUT RACIALLY BIASED POLICING 1 (2003), available at http://www.seattle.gov/police/opa/Docs/BiasedPolicing.pdf (discussing the widespread perception that racial bias exists in law enforcement). 62. See Exhibit 2: Declaration and Report of Robert D. Crutchfield, Ph.D., supra note 49, at 237–40. 63. See, e.g., NICHOLAS P. LOVRICH ET AL., DIV. OF GOV’TL STUDIES & SERVS., WASH. STATE UNIV., REPORT TO THE WASHINGTON STATE PATROL 23, 42–43 (2007) [hereinafter LOVRICH ET AL., 2007 WSP REPORT], available at http://www.wsp.wa.gov/publications/reports/wsu_2007_report.pdf (finding that police stops involving blacks, Native-Americans, and Hispanics are more likely to result in searches); NICHOLAS P. LOVRICH ET AL., DIV. OF GOV’TL STUDIES & SERVS., WASH. STATE UNIV., ANALYSIS OF TRAFFIC STOP DATA COLLECTED BY THE WASHINGTON STATE PATROL 2 (2005), available at http://www.policeforum.org/library/racially-biased-policing/supplementalresour ces/wsu_2005_report[1].pdf (finding the same); NICHOLAS LOVRICH ET AL., DIV. OF GOV’TL STUDIES & SERVS., WASH. STATE UNIV., WSP TRAFFIC STOP DATA ANALYSIS PROJECT REPORT 2–3 (2003) [hereinafter LOVRICH ET AL., 2003 WSP REPORT], available at http://citeseerx.ist.psu.edu/ viewdoc/download?doi=10.1.1.102.7223&rep=rep1&type=pdf (finding the same). 64. Katherine Beckett et al., Race, Drugs, and Policing: Understanding Disparities in Drug Delivery Arrests, 44 CRIMINOLOGY 105, 119, 129 (2006) [hereinafter Beckett et al., Race, Drugs, and Policing] (concluding that racially disproportionate drug arrest rates in Seattle cannot be ex-plained by comparing commission rates, but rather are the result of police practices that have a ra-cially disparate impact); Katherine Beckett et al., Drug Use, Drug Possession Arrests, and the Ques-tion of Race: Lessons from Seattle, 52 SOC. PROBS. 419, 435–36 (2005) [hereinafter Beckett et al., Lessons from Seattle] (concluding the same). 65. GEORGE S. BRIDGES, WASH. STATE MINORITY & JUSTICE COMM’N, WASH. STATE SUPREME COURT, A STUDY ON RACIAL AND ETHNIC DISPARITIES IN SUPERIOR COURT BAIL AND PRE-TRIAL DETENTION PRACTICES IN WASHINGTON 52–53 (1997), available at http://www.courts. wa.gov/committee/pdf/1997_ResearchStudy.pdf.
2012] Task Force Report 637
ticular, underlies each study’s findings: when it comes to Washington State’s criminal justice system, race matters.
Given this state’s history and the evidence demonstrating the im-portance of race in the criminal justice system, members of the commu-nity were understandably concerned when two sitting Washington State Supreme Court Justices opined on October 7, 2010 that racial minorities are overrepresented in the prison population solely because they commit more crimes and not because any bias exists in the criminal justice sys-tem.66 The comments themselves betrayed a common misunderstanding about whether this issue is more complex than a cursory review of cer-tain crime conviction rates might imply. Conviction rates are not a valid proxy for commission rates.
In the wake of these comments, concerned community members came together to form the Task Force on Race and the Criminal Justice System. We met because the simplistic notion that black overrepresenta-tion in our prisons occurs because blacks commit more crimes did not fit with our sense of how racial and ethnic minorities are treated in today’s society and in our criminal justice system. We realized quickly, though, that it was important not to proceed on assumptions that unfair treatment existed.
The Task Force divided into five working groups: Oversight, Community Engagement, Research, Recommendations/Implementation, and Education. The Research Working Group’s mandate was to investi-gate disproportionalities in the criminal justice system and, where dis-proportionalities existed, investigate possible causes. This fact-based in-quiry was designed to serve as a basis for recommending changes that would promote fairness, reduce disparity, ensure legitimate public safety objectives, and instill public confidence in our criminal justice system. As we engaged in this work, the Research Working Group reported back to the broader Task Force. Our membership grew as more and more or-ganizations and institutions recognized the importance of this issue, not just for the affected racial and ethnic groups, but also for the best aspira-tions we have as a state. One measure of the goodwill of the people of the State of Washington is the broad range of organizations and individu-als who have joined the Task Force, for what all of us have come to real-ize is a multi-year project.
For this Report, the Research Working Group reviewed evidence on disproportionality in Washington’s criminal justice system and consid-ered whether crime commission rates accounted for this disproportionali-ty. We found that crime commission rates by race and ethnicity are large-
66. Miletich, supra note 3.
638 Seattle University Law Review [Vol. 35:623 Gonzaga Law Review Washington Law Review
ly unknown and perhaps unknowable, but that some researchers simply take arrest rates as good proxies for underlying commission rates for all crimes.67 We found that use of arrest rates likely overstates black crime commission rates for several reasons.68 But even if arrest rates are used as a proxy for underlying crime commission rates, the extent of racial disproportionality is not explained by commission rates. In 1982, 80% of black imprisonment in Washington for serious crimes could not be ac-counted for based on arrest rates, though by 2009, this had dropped to 45%.69
We then identified and synthesized research on nine issues for which evidence exists regarding the causes of Washington’s dispropor-tionality: (1) juvenile justice; (2) prosecutorial decision-making; (3) sen-tencing outcomes; (4) legal financial obligations (“LFOs”); (5) pretrial release; (6) drug enforcement; (7) asset forfeiture; (8) traffic enforce-ment; and (9) prosecution for Driving While License Suspended (“DWLS”). In each of these areas, the research, data, and findings per-tain specifically to Washington State.70
We also reviewed research regarding bias, especially research on unconscious or implicit bias. We found that cognitive neuroscience and social psychology help us to better understand the existence and behav-ioral consequences of unconscious or implicit racism.71
The evidence we gathered demonstrates that within Washington State’s criminal justice system, race and ethnicity matter in ways that are inconsistent with fairness, that do not advance legitimate public safety objectives, and that undermine public confidence.
Part II presents the Working Group’s findings and data regarding racial disproportionality within Washington State’s criminal justice sys-tem. Part III discusses three possible causes for this disproportionality. Part III.A discusses differential commission rates, concluding that this factor alone cannot account for the disproportionality observed in the
67. See, e.g., Alfred Blumstein, On the Racial Disproportionality of United States’ Prison Populations, 73 J. CRIM. L. & CRIMINOLOGY 1259, 1264 (1982). 68. For instance, because most black victims identify their assailants as black, and because black victims have a higher reporting rate generally, crimes involving black suspects are more likely to receive police attention. See discussion infra Part III.A. 69. Robert D. Crutchfield et al., Analytical and Aggregation Biases in Analyses of Imprison-ment: Reconciling Discrepancies in Studies of Racial Disparity, 31 J. RES. CRIME & DELINQ. 166, 179 (1994); see also discussion infra Part III.A. 70. The informational resources and preliminary findings were made available to the Recom-mendations and Implementation Working Group to help inform their policy recommendations. 71. See, e.g., Phelps et al., supra note 18.
2012] Task Force Report 639
criminal justice system. Part III.B discusses seven racially neutral poli-cies that have racially disparate effects, and thus help explain racial dis-proportionality. Finally, Part III.C discusses bias, whether explicit or im-plicit, and how it produces racial disparity.
II. RACIAL DISPROPORTIONALITY WITHIN WASHINGTON STATE’S CRIMINAL JUSTICE SYSTEM
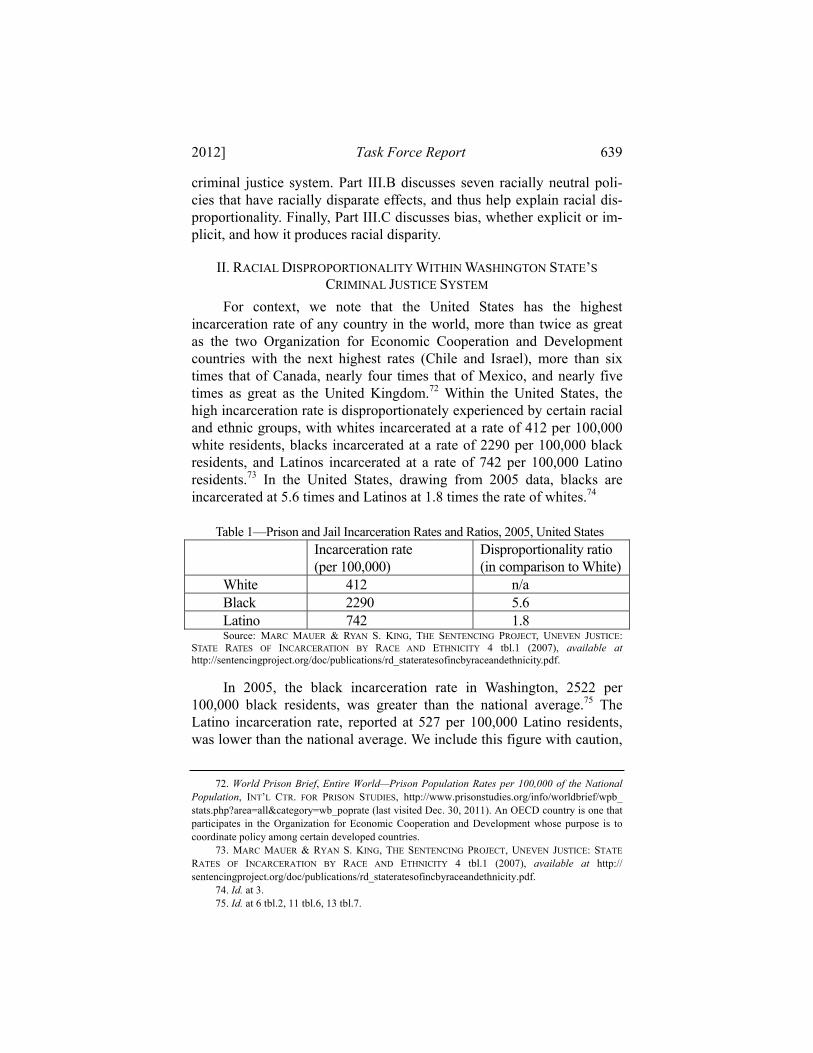
For context, we note that the United States has the highest incarceration rate of any country in the world, more than twice as great as the two Organization for Economic Cooperation and Development countries with the next highest rates (Chile and Israel), more than six times that of Canada, nearly four times that of Mexico, and nearly five times as great as the United Kingdom.72 Within the United States, the high incarceration rate is disproportionately experienced by certain racial and ethnic groups, with whites incarcerated at a rate of 412 per 100,000 white residents, blacks incarcerated at a rate of 2290 per 100,000 black residents, and Latinos incarcerated at a rate of 742 per 100,000 Latino residents.73 In the United States, drawing from 2005 data, blacks are incarcerated at 5.6 times and Latinos at 1.8 times the rate of whites.74
Table 1—Prison and Jail Incarceration Rates and Ratios, 2005, United States
Incarceration rate (per 100,000)
Disproportionality ratio (in comparison to White)
White 412 n/a Black 2290 5.6 Latino 742 1.8 Source: MARC MAUER & RYAN S. KING, THE SENTENCING PROJECT, UNEVEN JUSTICE:
STATE RATES OF INCARCERATION BY RACE AND ETHNICITY 4 tbl.1 (2007), available at http://sentencingproject.org/doc/publications/rd_stateratesofincbyraceandethnicity.pdf.
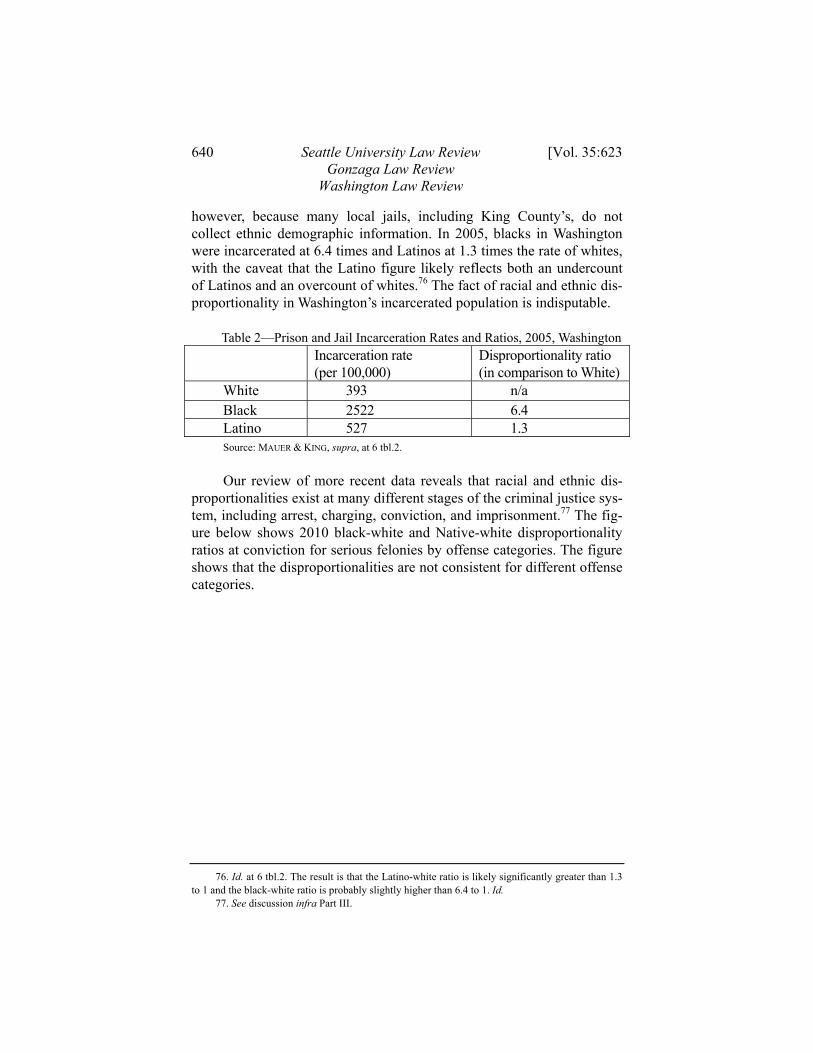
In 2005, the black incarceration rate in Washington, 2522 per
100,000 black residents, was greater than the national average.75 The Latino incarceration rate, reported at 527 per 100,000 Latino residents, was lower than the national average. We include this figure with caution, 72. World Prison Brief, Entire World—Prison Population Rates per 100,000 of the National Population, INT’L CTR. FOR PRISON STUDIES, http://www.prisonstudies.org/info/worldbrief/wpb_ stats.php?area=all&category=wb_poprate (last visited Dec. 30, 2011). An OECD country is one that participates in the Organization for Economic Cooperation and Development whose purpose is to coordinate policy among certain developed countries. 73. MARC MAUER & RYAN S. KING, THE SENTENCING PROJECT, UNEVEN JUSTICE: STATE RATES OF INCARCERATION BY RACE AND ETHNICITY 4 tbl.1 (2007), available at http:// sentencingproject.org/doc/publications/rd_stateratesofincbyraceandethnicity.pdf. 74. Id. at 3. 75. Id. at 6 tbl.2, 11 tbl.6, 13 tbl.7.
640 Seattle University Law Review [Vol. 35:623 Gonzaga Law Review Washington Law Review
however, because many local jails, including King County’s, do not collect ethnic demographic information. In 2005, blacks in Washington were incarcerated at 6.4 times and Latinos at 1.3 times the rate of whites, with the caveat that the Latino figure likely reflects both an undercount of Latinos and an overcount of whites.76 The fact of racial and ethnic dis-proportionality in Washington’s incarcerated population is indisputable.
Table 2—Prison and Jail Incarceration Rates and Ratios, 2005, Washington Incarceration rate
(per 100,000) Disproportionality ratio (in comparison to White)
White 393 n/a Black 2522 6.4 Latino 527 1.3 Source: MAUER & KING, supra, at 6 tbl.2. Our review of more recent data reveals that racial and ethnic dis-
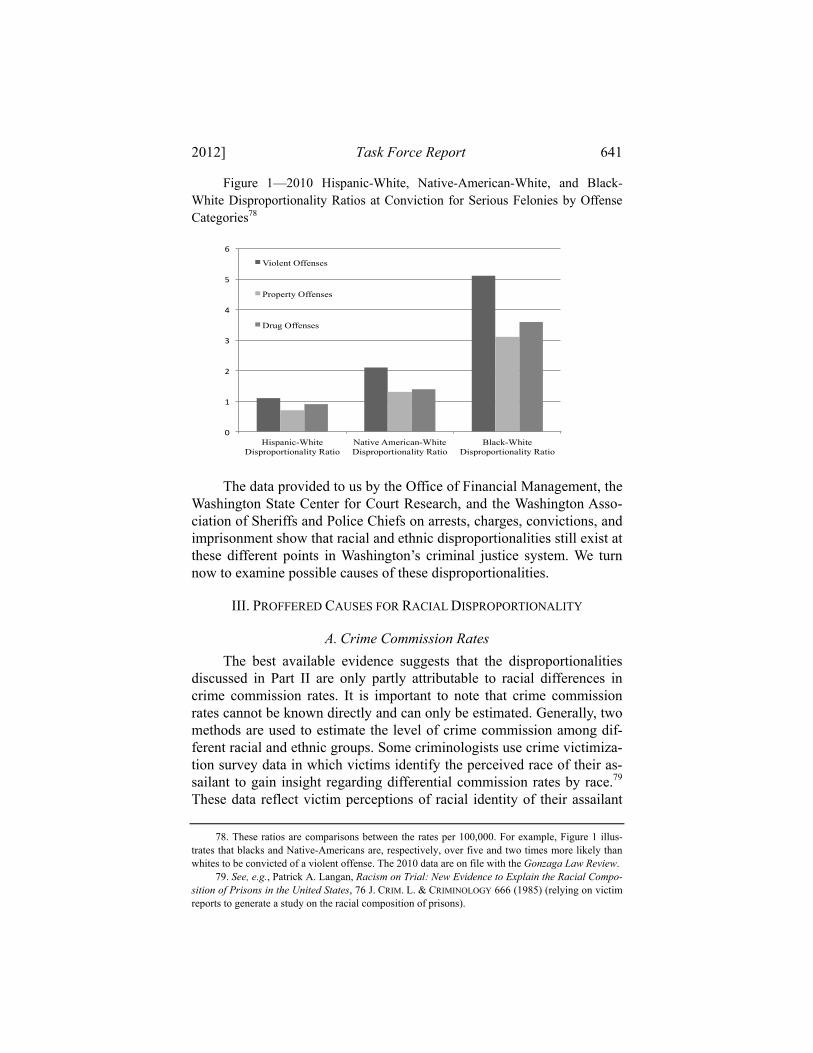
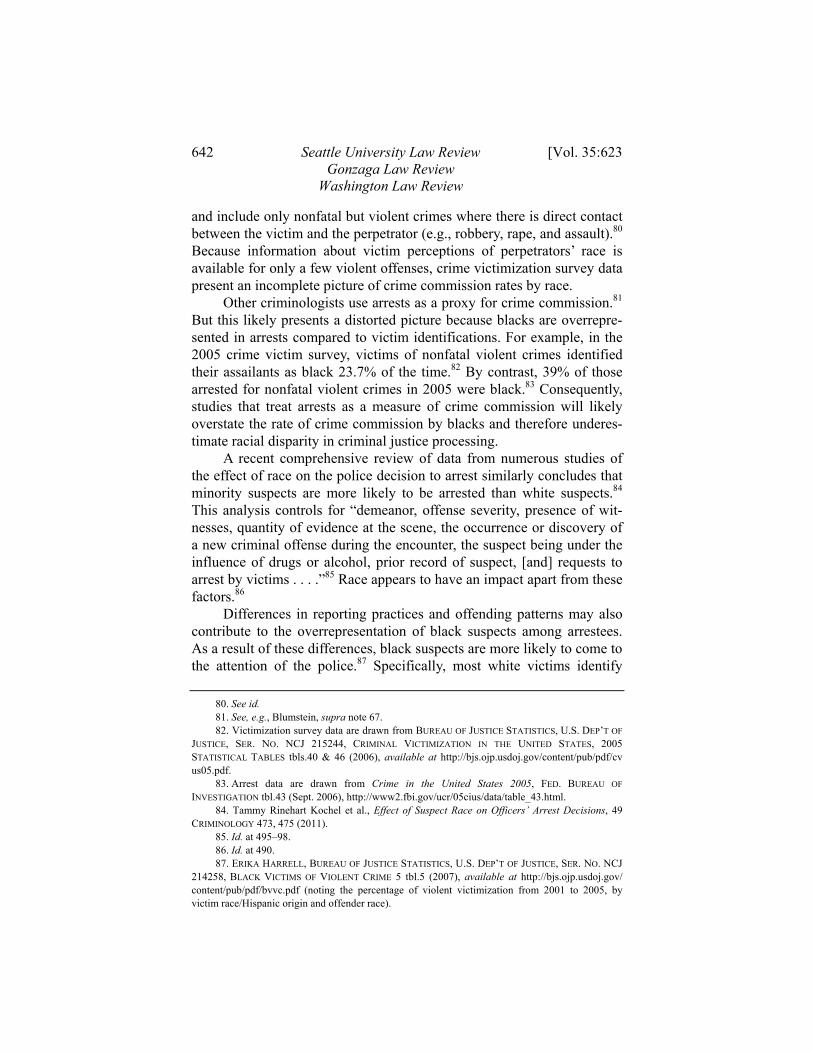
proportionalities exist at many different stages of the criminal justice sys-tem, including arrest, charging, conviction, and imprisonment.77 The fig-ure below shows 2010 black-white and Native-white disproportionality ratios at conviction for serious felonies by offense categories. The figure shows that the disproportionalities are not consistent for different offense categories.
76. Id. at 6 tbl.2. The result is that the Latino-white ratio is likely significantly greater than 1.3 to 1 and the black-white ratio is probably slightly higher than 6.4 to 1. Id. 77. See discussion infra Part III.
2012] Task Force Report 641
Figure 1—2010 Hispanic-White, Native-American-White, and Black-White Disproportionality Ratios at Conviction for Serious Felonies by Offense Categories78
The data provided to us by the Office of Financial Management, the Washington State Center for Court Research, and the Washington Asso-ciation of Sheriffs and Police Chiefs on arrests, charges, convictions, and imprisonment show that racial and ethnic disproportionalities still exist at these different points in Washington’s criminal justice system. We turn now to examine possible causes of these disproportionalities.
III. PROFFERED CAUSES FOR RACIAL DISPROPORTIONALITY
A. Crime Commission Rates The best available evidence suggests that the disproportionalities
discussed in Part II are only partly attributable to racial differences in crime commission rates. It is important to note that crime commission rates cannot be known directly and can only be estimated. Generally, two methods are used to estimate the level of crime commission among dif-ferent racial and ethnic groups. Some criminologists use crime victimiza-tion survey data in which victims identify the perceived race of their as-sailant to gain insight regarding differential commission rates by race.79 These data reflect victim perceptions of racial identity of their assailant 78. These ratios are comparisons between the rates per 100,000. For example, Figure 1 illus-trates that blacks and Native-Americans are, respectively, over five and two times more likely than whites to be convicted of a violent offense. The 2010 data are on file with the Gonzaga Law Review. 79. See, e.g., Patrick A. Langan, Racism on Trial: New Evidence to Explain the Racial Compo-sition of Prisons in the United States, 76 J. CRIM. L. & CRIMINOLOGY 666 (1985) (relying on victim reports to generate a study on the racial composition of prisons).
0�
1�
2�
3�
4�
5�
6�
Hispanic-White Disproportionality Ratio
Native American-White Disproportionality Ratio
Black-White Disproportionality Ratio
Violent Offenses
Property Offenses
Drug Offenses
642 Seattle University Law Review [Vol. 35:623 Gonzaga Law Review Washington Law Review
and include only nonfatal but violent crimes where there is direct contact between the victim and the perpetrator (e.g., robbery, rape, and assault).80 Because information about victim perceptions of perpetrators’ race is available for only a few violent offenses, crime victimization survey data present an incomplete picture of crime commission rates by race.
Other criminologists use arrests as a proxy for crime commission.81 But this likely presents a distorted picture because blacks are overrepre-sented in arrests compared to victim identifications. For example, in the 2005 crime victim survey, victims of nonfatal violent crimes identified their assailants as black 23.7% of the time.82 By contrast, 39% of those arrested for nonfatal violent crimes in 2005 were black.83 Consequently, studies that treat arrests as a measure of crime commission will likely overstate the rate of crime commission by blacks and therefore underes-timate racial disparity in criminal justice processing.
A recent comprehensive review of data from numerous studies of the effect of race on the police decision to arrest similarly concludes that minority suspects are more likely to be arrested than white suspects.84 This analysis controls for “demeanor, offense severity, presence of wit-nesses, quantity of evidence at the scene, the occurrence or discovery of a new criminal offense during the encounter, the suspect being under the influence of drugs or alcohol, prior record of suspect, [and] requests to arrest by victims . . . .”85 Race appears to have an impact apart from these factors.86
Differences in reporting practices and offending patterns may also contribute to the overrepresentation of black suspects among arrestees. As a result of these differences, black suspects are more likely to come to the attention of the police.87 Specifically, most white victims identify 80. See id. 81. See, e.g., Blumstein, supra note 67. 82. Victimization survey data are drawn from BUREAU OF JUSTICE STATISTICS, U.S. DEP’T OF JUSTICE, SER. NO. NCJ 215244, CRIMINAL VICTIMIZATION IN THE UNITED STATES, 2005 STATISTICAL TABLES tbls.40 & 46 (2006), available at http://bjs.ojp.usdoj.gov/content/pub/pdf/cv us05.pdf. 83. Arrest data are drawn from Crime in the United States 2005, FED. BUREAU OF INVESTIGATION tbl.43 (Sept. 2006), http://www2.fbi.gov/ucr/05cius/data/table_43.html. 84. Tammy Rinehart Kochel et al., Effect of Suspect Race on Officers’ Arrest Decisions, 49 CRIMINOLOGY 473, 475 (2011). 85. Id. at 495–98. 86. Id. at 490. 87. ERIKA HARRELL, BUREAU OF JUSTICE STATISTICS, U.S. DEP’T OF JUSTICE, SER. NO. NCJ 214258, BLACK VICTIMS OF VIOLENT CRIME 5 tbl.5 (2007), available at http://bjs.ojp.usdoj.gov/ content/pub/pdf/bvvc.pdf (noting the percentage of violent victimization from 2001 to 2005, by victim race/Hispanic origin and offender race).
2012] Task Force Report 643
their assailants as white, and most black victims identify their assailants as black.88 Over half of violent crimes and over 60% of property crimes are not reported by victims to the police.89 Higher reporting rates among black victims mean that crimes involving black suspects are more likely to come to the attention of the police.90
But even if we use arrest rates as a proxy for crime commission, there remains a very significant disproportionality at imprisonment that is not accounted for by arrest rates. A 1994 study by Crutchfield, Bridg-es, and Pitchford compared black-white disproportionality in 1982 index crime arrests and incarceration rates, and found that differential rates of crime commission (as measured by arrest) explained only 19.3% of the black-white disproportionality in Washington State prisons.91 Using 2009 data obtained from the Washington State Association of Sheriffs and Po-lice Chiefs, we replicated the Crutchfield et al. analysis and found that 55% of the black-white disproportionality in imprisonment rates is at-tributable to index crime arrest rates.92 In other words, 45% of the racial disproportionality in imprisonment is not attributable to racial differences in arrest rates. Thus, it appears that a larger share of disproportionality in confinement rates stems from arrest patterns than was the case in 1982.
However, the 55% figure should not be interpreted as evidence that differences in crime commission rates explain over half of the overrepre-sentation of blacks in state prisons for several reasons.93 First, this inter-pretation assumes arrests are an accurate measure of crime, but it is like-ly that they overrepresent people of color for the reasons stated above. In particular, arrest data probably overrepresent black suspects.94 In addi-tion, Latinos are not identified as such in the arrest and incarceration data
88. Id. 89. JENNIFER L. TRUMAN & MICHAEL R. RAND, BUREAU OF JUSTICE STATISTICS, U.S. DEP’T OF JUSTICE, SER. NO. NCJ 231327, CRIMINAL VICTIMIZATION, 2009, at 9 tbl.12 (2010), available at http://bjs.ojp.usdoj.gov/content/pub/pdf/cv09.pdf (noting the percentage of crimes reported to the police in 2009, by gender, race, and Hispanic origin). 90. Id. 91. Crutchfield et al., supra note 69. 92. Index crimes are defined by the FBI and include homicide, rape, robbery, aggravated as-sault, burglary, larceny (over $50), motor vehicle theft, and arson. Uniform Crime Reporting Pro-gram Frequently Asked Questions, FED. BUREAU OF INVESTIGATION 2 (Apr. 2009), http://www.fbi. gov/about-us/cjis/ucr/frequently-asked-questions/ucr_faqs08.pdf. The 2009 data are on file with the Gonzaga Law Review. This analysis involved calculating the black-white arrest and imprisonment disproportionality ratios, and then the percent of the latter that is a function of the former. 93. Nor should this figure be interpreted to mean that 45% of disproportionality in confinement necessarily stems from race differences in criminal justice processing: legally relevant factors such as offender score may account for some or all of this discrepancy. 94. Arrest data are problematic because a comparison of victimization surveys and arrest data show that blacks are arrested at a higher rate than they are identified by victims. See discussion supra notes 87–92; see also Kochel et al., supra note 84.
644 Seattle University Law Review [Vol. 35:623 Gonzaga Law Review Washington Law Review
for which the 55% figure is derived.95 Because most Latinos in Washing-ton State are identified racially as white in these data, the white arrest and incarceration rates used in these calculations are inflated, and the results therefore underestimate the extent to which blacks are overrepre-sented at the arrest stage relative to crime commission rates. Finally, this method assesses disproportionality in state prisons but does not tell us anything about racial disproportionalities in jails, community supervi-sion, and misdemeanor courts. Indeed it is likely that discretion and dis-proportionality are greater in these parts of the criminal justice system. Thus, concluding that 55% of the racial disproportionality in imprison-ment rates is attributable to arrest patterns, and assuming that arrest pat-terns reflect crime commission rates, overstates the extent to which dis-proportionality in prisons flows from differential crime commission rates. Whatever the precise figure, it is clear that differential crime com-mission rates can explain only a part of the racial disproportionalities that characterize Washington State courts, jails, and prisons.
B. Structural Racism: Facially Neutral Policies with Racially Disparate Effects
The Research Working Group focused its efforts on nine issues covered by existing research and data, and in each area we found that racial disproportionalities are caused, in part, by practices and policies that produce racially disparate outcomes. We are not arguing that particu-lar individuals, actors, or agencies are intentionally discriminating. The studies described below do not prove that any one actor or group of ac-tors is racist. Rather, the research as a whole suggests that Washington State’s criminal justice system facilitates racially disparate outcomes in two more subtle ways. First, in some instances, facially neutral policies have racially disparate outcomes. For example, judicial consideration of ostensibly race-neutral factors such as employment status when making pretrial release decisions disadvantages defendants of color because they are less likely than white defendants to be employed.96 95. Again, this is because some state and local agencies do not identify Latinos as a separate racial group. 96. See Washington State Employment Situation Report for March 2010, WASH. STATE EMP’T SEC. DEP’T (Apr. 13, 2010), http://www.workforceexplorer.com/article.asp?ARTICLEID=10307, which states:
Historically, the Black or African American population has had the highest unemploy-ment rates, roughly twice that of both white and Asian populations. For the first quarter of 2010, the Black or African American population had an unemployment rate of 16.7 percent, the white and Asian populations, 9.5 percent and 8.1 percent, respectively. The
2012] Task Force Report 645
Second, the research suggests that the race or ethnicity of suspects and defendants affects how those individuals are perceived, and that this perception impacts how they are treated within the criminal justice sys-tem. The literature on implicit bias, discussed in Part III.C, shows that these race effects are likely to be unconscious and unintended rather than conscious and purposeful. While traditional models of racism emphasize individual acts of discrimination or racially charged policies, structural racism describes the interaction between various institutions and practic-es that are neutral on their face but nevertheless produce racialized out-comes.97
Put differently, structures matter and a system’s structure has a tre-mendous influence over the results a system produces. Policies can pro-duce foreseeable, if unintended, harms that run along racial lines.98 Moreover, bias may be unconscious or conscious. This suggests that we should not concentrate on individual motives but instead should focus on those practices and procedures whose cumulative effect is to facilitate racialized outcomes—that is, outcomes that fall along racial lines. By identifying and then reforming these structures and processes, we can begin to address racial disproportionality within Washington’s criminal justice system.
The Research Working Group’s findings are discussed below re-garding each studied context of disproportionality in Washington State’s criminal justice system.
1. Racial Disparity in Juvenile Justice Youth of color are overrepresented in Washington State’s juvenile
justice system.99 Although policymakers, practitioners, and researchers have studied this disproportionate minority contact (DMC) for the past twenty years,100 the problem still persists. For example, in 2007, African- American youth comprised just under 6% of the state’s population aged ten through seventeen years, but comprised roughly 12% of the state’s
Black or African American unemployment rate jumped by 3.1 percent between the first quarter of 2009 and the first quarter of 2010, while white and Asian populations in-creased only 1.3 percent and 1.6 percent, respectively.
97. See generally John A. Powell, Structural Racism: Building upon the Insights of John Calmore, 86 N.C. L. REV. 791 (2008). 98. Id. at 794. 99. WASH. STATE SENTENCING GUIDELINES COMM’N, DISPROPORTIONALITY AND DISPARITY IN JUVENILE SENTENCING, FISCAL YEAR 2005, at 1 & tbl.1 (2005), available at http://www. cfc.wa.gov/PublicationSentencing/DisparityDisproportionality/Adult_DisparityDisproportionality_FY2005.pdf. 100. See, e.g., Emily R. Cabaniss et al., Reducing Disproportionate Minority Contact in the Juvenile Justice System: Promising Practices, 12 AGGRESSION & VIOLENT BEHAV. 393, 394–400 (2007) (discussing scholarly and congressional efforts that have taken place since 1988).
646 Seattle University Law Review [Vol. 35:623 Gonzaga Law Review Washington Law Review
juvenile arrests.101 Youth of color are similarly overrepresented at the disposition stage (that is, the stage at which a decision or conviction is rendered). Two years prior, in 2005, African-American youth comprised just under 4% of the state’s population, but received over 13% of the state’s juvenile dispositions.102 There was a similar pattern of overrepre-sentation for Latino youth (11% of the state population, yet received 14% of the juvenile dispositions)103 and for Native-American youth (2% of the state population yet received nearly 5% of the juvenile dispositions).104
This disproportionality is even greater for youth committed to the Juvenile Rehabilitation Administration (“JRA”).105 The proportion of African-American youth in JRA facilities is five to six times the propor-tion of their population in the state;106 Native-American youth reside in JRA facilities at a rate of two times the proportion of their respective population in Washington State.107
Even worse, it appears that youth of color may receive disparate sentencing decisions. In 2005, African-American and Asian or Pacific Islander youth were sentenced to the longest average terms in county detention.108 African-American youth also received the longest terms of dispositions involving electronic home monitoring and work crew.109
Factors other than differential crime commission rates may contrib-ute to these racialized outcomes. For instance, a study of probation offic-ers’ assessments of youth in Washington State has found that African- American youth receive more negative attribution assessments about the causes of their offenses than white youth and that these characterizations lead to more punitive sentence recommendations.110 In particular, the study shows that probation officers consistently portray black youth dif-ferently than white youth in descriptions about the nature of their crimi- 101. GOVERNOR’S JUVENILE JUSTICE ADVISORY COMM., WASH. STATE DEP’T OF SOC. & HEALTH SERVS., TITLE II FORMULA GRANTS PROGRAM APPLICATION: COMPREHENSIVE 3-YEAR PLAN FOR FFY 2009-2011, at 13 (2009), available at http://juvjustice.njjn.org/media/resources/pub lic/resource_308.pdf. 102. See WASH. STATE SENTENCING GUIDELINES COMM’N, supra note 99. 103. See id. 104. Id. 105. Washington State’s JRA serves the state’s highest-risk youth. See GOVERNOR’S JUVENILE JUSTICE ADVISORY COMM., supra note 101, at 4. A county juvenile court may commit a particular juvenile offender to JRA custody if the individual has committed many lower-level offenses or a serious crime. See id. 106. WASH. STATE SENTENCING GUIDELINES COMM’N, supra note 99, at 3 & tbl.2. 107. Id. 108. Id. 109. Id. 110. Bridges & Steen, supra note 8.
2012] Task Force Report 647
nal offending.111 Black youths’ crimes are commonly attributed to inter-nal traits (attitudes and personalities) while white youths’ crimes are at-tributed to their social environment (peers and family).112 These charac-terizations shape probation officers’ assessments about the threat of fu-ture offending and lead to more severe sanctions and sentencing recom-mendations for black youth.113
Policy changes are needed to both assess and address rates of DMC and to investigate the mechanisms that produce the disproportionate and disparate outcomes. We recommend increasing the quality and access to data management systems that can generate case characteristics. These characteristics are critical to investigating the extent of DMC and the processes that lead to the overrepresentation.
Furthermore, decision-making environments need to be explored for points of discretion that can lead to youth of color being overselected for more severe sanctioning decisions (such as policies leading to deten-tion decisions and practices of case assessments and recommendations). Organizational climates should recognize the ways in which subtle biases can enter into decision-making, and decision-makers should openly dis-cuss how differences in culture can influence processing decisions.
2. Prosecutorial Decision-Making Prosecutors’ charging decisions and sentencing recommendations
have an important impact on criminal justice outcomes. For example, a 1995 study by Crutchfield, Weis, Engen, and Gainey found that prosecu-tors are significantly less likely to file charges against white defendants than they are against defendants of color.114 This difference persists even after legally relevant factors—offense seriousness, criminal history, and weapons charges—are taken into account.115 That study also found that King County prosecutors recommend longer confinement sentences for black defendants (after legal factors were held constant), and that prose-cutors are 75% less likely to recommend alternative sentences for black defendants than for similarly situated white defendants.116
111. Id. at 563–64. 112. Id. 113. Id. at 564–66. 114. ROBERT D. CRUTCHFIELD ET AL., WASH. STATE MINORITY & JUSTICE COMM’N, WASH. STATE SUPREME COURT, RACIAL AND ETHNIC DISPARITIES IN THE PROSECUTION OF FELONY CASES IN KING COUNTY 4 (1995), available at http://www.courts.wa.gov/committee/pdf/November%201 995%20Report.pdf. 115. Id. 116. Id. at 39–40.
648 Seattle University Law Review [Vol. 35:623 Gonzaga Law Review Washington Law Review
3. Confinement Sentencing Outcomes Several studies following the Sentencing Reform Act of 1981117
find that race shapes confinement sentence outcomes in Washington State—that is, those sentences that lead to jail time. A 2003 study by Engen, Gainey, Crutchfield, and Weis found that defendants of color are moderately less likely than similarly situated white defendants to receive sentences that fall below the standard range.118 A 2004 study by Fernan-dez and Bowman found that Latino defendants sentenced in conservative counties with comparatively large Latino populations are less likely to receive the statutorily established drug-offender sentencing alternative than other defendants.119 And most recently, a 2005 study by Steen, Engen, and Gainey found that among felony drug offenders, the odds that a black defendant will be sentenced to prison are 62% greater than the odds for similarly situated white defendants.120 These studies clearly in-dicate that race and ethnicity matter for confinement sentencing out-comes.
4. Variability and Ethnic Disparity in the Assessment of “Legal Financial Obligations” in Washington State Courts
Whenever a person is convicted in a Washington State superior court, the court may order the payment of a “legal financial obligation” (LFO), which is essentially a financial penalty that the defendant must pay as a consequence of the conviction.121 LFOs are now a common sup-plement to prison, jail, and probation sentences for people convicted of crimes in Washington State courts. For example, all felons must be as-sessed a $500 Victim Penalty Assessment Fee for each conviction and a $100 DNA Collection Fee at the time of the first conviction.122 Although fine and fee amounts are specified statutorily, judges have significant
117. WASH. REV. CODE §§ 9.94A.010−.930 (2010 & Supp. 2011). 118. Rodney L. Engen et al., Discretion and Disparity Under Sentencing Guidelines: The Role of Departures and Structured Sentencing Alternatives, 41 CRIMINOLOGY 99, 116–17 (2003); see also CRUTCHFIELD ET AL., supra note 9, at 32, 34, 72 tbl.13B. 119. Kenneth E. Fernandez & Timothy Bowman, Race, Political Institutions, and Criminal Justice: An Examination of the Sentencing of Latino Offenders, 36 COLUM. HUM. RTS. L. REV. 41, 63, 66–68 (2004). 120. Steen et al., supra note 10. 121. WASH. REV. CODE § 9.94A.760 (Supp. 2011). 122. WASH. REV. CODE §§ 7.68.035, 43.43.690 (2010 & Supp. 2011).
2012] Task Force Report 649
discretion in determining whether to impose many other authorized fees and fines.123
This judicial discretion has led to a high degree of variability in LFO assessment. Significant variation exists even among similar cases and similarly situated offenders.124 For example, one first-time white de-fendant convicted of delivery of methamphetamine in the first two months of 2004 was assessed $610 in fees and fines; in a different coun-ty, another first-time white defendant convicted of the same crime during the same time period was assessed $6710 in fees and fines.125
This variability also fosters racialized outcomes. A recent study of Washington State LFOs found that a number of extra-legal factors influ-ence the assessment of fees and fines, even after controlling for offender and Sentencing Reform Act (SRA) offense score.126 In particular, the sta-tistical analysis shows that Latino defendants receive significantly great-er fees and fines than similarly situated non-Latino defendants.127
The debt that accrues from the assessment of fees and fines is sub-stantial relative to ex-offenders’ expected earnings.128 For instance, de-fendants sentenced in the first two months of 2004 had been assessed an average of $11,471 by the courts over their lifetime.129 Because Washing-ton State currently charges 12% interest on unpaid LFOs, these financial obligations often persist and expand over the course of many years.130 By 2008, the individuals sentenced in early 2004 still owed an average of $10,840 in court debt.131 Ex-offenders who consistently pay $50 a month will still possess legal debt after thirty years of regular monthly pay-ments.132 Legal debt—and poor credit ratings—constrains opportunities and limits access to housing, education, and economic markets.133 Non-
123. KATHERINE A. BECKETT ET AL., WASH. STATE MINORITY & JUSTICE COMM’N, WASH. STATE SUPREME COURT, THE ASSESSMENT AND CONSEQUENCES OF LEGAL FINANCIAL OBLIGATIONS IN WASHINGTON STATE 9–10 (2008), available at http://www.courts.wa.gov/commit tee/pdf/2008LFO_report.pdf. 124. Id. at 24 tbl.4 (depicting wide variations in Washington State superior court LFO assess-ments). 125. Id. 126. Id. at 23–25. 127. Id. at 24–25; see also Alexes Harris et al., Courtesy Stigma and Monetary Sanctions: Toward a Socio-Cultural Theory of Punishment, 76 AM. SOC. REV. 234, 248–52 (2011). 128. Alexes Harris et al., Drawing Blood from Stones: Legal Debt and Social Inequality in the Contemporary United States, 115 AM. J. SOC. 1753, 1756 (2010). 129. Id. at 1773–75. 130. WASH. REV. CODE § 10.82.090 (Supp. 2011). 131. Harris et al., supra note 128, at 1775. 132. Id. at 1776–77. 133. Id. at 1777–82.
650 Seattle University Law Review [Vol. 35:623 Gonzaga Law Review Washington Law Review
payment of legal debt may also trigger arrest and reincarceration.134 We believe that the fairness and wisdom of the laws authorizing the discre-tionary assessment of legal financial obligations need to be reevaluated.
5. Racial and Ethnic Disparity in Pretrial Release Decisions in Washington State Courts
Whether an individual is released pending trial has a significant in-fluence on the outcome of a case, and it can have cascading effects on a defendant’s family, ability to maintain a job, and ability to pay for repre-sentation.135 The Bureau of Justice Statistics found that 78% of defend-ants held on bail while awaiting trial were convicted, compared to 60% of defendants who were released pending trial.136 In addition, defendants held on bail receive more severe sentences than defendants not detained prior to trial.137 Studies suggest that this correlation is not solely a func-tion of case characteristics.138 Rather, detention itself has a small but sta-tistically significant effect on nonfelony case outcomes and a significant impact on felony case outcomes.139
Although Washington State court rules specify factors courts must consider when determining whether to release a defendant, judges retain significant discretion.140 Research demonstrates that extra-legal factors, including race and ethnicity, significantly impact pretrial release deci-sions.141 In particular, the evidence shows that blacks and Latinos are detained before trial at higher rates than white defendants.142 For in-stance, a 1997 University of Washington study found that “minority de-fendants and men were less likely to be released on their own recogni- 134. Id. at 1782–85; see also AM. CIVIL LIBERTIES UNION, IN FOR A PENNY: THE RISE OF AMERICA’S NEW DEBTORS’ PRISONS 5, 6 (2010), available at http://www.aclu.org/files/assets/ _web.pdf#page=8. 135. See generally JOHN S. GOLDKAMP, TWO CLASSES OF ACCUSED: A STUDY OF BAIL AND DETENTION IN AMERICAN JUSTICE (1979). 136. THOMAS H. COHEN & BRIAN A. REAVES, BUREAU OF JUSTICE STATISTICS, U.S. DEP’T OF JUSTICE, SER. NO. NCJ 214994, PRETRIAL RELEASE OF FELONY DEFENDANTS IN STATE COURTS 7 & tbl.5 (2007), available at http://bjs.ojp.usdoj.gov/content/pub/pdf/prfdsc.pdf. 137. Id. 138. MARY T. PHILLIPS, N.Y.C. CRIMINAL JUSTICE AGENCY, INC., PRETRIAL DETENTION AND CASE OUTCOMES, PART 1: NONFELONY CASES 6 (2007), available at http://www.cjareports.org/ reports/detention.pdf; MARY T. PHILLIPS, N.Y.C. CRIMINAL JUSTICE AGENCY, INC., PRETRIAL DETENTION AND CASE OUTCOMES, PART 2: FELONY CASES 58 (2008) [hereinafter PHILLIPS, FELONY CASE OUTCOMES], available at http://www.cjareports.org/reports/felonydetention.pdf. 139. PHILLIPS, FELONY CASE OUTCOMES, supra note 138. 140. BRIDGES, supra note 65, at 1–2. 141. Id. at 7. 142. Id. at 52–53.
2012] Task Force Report 651
zance than others even after adjusting for differences among defendants in the severity of their crimes, prior criminal records, ties to the commu-nity and the prosecuting attorney’s recommendation.”143 Thus, defend-ants of color are held on bail at higher rates than other defendants. Given how much pretrial detention affects case outcomes, this finding is trou-bling.
Judges’ consideration of seemingly race-neutral factors may explain the disparate pretrial detention of defendants of color. In particular, when determining whether to release a defendant or to impose bail, judges of-ten consider the defendant’s employment status, the length and character of the defendant’s residence in the community, and the defendant’s fami-ly ties and relationships.144 Though presumably not designed to disad-vantage people of color, consideration of these factors often has that con-sequence.145 African-Americans, Native-Americans, and Latinos are more likely to be economically disadvantaged, have unstable employ-ment, experience more family disruptions, and have more residential mobility.146 Judicial focus on such factors means that people from these ethnic groups are less likely to be released on their own recognizance than whites.147 We suggest that courts should consider factors that are not only race-neutral on their face but also race-neutral in practice when making pretrial detention decisions.
6. Racial Disparity in Drug Law Enforcement Seattle has one of the highest rates of racial disparity in drug arrests
in the United States.148 Although only 8% of Seattle’s population is black, 67% of those who are arrested for delivery of a serious drug (nar-cotics other than marijuana) in Seattle are black.149 However, a rigorous, data-driven 2008 analysis of drug use, delivery, and law enforcement patterns in Seattle indicates that this racial disparity in arrest rates does not reflect the reality of the local drug economy.150 Nor is it a function of public health, public safety, or civilian complaints.151
143. Id. at 7. 144. Id. at 12. 145. Id. 146. Id. 147. Id. at 53. 148. BECKETT, supra note 14, at 56 tbl.10; Beckett et al., Race, Drugs, and Policing, supra note 64, at 115 & tbl.1. 149. BECKETT, supra note 14, at 56 tbl.10. 150. Id. at 1; see also Beckett et al., Race, Drugs, and Policing, supra note 64, at 119; Beckett et al., Lessons from Seattle, supra note 64, at 419, 426–29. 151. BECKETT, supra note 14, at 3; see also Beckett et al., Race, Drugs, and Policing, supra note 64, at 129; Beckett et al., Lessons from Seattle, supra note 64, at 430–35.
652 Seattle University Law Review [Vol. 35:623 Gonzaga Law Review Washington Law Review
According to Seattle Police Department (“SPD”) arrest figures, the total black drug arrest rate was more than thirteen times higher than the white drug arrest rate in 2006.152 Blacks were more than twenty-one times more likely to be arrested for selling serious drugs than whites in 2005 to 2006, despite the fact that multiple sources suggest that whites are the majority of sellers and users of serious drugs in Seattle.153 This rate of disparity is surpassed by only one of the other thirty-eight compa-rably sized cities in the nation for which data are available.154
The research shows that the primary cause of racial disparity in Se-attle’s drug law enforcement is SPD’s focus on crack cocaine—to the virtual exclusion of other serious drugs such as heroin, powder cocaine, ecstasy, and methamphetamine.155 In 2005 to 2006, nearly three-quarters (74.1%) of all planned arrests for delivery of a serious drug involved crack cocaine, a pattern that has remained consistent over time.156 Of those individuals arrested for crack-cocaine delivery, 73.4% were black.157 By contrast, less than 20% of those arrested for delivering any other serious drug were black.158
The overrepresentation of crack-cocaine offenders among drug ar-restees does not appear to be a function of public health and safety con-cerns, nor of resident complaints.159 Powder cocaine and ecstasy—not crack cocaine—are the most widely used serious drugs in Seattle.160 Alt-hough crack-cocaine use poses health risks, it is less likely than other serious drugs, such as heroin and other opiates, to be associated with in-fectious disease and drug-related mortality.161 Moreover, those arrested for crack-cocaine offenses are the least likely among serious drug users to possess a dangerous weapon at the time of arrest.162 Lastly, there is little geographic correlation between the areas identified by civilian
152. BECKETT, supra note 14. 153. See id. (using multiple data sources, such as questionnaires and surveys, police reports, and live observations). 154. Id. 155. BECKETT, supra note 14, at 48. 156. Id. (based on a four-month sampling period of May and June in 2005 and 2006); see also Beckett et al., Race, Drugs, and Policing, supra note 64, at 123–24. 157. BECKETT, supra note 14, at 2. 158. Id. 159. Id. at 3; see also Beckett et al., Race, Drugs, and Policing, supra note 64, at 129; Beckett et al., Lessons from Seattle, supra note 64, at 430–35. 160. BECKETT, supra note 14, at 20–21. 161. Id. at 433–34. 162. Id. at 433; see also BECKETT, supra note 14, at 96.
2012] Task Force Report 653
complainants and the places where planned drug-delivery arrests oc-cur.163
We believe that a less harmful approach to drug law enforcement is necessary. Community-based diversion programs provide a viable alter-native to traditional drug law enforcement methods.164 A more equitable enforcement of drug laws would immediately begin to address racial dis-proportionality, especially when illicit drug use is roughly equal for each racial or ethnic group.
7. Drug-Related Asset Forfeiture Distorts Law Enforcement Priorities in Washington State
Drug-related asset forfeiture is an important tool for law enforce-ment. Forfeiture laws reduce the incentive for financially motivated crimes such as drug trafficking by removing the assets that help make such activities profitable.165 Washington State allows local law enforce-ment agencies to retain 90% of the net proceeds from drug-related assets seized, but the state requires that these funds be used “exclusively for the expansion and improvement of controlled substances related law en-forcement activity.”166
This allocation creates a conflict between a law enforcement agen-cy’s economic self-interest and traditional law enforcement objectives.167 In particular, section 69.50.505 of the Revised Code of Washington cre-ates a perverse dependence whereby law enforcement agencies rely on
163. BECKETT, supra note 14, at 88–91. 164. MELISSA BULL, JUST TREATMENT: A REVIEW OF INTERNATIONAL PROGRAMS FOR THE DIVERSION OF DRUG RELATED OFFENDERS FROM THE CRIMINAL JUSTICE SYSTEM 23–26 (2003). 165. The Washington State Legislature made several findings in 1989 when it was considering the asset forfeiture law, including the following:
[D]rug-related offenses are difficult to eradicate because of the profits derived from the criminal activities, which can be invested in legitimate assets and later used for further criminal activities; and the forfeiture of real assets where a substantial nexus exists be-tween the commercial production or sale of the substances and the real property will pro-vide a significant deterrent to crime by removing the profit incentive of drug trafficking, and will provide a revenue source that will partially defray the large costs incurred by government as a result of these crimes.
Omnibus Alcohol and Controlled Substances Act, ch. 271, § 211, 1989 Wash. Sess. Laws 1266, 1298-99 (codified at WASH. REV. CODE § 69.50.505 note (2010)); see also United States v. Two Tracts of Real Prop., 998 F.2d 204, 213 (4th Cir. 1993) (“One of the most potent weapons in the government’s war on drugs is its ability to obtain the civil forfeiture of property that aids violations of the drug laws.”). 166. WASH. REV. CODE § 69.50.505(10). The remaining 10% of the net proceeds are deposited into the state general fund. See id. § 69.50.505(9). 167. Eric D. Blumenson & Eva Nilsen, The Next Stage of Forfeiture Reform, 14 FED. SENT’G REP. 76, 76 (2001).
654 Seattle University Law Review [Vol. 35:623 Gonzaga Law Review Washington Law Review
assets seized during drug investigations to fund their operations.168 This dependence inevitably skews how law enforcement agencies allocate their resources, and it affects operational decisions regarding whether to target particular crimes and how to exercise discretion when making ar-rests.169 Legitimate goals of crime prevention are compromised when salaries, equipment, and departmental budgets depend on how many as-sets are seized during drug investigations.170
Additionally, the standard of proof in Washington State for the gov-ernment to successfully claim property through asset forfeiture is one of the lowest in the country, and it is highly deferential to law enforce-ment.171 Section 69.50.505 requires only that a law enforcement officer have “probable cause” to believe the property is linked to criminal activi-ty in order to lawfully seize it.172 Making matters worse, circumstantial evidence is sufficient to establish probable cause to seize a person’s property.173 If a property owner challenges the seizure, the burden is only slightly increased to a “preponderance of the evidence” standard.174 The 168. Cf. MARIAN R. WILLIAMS ET AL., INST. FOR JUSTICE, POLICING FOR PROFIT: THE ABUSE OF CIVIL ASSET FORFEITURE 12 (2010), available at http://www.ij.org/images/pdf_folder/other_ pubs/assetforfeituretoemail.pdf (noting that in a nationwide survey, hundreds of law enforcement executives admitted that “civil forfeiture proceeds were a necessary budget supplement”). 169. Id. at 12–13 (“One consequence of giving law enforcement a pecuniary interest in forfei-ture proceeds is that it can cause them to over-enforce crimes that carry the possibility of forfeiture to the neglect of other law enforcement objectives. This makes basic economic sense; as the return to enforcing certain crimes increases, one would expect law enforcement agencies to devote a higher percentage of their resources to those aims.”); Eric Blumenson & Eva Nilsen, Policing for Profit: The Drug War’s Hidden Economic Agenda, 65 U. CHI. L. REV. 35, 40 (1998) (“First, these [asset forfeiture] programs have distorted governmental policymaking and law enforcement. During the past decade, law enforcement agencies increasingly have turned to asset seizures and drug enforce-ment grants to compensate for budgetary shortfalls, at the expense of other criminal justice goals. We believe the strange shape of the criminal justice system today . . . is largely the unplanned by-product of this economic incentive structure.”). 170. Eric D. Blumenson & Eva S. Nilsen, Contesting Government’s Financial Interest in Drug Cases, CRIM. JUST., Winter 1999, at 4, 5. 171. The highest standard is proof “beyond a reasonable doubt,” followed by proof upon “clear and convincing evidence.” The lowest standard is “probable cause,” which is used in fourteen states, including Washington. See WILLIAMS ET AL., supra note 168, at 22. 172. Rozner v. City of Bellevue, 784 P.2d 537, 540–41 (Wash. Ct. App. 1990) (Division I concluding that initial seizure of property under Washington’s asset forfeiture law requires a show-ing of probable cause that the property was used for illegal narcotics activity), rev’d on other grounds, 804 P.2d 24 (Wash. 1991); Escamilla v. Tri-City Metro Drug Task Force, 999 P.2d 625, 630 (Wash. Ct. App. 2000) (Division III concluding that property may be seized if law enforcement has probable cause to suspect that the property in question was used in connection with illegal nar-cotics activity); Valerio v. Lacey Police Dep’t, 39 P.3d 332, 339 (Wash. Ct. App. 2002) (Division II concluding the same). 173. Adams County v. One 1978 Blue Ford Bronco, 875 P.2d 690, 692 (Wash. Ct. App. 1994). 174. WASH. REV. CODE § 69.50.505(5) (2010).
2012] Task Force Report 655
low evidentiary threshold is troubling because many property owners whose assets are seized are never charged with a crime or are not con-victed. Investigators at the Seattle Post-Intelligencer found that 20% of people whose property is seized are never charged with a crime, and that 40% of the time there is no conviction.175 In fact, even in those cases where charges are filed, the case is dropped 23% of the time.176
The evidence suggests that the combination of tremendous financial incentives and limited property rights distorts drug-related priorities and pressures police to make operational decisions to maximize perceived financial rewards.177 Especially today, with budgets already stretched thin, Washington’s police departments are increasingly dependent on prosecuting the drug war to ensure their economic survival. Washington’s drug-related asset forfeiture laws reinforce drug-related law enforcement tactics that have a disparate impact on racial minorities.178 As discussed above, two-thirds of those arrested for delivery of a serious narcotics of-fense in Seattle are black.179 Because a drug arrest automatically renders much of a defendant’s property seizable, section 69.50.505 of the Re-vised Code of Washington has a disparate impact on defendants of color.
Furthermore, despite the substantial property interests involved, in-digent defendants do not have a right to appointed counsel when chal-lenging an asset seizure.180 Because indigent defendants tend to be peo-ple of color, minority property owners are at a distinct disadvantage and bear greater risk that their assets will be liquidated.
We believe that Washington State’s drug-related asset forfeiture laws can be greatly improved with three simple reforms. First, we urge Washington State to end the direct profit incentive that allocates 90% of the net proceeds from asset forfeitures to law enforcement agencies.181 So far, eight states have enacted reforms to end the direct profit incentive in their drug-related asset forfeiture laws by placing forfeiture revenue 175. Sam Skolnik, Critics Target Drug Raid Seizures, SEATTLE POST-INTELLIGENCER, Dec. 13, 2001, at A1, available at http://o.seattlepi.com/frontpage/seattle_pima1x220011213.pdf. 176. Id. 177. See WILLIAMS ET AL., supra note 168, at 13 (“[T]his is not simply theory. Earlier research found that in states where agencies get to keep the lion’s share of forfeiture proceeds, drug arrests—which often have the potential of a related civil forfeiture—constitute a significantly higher percent-age of all arrests.”); Blumenson & Nilsen, supra note 167, at 78–79 (discussing how police have an incentive to target buyers in reverse stings because it allows officers to seize the buyer’s cash). 178. Blumenson & Nilsen, supra note 169, at 39–40 (noting that traditional drug-enforcement strategy has “a self-perpetuating life of its own” because of the “lucrative rewards available to police and prosecutorial agencies that make drug law enforcement their highest priority”). 179. BECKETT, supra note 14, at 1. 180. See WASH. REV. CODE § 69.50.505 (2010). The statute provides only that a property owner may be entitled to attorneys’ fees if the owner “substantially prevails” in a proceeding to reclaim his or her property. Id. § 69.50.505(6). 181. Id. § 69.50.505(10).
656 Seattle University Law Review [Vol. 35:623 Gonzaga Law Review Washington Law Review
into a neutral account, such as education, drug treatment, or ideally, in the general treasury of the city, county, or state government that oversees the seizing agency.182 This single measure could cure the forfeiture law of its most corrupting effects.183
Second, we recommend increasing the burden of proof required to seize property. Requiring seizing agencies to demonstrate with “clear and convincing” evidence that the assets seized were linked to criminal activ-ity would help protect property owners from arbitrary seizures.
Finally, because of the important property interests at stake, we suggest that indigent persons be provided with counsel when their assets are seized. Providing counsel for indigent defendants would help protect property interests that are often key to indigent persons’ livelihood.
As long as police agencies can expect a financial reward for asset seizures, they will remain dependent on current tactics that have a dis-parate impact on racial minorities.
8. Racial Disparity in Traffic Enforcement Since 2000, the Washington State Patrol (WSP) has collected data
on its traffic stops.184 WSP requires its troopers to maintain data for every contact they have with a motorist, including whether the motorist is stopped, searched, and cited, as well as the driver’s race and ethnicity.185 Studies based on this data have found no evidence of racial profiling or any observable racial disparity in traffic stops.186 Although black, Native- American, and Hispanic drivers are stopped at higher rates than white
182. See WILLIAMS ET AL., supra note 168, at 17. Indiana, Maine, Maryland, Missouri, North Carolina, North Dakota, Ohio, and Vermont do not distribute any of the proceeds to law enforce-ment. Id.; see also Blumenson & Nilsen, supra note 167 (discussing reform efforts around the coun-try where voters have approved laws to end the “‘corrupting incentives’” of asset-forfeiture alloca-tion (quoting United States v. Funds Held in the Name or for the Benefit of Wetterer, 210 F.3d 96, 110 (2d Cir. 2000))). 183. See WILLIAMS ET AL., supra note 168, at 14; Blumenson & Nilsen, supra note 167, at 80–81. 184. LOVRICH ET AL., 2003 WSP REPORT, supra note 63, at 22. We note that stops by local law enforcement constitute the large majority of traffic stops that take place in the state. But very little empirical data have been collected on the stop, citation, and search practices of these local law en-forcement agencies. 185. See Clayton Mosher et al., The Importance of Context in Understanding Biased Policing: State Patrol Traffic Citations in Washington State, 9 POLICE PRAC. & RES. 43, 45–46, 47–48 tbls.1 & 2 (2008). 186. Id. at 43–44.
2012] Task Force Report 657
motorists, this appears to reflect differences in traffic violation rates.187 There is some racial disparity, however, in the outcomes associated with these stops.
Citations are one such outcome. To assess whether higher citation rates among drivers of color are attributable solely to differences in traf-fic law violation rates, researchers compared the number of alleged vio-lations in WSP stops that did and did not result in citation.188 The results indicate that black, Native-American, and Latino motorists were identi-fied by WSP officers as having more traffic violations even in stops in which officers did not issue a citation.189 This suggests that WSP officers were not “piling violations on” minority drivers to justify issuing cita-tions to them. Nonetheless, comparison of citation rates for drivers with just one violation reveals some racial differences.190 Specifically, black, Native-American, Latino, and Asian drivers with one traffic violation were significantly more likely to be cited than white motorists with one traffic violation in a total of thirty-six jurisdictions, but less likely to be cited than comparable white drivers in just six jurisdictions.191
Additionally, researchers found that “race is clearly an important factor influencing the likelihood of a search.”192 In particular, the data show that black, Native-American, and Latino motorists are significantly
187. Many of the most frequent violations—such as driving with a suspended license or broken taillight—occur when people cannot afford to pay traffic fines or repair their cars. Thus, higher violation rates among drivers of color may reflect socioeconomic factors. See id. at 45–46, 48. 188. Id. at 46, 48–49. 189. Id. at 53–54 tbl5. 190. Id. at 51, 52 tbl.4. 191. The authors concluded that this difference “d[id] not indicate the operation of systemic bias in citing minorities who have only a single violation recorded by the WSP.” Id. at 51. It is not clear how the authors made this determination. Forthcoming research examines and critiques the methodologies that Lovrich et al., supra note 63, employed in their 2007 report on the WSP. See Mario L. Barnes & Robert S. Chang, Analyzing Stops, Citations, and Searches in Washington and Beyond, 35 SEATTLE U. L. REV. 673 (2012); Clayton Mosher & J. Mitchell Pickerill, Methodologi-cal Issues in Biased Policing Research with Applications to the Washington State Patrol, 35 SEATTLE U. L. REV. 769 (2012). 192. J. Mitchell Pickerill et al., Search and Seizure, Racial Profiling, and Traffic Stops: A Disparate Impact Framework, 31 LAW & POL’Y 1, 15 (2009). We note that an overlapping group of researchers, using data from WSP traffic stops between 2005 and 2007, employed a different meth-odology to analyze the disproportionate search rates to conclude that the differences were not indica-tive of discrimination. See LOVRICH ET AL., 2007 WSP REPORT, supra note 63, at 49–50. They state that because the relative disproportionality between groups is the same difference in magnitude for low- and high-discretion searches, that this reflects a lack of bias in searches by WSP. Id. (“We come to this conclusion by comparing the likelihoods of high discretion searches to low discretion searches, which suggest that officers do not act differently based on race when they have higher levels of discretion.”). But their analysis and conclusions are subject to important methodological criticism. See Barnes & Chang, supra note 191; Mosher & Pickerill, supra note 191.
658 Seattle University Law Review [Vol. 35:623 Gonzaga Law Review Washington Law Review
more likely to be searched once stopped than are white drivers.193 This disparity exists in both low- and high-discretion searches, and it persists after time of day and number of violations are taken into account.194 However, the “hit rate”—that is, the share of searches that result in sei-zures—is somewhat higher for whites.195 For example, high-discretion searches of whites led to seizures 24.1% of the time.196 But the hit rates for minority groups during high-discretion searches were all lower: 17.6% for Latinos, 22.1% for blacks, 18.1% for Native-Americans, and 22.4% for Asians.197 These findings suggest that minorities are subject to a higher rate of searches as compared to white drivers, but that this high-er rate is not warranted by any policing purpose because whites are more likely to have items subject to seizure.
In short, WSP should be recognized as one of a few agencies stud-ied nationwide that does not exhibit a pattern of disproportionate minori-ty contact at the “stop level.”198 The data and evidence demonstrate, however, that WSP officers are more likely to cite black, Native-American, and Latino drivers with one violation than white drivers with one violation.199 The evidence also shows that race is an important factor influencing the likelihood of a search.200
9. Racial Disparity in Driving While License Suspended (DWLS) Cases In many misdemeanor courts, Driving While License Suspended in
the Third Degree (DWLS 3) cases constitute at least one-third of the caseload, and consume a dramatic percentage of misdemeanor court, prosecution, and public defense resources in a time of severe budget challenges.201 Currently, there are an estimated 100,000 DWLS 3 cases in
193. Pickerill et al., supra note 192. Other driver characteristics also influence the likelihood of a search. See id. For example, females and older drivers are less likely to be searched than males and younger drivers. See id. 194. See Pickerill et al., supra note 192, at 15, 19, 21. 195. Id. at 13 & tbl.3. 196. Id. 197. Id. 198. Mosher et al., supra note 185, at 53, 56. 199. Pickerill et al., supra note 192, at 51. 200. Id. at 13. We disagree with the authors’ interpretations and conclusions. 201. John B. Mitchell & Kelly Kunsch, Of Driver’s Licenses and Debtor’s Prison, 4 SEATTLE J. FOR SOC. JUST. 439, 443, 460–61 (2005).
2012] Task Force Report 659
Washington per year,202 many of which result from failure to pay a traffic ticket or to appear in court for the ticket.203
The costs of prosecuting DWLS 3 cases are staggering. It is esti-mated that Washington’s statewide average cost of arrest is $334, cost of conviction is $757, and cost per jail day is $60.71.204 Even though most first-time DWLS 3 convictions do not result in jail time, many people are jailed on the second or third offense or for failing to complete probation-ary requirements.205 The single largest factor responsible for driving up the costs of the criminal justice system has been the increased incarcera-tion rate since 1980.206 Even if the DWLS 3 cases proceed on the basis of tickets and not arrests, and there is no actual jail time imposed, the costs of prosecuting and defending those cases approaches $75 million annual-ly.207 Worse still, this cost does not take into account the impact on indi-vidual defendants and their family.
Additionally, the evidence shows that this facially neutral policy—treating driving while license suspended as a misdemeanor offense—has racially disparate effects. Most people charged with DWLS 3 are poor. A 1999 Seattle study found that of 184 people with suspended licenses, the average person had $2095 in unpaid fines and a monthly income of $810.208 Because of economic status and police deployment decisions—and possibly because of racial profiling in some situations—people of color are more likely to have suspended licenses for failure to pay a tick-et. For instance, in 2000, a Seattle Times investigation found that black drivers in Seattle receive more tickets and are more likely to be cited for
202. JOANNE I. MOORE & DAVID K. CHAPMAN, WASH. STATE OFFICE OF PUB. DEF., DRIVING WHILE LICENSE SUSPENDED 3RD DEGREE: SURVEY OF COURTS OF LIMITED JURISDICTION 1 (2008), available at http://www.opd.wa.gov/TrialDefense/090602_DWLS3Survey.pdf. 203. Mitchell & Kunsch, supra note 201, at 443. 204. STEVE AOS ET AL., WASH. STATE INST. FOR PUB. POLICY, EVIDENCE-BASED PUBLIC POLICY OPTIONS TO REDUCE FUTURE PRISON CONSTRUCTION, CRIMINAL JUSTICE COSTS, AND CRIME RATES 41 exhibit B.2 (2006), available at http://www.wsipp.wa.gov/rptfiles/06-10-1201.pdf. Figures were adjusted for 2007 dollars utilizing the Implicit Price Deflator (GDP) rate; these compu-tations were performed using the calculator at Samuel H. Williamson, Seven Ways to Compute the Relative Value of a U.S. Dollar Amount—1774 to Present, MEASURINGWORTH (Mar. 2011), http://www.measuringworth.com/uscompare. 205. See Mitchell & Kunsch, supra note 201, at 440–42. 206. WASH. STATE INST. FOR PUB. POLICY, THE CRIMINAL JUSTICE SYSTEM IN WASHINGTON STATE: INCARCERATION RATES, TAXPAYER COSTS, CRIME RATES, AND PRISON ECONOMICS 4 & fig.5 (2003), available at http://www.wsipp.wa.gov/rptfiles/SentReport2002.pdf. 207. This figure is based on the average cost of a DWLS 3 conviction ($757) and the estimated number of DWLS 3 cases per year (100,000). See AOS ET AL., supra note 204; MOORE & CHAPMAN, supra note 202. 208. MUN. COURT OF SEATTLE, PARTNERS IN SERVICE TO THE COMMUNITY 1999-2000, at 7 (2001), available at https://www.seattle.gov/courts/pdf/smcreport.pdf.
660 Seattle University Law Review [Vol. 35:623 Gonzaga Law Review Washington Law Review
defective headlights than are white drivers.209 In some misdemeanor courts, there is no counsel available for indigent persons at first appear-ance or arraignment hearings, and in other courts, public defense attor-neys are too overwhelmed with cases to provide meaningful assistance. As a result, people of color are more likely to be charged with DWLS 3.
In response to this worsening problem, court-initiated relicensing programs have arisen. These programs allow individuals to have their license reinstated in exchange for continued payment on outstanding fines.210 King County District Court, for example, schedules at least two days per month in which an individual may enroll in the program.211 Par-ticipants have the option to perform community service at the rate of $10 for each hour worked.212 The district court holds are released once the court receives written proof of community service hours performed.213
In addition, the program offers participation in work crews and credit toward King County District Court fines at the rate of $150 for every eight-hour day worked.214 Yet another option is to make a 10% down payment on fines and monthly payments for the remaining bal-ance.215 A community-based organization, Legacy of Equality, Leader-ship and Organizing, assists individuals with the process and refers them to the relicensing program.216 These programs both entice the payment of outstanding fines and reduce the costs of prosecution, public defense, and jail associated with DWLS 3 defendants.217 The King County District Court relicensing program is estimated to save two dollars for every dol-
209. Andrew Garber, Seattle Blacks Twice as Likely to Get Tickets, SEATTLE TIMES (June 14, 2000), http://community.seattletimes.nwsource.com/archive/?date=20000614&slug=4026674 (“A Seattle Times analysis of more than 324,000 citations issued in the past five years also found blacks get more tickets per stop than whites and are more likely to be cited for certain offenses, such as defective headlights. For example, the number of tickets issued to blacks for blocking traffic is four times the proportion of blacks in the driving population.”). 210. Cooper Offenbecher, DWS: A Ticket to Debtor’s Prison?, KING COUNTY B. BULL. (Apr. 2008), http://www.kcba.org/newsevents/barbulletin/archive/2008/08-04/article1.aspx; see also Mitchell & Kunsch, supra note 201, at 463. 211. Offenbecher, supra note 210; Relicensing Program, KING CNTY., http://www.kingcounty. gov/courts/DistrictCourt/CitationsOrTickets/RelicensingProgram.aspx (last updated Jan. 20, 2012). 212. Relicensing Program, supra note 211. 213. Id. 214. Id. 215. Id. 216. LELO—LEGACY OF EQUALITY, LEADERSHIP & ORGANIZING, http://www.lelo.org (last visited Dec. 31, 2011). The organization also conducts its own DWLS education programs. See id. 217. Offenbecher, supra note 210.
2012] Task Force Report 661
lar spent.218 King County is not alone in its efforts to address this crisis. Recently, the City of Spokane Prosecutor’s Office established a diversion program for DWLS 3 cases that it believes will reduce the municipal court criminal caseload by 35%.219
Because most people charged with DWLS 3 have their licenses suspended for not paying a fine or for missing a court hearing, we be-lieve that if these individuals had the means and the knowledge to navi-gate the court system, they could have their licenses reinstated. Local prosecutors and courts should work with defenders and community groups to establish precharging diversion and relicensing programs where they do not now exist. Additionally, the legislature should amend section 46.20.289 of the Revised Code of Washington so that drivers’ licenses are not suspended for failure to pay a ticket or attend a court hearing.220
10. Summary In conclusion, the evidence shows a wide variety of policies and
practices that facilitate racial disparity in Washington’s criminal justice system. In the nine aforementioned areas—juvenile justice, prosecutorial discretion, confinement sentencing outcomes, LFOs, pretrial release, drug law enforcement, asset forfeiture, traffic enforcement, and DWLS—research has revealed that race matters at various stages in the disposition of criminal cases. Similarly situated persons are treated differently along racial lines in the studied contexts. These findings raise serious concerns regarding other criminal justice contexts yet to be examined, and they demonstrate how structural racism can and does affect outcomes in Washington’s criminal justice system.
C. Bias Many of us harbor explicit and implicit racial biases, regardless of
our professed commitments to racial equality. If we have these biases, how many of us will admit them to ourselves, let alone to others? Even 218. Id.; Corinna Harn, Chief Presiding Judge, King Cnty. Dist. Court, & Tricia Crozier, Chief Admin. Officer, King Cnty. Dist. Court, Costs & Benefits of the King County District Court Reli-censing Program, Presentation of Findings from a Study by Christopher Murray & Associates (May 12, 2004) (PowerPoint slides available at DEFENDER ASS’N, old.defender.org/files/archive/Relicen sing_Presentation.ppt (last visited Dec. 31, 2011)). 219. Robert C. Boruchowitz, AM. CONSTITUTIONAL SOC’Y, DIVERTING AND RECLASSIFYING MISDEMEANORS COULD SAVE $1 BILLION PER YEAR: REDUCING THE NEED FOR AND COST OF APPOINTED COUNSEL 9 (2010), available at http://www.acslaw.org/files/Boruchowitz%20%20Mis demeanors.pdf. 220. WASH. REV. CODE § 46.20.289 (2008), invalidated on other grounds by In re Nichols, 211 P.3d 462 (Wash. Ct. App. 2009), aff’d, 256 P.3d 1131 (Wash. 2011).
662 Seattle University Law Review [Vol. 35:623 Gonzaga Law Review Washington Law Review
then, how do we know if these feelings in fact affect our behavior? Final-ly, if we admit that these feelings can affect our behaviors, are there ways to prevent racialized outcomes that are inconsistent with our shared commitment to equality? This section explores evidence regarding bias, the relationship between bias and behavior, and the potential for solu-tions to prevent racially disparate outcomes.
1. Explicit Bias as Reflected in Survey Data One of the best sources of survey data on racial attitudes comes
from the General Social Survey conducted by the National Opinion Re-search Center at the University of Chicago, which has collected data from face-to-face surveys since 1942.221 The survey has revealed, over time, that white attitudes toward blacks, as measured by expressed prin-ciples, have shifted dramatically. For example, in 1964, 60% of white respondents were in favor of laws against intermarriage between blacks and whites.222 By 2002, the number had dropped to 10% in favor of such laws, though 35% still opposed intermarriage between whites and blacks.223 Similar trend data show that when white respondents were asked in 1977 about black inequality and its causes, 27% reported that it was due to blacks having less ability.224 By 2006, this number had dropped to 7% and, by 2010, it had settled at 9%.225 Interestingly, in 1977, 66% of white respondents asked about black inequality stated that blacks lack motivation.226 In 2008, 52% of white respondents said that blacks had no motivation and 60% agreed somewhat or strongly that blacks should try harder.227 Some negative views, such as the attribution of no motivation, seem to persist at a very high rate. It is also worth not-ing that a large percentage of white respondents believe that blacks are
221. HOWARD SCHUMAN ET AL., RACIAL ATTITUDES IN AMERICA: TRENDS AND INTERPRETATIONS 59 (rev. ed. 1997). 222. Id. at 106 tbl.3.1B. 223. Compare id., with 2011 Update to Table 3.1B of Racial Attitudes in America: Trends and Interpretations, INST. OF GOV’T & PUB. AFFAIRS (Oct. 2011), http://igpa.uillinois.edu/system/files/ Trends%20in%20Racial%20Attitudes_3-1B.pdf. 224. SCHUMAN ET AL., supra note 221, at 156–57 tbl.3.4A. 225. 2011 Update to Table 3.4A of Racial Attitudes in America: Trends and Interpretations, INST. OF GOV’T & PUB. AFFAIRS (Oct. 2011), http://igpa.uillinois.edu/system/files/Trends%20in%20 Racial%20Attitudes_3-4A.pdf. 226. SCHUMAN ET AL., supra note 221, at 156–57 tbl.3.4A. 227. 2011 Update to Table 3.4A of Racial Attitudes in America: Trends and Interpretations, supra note 225.
2012] Task Force Report 663
treated unfairly by police, with 36% holding this view in both 1997 and 2007.228
The survey data show a significant diminishment in white negative racial attitudes toward blacks in many areas, but even this outcome should be taken with a grain of salt. Any survey is subject to the problem of response bias.229
2. Implicit Bias Distorts Decisions Throughout the Criminal Justice System
a. Overview on Implicit Bias The criminal justice system involves numerous actors—such as po-
lice officers, prosecutors, judges, jurors, and eyewitnesses—whose deci-sions and judgments have a significant impact on the conviction and pun-ishment of criminal defendants. A great deal of research has shown that race significantly affects the decisions and judgments of most people. Some of this research has been conducted on particular actors within the criminal justice system. For example, the research on bias tends to show that a juror who associates blacks (as opposed to whites) with a particular crime will be more likely to convict blacks (as opposed to whites) of that crime on the same evidence.230 These biases are subtle phenomena that have some influence in any given case, but which have their most sub-stantial effects over time. Biased decision-making artificially inflates the proportion of minorities in the criminal justice system, which likely cre-ates more stereotypes and associations, thus resulting in a negative feed-back cycle.
The research and studies discussed below are either well-recognized meta-analyses231 or particular studies selected for their rele-vance, elegance, clarity, and methodological rigor. Unfortunately, much of the research to date has evaluated race as a white-black dichotomy.232 228. 2011 Update to Table 3.4B of Racial Attitudes in America: Trends and Interpretations, INST. OF GOV’T & PUB. AFFAIRS (Oct. 2011), http://igpa.uillinois.edu/system/files/Trends%20in%20 Racial%20Attitudes_3-4B-Sup.pdf. 229. Response bias can be produced by such things as question wording, question context, race of the interviewer, and privacy. See SCHUMAN ET AL., supra note 221, at 78–79 (addressing the wording of questions); Maria Krysan, Privacy and the Expression of White Racial Attitudes: A Com-parison Across Three Contexts, 62 PUB. OPINION Q. 506, 525, 536 (1998) (addressing the privacy effect); Cynthia Webster, Hispanic and Anglo Interviewer and Respondent Ethnicity and Gender: The Impact on Survey Response Quality, 33 J. MARKETING RES. 62, 63, 70 (1996) (addressing the race and ethnicity of interviewers and respondents). 230. See infra note 264 and accompanying text. 231. We use the term “meta-analysis” to mean an evaluation of large collections of similar studies that is used to determine the general state of knowledge regarding a particular issue. 232. See, e.g., SCHUMAN ET AL., supra note 221.
664 Seattle University Law Review [Vol. 35:623 Gonzaga Law Review Washington Law Review
Nevertheless, the studies that have expanded the race evaluation to other minority groups have tended to show similar results.233 Thus, no distinc-tion between minority groups is drawn here, and further treatment of that issue is beyond the scope of this report.
b. Implicit Biases Are Pervasive Survey data often fail to reflect “true” attitudes, especially when
people wish to conceal their motives or if they have unconscious biases. In one carefully designed experiment, researchers found that when of-fered a choice of two rooms in which movies were playing, people avoided the room with a disabled person, but only when doing so could masquerade as movie preference.234 This experiment and others like it235 suggest that if people can act in a biased matter with plausible deniabil-ity, they will do so.
The gap between true attitudes and what is expressed is exacerbated by the problem of unconscious or implicit bias. Much of this research is done in connection with the Implicit Association Test (IAT), discussed below, which measures reaction times in response to certain visual stimu-li.236 Other methodologies include testing subjects while “measuring car-diovascular response, micro-facial movements, or neurological activi-ty.”237
The general findings, confirmed by hundreds of articles in peer-reviewed scientific journals, are that “[i]mplicit biases—by which we mean implicit attitudes and stereotypes—are both pervasive (most indi-viduals show evidence of some biases), and large in magnitude, statisti-
233. Compare William A. Cunningham et al., Separable Neural Components in the Processing of Black and White Faces, 15 PSYCHOL. SCI. 83 (2004) (comparing reactions to black and white faces and finding bias in favor of white faces), and Nilanjana Dasgupta et al., Automatic Preference for White Americans Eliminating the Familiarity Explanation, 36 J. EXPERIMENTAL & SOC. PSYCHOL. 316 (2000) (comparing reactions to photos of black and white Americans and finding implicit bias in favor of white Americans), with Jaihyun Park et al., Implicit Attitudes Toward Arab-Muslims and the Moderating Effects of Social Information, 29 BASIC & APPLIED SOC. PSYCHOL. 35 (2007) (comparing reactions to Arab and Muslim names and white names and finding strong bias in favor of white names). 234. Melvin L. Snyder et al., Avoidance of the Handicapped: An Attributional Ambiguity Anal-ysis, 37 J. PERSONALITY & SOC. PSYCHOL. 2297, 2297 (1979). 235. Id. at 2304 (discussing bystander intervention experiments varying race of victim). 236. Anthony G. Greenwald et al., Measuring Individual Differences in Implicit Cognition: The Implicit Association Test, 74 J. PERSONALITY & SOC. PSYCHOL. 1464, 1464–66 (1998). 237. Jerry Kang & Kristin Lane, Seeing Through Colorblindness: Implicit Bias and the Law, 58 UCLA L. REV. 465, 471 (2010) (footnotes omitted).
2012] Task Force Report 665
cally speaking. In other words, we are not, on average or generally, cog-nitively colorblind.”238
c. Implicit Bias Research on Race and Crime Individuals in our society generally associate minorities with crimi-
nality;239 they also exhibit implicit bias against minorities240 and display divergent behavior in experiments based on the manipulation of race as a variable (such as the race of a face in a photograph, the race of a charac-ter in a vignette, or even the race of an experimenter).241 Researchers have shown that whites tend to exhibit relatively increased levels of acti-vation in the amygdala—an area of the brain that is associated with emo-tional stimulation and fear—when presented with black as opposed to white faces.242 This effect has been correlated with performance on the IAT, which measures implicit conceptual associations and has been used by researchers to measure implicit bias in individuals.243 The IAT pre-sents individuals with words or images from two distinct dichotomies (such as good-bad and white-black), asks individuals to sort the words and images according to assigned pairings (e.g., hit one button for each good word or black image presented, and hit another button for each bad word or white image presented), and then measures the speed and accu-racy with which the individuals are able to sort the paired concepts. Whites generally exhibit implicit bias against blacks under the IAT.244 Namely, whites tend to exhibit less speed and accuracy when asked to associate positive concepts with black (as opposed to white) faces or names. In certain studies, the IAT in particular also has been correlated with biased behavior and decision-making.245
238. Id. at 473. 239. Harris et al., supra note 127, at 241; see also infra notes 251–255 and accompanying text. See generally Kelly Welch, Black Criminal Stereotypes and Racial Profiling, 23 J. CONTEMP. CRIM. JUST. 276 (2007). 240. Anthony G. Greenwald & Linda Hamilton Krieger, Implicit Bias: Scientific Foundations, 94 CALIF. L. REV. 945, 955–56, 957–58 tbls.1 & 2 (2006); see also infra notes 244–245 and accom-panying text. 241. See discussion infra Part III.C.2.d−f. 242. Phelps et al., supra note 18, at 729–33. 243. See id. 244. Id. at 730–31; see also Greenwald et al., supra note 236, at 1474. 245. See Jeremy D. Heider & John J. Skowronski, Improving the Predictive Validity of the Implicit Association Test, 9 N. AM. J. PSYCHOL. 53, 71–72 (2007) (examining the extent to which IAT measures of racial attitudes predict social behaviors); Allen R. McConnell & Jill M. Leibold, Relations Among the Implicit Association Test, Discriminatory Behavior, and Explicit Measures of Racial Attitudes, 37 J. EXPERIMENTAL SOC. PSYCHOL. 435, 440 (2001) (using IAT to measure inter-group prejudice between white and black undergraduates).
666 Seattle University Law Review [Vol. 35:623 Gonzaga Law Review Washington Law Review
Researchers have made other findings regarding mental associa-tions of blacks with criminality. In one study, individuals primed246 with crime-related concepts more quickly identified computer imposed “dot-probe[s]” on black faces than white faces.247 The individuals primed with crime-related concepts also identified the dot probe more quickly than their nonprimed counterparts,248 an effect that was replicated among a group of police officers.249 Further, when asked whether faces “looked criminal,” a racially diverse group of police officers judged black faces to be much more criminal-looking.250
d. Criminal Investigations and Arrests Are Influenced by the Race of Potential/Actual Suspects, and Often Are Based on a Faulty Application
of Majoritarian Cultural Norms The racial component of a given case may influence judgments of
character and guilt, expectations of recidivism, and decisions to arrest and charge. In one study, priming police and probation officers with black-related concepts significantly influenced responses to race-neutral vignettes of juveniles committing theft and assault.251 Specifically, the officers were more likely to rate the juveniles negatively, to expect recid-ivism, and to recommend arresting the juveniles if primed with black-related concepts, such as “homeboy” or “minority.”252 Another study ob-served that white store employees were more likely to monitor and fol-low black (as opposed to white) customers who asked to try on sunglass-es with a security sensor removed.253
Additionally, researchers have conducted many deadly force simu-lations in which subjects must decide quickly whether to shoot or not shoot figures appearing on a screen who are carrying either a gun or an
246. “Priming” occurs when a subject is shown an image or word so quickly that the image or word is not registered in consciousness, but nevertheless has a subconscious impact and affects behavior. Jennifer L. Eberhardt et al., Seeing Black: Race, Crime, and Visual Processing, 87 J. PERSONALITY & SOC. PSYCHOL. 876, 880 (2004); Erin J. Strahan et al., Subliminal Priming and Persuasion: Striking While the Iron Is Hot, 38 J. EXPERIMENTAL SOC. PSYCHOL. 556, 556 (2001). This is a common and accepted method of investigating underlying mental processes in the field of social psychology. 247. Eberhardt et al., supra note 246, at 882–83. 248. Id. 249. Id. at 885–87. 250. Id. at 889. 251. Graham & Lowery, supra note 17, at 487–88, 494, 499. 252. Id. at 489, 491–97. 253. George E. Schreer et al., “Shopping While Black”: Examining Racial Discrimination in a Retail Setting, 39 J. APPLIED SOC. PSYCHOL. 1432, 1439 (2009).
2012] Task Force Report 667
innocuous object (such as a wallet). Whites have been shown to commit more errors regarding black (as opposed to white) target figures.254 An-other such deadly force study was conducted at the University of Wash-ington with similar results.255 This bias effect increased in one study when subjects read newspaper articles involving black (as opposed to white) criminals prior to testing—once again showing the power of un-derlying stereotyping.256
Researchers have also studied whether nonverbal cues used by po-lice officers to identify likely suspects, such as eye contact and body lan-guage, are accurate across races.257 Research has shown that minorities—including minorities who have not been engaging in criminal activity—disproportionately exhibit many of these nonverbal cues (such as pauses in speech or avoidance of eye contact).258 These same behaviors also have been shown in foreign language speakers.259
e. Determinations of Guilt and Sentencing Likely Are Influenced by the Race of Defendants, in Conjunction with Other Extra-Legal Factors
Researchers have conducted some substantial meta-analyses regard-ing mock juror studies involving race. In these studies, subjects are pro-vided with trial materials and asked for judgments of guilt and sentenc-ing, and defendant race is manipulated. These studies are limited in vari-ous ways—for example, they generally evaluate individual mock jurors, as opposed to mock juries engaged in group decision-making—but they appear useful nonetheless.
One meta-analysis focused on sentencing decisions made by white mock jurors found a narrow racial bias in sentencing against people of color.260 Another meta-analysis evaluated verdict and sentencing deci-sions made by mock jurors (including black mock jurors) in mock cases involving minority defendants, finding no significant effect of racial bias (although there were apparent effects within particular types of crime).261 A subsequent meta-analysis collected more studies and evaluated the ef-fect of out-group bias, including bias by black mock jurors against white
254. Joshua Correll et al., The Police Officer’s Dilemma: Using Ethnicity to Disambiguate Potentially Threatening Individuals, 83 J. PERSONALITY & SOC. PSYCHOL. 1314, 1325 (2002). 255. Anthony G. Greenwald et al., Targets of Discrimination: Effects of Race on Responses to Weapons Holders, 39 J. EXPERIMENTAL SOC. PSYCHOL. 399, 399–402 (2003). 256. Joshua Correll et al., The Influence of Stereotypes on Decisions to Shoot, 37 EUR. J. SOC. PSYCHOL. 1102, 1114 (2007). 257. Engel & Johnson, supra note 17; Johnson, supra note 17, at 280, 286. 258. Engel & Johnson, supra note 17, at 612 tbl.3. 259. Id. at 613. 260. Sweeney & Haney, supra note 17, at 191–93. 261. Mazzella & Feingold, supra note 17, at 1325.
668 Seattle University Law Review [Vol. 35:623 Gonzaga Law Review Washington Law Review
mock defendants.262 That meta-analysis found a “small, but significant” effect of race on mock juror verdict and sentencing decisions, which was substantially tempered both by jury instructions and use of binary re-sponses regarding guilt (guilty or not guilty, as opposed to a scale meas-uring likelihood of guilt).263 These tempering conditions are more realis-tic and reflective of actual courtroom processes, and thus, based on mock juror research to date, the effect of racial bias on jury decisions in general appears to be fairly insignificant.
However, subsequent research has shown that race may play a sig-nificant role in particular types of criminal cases, or when combined with other factors. For instance, some studies have found a substantial effect of racial bias for crimes stereotypically associated with a particular race—for example, relatively higher guilty ratings for whites charged with embezzlement or blacks charged with motor vehicle theft.264 Anoth-er study evaluated the interaction of defendant race, socioeconomic sta-tus, and attorney race on mock juror evaluations. Although no factor was individually significant, the three factors combined were highly signifi-cant; all else being equal, the Mexican, poor defendant with a Mexican attorney was judged guilty by 55% of jurors, while the white, rich de-fendant with a white attorney was judged guilty by only 32% of jurors.265
f. Cross-Racial Eyewitness Identification Is Substantially Less Accurate, and Cross-Racial Lineup Construction Is Less Fair
The “cross-race bias” eyewitness phenomenon is the finding that “[e]yewitnesses are more accurate when identifying members of their own race than members of other races.”266 In a survey of sixty-four emi-nent experts on eyewitness research, 90% agreed that the cross-race bias phenomenon is reliable enough to be presented in court.267 Further, a 262. Tara L. Mitchell et al., Racial Bias in Mock Juror Decision-Making: A Meta-Analytic Review of Defendant Treatment, 29 LAW & HUM. BEHAV. 621, 621 (2005). 263. Id. at 629. 264. Randall A. Gordon et al., Perceptions of Blue-Collar and White-Collar Crime: The Effect of Defendant Race on Simulated Juror Decisions, 128 J. SOC. PSYCHOL. 191, 195 (2001); Christo-pher S. Jones & Martin F. Kaplan, The Effects of Racially Stereotypical Crimes on Juror Decision-Making and Information-Processing Strategies, 25 BASIC & APPLIED SOC. PSYCHOL. 1, 5–7, 9 (2003). 265. Russ K. E. Espinoza & Cynthia Willis-Esqueda, Defendant and Defense Attorney Charac-teristics and Their Effects on Juror Decision Making and Prejudice Against Mexican Americans, 14 CULTURAL DIVERSITY & ETHNIC MINORITY PSYCHOL. 364, 367–68 tbls.1 & 2 (2008). 266. Saul M. Kassin et al., On the “General Acceptance” of Eyewitness Testimony Research: A New Survey of the Experts, 56 AM. PSYCHOLOGIST 405, 408 tbl.1 (2001). 267. Id. at 407, 410.
2012] Task Force Report 669
comprehensive and well-regarded meta-analysis of studies regarding cross-racial eyewitness identification found that cross-racial identifica-tions are 1.56 times more likely to be erroneous than same-race identifi-cations.268 Considering the important role that eyewitness testimony plays in criminal trials, this incongruity is disturbing. Similarly, another study found that cross-racial lineup constructions (lineups constructed by individuals of a different race than the suspect) are likely to be done with less time and attention to detail in selecting foils and are therefore less fair.269
3. Bias and Outcomes Research also demonstrates that bias, whether conscious or uncon-
scious, affects behaviors. In one study, résumés were sent to 1250 em-ployers who had advertised that they were hiring.270 The résumés were altered so that some résumés had stereotypically white-sounding names while others had stereotypically black-sounding names. Each prospective employer received four résumés from the researchers: “an average white applicant, an average black applicant, a highly skilled white applicant, and a highly skilled black applicant.”271 Much to the surprise of the re-searchers,
the résumés with white-sounding names triggered 50 percent more callbacks than résumés with black-sounding names. Furthermore, the researchers found that the high-quality black résumés drew no more calls than the average black résumés. Highly skilled candi-dates with white names got more calls than average white candi-dates, but lower-skilled candidates with white names got many more callbacks than even highly skilled black applicants.272
While this study involved fictitious black and white applicants in an employment setting, its implications are of significant concern for the criminal justice system, where a significant body of research has con-firmed the presence of bias and disparate outcomes.
A difficulty remains, though, with connecting bias to behavior to particular outcomes. Absent an admission from an officer who was moti-vated by bias, blacks, Latinos, and Native-Americans who are stopped
268. Christian A. Meissner & John C. Brigham, Thirty Years of Investigating the Own-Race Bias in Memory for Faces: A Meta-Analytic Review, 7 PSYCHOL. PUB. POL’Y & L. 3, 15 (2001). 269. John C. Brigham & David J. Ready, Own-Race Bias in Lineup Construction, 9 LAW & HUM. BEHAV. 415, 422–23 (1985). 270. Shankar Vedantam, See No Bias, WASH. POST, Jan. 23, 2005, at W12, available at http://www.washingtonpost.com/wp-dyn/articles/A27067-2005Jan21.html. 271. Id. 272. Id.
670 Seattle University Law Review [Vol. 35:623 Gonzaga Law Review Washington Law Review
and searched while driving their cars cannot prove discrimination. Yet more blacks, Latinos, and Native-Americans are searched, even though statistically, those individuals are less likely to be in possession of nar-cotics.273
Because of the cumulative effect of facially neutral policies that have disproportionate impacts, and because of the subtle operation of bias at various decision points, a disproportionate number of people of color in Washington State find themselves incarcerated or otherwise in-volved with the criminal justice system—a disproportion that cannot be fully accounted for by involvement in crime.
Further, due to the difficulties in proving intent and the limits of current antidiscrimination laws,274 many of the solutions to the problem of bias in the criminal justice system will have to come from outside of the courtroom. The research shows that implicit racial bias is not an una-voidable component of human decision-making. Substantial research has begun to determine the most effective methods of minimizing such bi-as.275 Implicit-bias research should inform policymaking and training within the criminal justice system, albeit with great care and considera-tion.276
IV. CONCLUSION A time comes when silence is betrayal.
—Martin Luther King, Jr., 1967 There is a problem in our justice system.
273. Pickerill et al., supra note 192, at 13 tbl.3. 274. Jack M. Balkin & Reva B. Siegel, Remembering How to Do Equality, in THE CONSTITUTION IN 2020, at 94, 94–99 (Jack M. Balkin & Reva B. Siegel eds., 2009). 275. See, e.g., Sophie Lebrecht et al., Perceptual Other-Race Training Reduces Implicit Racial Bias, PLOS ONE, Jan. 2009, at e4215, at 1, 4–5 (concluding that training in distinguishing other-race faces decreases bias shown in IAT); Nilanjana Dasgupta & Anthony G. Greenwald, On the Mallea-bility of Automatic Attitudes: Combating Automatic Prejudice with Images of Admired and Disliked Individuals, 81 J. PERSONALITY & SOC. PSYCHOL. 800, 803, 804 fig.1 (2001) (concluding that expo-sure to images of liked and disliked members of racial groups affects performance on IAT). 276. See, e.g., Dale Larson, A Fair and Implicitly Impartial Jury: An Argument for Administer-ing the Implicit Association Test During Voir Dire, 3 DEPAUL J. FOR SOC. JUST. 139, 169 (2010) (“[M]ake the IAT universal in jury assembly rooms . . . and test jurors for the categories most likely to generate bias that could play a role in the cases scheduled for the day . . . .”); Gary L. Wells & Elizabeth A. Olson, The Other-Race Effect in Eyewitness Identification: What Do We Do About It?, 7 PSYCHOL. PUB. POL’Y & L. 230, 241–43 (2001) (suggesting more lineup foils and own-race lineup construction in cases of other-race eyewitness identification).
2012] Task Force Report 671
In this Report, we find that race and racial bias affect outcomes in the criminal justice system and matter in ways that are not fair, that in-crease disparity in incarceration rates, that do not advance legitimate public safety objectives, and that undermine public confidence in our criminal justice system. We have presented evidence of racial and ethnic disproportionality and disparities in the criminal justice system. Arrest and conviction rates do not correlate precisely with criminal behavior rates and cannot serve as a proxy for criminality. Much of the dispropor-tionality cannot be explained by legitimate race-neutral factors.
Put simply, we have found disparity and mistrust. Together, we must fix it for the sake of our democracy.
Our democracy is based on the rule of law and faith in the fairness of the justice system. This faith is undermined by disparity and by high-profile incidents of violence toward people of color by law enforce-ment.277 The problem is not a “people of color” problem. It is our prob-lem as a society to address.
We, the Task Force on Race and the Criminal Justice System, are devoted to reducing racial disparity in the justice system. Existence would be intolerable were we never to dream. We dream of completely eliminating bias in criminal, civil, juvenile, and family law matters. But there is a long history of overpromising and underdelivering. We ask that you join us with energy and goodwill, so we are not added to this list of failures. We prefer the folly of enthusiasm to the indifference of wisdom from those who purport to know better.
We ask that you trust only action because progress happens at the level of events, not of words. Please join our effort to address bias in the justice system at every level. We have hope because we are united and committed to working collaboratively despite our differences. We cele-brate the efforts of this Task Force to work together to build a community based on trust, equality, and respect.
277. Steve Miletich, SPD Officer Charged with Assault in Videotaped Kicking, SEATTLE TIMES (Apr. 13, 2011), http://seattletimes.nwsource.com/html/localnews/2014766865_officercharg ed14m.html.