
Preliminary - NYUpages.stern.nyu.edu/~lpederse/papers/ValMomEverywhere_Slides.pdf• Value and...
47
VALUE AND MOMENTUM EVERYWHERE Clifford S. Asness AQR Capital Management, LLC Tobias J. Moskowitz University of Chicago, GSB and NBER Lasse H. Pedersen NYU, CEPR, and NBER Preliminary
Transcript of Preliminary - NYUpages.stern.nyu.edu/~lpederse/papers/ValMomEverywhere_Slides.pdf• Value and...

AQR Capital Management, LLC | Two Greenwich Plaza, Third Floor | Greenwich, CT 06830 | T: 203.742.3600 | F: 203.742.3100 | www.aqr.com
VALUE AND MOMENTUM EVERYWHERE
Clifford S. AsnessAQR Capital Management, LLC
Tobias J. MoskowitzUniversity of Chicago, GSB and NBER
Lasse H. PedersenNYU, CEPR, and NBER
Preliminary

2
Motivation
Some of the most studied capital market phenomena are • Value effect: assets with high “book value”-to-market value outperform those with low ones• Momentum effect: recent relative winners outperform recent relative losers
Value and momentum are often studied• only separately• only in certain asset classes• only one asset class at a time
Literature• US stock selection (Statman (1980), Fama-French (1992), Jegadeesh and Titman (1993), Asness (1994))• Stocks in other countries (Fama and French (1998), Rouwenhorst (1998), Liew and Vassalou (2000),
Griffin and Martin (2003), Chui, Titman, Wei (2002))• Country equity indices (Asness, Liew, and Stevens (1997), Bhojraj and Swaminathan (2006))• Currency momentum (Shleifer and Summers (1990), Kho (1996), LeBaron (1999))• Commodity momentum (Gorton, Hayashi and Rouwenhorst (2007))• Value effects in currencies and commodities (?)• Value and momentum in government bonds (?)

3
What We Do
Identify connections between value and momentum across markets
• Providing evidence for common global phenomena/ factors
Gain insight by looking across asset classes and globally at once
• Providing new insights
• Added statistical power
• Consider common explanations: macro and liquidity risks
Extend and unify analysis of value and momentum “everywhere”
• Breadth of asset classes and markets studied in a unified setting
• Study value and momentum simultaneously everywhere

4
Main Results
Value and momentum effects appear in all of the major asset classes
• Value and momentum strategies both have positive Sharpe ratios despite being negatively correlated
• Therefore, the 50/50 combination has higher Sharpe than either stand alone
• Large diversification benefits from combining asset classes globally:
1. Economic power of the combined asset class portfolios
2. Statistical power of the combined portfolio reduces noise
Striking co-movement patterns across asset classes:
• Value here correlates with value there
• Momentum here correlates with momentum there
• Value and momentum negatively correlated everywhere

5
Main Results
Relation to macro risk:
• Value and momentum both load positively on long-run consumption risk and negatively on a business cycle recession indicator
• Support for global macroeconomic and long-run consumption risk (Bansal and Yaron (2004), Parker and Julliard (2005), Hansen, Heaton and Li (2008), Malloy, Moskowitz, Vissing-Jorgensen (2008))
• This can only explain a (small) part of the premia
• Can explain some of co-movement structure, but not negative correlation between value and momentum
Relation to liquidity risk:
• Value loads positively and momentum loads negatively on our measure of funding liquidity risk
• Liquidity risk is priced (Pastor and Stambaugh (2003), Acharya and Pedersen (2005))–May explain part of value premium, but makes momentum more puzzling
• Partly explains global comovement patterns and negative correlation between value and momentum
• Market and funding liquidity are linked and affect co-movement (Brunnermeier and Pedersen (2008))
These risks are statistically present when looking everywhere, are not easy to detect in any single strategy, but there is a lot left to be explained
• Could be due to trading costs and limited arbitrage

6
Overview of Talk
Data and methodology
New facts on performance of value and momentum everywhere
Co-movement everywhere
Exposures to macroeconomic and liquidity risks
The power of looking everywhere at once

7
We use simple and, to the extent possible, standard measures
Momentum: Return from t-12 to t-2 months
Value:• Stocks: book to price • Country equity indices: aggregate book to price • Commodities: “book” to price, where “book” is the average commodity spot price 4.5 to 5.5 years ago– c.f. DeBondt and Thaler (1985) and Fama and French (1996)
• Currencies: “book” to price, where “book” is the average exchange rate 4.5 to 5.5 years ago adjusted for interest-rate differentials, i.e. excess return from t-60 to t-1 – c.f. deviation from UIP, or change in PPP if real rates are constant across countries
• Bonds: real bond yield, i.e. yield minus expected inflation– c.f. book to price, where book is discounted cash-flows using expected inflation
We use most recently available price in our value measure• Induces some negative correlation between value and momentum within (but not across) asset classes• We also replicate using lagged value measures for robustness (appendix in the paper)• Using most recent price is a natural value measure (hard to imagine more recent price does not provide
useful information)
Measures of Value and Momentum

8
Methodology
For each asset class, construct a long-short portfolio with weightswit
VALUE = ct ( rank(VALUEit ) – average(rank) ) where ct is chosen such that the portfolio is either:
1. Constant leverage: $1 long, $1 short 2. Constant ex-ante volatility: 10% annualized
Variance-covariance matrix from rolling 3-year window of returns
Returns to valuert
VALUE = Σi witVALUE rit
Similar for momentum.
The 50/50 value/momentum combo returns arert
COMBO = st ( 0.5 rtVALUE + 0.5 rt
MOM )where st maintains scale (either dollar long-short or 10% ex-ante volatility)
We combine strategies across asset classes and rescale to 10% volatility ex post• Equal weight across asset classes and markets

9
Data Sources
Stock selection• U.S.: – Universe: CRSP common equity with a recent book value, at least 12 months of returns, excluding ADR’s, foreign
shares REITS, financials, closed-end funds, stocks with share prices less than $1, and stocks in bottom quartile of market cap. Focus on top half of remaining universe based on market cap (top 37.5% of total universe).
– Prices and returns: CRSP– Book values: Compustat
• U.K., Japan, Continental Europe: – Universe: BARRA with recent book value from Worldscope, at least 12 months of returns and same filters as US.– Prices and returns: Barra– Book values: Worldscope
Equity country selection• Stock index returns and book values: MSCI
Bond country selection• Returns: Datastream MSCI 10-year government bond index in excess of local short rate• Short rate and 10-year government bond yield: Bloomberg• Inflation forecasts for next 12 months: analysts estimates compiled by Consensus Economics
Currency selection• Spot exchange rates: Datastream• IBOR short rates: Bloomberg

10
Data Sources
Commodity selection• Aluminum, Copper, Nickel, Zinc, Lead, Tin: London Metal Exchange (LME)• Brent Crude, Gas Oil: Intercontinental Exchange (ICE)• Live Cattle, Feeder Cattle, Lean Hogs: Chicago Mercantile Exchange (CME)• Corn, Soybeans, Soy Meal, Soy Oil, Wheat: Chicago Board of Trade (CBOT)• WTI Crude, RBOB Gasoline, Heating Oil, Natural Gas: New York Mercantile Exchange (NYMEX)• Gold, Silver: New York Commodities Exchange (COMEX)• Cotton, Coffee, Cocoa, Sugar: New York Board of Trade (NYBOT)• Platinum: Tokyo Commodity Exchange (TOCOM)
Macro indicators• Recession = linear interpolation between peak (=0) and trough dates (=1)– US dates from NBER, Non-US dates from Economic Cycle Research Institute
• Long-run consumption growth = 3-year future growth in per capita consumption (sum of 3-year changes in above)
Funding liquidity indicators• TED spread (3 month LIBOR minus 3 month T-bill rate), U.S., U.K., Japan, Germany (Bloomberg and
International Fund Services (IFS))• 3-month LIBOR minus term repo rate (IFS, various brokers)

11
Performance
We consider within each asset class
• The return of
– Value
– Momentum
– 50/50 combo
• Correlation of value and momentum
• Both $1 long-short and constant volatility (in order to combine asset classes)

12
Table 2: Performance of Value and Momentum Strategies Scaled to Constant Volatility
Value Momentum ComboSR SR SR Avg. #
(t-stat) (t-stat) (t-stat) Cor(val,mom) securities
U.S. 0.21 0.78 1.13 -0.60 1,36703/73-02/08 (1.23) (4.60) (6.69)
U.K. 0.30 1.26 1.67 -0.61 48612/84-02/08 (1.43) (6.08) (8.05)
Japan 0.89 0.23 1.12 -0.53 94702/85-02/08 (4.28) (1.09) (5.41)
Continental Europe 0.33 1.12 1.69 -0.53 1,09602/88-02/08 (1.49) (4.89) (7.41)
Global stock selection 0.40 1.18 2.00 -0.6702/88-02/08 (1.78) (5.28) (8.97)
Equity country selection 0.58 0.68 1.08 -0.41 1802/80-02/08 (3.08) (3.62) (5.70)
Bond country selection 0.45 0.41 0.51 0.07 1001/90-02/08 (1.92) (1.73) (2.19)
Currency selection 0.44 0.45 0.64 -0.41 1008/80-02/08 (2.30) (2.35) (3.38)
Commodity selection 0.30 0.58 0.84 -0.39 2702/80-02/08 (1.60) (3.05) (4.44)
All non-stock selection 0.63 0.96 1.33 -0.3801/90-02/08 (2.67) (4.09) (5.67)
All asset selection 0.64 1.22 2.01 -0.5601/90-02/08 (2.73) (5.21) (8.58)
Panel A: Stock Selection
Panel B: Non-Stock Selection

13
Cumulative Returns (1990-9/30/2008)
01/01/90 01/01/00-50
0
50
100
150
200
250
300
350
400
450P
erce
ntAll Stock Selection
Cor(VAL,MOM)=-0.67 SRVAL=0.41 SRMOM=1.18 SRCOMBO=2.02
ValueMomentumCombo
01/01/90 01/01/00-50
0
50
100
150
200
250
300
350
400
450
Per
cent
All Non-Stock Selection
Cor(VAL,MOM)=-0.39 SRVAL=0.63 SRMOM=0.87 SRCOMBO=1.24
ValueMomentumCombo
01/01/90 01/01/00-50
0
50
100
150
200
250
300
350
400
450
Per
cent
All Asset Selection
Cor(VAL,MOM)=-0.57 SRVAL=0.65 SRMOM=1.16 SRCOMBO=1.97
ValueMomentumCombo
14
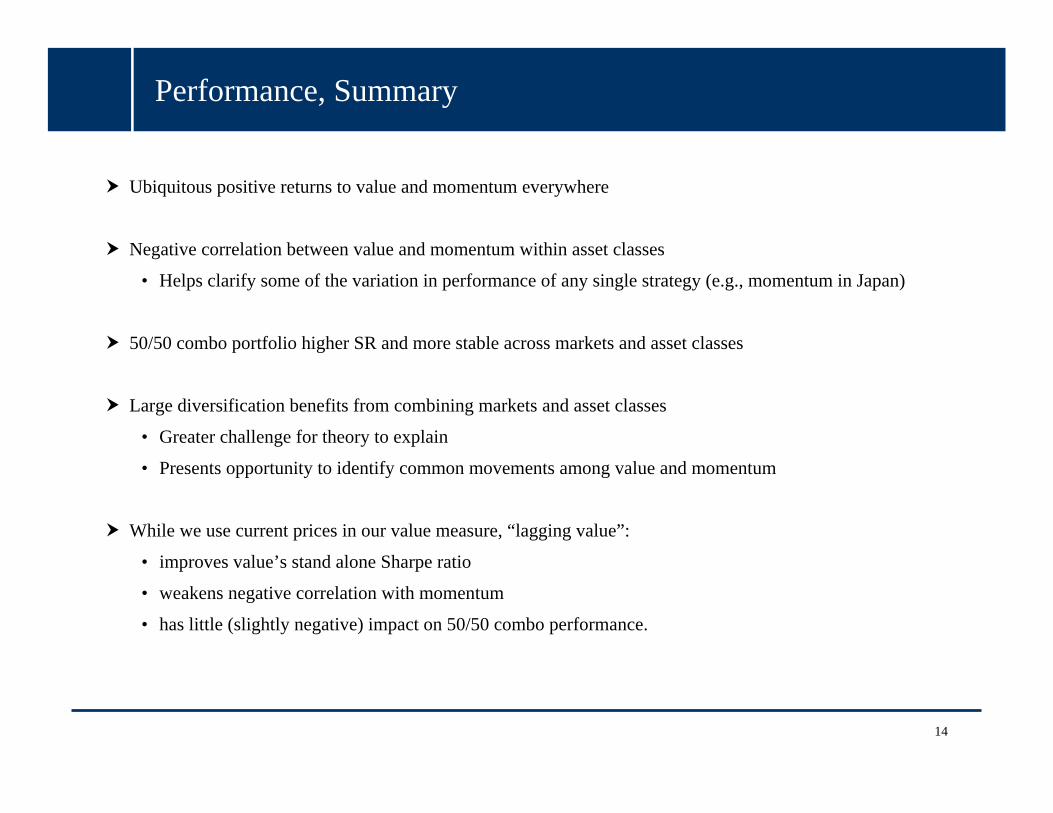
Performance, Summary
Ubiquitous positive returns to value and momentum everywhere
Negative correlation between value and momentum within asset classes
• Helps clarify some of the variation in performance of any single strategy (e.g., momentum in Japan)
50/50 combo portfolio higher SR and more stable across markets and asset classes
Large diversification benefits from combining markets and asset classes
• Greater challenge for theory to explain
• Presents opportunity to identify common movements among value and momentum
While we use current prices in our value measure, “lagging value”:
• improves value’s stand alone Sharpe ratio
• weakens negative correlation with momentum
• has little (slightly negative) impact on 50/50 combo performance.

15
Over-Optimistic or Pessimistic for Real-World Implementation?
Over-optimistic
• No transactions or financing costs– makes performance closer for stock vs. non-stock and val vs. mom
• Backtests never hits a funding-liquidity problem
• Going forward returns may be lower– data-mining (though having looked everywhere reduces this risk)
– because some people trade on these strategies
or, not, e.g. because returns are compensation for risk?
Over-pessimistic
• We used only the simplest value and momentum measures; weighting each strategy the same
• There are many possible improvements (that must be balanced vs. the dangers of data-mining); e.g., improved value/momentum measures, variable strategy weighting (statically and dynamically)
16
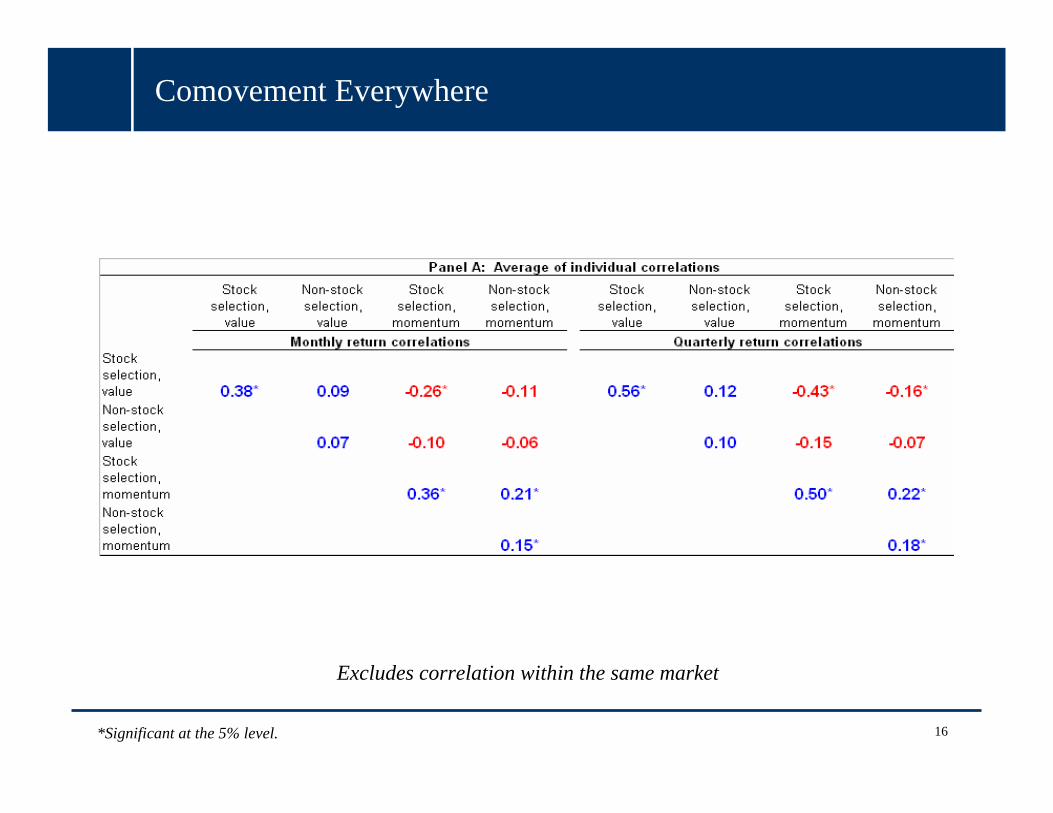
Excludes correlation within the same market
Comovement Everywhere
*Significant at the 5% level.

17
Comovement Everywhere
*Significant at the 5% level.

18
Comovement Everywhere
*Significant at the 5% level.

19
Comovement Everywhere
*Significant at the 5% level.
Stock selection, combo
Non-stock selection, combo
Stock selection, combo
Non-stock selection, combo
Stock Selection, combo 0.29 0.10 0.44 0.12
Non-stock selection, combo 0.06 0.07
Monthly return correlations Quarterly return correlations

20
Common Components
Time-series regressions of value (momentum) here on value and momentum elsewhere:
valueti
ik
momentumtki
ik
valuetkii
valueti rrr ,,,, 7
171 εγβα +⎟
⎠
⎞⎜⎝
⎛+⎟
⎠
⎞⎜⎝
⎛+= ∑∑
≠≠
momentumti
ik
momentumtki
ik
valuetkii
momentumti rrr ,,,, 7
171 εγβα +⎟
⎠
⎞⎜⎝
⎛+⎟
⎠
⎞⎜⎝
⎛+= ∑∑
≠≠

21
Common Components, continued

22
Common Components, Summary
Value loads positively on value elsewhere, with a little residual alpha left over.
Momentum loads positively on momentum elsewhere, with a little more residual alpha left over.
• Implies: common global factor structure in value and momentum, but can’t “explain” entire premium
Value and momentum load negatively on each other elsewhere.
• Implies: value and momentum may load oppositely on some common global factor(s).
50/50 combo portfolio loads positively on value and momentum, but with substantially more alpha than either stand alone strategy.
What are candidates for common factors and which ones are exaggerated or diminished when combining value and momentum?

23
Macroeconomic and Liquidity Risk
Table 6, Panel A: Multivariate regressions on macroeconomic and liquidity risk factors

24
Alternative Liquidity Risk Measures
Table 6, Panel B: Alternative Liquidity Risk Measures

25
Power of Looking Everywhere: Liquidity Risk

26
Power of Looking Everywhere: Long-Run Consumption Risk

27
We see consistency of results across markets
We gain statistical power by looking everywhere at once
• Average exposure vs. exposure of the average
• Average t-stat less than t-stat of average
Patterns not easily detectable when looking at only one asset class or strategy at a time
The Power of Looking Everywhere

28
Economic Magnitudes
Statistical correlations we uncover are significant and interesting, but only a starting point
Economic magnitudes of premia and correlation structure explained is small
Macroeconomic risks may explain a (small) part of value and momentum premia, but have no hope of explaining negative correlation between them
Liquidity risk may explain part of value premium and negative correlation between value and momentum, but only makes momentum premium more puzzling
These patterns should be accommodated by any theory seeking to explain these phenomena
A lot left to be explained!
29
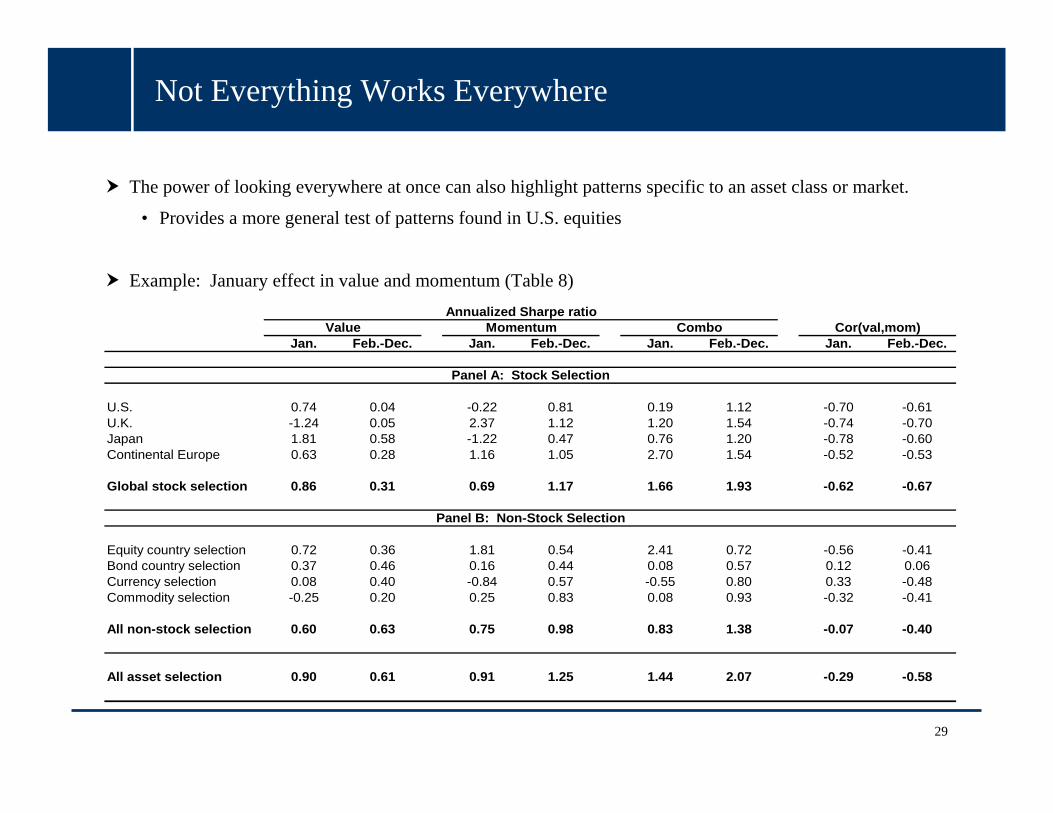
Not Everything Works Everywhere
The power of looking everywhere at once can also highlight patterns specific to an asset class or market.
• Provides a more general test of patterns found in U.S. equities
Example: January effect in value and momentum (Table 8)
Jan. Feb.-Dec. Jan. Feb.-Dec. Jan. Feb.-Dec. Jan. Feb.-Dec.
U.S. 0.74 0.04 -0.22 0.81 0.19 1.12 -0.70 -0.61U.K. -1.24 0.05 2.37 1.12 1.20 1.54 -0.74 -0.70Japan 1.81 0.58 -1.22 0.47 0.76 1.20 -0.78 -0.60Continental Europe 0.63 0.28 1.16 1.05 2.70 1.54 -0.52 -0.53
Global stock selection 0.86 0.31 0.69 1.17 1.66 1.93 -0.62 -0.67
Equity country selection 0.72 0.36 1.81 0.54 2.41 0.72 -0.56 -0.41Bond country selection 0.37 0.46 0.16 0.44 0.08 0.57 0.12 0.06Currency selection 0.08 0.40 -0.84 0.57 -0.55 0.80 0.33 -0.48Commodity selection -0.25 0.20 0.25 0.83 0.08 0.93 -0.32 -0.41
All non-stock selection 0.60 0.63 0.75 0.98 0.83 1.38 -0.07 -0.40
All asset selection 0.90 0.61 0.91 1.25 1.44 2.07 -0.29 -0.58
Annualized Sharpe ratioCor(val,mom)Value Momentum Combo
Panel A: Stock Selection
Panel B: Non-Stock Selection

30
Conclusion
Value and momentum works in a variety of markets and asset classes
Their combination works better than either stand alone
Large economic and statistical benefits to our unified approach of looking across markets and asset classes
Identify interesting global co-movement structure
Data hint toward a link between these phenomena and
• Liquidity risk
• Macro risk
Still far from a full explanation!
Theory must accommodate the patterns we uncover:
• Large Sharpe ratios from combining strategies across asset classes
• Why value and momentum both positively related to macro risk
• Why value and momentum load oppositely on liquidity risk– “Cheap” assets get cheaper during liquidity events, but trending assets do better.
• What causes the link between similar strategies in seemingly different asset classes?

31
Appendix

32
Other Liquidity Measures: Relation to Value and Momentum
Dependent variable = Value Momentum Value Momentum Value Momentum Value Momentum
Global TED spread ‐0.053 0.024 ‐0.044 0.011 ‐0.002 0.003 ‐0.029 0.008(‐2.97) (1.40) (‐2.39) (0.69) (‐0.15) (0.24) (‐1.75) (0.55)
ΔGlobal TED spread ‐0.077 0.047 ‐0.033 0.029 0.045 ‐0.005 0.008 0.013(‐2.73) (1.60) (‐1.35) (1.19) (2.00) (‐0.20) (0.30) (0.56)
US TED spread ‐0.032 0.011 ‐0.030 0.009 ‐0.007 0.002 ‐0.024 0.006(‐2.74) (1.18) (‐2.59) (1.03) (‐0.68) (0.25) (‐2.07) (0.75)
ΔUS TED spread ‐0.032 0.016 ‐0.003 0.000 0.036 ‐0.009 0.021 ‐0.005(‐1.58) (0.79) (‐0.19) (0.02) (2.58) (‐0.56) (1.23) (‐0.31)
Global Liquid‐illiquid passive ‐0.169 0.250 ‐0.203 0.341 ‐0.094 0.171 ‐0.190 0.292(‐1.57) (2.22) (‐1.98) (3.20) (‐0.98) (2.23) (‐1.94) (3.15)
US Liquid‐illiquid passive 0.113 0.160 0.052 0.150 ‐0.047 0.122 0.003 0.155(1.15) (1.46) (0.56) (1.52) (‐0.68) (1.88) (0.04) (1.94)
Pastor‐Stambaugh levels ‐0.014 ‐0.030 ‐0.055 ‐0.017 ‐0.015 ‐0.005 ‐0.045 ‐0.012(‐0.28) (‐0.61) (‐1.05) (‐0.33) (‐0.34) (‐0.10) (‐1.29) (‐0.25)
Pastor‐Stambaugh innovations 0.050 ‐0.097 0.026 ‐0.058 ‐0.017 ‐0.013 0.006 ‐0.040(0.78) (‐1.71) (0.40) (‐0.89) (‐0.36) (‐0.23) (0.12) (‐0.66)
Pastor‐Stambaugh VW factor ‐0.140 0.256 ‐0.208 0.236 ‐0.070 0.099 ‐0.178 0.191(‐1.97) (5.42) (‐3.62) (4.63) (‐1.65) (2.53) (‐3.88) (4.43)
Pastor‐Stambaugh EW factor ‐0.222 0.330 ‐0.267 0.350 ‐0.103 0.209 ‐0.237 0.318(‐3.34) (5.48) (‐4.17) (6.38) (‐2.25) (4.94) (‐4.93) (6.96)
Sadka transitory comp. 3.380 0.353 1.930 0.330 ‐0.267 0.495 1.063 0.470(3.29) (0.31) (1.61) (0.30) (‐0.33) (0.69) (1.02) (0.58)
Sadka permanent comp. 0.269 0.409 ‐0.168 1.278 ‐0.682 1.710 ‐0.543 1.702(0.51) (0.61) (‐0.31) (2.33) (‐1.20) (3.32) (‐1.19) (3.41)
Acharya‐Pedersen illiquidity 0.015 ‐0.022 0.007 ‐0.022 0.009 ‐0.015 0.010 ‐0.021(0.91) (‐1.38) (0.46) (‐1.25) (0.57) (‐1.10) (0.66) (‐1.33)
PC factor of all measures ‐0.046 0.023 ‐0.034 0.013 0.007 0.000 ‐0.017 0.007(‐6.48) (2.64) (‐3.89) (1.73) (0.48) (‐0.01) (‐1.75) (0.82)
All Asset SelectionUS Stock Selection Global Stock Selection All Non-Stock Selection

33
Other Liquidity Measures: Relation to Liquid-Minus-Illiquid
Dependent variable =
USAll stock selection All asset classes
Global TED spread 0.016 0.019 0.016(2.00) (2.94) (2.57)
ΔGlobal TED spread 0.054 0.057 0.048(2.46) (4.12) (3.73)
US TED spread 0.013 0.017 0.013(2.63) (3.86) (3.24)
ΔUS TED spread 0.042 0.040 0.036(2.83) (4.13) (3.61)
Pastor‐Stambaugh levels ‐0.045 ‐0.009 ‐0.005(‐0.96) (‐0.26) (‐0.21)
Pastor‐Stambaugh innovations ‐0.056 ‐0.016 ‐0.013(‐1.15) (‐0.43) (‐0.51)
Pastor‐Stambaugh VW factor ‐0.025 0.017 0.027(‐0.36) (0.57) (1.03)
Pastor‐Stambaugh EW factor 0.031 0.031 0.029(0.33) (0.82) (1.05)
Sadka transitory comp. ‐2.392 ‐2.783 ‐2.590(‐2.72) (‐3.23) (‐3.77)
Sadka permanent comp. ‐0.962 ‐0.875 ‐0.880(‐1.58) (‐2.21) (‐2.48)
Acharya‐Pedersen illiquidity 0.017 0.004 0.010(1.75) (0.39) (0.94)
PC factor of all measures 0.038 0.036 0.030(4.28) (5.76) (5.37)
Comparison of liquidity risk measuresLiquid - Illiquid Passive Returns

34
Other Liquidity Measures: Correlations
Global TED change Global TED US TED change US TED Global Liq‐Illiq US liq‐Illiq PS_level PS_innov Sad_trans Sad_perm PS_VW_liqfac PS_EW_liqfac AP_illiq PC indexGlobal TED 1.00 0.25 0.85 0.17 0.11 0.14 ‐0.07 ‐0.11 ‐0.20 ‐0.16 ‐0.02 0.07 ‐0.02 0.83change Global TED 0.25 1.00 0.16 0.66 0.20 0.22 ‐0.15 ‐0.11 ‐0.02 0.09 0.02 0.06 0.09 0.49US TED 0.85 0.16 1.00 0.24 0.09 0.16 ‐0.13 ‐0.15 ‐0.23 ‐0.21 0.01 0.07 0.07 0.89change US TED 0.17 0.66 0.24 1.00 0.21 0.26 ‐0.18 ‐0.15 ‐0.11 ‐0.07 0.01 0.05 0.22 0.56Global Liq‐Illiq 0.11 0.20 0.09 0.21 1.00 0.64 ‐0.04 ‐0.05 ‐0.22 ‐0.13 0.03 0.06 0.02 0.21US liq‐Illiq 0.14 0.22 0.16 0.26 0.64 1.00 ‐0.12 ‐0.13 ‐0.14 ‐0.17 ‐0.03 0.07 0.12 0.31PS_level ‐0.07 ‐0.15 ‐0.13 ‐0.18 ‐0.04 ‐0.12 1.00 0.85 0.06 0.21 0.00 0.01 ‐0.13 ‐0.31PS_innov ‐0.11 ‐0.11 ‐0.15 ‐0.15 ‐0.05 ‐0.13 0.85 1.00 0.10 0.29 ‐0.03 ‐0.01 ‐0.05 ‐0.31Sad_trans ‐0.20 ‐0.02 ‐0.23 ‐0.11 ‐0.22 ‐0.14 0.06 0.10 1.00 0.21 0.03 0.01 ‐0.21 ‐0.26Sad_perm ‐0.16 0.09 ‐0.21 ‐0.07 ‐0.13 ‐0.17 0.21 0.29 0.21 1.00 0.05 0.10 ‐0.27 ‐0.25PS_VW_liqfac ‐0.02 0.02 0.01 0.01 0.03 ‐0.03 0.00 ‐0.03 0.03 0.05 1.00 0.78 0.00 0.02PS_EW_liqfac 0.07 0.06 0.07 0.05 0.06 0.07 0.01 ‐0.01 0.01 0.10 0.78 1.00 0.01 0.10AP_illiq ‐0.02 0.09 0.07 0.22 0.02 0.12 ‐0.13 ‐0.05 ‐0.21 ‐0.27 0.00 0.01 1.00 0.24PC index 0.83 0.49 0.89 0.56 0.21 0.31 ‐0.31 ‐0.31 ‐0.26 ‐0.25 0.02 0.10 0.24 1.00
Average absolute value of correlations = 0.22
Global TED change Global TED US TED change US TED Global Liq‐Illiq US liq‐Illiq PS_level PS_innov Sad_trans Sad_perm PS_VW_liqfac PS_EW_liqfac AP_illiq PC indexGlobal TED 1.00 0.71 0.94 0.78 0.19 0.44 ‐0.70 ‐0.75 ‐0.54 ‐0.74 0.03 0.06 0.33 0.94change Global TED 0.71 1.00 0.64 0.95 0.03 0.33 ‐0.82 ‐0.82 ‐0.50 ‐0.70 0.01 ‐0.02 0.46 0.85US TED 0.94 0.64 1.00 0.73 0.19 0.37 ‐0.72 ‐0.77 ‐0.51 ‐0.68 0.06 0.18 0.39 0.94change US TED 0.78 0.95 0.73 1.00 0.06 0.38 ‐0.81 ‐0.84 ‐0.51 ‐0.70 ‐0.06 ‐0.02 0.46 0.91Global Liq‐Illiq 0.19 0.03 0.19 0.06 1.00 0.66 0.08 0.07 ‐0.15 ‐0.23 ‐0.19 ‐0.26 0.15 0.17US liq‐Illiq 0.44 0.33 0.37 0.38 0.66 1.00 ‐0.19 ‐0.17 ‐0.38 ‐0.47 ‐0.41 ‐0.43 0.41 0.45PS_level ‐0.70 ‐0.82 ‐0.72 ‐0.81 0.08 ‐0.19 1.00 0.97 0.41 0.58 ‐0.12 ‐0.16 ‐0.45 ‐0.85PS_innov ‐0.75 ‐0.82 ‐0.77 ‐0.84 0.07 ‐0.17 0.97 1.00 0.36 0.66 ‐0.09 ‐0.19 ‐0.46 ‐0.88Sad_trans ‐0.54 ‐0.50 ‐0.51 ‐0.51 ‐0.15 ‐0.38 0.41 0.36 1.00 0.39 ‐0.21 ‐0.13 ‐0.22 ‐0.55Sad_perm ‐0.74 ‐0.70 ‐0.68 ‐0.70 ‐0.23 ‐0.47 0.58 0.66 0.39 1.00 ‐0.06 ‐0.08 ‐0.60 ‐0.78PS_VW_liqfac 0.03 0.01 0.06 ‐0.06 ‐0.19 ‐0.41 ‐0.12 ‐0.09 ‐0.21 ‐0.06 1.00 0.77 ‐0.02 0.02PS_EW_liqfac 0.06 ‐0.02 0.18 ‐0.02 ‐0.26 ‐0.43 ‐0.16 ‐0.19 ‐0.13 ‐0.08 0.77 1.00 0.00 0.09AP_illiq 0.33 0.46 0.39 0.46 0.15 0.41 ‐0.45 ‐0.46 ‐0.22 ‐0.60 ‐0.02 0.00 1.00 0.53PC index 0.94 0.85 0.94 0.91 0.17 0.45 ‐0.85 ‐0.88 ‐0.55 ‐0.78 0.02 0.09 0.53 1.00
Average absolute value of correlations = 0.46
Correlations from 04/1987 to 09/2008
Correlations over the 10% most extreme liquidity events(199404, 200203, 199808, 200411, 200409, 199008, 199601, 199806, 199302, 198906, 200112, 198907, 199901, 199903, 199704, 200209, 199912, 200204, 200006, 199007, 200008, 198710, 199009, 200002)

35
Current versus Lagged Measures of Value
Comparison to Fama-French Portfolios (02/1973-02/2008)
Value Momentum Combo Corr(Val, Mom)
Fama-French 0.54 0.69 0.92 -0.11
AMP ($1 long-short) 0.37 0.63 1.03 -0.55Correlation with FF 0.79 0.92 0.89
AMP (constant volatility) 0.21 0.78 1.13 -0.60Correlation with FF 0.74 0.85 0.84
AMP ($1 long-short) 0.57 0.63 0.82 -0.06Correlation with FF 0.88 0.92 0.92
AMP (constant volatility) 0.41 0.78 0.92 -0.26Correlation with FF 0.86 0.85 0.82
Dependent variable = AMP Value AMP Value (lag) AMP Momentum AMP Combo
CoefficientIntercept 1.80% 0.84% 2.16% 4.08%RMRF -0.10 -0.09 0.06 -0.05SMB 0.03 -0.01 0.04 0.09HML 0.63 0.83 -0.07 0.63UMD -0.27 0.00 0.61 0.46
t-statisticIntercept 1.66 0.82 2.18 4.12RMRF -4.63 -4.51 3.00 -2.40SMB 1.11 -0.28 1.69 3.51HML 19.27 27.99 -2.29 21.28UMD -12.69 0.06 31.20 23.80
R-square 68.0% 75.4% 72.7% 72.7%
Dependent variable = HML UMD HML+UMD
CoefficientIntercept 0.60% -0.96% -0.24%AMP Value 0.95 0.17 0.56AMP Momentum 0.36 1.27 0.81
t-statisticIntercept 0.50 -0.70 -0.21AMP Value 25.67 3.89 19.68AMP Momentum 9.66 28.62 28.44
R-square 63.0% 72.4% 66.3%
Panel A: Sharpe ratio comparison
Panel B: Regression of AMP (constant volatility) on Fama-French portfolios
Panel C: Regression of Fama-French portfolios on AMP portfolios
Using most recent value measure available:
Using value measure lagged an additional year:

36
Current versus Lagged Measures of Value
Replicating Table 2 with Lagged Value Measures
U.S. 0.41 0.78 0.92 -0.2603/73-02/08 (2.42) (4.60) (5.46)
U.K. 0.80 1.26 1.57 -0.2812/84-02/08 (3.84) (6.08) (7.55)
Japan 0.86 0.23 0.92 0.0302/85-02/08 (4.12) (1.09) (4.41)
Continental Europe 1.08 1.12 1.69 0.0202/88-02/08 (4.85) (4.89) (7.38)
Global stock selection 1.01 1.18 1.98 -0.2902/88-02/08 (4.54) (5.28) (8.88)
Equity country selection 0.84 0.68 0.94 0.2202/80-02/08 (4.47) (3.62) (4.99)
Bond country selection 0.26 0.41 0.40 0.2201/90-02/08 (1.13) (1.73) (1.69)
Currency selection 0.57 0.45 0.56 -0.0208/80-02/08 (3.02) (2.35) (2.95)
Commodity selection 0.48 0.58 0.73 0.0602/80-02/08 (2.57) (3.05) (3.85)
All non-stock selection 0.86 0.96 1.15 0.0901/90-02/08 (3.67) (4.09) (4.90)
All asset selection 1.21 1.22 1.84 -0.0501/90-02/08 (5.16) (5.21) (7.82)
Panel A: Stock Selection
Panel B: Non-Stock Selection

37
Current versus Lagged Measures of Value
Replicating Table 4 with Lagged Value Measures
Stock selection,
value
Non-stock selection,
value
Stock selection,
momentum
Non-stock selection,
momentum
Stock selection,
value
Non-stock selection,
value
Stock selection,
momentum
Non-stock selection,
momentum
Stock selection, value 0.32* 0.02 -0.13* -0.02 0.44* 0.04 -0.18* -0.05Non-stock selection, value 0.02 -0.01 -0.03 0.03 -0.04 -0.04Stock selection, momentum 0.36* 0.21* 0.50* 0.22*Non-stock selection, momentum 0.15* 0.18*
Monthly return correlations Quarterly return correlations
Panel A: Average of individual correlations
Stock selection,
value
Non-stock selection,
value
Stock selection,
momentum
Non-stock selection,
momentum
Stock selection,
value
Non-stock selection,
value
Stock selection,
momentum
Non-stock selection,
momentum
Stock selection, value 1.00 0.16* -0.29* -0.02 1.00 0.23* -0.39* -0.03Non-stock selection, value 1.00 -0.08 -0.09 1.00 -0.14* -0.18*Stock selection, momentum 1.00 0.47* 1.00 0.69*Non-stock selection, momentum 1.00 1.00
Monthly return correlations Quarterly return correlations
Panel B: Correlation of average return series

38
Table 3: Alphas and Betas with Respect to Global CAPM
alpha beta alpha beta alpha beta(t-stat) (t-stat) (t-stat) (t-stat) (t-stat) (t-stat)
U.S. stock selection 2.95% -0.22 8.05% 0.03 12.54% -0.2203/73-02/08 (1.71) (-6.42) (4.47) (0.84) (7.30) (-6.37)
U.K. stock selection 3.23% 0.02 14.12% -0.07 19.29% -0.0812/84-02/08 (1.36) (0.43) (6.19) (-1.46) (8.16) (-1.64)
JP stock selection 10.23% -0.07 2.53% -0.01 13.56% -0.1002/85-02/08 (4.45) (-1.52) (1.11) (-0.26) (5.65) (-2.04)
Cont. Europe stock selection 3.58% -0.02 12.24% -0.12 18.08% -0.1302/88-02/08 (1.51) (-0.44) (5.11) (-2.37) (7.70) (-2.74)
All stock selection 4.39% -0.10 12.03% -0.09 20.81% -0.2302/88-02/08 (1.97) (-2.08) (5.38) (-1.89) (9.75) (-5.17)
Equity country selection 6.44% -0.08 7.27% 0.04 10.98% -0.0202/80-02/08 (3.31) (-2.12) (3.46) (1.03) (5.70) (-0.47)
Bond country selection 4.02% 0.13 3.56% 0.02 4.67% 0.0701/90-02/08 (1.81) (2.85) (1.56) (0.38) (1.99) (1.51)
Currency selection (0.05) 0.00 5.36% -0.03 6.72% -0.0308/80-02/08 (2.30) (0.05) (2.35) (-0.75) (3.36) (-0.70)
Commodity selection 3.39% 0.02 6.37% -0.01 8.68% 0.0202/80-02/08 (1.59) (0.58) (3.00) (-0.29) (4.37) (0.47)
All non-stock selection 6.32% 0.05 9.38% -0.03 13.12% 0.0001/90-02/08 (2.69) (1.10) (4.00) (-0.60) (5.56) (-0.10)
All asset selection 6.69% -0.04 12.24% -0.07 20.48% -0.1601/90-02/08 (2.84) (-0.72) (5.22) (-1.49) (8.88) (-3.28)
Annual Alpha and Beta to Global Equities
Value Momentum Combo
39
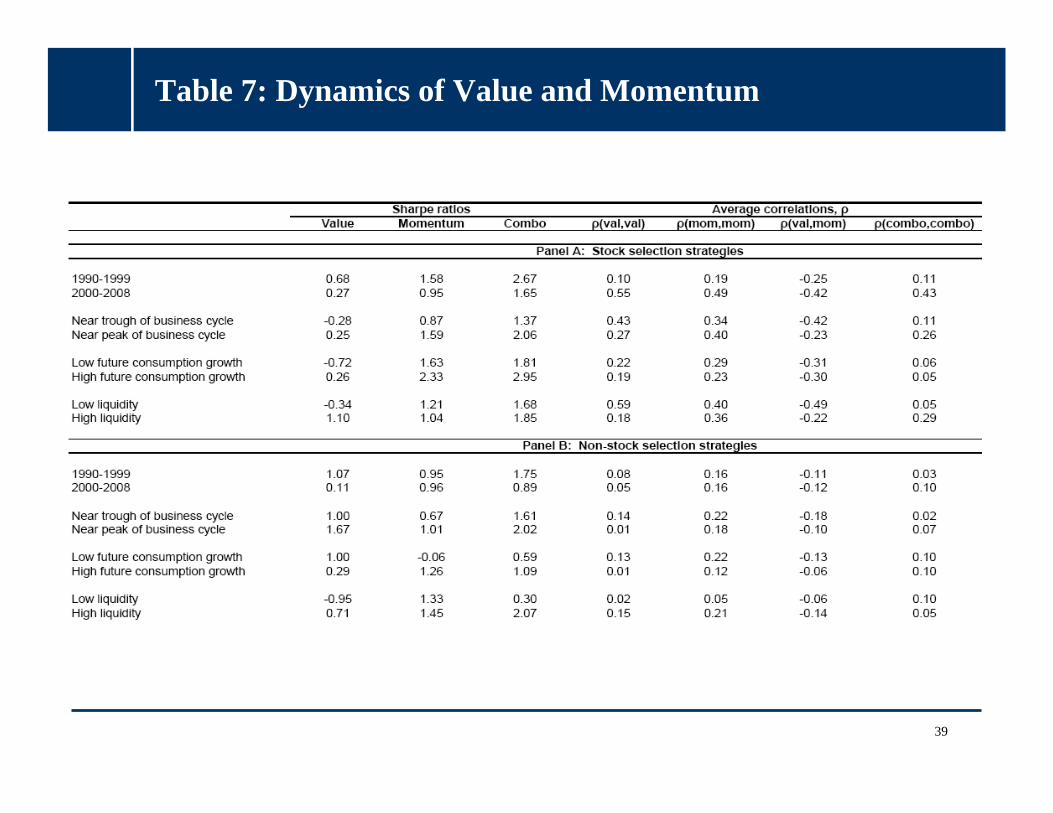
Table 7: Dynamics of Value and Momentum

40
Table 1: Performance of Value and Momentum Strategies Across Markets and Asset Classes $1 Long-Short
Avg. #
Value Momentum Combo Cor(val,mom) securities
U.S. 02/73-02/08mean 5.0% 10.3% 11.4% -0.55 1,367(t-stat) (2.04) (3.77) (6.30)volatility 14.5% 16.2% 10.8%Sharpe 0.34 0.64 1.06
U.K. 12/84-02/08mean 4.8% 13.5% 14.1% -0.59 486(t-stat) (1.75) (4.42) (7.46)volatility 13.2% 14.7% 9.1%Sharpe 0.36 0.92 1.55
Japan 01/85-02/08mean 11.6% 3.5% 11.8% -0.58 947(t-stat) (4.27) (1.06) (5.62)volatility 13.1% 16.0% 10.1%Sharpe 0.89 0.22 1.17
Continental Europe 02/88-02/08mean 5.3% 12.1% 13.3% -0.44 1,096(t-stat) (2.34) (4.29) (7.00)volatility 10.1% 12.3% 8.3%Sharpe 0.52 0.98 1.60
Equity country selection 02/80-02/08mean 5.0% 5.1% 8.6% -0.25 18(t-stat) (2.40) (2.16) (3.56)volatility 11.0% 12.5% 12.9%Sharpe 0.45 0.41 0.67
Bond country selection 01/90-02/08mean 0.9% -0.1% 0.6% -0.14 10(t-stat) (1.41) (-0.10) (0.95)volatility 2.7% 2.6% 2.6%Sharpe 0.33 -0.02 0.22
Currency selection 08/80-02/08mean 0.8% 4.2% 4.4% -0.48 10(t-stat) (0.48) (2.27) (2.53)volatility 9.3% 9.7% 9.1%Sharpe 0.09 0.43 0.48
Commodity selection 02/80-02/08mean 9.3% 6.0% 6.0% -0.38 27(t-stat) (1.77) (1.18) (2.44)volatility 27.7% 27.0% 12.9%Sharpe 0.33 0.22 0.46
Panel B: Non-Stock Selection
Panel A: Stock Selection
41
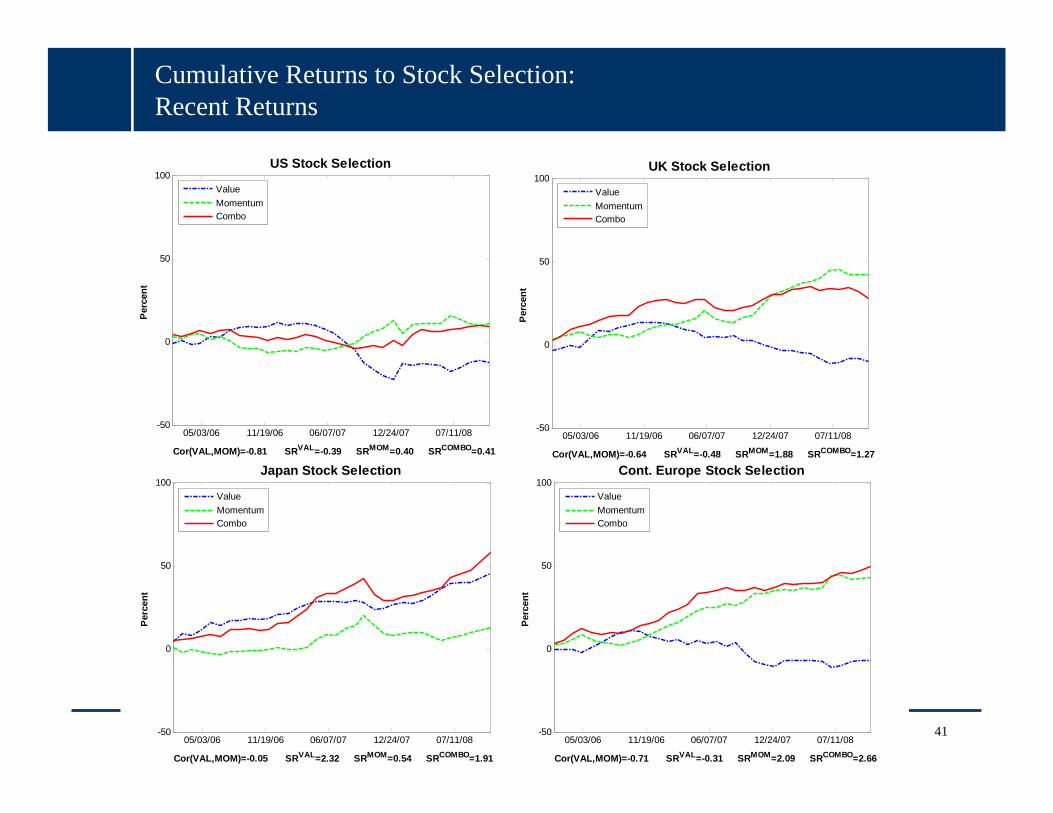
Cumulative Returns to Stock Selection: Recent Returns
05/03/06 11/19/06 06/07/07 12/24/07 07/11/08-50
0
50
100
Per
cent
US Stock Selection
Cor(VAL,MOM)=-0.81 SRVAL=-0.39 SRMOM=0.40 SRCOMBO=0.41
ValueMomentumCombo
05/03/06 11/19/06 06/07/07 12/24/07 07/11/08-50
0
50
100
Per
cent
UK Stock Selection
Cor(VAL,MOM)=-0.64 SRVAL=-0.48 SRMOM=1.88 SRCOMBO=1.27
ValueMomentumCombo
05/03/06 11/19/06 06/07/07 12/24/07 07/11/08-50
0
50
100
Perc
ent
Japan Stock Selection
Cor(VAL,MOM)=-0.05 SRVAL=2.32 SRMOM=0.54 SRCOMBO=1.91
ValueMomentumCombo
05/03/06 11/19/06 06/07/07 12/24/07 07/11/08-50
0
50
100
Perc
ent
Cont. Europe Stock Selection
Cor(VAL,MOM)=-0.71 SRVAL=-0.31 SRMOM=2.09 SRCOMBO=2.66
ValueMomentumCombo

42
Cumulative Returns to Non-Stock Selection: Recent Returns
05/03/06 11/19/06 06/07/07 12/24/07 07/11/08-50
0
50
100
Per
cent
Equity Country Selection
Cor(VAL,MOM)=-0.25 SRVAL=-0.78 SRMOM=0.51 SRCOMBO=-0.24
ValueMomentumCombo
05/03/06 11/19/06 06/07/07 12/24/07 07/11/08-50
0
50
100
Perc
ent
Bond Country Selection
Cor(VAL,MOM)=-0.48 SRVAL=-0.37 SRMOM=0.34 SRCOMBO=0.23
ValueMomentumCombo
05/03/06 11/19/06 06/07/07 12/24/07 07/11/08-50
0
50
100
Per
cent
Currrency Selection
Cor(VAL,MOM)=-0.77 SRVAL=-0.19 SRMOM=-0.42 SRCOMBO=-0.91
ValueMomentumCombo
05/03/06 11/19/06 06/07/07 12/24/07 07/11/08-50
0
50
100
Per
cent
Commodity Selection
Cor(VAL,MOM)=-0.23 SRVAL=-0.60 SRMOM=1.18 SRCOMBO=0.40
ValueMomentumCombo

43
Cumulative Returns to Combining Asset Classes: Recent Returns
05/03/06 11/19/06 06/07/07 12/24/07 07/11/08-50
0
50
100
Per
cent
All Stock Selection
Cor(VAL,MOM)=-0.73 SRVAL=0.22 SRMOM=1.82 SRCOMBO=2.90
ValueMomentumCombo
05/03/06 11/19/06 06/07/07 12/24/07 07/11/08-50
0
50
100
Perc
ent
All Non-Stock Selection
Cor(VAL,MOM)=-0.59 SRVAL=-0.99 SRMOM=0.53 SRCOMBO=-0.18
ValueMomentumCombo
05/03/06 11/19/06 06/07/07 12/24/07 07/11/08-50
0
50
100
Perc
ent
All Asset Selection
Cor(VAL,MOM)=-0.76 SRVAL=-0.52 SRMOM=1.10 SRCOMBO=1.24
ValueMomentumCombo

44
Recent Performance: 2003-2008
Value Momentum Combo SR SR SR Avg. #
(t-stat) (t-stat) (t-stat) Cor(val,mom) securities
U.S. 0.05 0.24 0.56 ‐0.76 1,36701/03-09/08 (0.12) (0.57) (1.34)
U.K. 0.48 1.13 1.57 ‐0.59 48601/03-09/08 (1.15) (2.72) (3.77)
Japan 1.14 0.53 1.69 ‐0.36 94701/03-09/08 (2.74) (1.28) (4.06)
Continental Europe 0.53 1.33 2.32 ‐0.74 1,09601/03-09/08 (1.28) (3.19) (5.56)
Global stock selection 0.86 1.18 2.51 -0.6901/03-09/08 (2.06) (2.83) (6.03)
Equity country selection 0.51 0.68 0.61 ‐0.06 1801/03-09/08 (1.23) (1.64) (1.45)
Bond country selection 0.45 0.66 0.83 ‐0.14 1001/03-09/08 (1.07) (1.59) (1.99)
Currency selection ‐0.27 0.18 ‐0.19 ‐0.72 1001/03-09/08 (‐0.64) (0.44) (‐0.45)
Commodity selection ‐0.37 0.80 0.45 ‐0.55 2701/03-09/08 (‐0.88) (1.91) (1.07)
All non-stock selection 0.08 0.91 0.75 -0.4001/03-09/08 (0.20) (2.19) (1.81)
All asset selection 0.53 1.18 1.76 -0.6001/03-09/08 (1.27) (2.84) (4.23)
Panel A: Stock Selection
Panel B: Non-Stock Selection

45
Cumulative Returns to Stock Selection: Updated Through Mid 10/2008
01/01/80 01/01/90 01/01/00-50
0
50
100
150
200
250
300
350
400
450
Perc
ent
US Stock Selection
Cor(VAL,MOM)=-0.60 SRVAL=0.21 SRMOM=0.77 SRCOMBO=1.13
ValueMomentumCombo
01/01/80 01/01/90 01/01/00-50
0
50
100
150
200
250
300
350
400
450
Perc
ent
UK Stock Selection
Cor(VAL,MOM)=-0.61 SRVAL=0.27 SRMOM=1.27 SRCOMBO=1.60
ValueMomentumCombo
01/01/80 01/01/90 01/01/00-50
0
50
100
150
200
250
300
350
400
450
Perc
ent
Japan Stock Selection
Cor(VAL,MOM)=-0.53 SRVAL=0.94 SRMOM=0.24 SRCOMBO=1.19
ValueMomentumCombo
01/01/80 01/01/90 01/01/00-50
0
50
100
150
200
250
300
350
400
450
Perc
ent
Cont. Europe Stock Selection
Cor(VAL,MOM)=-0.53 SRVAL=0.32 SRMOM=1.12 SRCOMBO=1.71
ValueMomentumCombo

46
Cumulative Returns to Non-Stock Selection: Updated Through 9/30/2008
01/01/90 01/01/00-50
0
50
100
150
200
250
300
350
Per
cent
Equity Country Selection
Cor(VAL,MOM)=-0.42 SRVAL=0.51 SRMOM=0.69 SRCOMBO=0.99
ValueMomentumCombo
01/01/90 01/01/00-50
0
50
100
150
200
250
300
350
Per
cent
Bond Country Selection
Cor(VAL,MOM)=0.02 SRVAL=0.49 SRMOM=0.32 SRCOMBO=0.50
ValueMomentumCombo
01/01/90 01/01/00-50
0
50
100
150
200
250
300
350
Per
cent
Currrency Selection
Cor(VAL,MOM)=-0.42 SRVAL=0.46 SRMOM=0.39 SRCOMBO=0.62
ValueMomentumCombo
01/01/90 01/01/00-50
0
50
100
150
200
250
300
350
Per
cent
Commodity Selection
Cor(VAL,MOM)=-0.37 SRVAL=0.30 SRMOM=0.57 SRCOMBO=0.82
ValueMomentumCombo

47
Common Components
First principal component for value and momentum strategies
1 2 3 4
-0.5
-0.4
-0.3
-0.2
-0.1
0
0.1
0.2
0.3
0.4
0.5
Global Stock Selection: First PC
US UK JPN EURO
Percentage of covariance matrix explained = 44.9% Annualized Sharpe ratio of PC factor = 0.5
ValueMomentum
1 2 3 4 5
-0.6
-0.4
-0.2
0
0.2
0.4
0.6All Asset Selection: First PC
Stocks Countries Bonds Currencies Commodities
Percentage of covariance matrix explained = 25.2% Annualized Sharpe ratio of PC factor = 0.57
ValueMomentum


