
Preliminary Information Contents Information NOAA/NOAA Research/Forecast Systems Laboratory SAM II...
16
Preliminary Information NOAA/NOAA Research/Forecast Systems Laboratory SAM II Contents Contents Information for Teachers Acknowledgements Letter to Colleagues in Science and Teachers National Science Education Content Standards Website Addresses Answer Key Student Activities Activity No. 1 - Anatomy of Clouds Activity No. 2 - Forecasting Severe Weather: Forecasters Use GPS to Observe a Hurricane Activity No. 3 - Disappearing Ozone Activity No. 4 - Forecasting Tornados: Forecasters Use Temperature, Dewpoint, and Air Pressure Activity No. 5 - El Niño and La Niña Activity No. 6 - Greenhouse Effect - Too Much, Too Little, or Just Right? Glossary
Transcript of Preliminary Information Contents Information NOAA/NOAA Research/Forecast Systems Laboratory SAM II...
Preliminary Information
NOAA/NOAA Research/Forecast Systems Laboratory SAM II
Contents
Contents
Information for Teachers
Acknowledgements
Letter to Colleagues in Science and Teachers
National Science Education Content Standards
Website Addresses
Answer Key
Student Activities
Activity No. 1 - Anatomy of Clouds
Activity No. 2 - Forecasting Severe Weather: ForecastersUse GPS to Observe a Hurricane
Activity No. 3 - Disappearing Ozone
Activity No. 4 - Forecasting Tornados: Forecasters UseTemperature, Dewpoint, and Air Pressure
Activity No. 5 - El Niño and La Niña
Activity No. 6 - Greenhouse Effect - Too Much, Too Little,or Just Right?
Glossary

Preliminary Information
NOAA/NOAA Research/Forecast Systems Laboratory SAM II
Acknowledgements
Acknowledgements
August 11, 2000July 11, 2001
Boulder, Colorado
I extend my sincere appreciation to the many individuals who helped to prepare SAM-II -Student Activities in Meteorology. The willingness of many National Oceanic and AtmosphericAdministration’s (NOAA) employees to spend time and effort and to share their knowledgeprovides the strong scientific basis for the SAM-II series.
To the many teachers who use the original Student Activities in Meteorology - SAM, I thankyou. Because of you, SAM is in its third printing and successful way beyond our originalaspirations. I hope that you find SAM-II as useful.
My gratitude goes to the American Meteorological Society (AMS) for their positive reviews ofSAM. Because of AMS, SAM received very valuable, national attention. To Rhonda Lange, Iowe a special note of thanks for providing the inspiration and opportunity to write SAM-II.Through Rhonda, NOAA’s Forecast Systems Laboratory provided many of the support ser-vices necessary during the draft writing of SAM-II. Many thanks to Holly Rosales who joinedour team as a student intern and provided fast and efficient research and computer support.
My sincere thanks to the following people for their contributions to SAM-II.
Christine Ennis Paul Freitag Cecilia GirzFred Gould Seth Gutman Gary HeckmanJim Holitza Kirk Holub Carol KnightRhonda Lange Tom LeFebvre Brooks MartnerDai McClurg Sandy MacDonald Barbara McGehanMike McPhadden Robert Munger John OsbornLarry Riddle Holly Rosales Tom SchlatterJulie Singewald Eric Thaler Tony TafoyaTim Vialpando Klaus Weickmann
Finally, I would like to acknowledge the following students whose comments helped to improvethe readability of the technical information presented in the activities: Rebecca Brosz, MichaelChady, Cortie Pierpont, Laura Smith, and Elise Welch.
Sincerely,
Beverly L. MeierScience Teacher – Boulder Valley School District
Beverly L. Meier
Preliminary Information
NOAA/NOAA Research/Forecast Systems Laboratory SAM II
Letter to Colleaguesin Science and Teachers
Letter to Colleagues in Science and Teachers
August 11, 2000July 11, 2001July, 16, 2002
Boulder, Colorado
Scientists from NOAA’s research laboratories in Boulder and Seattle have joined me in col-laborating for a second time to produce a series of classroom science activities on meteorol-ogy, and atmospheric and oceanic science. We call this second series Student Activities inMeteorology-II or SAM-II. As with the original SAM, our goal is to provide activities that areinteresting to students, and at the same time convenient and easy to use for teachers.
The topics that we chose are designed so that students use trend setting scientific researchand cutting edge technology to learn the processes of science - data collecting, graphing,analyzing, predicting, etc. - as well as information, principles, and concepts of science. InSAM-II, we included an oceanography activity to address the global effects of the atmosphere-ocean connection.
We believe that these activities are versatile and can be easily integrated into your currentscience, environmental studies, health and safety, social studies, and math curriculum. A gridthat shows how SAM-II conforms to the National Science Education Content Standards isincluded.
Also, please notice the Website addresses included in SAM-II. Some of the student activitiesare based on information that is available as website data or information. Students who arefamiliar with the Internet might enjoy comparing the results of their procedure to that of theresearchers. Other students may find more information on the topics that appear in SAM-II.
Although each SAM-II activity can be used alone, the series is designed to supplement yourestablished curriculum. Three activities, “Anatomy of Clouds”, “Disappearing Ozone”, and“Greenhouse Effect”, have two procedures. In each case, the first procedure is less difficultand can be done independently of the second procedure.
The activity, “Forecasting Tornados”, uses a complicated looking graph called a Skew-Tdiagram: yet, eighth graders, who had previous graphing experience, quickly mastered thediagonal graphing strategy during our field test.
We have included an updated version of the “Greenhouse Effect” from the original SAM. Thisnewer version includes a wealth of historical data including the currently available carbondioxide and methane concentrations. For all of SAM-II, we tried to create activitiesthat are both useful and flexible enough to adapt to different teaching and classroomstyles.

Preliminary Information
NOAA/NOAA Research/Forecast Systems Laboratory SAM II
Letter to Colleaguesin Science and Teachers
(Continued)
Furthermore, these activities are designed to span a wide range of grade and ability levels.The reading level is aimed at grades 7 - 10. All middle school and older students should beable to complete the procedures.
The questions that follow each procedure vary in difficulty and can challenge high schoolstudents. By design, easier questions are at the beginning followed by more difficult questionstoward the end of the question section. A serious attempt was made to incorporate math intothe procedures and follow-up questions.
All SAM-II activities are well-suited for small group instruction, individual student work, andindependent study. The activities have also been updated as of July 16, 2002 with someminor changes based on their first use in my classes. We hope that you find these activitiesflexible enough to adapt to your teaching and classroom style.
We hope that these activities prove to be interesting and motivational, and provide a spring-board to lively classroom discussions.
Sincerely,
Beverly L. MeierScience Teacher – Boulder Valley School District
Beverly L. Meier
Letter to Colleagues in Science and Teachers

Preliminary Information
NOAA/NOAA Research/Forecast Systems Laboratory SAM II
National Science Education Content Standards
National ScienceEducation Content Standards
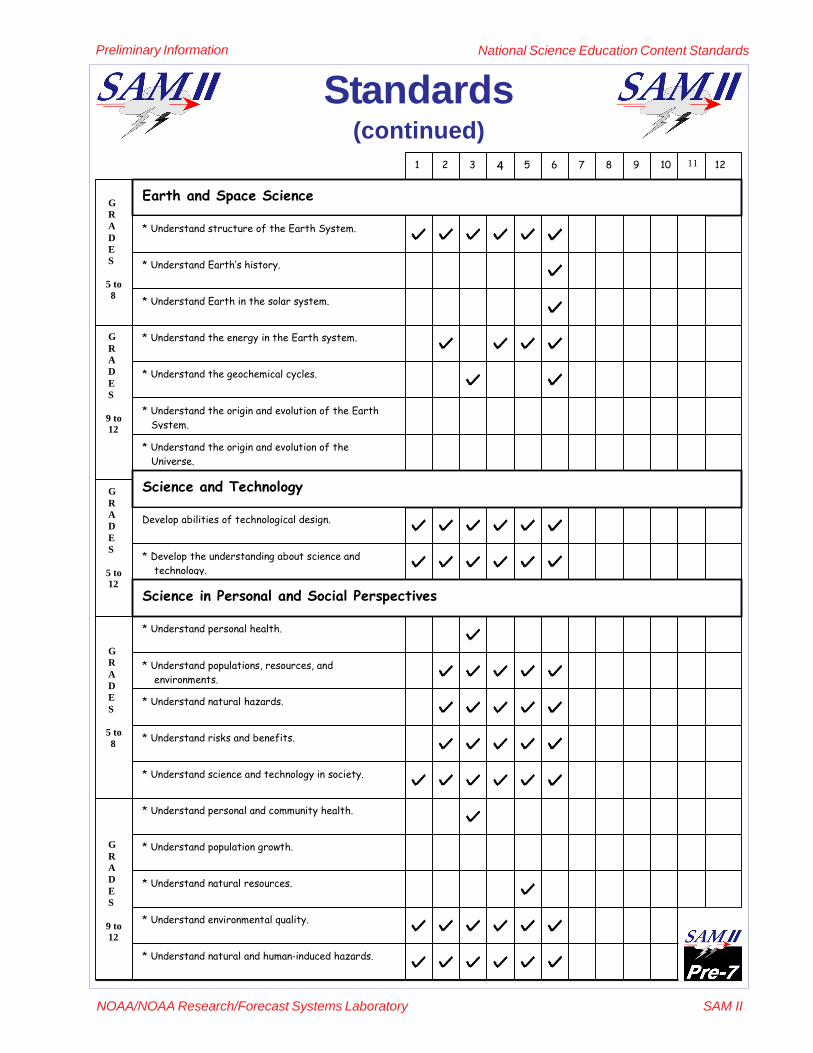
These standards are based on the recommendation made in 1996 by the National ResearchCouncil in their publication, National Science Education Standards. The standards includedhere are those specifically targeted for middle and high school students.

Preliminary Information
NOAA/NOAA Research/Forecast Systems Laboratory SAM II
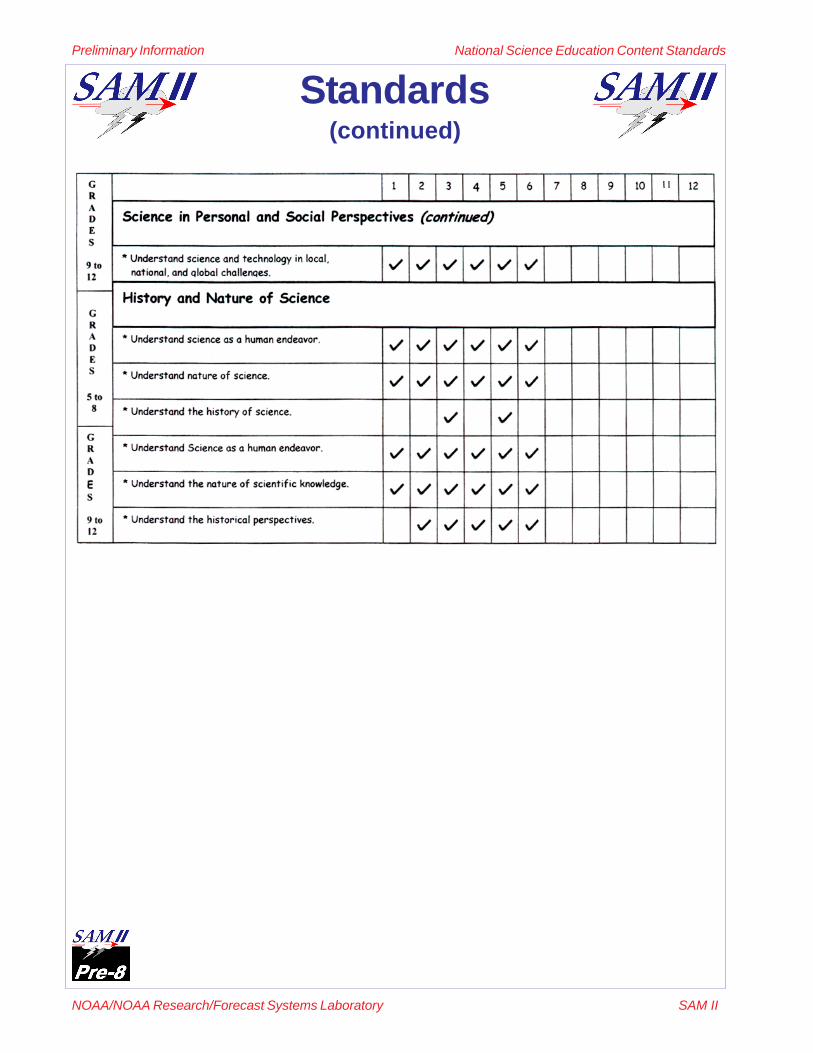
Standards(continued)
National Science Education Content Standards
Preliminary Information
NOAA/NOAA Research/Forecast Systems Laboratory SAM II
Standards(continued)
National Science Education Content Standards
G R A D E S 5 to 8
G R A D E S 9 to 12
G R A D E S 5 to 12
1 4 3 2 8 7 6 5 9 10 11 12
Earth and Space Science
* Understand structure of the Earth System.
* Understand Earth’s history.
* Understand Earth in the solar system.
* Understand the energy in the Earth system.
* Understand the geochemical cycles.
* Understand the origin and evolution of the Earth System.
* Understand the origin and evolution of the Universe.
* Develop the understanding about science and technology.
* Understand personal health.
* Understand populations, resources, and environments.
* Understand natural hazards.
Science and Technology
* Understand risks and benefits.
* Understand science and technology in society.
* Understand personal and community health.
* Understand natural resources.
* Understand environmental quality.
* Understand natural and human-induced hazards.
Develop abilities of technological design.
Science in Personal and Social Perspectives
G R A D E S 5 to 8
* Understand population growth.
G R A D E S 9 to 12
Preliminary Information
NOAA/NOAA Research/Forecast Systems Laboratory SAM II
National Science Education Content Standards
Standards(continued)

Preliminary Information
NOAA/NOAA Research/Forecast Systems Laboratory SAM II
Web Site Addresses
Web Site Addresses
The web sites listed on the following four pages provide a wealth of additionalinformation on the subjects presented in SAM II activities 1 - 6. The levels ofadditional information provided in these sites range from beginning to veryadvanced, allowing students of all levels to research additional meaningfulmaterial on the SAM II subjects.
As of Fall 2001, all the following web sites are active. However, they are subjectto change and may not all be available when students begin their work with theSAM II activities.
If too many of these sites are no longer active, the developers and creators ofSAM and SAM II recommend using the World Wide Web search engine“Google.”
http://www.google.com/
Enter “Google” using key words from each SAM II activity. The following tablegives a sample of key words to use in entering the “Google” search engine.
Activity 1 Clouds, Environmental Technology Laboratory, NOAAActivity 2 GPS, Hurricane Georges, Forecast Systems Laboratory, National
Hurricane Center, NOAAActivity 3 Ozone, Ozone Hole, NASA, Aeronomy Laboratory, NOAAActivity 4 Tornados, Skew-T, National Severe Storms Laboratory, NOAAActivity 5 El Niño, La Niña, Pacific Marine Environmental Laboratory, NOAAActivity 6 Greenhouse Effect, Global Warming, Climate Monitoring and
Diagnostics Laboratory, NOAA
SAM: The original SAM, published in 1993, can be found in the fol-lowing URL
· http://www.fsl.noaa.gov/~osborn/sam/SAM_Intro.html
SAM-II: The six new activities listed as follows on this page(under construction as of Fall 2003)
· http://www.fsl.noaa.gov/~osborn/samii/SAM_II_Intro.html
Activity 1: Anatomy Of Clouds
· http://www.etl.noaa.gov· http://www.etl.noaa.gov/25anniv/radar/· http://www6.etl.noaa.gov/pdj/img/wisp_06mar91.0602.jpg

Preliminary Information
NOAA/NOAA Research/Forecast Systems Laboratory SAM II
Web Site Addresses(continued)
Activity 2: Forecasting Severe Weather: Forecasters Use GPS to Observea Hurricane (Hurricane Georges)
· http://oak.fsl.noaa.gov/gps.html· http://gpsmet.fsl.noaa.gov/realtimeview/jsp/rti.jsp· http://lwf.ncdc.noaa.gov/oa/reports/georges/georges.html· http://www.publicaffairs.noaa.gov/stories/sir19b.html· http://www.srh.noaa.gov/sju/georges.html· http://gps.faa.gov/index.htm· http://www.garmin.com/aboutGPS/· http://www.gpsworld.com/resources/glossary.htm· http://www.cosmic.ucar.edu/gpsmet/· http://www.navtechgps.com/glossary.asp
Activity 3: Disappearing Ozone
· http://www.ozonelayer.noaa.gov/· http://www.al.noaa.gov· http://www.cmdl.noaa.gov/ozwv/ozsondes/spo/index.html· http://www.cpc.ncep.noaa.gov/products/stratosphere/sbuv2to/
ozone_hole.html· http://daac.gsfc.nasa.gov/CAMPAIGN_DOCS/ATM_CHEM/
chlorine.html· http://science.nasa.gov/headlines/y2000/ast02oct_1.htm· http://www.epa.gov/ozone/· http://www.atm.ch.cam.ac.uk/tour/index.html· http://www.nerc-bas.ac.uk/public/icd/jds/ozone/· http://www.solcomhouse.com/OzoneHole.htm
Activity 4: Forecasting Tornados: Forecasters Use Temperature,Dewpoint, and Air Pressure (Skew-T)
· http://www.fsl.noaa.gov/· http://meteora.ucsd.edu/wx_pages/upper_air.html· http://cimss.ssec.wisc.edu/goes/misc/990503.html· http://twister.sbs.ohio-state.edu/helpdocs/skew_T_help.html· http://weather.uwyo.edu/upperair/sounding.html· http://weather.unisys.com/upper_air/skew/index.html· http://www.met.tamu.edu/personnel/students/weather/soundings/· http://twister.sbs.ohio-state.edu/skewt.html· http://www.rap.ucar.edu/weather/upper/
Web Site Addresses

Preliminary Information
NOAA/NOAA Research/Forecast Systems Laboratory SAM II
Web Site Addresses
Web Site Addresses(continued)
Activity 5: El Niño and La Niña
· http://www.elnino.noaa.gov/· http://www.elnino.noaa.gov/lanina.html· http://www.pmel.noaa.gov/· http://www.pmel.noaa.gov/tao/elnino/la-nina-story.html· http://www.pmel.noaa.gov/tao/elnino/nino-home.html· http://www.pmel.noaa.gov/tao/realtime.html· http://www.cnn.com/SPECIALS/el.nino/strange.brew/· http://go.hrw.com/atlas/norm_htm/spacific.htm· http://www.usatoday.com/weather/nino/wnino0.htm
Activity 6: Greenhouse Effect - Too Much, Too Little, or Just Right?
· http://www.cmdl.noaa.gov/climate.html· http://www.cdc.noaa.gov/glance/images/timeline.gif· http://www.ngdc.noaa.gov/paleo/globalwarming/greeneffect.html· http://www.epa.gov/globalwarming/climate/· http://www.gcrio.org/ocp96/p30box.html· http://www.dar.csiro.au/info/material/info98_2.htm· http://www.greenhouse.gov.au/pubs/factsheets/fs_effect.html· http://icp.giss.nasa.gov/research/methane/greenhouse.html· http://www.pbs.org/wgbh/nova/ice/greenhouse.html· http://www.greenpeace.org/~climate/science/reports/climatefaq.html· http://earthguide.ucsd.edu/earthguide/diagrams/greenhouse/
greenhouse.html· http://katipo.niwa.cri.nz/ClimateFuture/Greenhouse.htm· http://www.meto.umd.edu/~owen/CHPI/IMAGES/greeneff.html· http://www.science.org.au/nova/016/016key.htm· http://www.geocities.com/Athens/Forum/4821/· http://www.enfo.ie/Library/fs/fs16.htm· http://www.grida.no/climate/vital/03.htm· http://www.crystalinks.com/greenhouseffect.html· http://www.geog.ouc.bc.ca/physgeog/contents/7h.html· http://www.whrc.org/globalwarming/warmingearth.htm· http://www.ucar.edu/learn/1_3_1.htm
Note: Other educational activities by SAM and SAM II developer Beverly Meier -Space Science Institute: Solarscapes
· http://www.spacescience.org/Education/ResourcesForEducators/CurriculumMaterials/Solarscapes/1.html
Preliminary Information
NOAA/NOAA Research/Forecast Systems Laboratory SAM II
Answer KeyAnswer Key
Activity #1 - Anatomy of Clouds
Part A
1. Varies2. Varies3. Varies4. Varies5. Varies
Example: Low clouds tend to be darker gray than high clouds.
6. Thin, diffuse clouds are likely to be high, cirrus clouds that contain ice crystals;whereas, heavier, thick clouds are likely to be lower clouds that contain water.
7. Varies - Since scientific inquiry is a goal of Science National Content Standards,encourage students to design an investigation.
Part B
Reflectivity Radar Image
1. 10 km2. 2 km3. 2 and part of another4. a. 6 - 8 km
b. 1 - 2 kmc. Approximately 2 kmd. Approximately 6 km
5. 3.5 - 4.5 km6. * The parts of the cloud colored red move the slowest. The faster moving parts
of the cloud appear to be “tumbling” or falling over the slower moving parts.* Different layers of the atmosphere become mixed. Mixing affects the growth of
water droplets or ice crystals, therefore cloud formation and weather.
Velocity Radar Image
1. Purple: 21 to 24 m/sRed: 17 to 20 m/s
Note: negative sign indicates direction

Preliminary Information
NOAA/NOAA Research/Forecast Systems Laboratory SAM II
Answer Key(continued)
Answer Key
2. 90 Degrees3. 5 – 10 m/s4. 5 – 14 m/s5. Buffeted by the wind; “bumpy” ride6. 32.4 m.p.h.
Activity #2 - Forecasting Severe Weather: Forecasters Use GPSto Observe a Hurricane
1. September 28, 1998, 06:15 AM2. September 28, 1998, 06:15 AM3. The amount of precipitable water increases as surface air pressure decreases.4. Improves short term forecasts, especially for severe weather. (Knowing that
more water vapor is present, means that a storm is more likely.)5. Low cost, improves reliability for predicting precipitation amount, high accuracy,
operates under a variety of conditions such as cloudy and windy weather, canprovide long-term climate monitoring, will help to save lives and property duringsevere weather.
6. The spike represents a visible “arm” of Hurricane Georges that reaches landbefore the full force of the hurricane.
7. Hurricane Georges gains power as it slowly builds up over water. It loses powerquickly once it reaches land because there is no water to fuel it.
8. Hurricanes Georges increases in power, therefore in wind speed, as it gets itsenergy from the ocean (convection) over which it travels, then loses its source ofenergy as it travels over land, and therefore decreases wind speed.
Activity #3 - Disappearing Ozone
Part A
1. Oxygen molecule that contains three atoms of oxygen held together in the shapeof the letter “V”
2. Chlorofluorocarbons, chemicals that are used as coolants for refrigerators andair conditioners, and for products such as beverage cups and insulation forhouses, help to break apart ozone molecules.
3. (- 70.2°C)4. 13.86 mPa5. 16 km6. Stratosphere

Preliminary Information
NOAA/NOAA Research/Forecast Systems Laboratory SAM II
7. Humans use chemicals that rise through the troposphere into the stratosphere.8. Based on the graph, about 15%- 20%. However, the actual amount is closer to
10%. Since our atmosphere extends to about 50 km, not 38 km for the dataused on this graph, there is a higher total amount of ozone in the atmospherethan is plotted.
9. Harmful: In the troposphere, it is a component of smog, damages plants andanimals, contributes to greenhouse gases.
Helpful: In the stratosphere, it filters ultraviolet radiation that can cause cancerand cataracts, as well as cause harm to food crops and other plantsand animals.
10. Some Examples:Using styrofoam products and automobile air conditioners,disposing of refrigerators without removing the coolant.
Part B
1. Nitrogen, hydrogen and chlorine compounds that humans have added to ouratmosphere. For example, chlorofluorocarbons break apart chlorine atoms.
2. Without the protection of ozone, plants and animals are harmed or die.3. · Concentration of ozone decreased as the concentration of chlorine monox-
ide increased.· Chlorofluorocarbons probably cause the decrease in ozone.
4. An international agreement among governments to cut and phase out productionof CFCs.
5. Some examples:· Will CFC substitutes contribute to the ozone loss?· How much do natural particles affect ozone destruction?· How will the ozone “hole” affect world weather and climate?
Activity #4 - Forecasting Tornados: Forecasters Use Tempera-ture, Dewpoint, and Air Pressure
1. Temperature: 23°CDewpoint: 17°CWet air
2. Air pressure decreases as altitude increases .3. Normally, temperature decreases as altitude increases in the troposphere.4. Temperature decreases as altitude increases except between 820 mb and 795
mb where the temperature increases (temperature inversion).5. About 625 mb6. From ground level to about 825 mb.
Answer Key
Answer Key(continued)

Preliminary Information
NOAA/NOAA Research/Forecast Systems Laboratory SAM II
7. Decreases - Dewpoint temperature decreases and the distance between thetemperature curve and the dewpoint curve increases.
8. About 220 mb to 200 mb9. About 0.05°C per mb
10. There is no measurable moisture.11. Between 609 mb and 533 mb12. Temperature increases - Temperature inversion13. Temperature inversion causes a ceiling. The temperature layer above the
clouds is warmer and prevents air from rising, cooling, and condensing.
Activity #5 - El Niño and La Niña
1. Between 150W and 100W (more exactly 140W)2. 160E3. Blowing wind piles up the warm surface water in the direction that it is blowing
toward.4. East5. Figure 5.3, the warmest water layer is almost level instead of being deeper in
the western Pacific. There is more than usual warm water in the eastern Pacificnear South America.
6. Figure 5.4, the warmest water is piled up in the western Pacific toward south-east Asia and Australia with cooler water in the eastern Pacific near SouthAmerica.
7. 140E, 150E, 160E, 170E, 180; southeast Asia and Australia; warm water isdeeper, therefore evaporation increases, then clouds form and storms increase.
8. 120W, 110W, 100W, 90W; South America; since the warm surface water hasbeen blown westward, cold water nutrients rise and attract fish looking for food.
9. 140E, 150E, 160E, 170E, 180; west Pacific (southeast Asia, Australia); warmwater that causes convection, and therefore, cloud formation and storms, hasmoved eastward away from Asia and Australia.
10. 2001 - 200211. Both are part of the ENSO cycle: influenced by the ocean-atmosphere system,
recurring, cause convection, cause drought, cause storms and flooding, haveglobal effects.
12. The thermocline levels out during an El Niño event and becomes steep during aLa Niña event.
13. Some examples:· How accurate are El Niño and La Niña forecasts?· What deep ocean changes might affect El Niño and La Niña
events?· Beside sea surface temperature changes, what other factors
might predict El Niño and La Niña Events?
Answer Key
Answer Key(continued)

Preliminary Information
NOAA/NOAA Research/Forecast Systems Laboratory SAM II
Activity #6 - Greenhouse Effect
Part A
1. Northern Hemisphere winter2. Southern Hemisphere winter3. Less vegetation in the Southern Hemisphere, further from sources and sinks.4. To avoid local contamination and to find an air average over large areas.
Part B
1. Increase2. CH4 - CH4 increases 7.9 ppb per year, whereas CO2 increases 1.5 ppm per
year. Therefore, the rate of change for CH4 is greater in one year.3. No. Trace gas concentration is only one component of global warming. Need
more information over a longer period of time, for example, “Is the global aver-age temperature actually rising compared to natural variability?”
The rate of change for CO2 is 1.5 ppm/year.The rate of change for CH4 is 7.9 ppb/year.
Answer Key(continued)
Answer Key


![NOAA Coral Reef Information System - Glossary of …NOAA Coral Reef Information System - Glossary of Terminology 3/10/2016 11:56:15 AM] Acoelomate flatworms such ...](https://static.fdocuments.in/doc/165x107/5e5c550323ce2d54a374c37a/noaa-coral-reef-information-system-glossary-of-noaa-coral-reef-information-system.jpg)