Preliminary Dietary Exposure Assessment Seafood Tilligerry ...
17
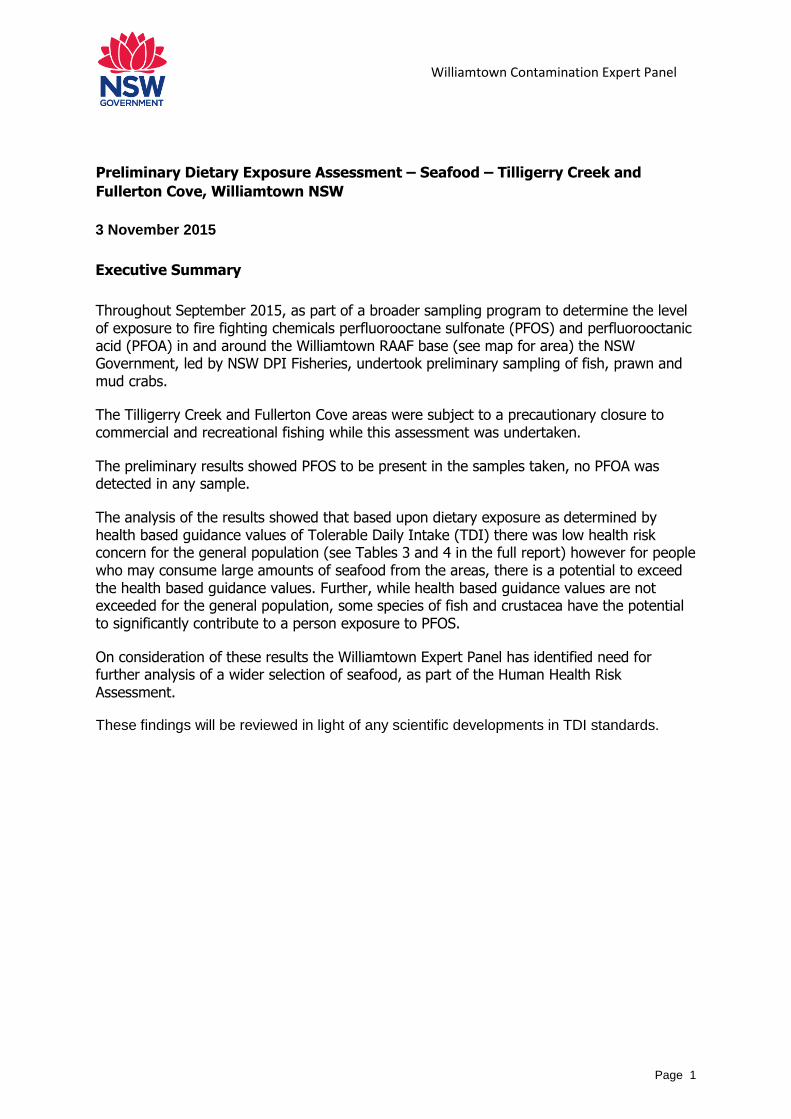
Williamtown Contamination Expert Panel Page 1 Preliminary Dietary Exposure Assessment – Seafood – Tilligerry Creek and Fullerton Cove, Williamtown NSW 3 November 2015 Executive Summary Throughout September 2015, as part of a broader sampling program to determine the level of exposure to fire fighting chemicals perfluorooctane sulfonate (PFOS) and perfluorooctanic acid (PFOA) in and around the Williamtown RAAF base (see map for area) the NSW Government, led by NSW DPI Fisheries, undertook preliminary sampling of fish, prawn and mud crabs. The Tilligerry Creek and Fullerton Cove areas were subject to a precautionary closure to commercial and recreational fishing while this assessment was undertaken. The preliminary results showed PFOS to be present in the samples taken, no PFOA was detected in any sample. The analysis of the results showed that based upon dietary exposure as determined by health based guidance values of Tolerable Daily Intake (TDI) there was low health risk concern for the general population (see Tables 3 and 4 in the full report) however for people who may consume large amounts of seafood from the areas, there is a potential to exceed the health based guidance values. Further, while health based guidance values are not exceeded for the general population, some species of fish and crustacea have the potential to significantly contribute to a person exposure to PFOS. On consideration of these results the Williamtown Expert Panel has identified need for further analysis of a wider selection of seafood, as part of the Human Health Risk Assessment. These findings will be reviewed in light of any scientific developments in TDI standards.
Transcript of Preliminary Dietary Exposure Assessment Seafood Tilligerry ...
Williamtown Contamination Expert Panel
Page 1
Preliminary Dietary Exposure Assessment – Seafood – Tilligerry Creek and
Fullerton Cove, Williamtown NSW
3 November 2015
Executive Summary
Throughout September 2015, as part of a broader sampling program to determine the level of exposure to fire fighting chemicals perfluorooctane sulfonate (PFOS) and perfluorooctanic acid (PFOA) in and around the Williamtown RAAF base (see map for area) the NSW Government, led by NSW DPI Fisheries, undertook preliminary sampling of fish, prawn and mud crabs.
The Tilligerry Creek and Fullerton Cove areas were subject to a precautionary closure to commercial and recreational fishing while this assessment was undertaken.
The preliminary results showed PFOS to be present in the samples taken, no PFOA was detected in any sample.
The analysis of the results showed that based upon dietary exposure as determined by health based guidance values of Tolerable Daily Intake (TDI) there was low health risk concern for the general population (see Tables 3 and 4 in the full report) however for people who may consume large amounts of seafood from the areas, there is a potential to exceed the health based guidance values. Further, while health based guidance values are not exceeded for the general population, some species of fish and crustacea have the potential to significantly contribute to a person exposure to PFOS.
On consideration of these results the Williamtown Expert Panel has identified need for further analysis of a wider selection of seafood, as part of the Human Health Risk Assessment.
These findings will be reviewed in light of any scientific developments in TDI standards.
Williamtown Contamination Expert Panel
Page 2
Preliminary PFOS Risk Assessment for Seafood – Tilligerry Creek and Fullerton Cove
Background
Perfluorooctane sulfonate (PFOS) and perfluorooctanic acid (PFOA) are perfluorinated compounds that are components in fire-fighting foams that were used at the Williamtown RAAF base prior to 2011. Since 2013 the Australian Defence Force (ADF) has been investigating the presence of these compounds in and near the base. Recently these compounds were detected in three samples of biota (fish and small shellfish) from a local drain and creek.
NSW Health advised that based on the levels detected, seafood caught or collected from the local area (upper Tilligerry Creek and Fullerton Cove) should not be consumed until more is known about the presence of these substances in seafood. As such, DPI Fisheries enacted a fishing (commercial and recreational) closure while the issue is investigated. .
During the closure period, the NSW Government is undertaking more extensive analysis of seafood to better inform what impact the chemicals may have had on seafood caught or harvested from areas of interest.
Sampling and Processing
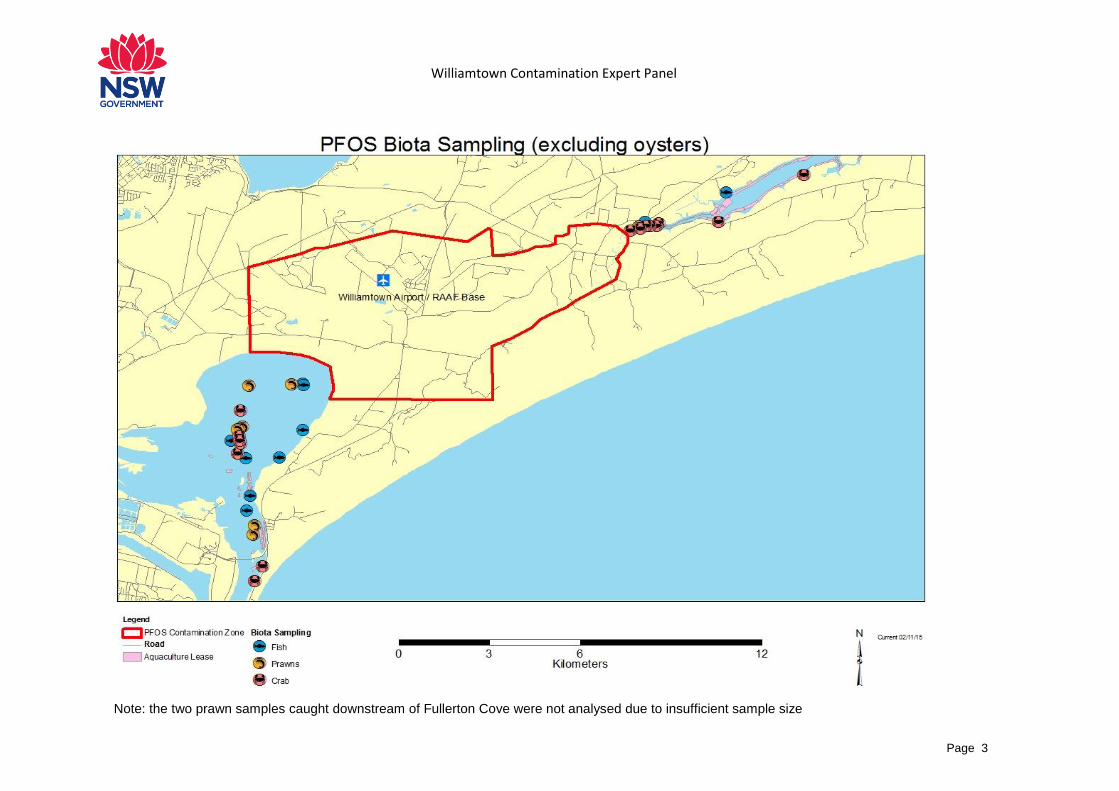
During September 2015 fish, prawn and mud crab samples were collected from both Tilligerry Creek and Fullerton Cove by DPI Fisheries, both independently and with the assistance of commercial fishers. The locations where these samples were collected are presented in the following map.
Samples were processed and dissected on the day following capture at Port Stephens Fisheries Institute. Biometric information was recorded, and tissue samples were dissected from the organisms collected. Skin was removed from the muscle tissue samples of fish, and all processed samples were placed in small, individually tagged, snap-lock bags. These processed samples were then shipped to National Measurement Institute (NMI) generally within 4 days of sampling/processing.
Analysis
Samples were sent to the National Measurement Institute (NMI) laboratory at North Ryde for analysis of perfluorinated compounds by Solid Phase Extraction and Liquid Chromatography/tandem Mass Spectrometry (LC/MS/MS) using reference method USEPA 537. While the laboratory does not currently have NATA accreditation for this method for food and seafood, the method is an international standard method which is used extensively in the US and Europe and has been used here in Australia over the past three years for environmental projects and a large food project. NMI will be submitting an application for NATA accreditation in 2015.
Williamtown Contamination Expert Panel
Page 3
Note: the two prawn samples caught downstream of Fullerton Cove were not analysed due to insufficient sample size
Williamtown Contamination Expert Panel
Page 4
Results
The summary of the results is presented in Table 1. The main perfluorinated compound detected in the samples was PFOS. No PFOA was detected in any sample.
Table 1: Fish and crustacea results from Fullerton Cove and Tilligerry Creek
Site Common name Count Minimum (mg/kg)
Mean (mg/kg)
Median (mg/kg)
Maximum (mg/kg)
Fullerton Cove
Fish 14 0.0003 0.003 0.0015 0.019
Prawns 8 0.0096 0.017 0.017 0.025
Crabs 9 0.0005 0.002 0.0024 0.003
Tilligerry Creek
Fish 23 0.0003 0.003 0.001 0.018
Prawns 2 0.036 0.042 0.042 0.048
Crabs 8 0.0011 0.004 0.0036 0.011
Interpretation and Assessment of Results
In a risk assessment of chemical contaminants, estimated exposure is compared to a relevant health based guidance value. Exposure may arise from several sources, in this report only dietary exposure is assessed. In a dietary exposure assessment, estimated exposure, derived from combining food consumption data from national population surveys and food chemical concentration data, is compared to the appropriate health based guidance value.
Health based guidance values
The European Food Safety Agency (EFSA) established a Tolerable Daily Intake (TDI) of 150 ng/kg bw1/day (0.00015 mg/kg bw/day) for PFOS based on a no observed adverse effect level (NOAEL) identified in sub-chronic, chronic and reproduction/developmental toxicity studies in laboratory animals (EFSA 2008). The TDI for PFOA established by EFSA at the same time was 1.5 µg/kg bw/day (0.0015 mg/kg bw/day).
FSANZ considers these values to be appropriate health-based guidance values to use for chronic dietary exposure assessments (see Attachment 1 for details). As adverse effects from PFOA and PFOS are thought to occur following long term exposure no acute health based guidance values need to be established. Consequently, there is no need for an acute dietary exposure assessment.
Food consumption data
To evaluate the consumption of fish and crustacea in all people aged 2 years and over as well as children specifically in the 2-6 year old age group, food consumption data from the 2011-12 National Nutrition and Physical Activity Survey (NNPAS) component of the 2011-13 Australian Health Survey (Table 2). The figures in Table 3 are based on day 1 of the NNPAS, this is a conservative assumption as calculation of ‘usual’ or habitual intakes of fish and seafood would result in lower daily consumption amount estimates.
It is standard international practice in food chemical risk assessments to assess young children separately due to relatively higher food consumption amounts per kilogram
1 bw = human body weight
Williamtown Contamination Expert Panel
Page 5
bodyweight compared to older children and adults. In many cases this places them at higher risk of exceeding health based guidance values, however, in the case of crustacean and molluscs, which are not commonly consumed by young children, they would tend to be of lower risk of exposure from consumption of these foods.
In this report, dietary exposure estimates were not undertaken for young children for crustacean (only 8 consumers/779 respondents) as the numbers would not be statistically valid due to small numbers of consumers.
Williamtown Contamination Expert Panel
Page 6
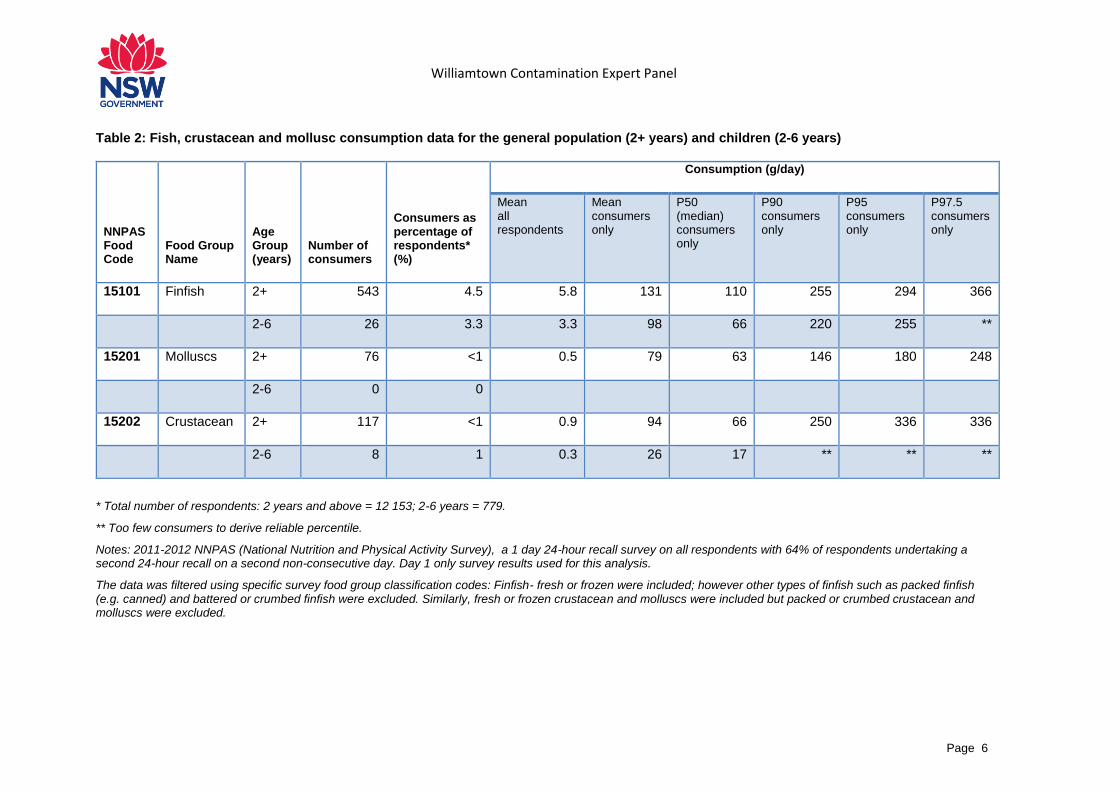
Table 2: Fish, crustacean and mollusc consumption data for the general population (2+ years) and children (2-6 years)
* Total number of respondents: 2 years and above = 12 153; 2-6 years = 779.
** Too few consumers to derive reliable percentile.
Notes: 2011-2012 NNPAS (National Nutrition and Physical Activity Survey), a 1 day 24-hour recall survey on all respondents with 64% of respondents undertaking a second 24-hour recall on a second non-consecutive day. Day 1 only survey results used for this analysis.
The data was filtered using specific survey food group classification codes: Finfish- fresh or frozen were included; however other types of finfish such as packed finfish (e.g. canned) and battered or crumbed finfish were excluded. Similarly, fresh or frozen crustacean and molluscs were included but packed or crumbed crustacean and molluscs were excluded.
NNPAS Food Code
Food Group Name
Age Group (years)
Number of consumers
Consumers as percentage of respondents* (%)
Consumption (g/day)
Mean all respondents
Mean consumers only
P50 (median) consumers only
P90 consumers only
P95 consumers only
P97.5 consumers only
15101 Finfish 2+ 543 4.5 5.8 131 110 255 294 366
2-6 26 3.3 3.3 98 66 220 255 **
15201 Molluscs 2+ 76 <1 0.5 79 63 146 180 248
2-6 0 0
15202 Crustacean 2+ 117 <1 0.9 94 66 250 336 336
2-6 8 1 0.3 26 17 ** ** **
Williamtown Contamination Expert Panel
Page 7
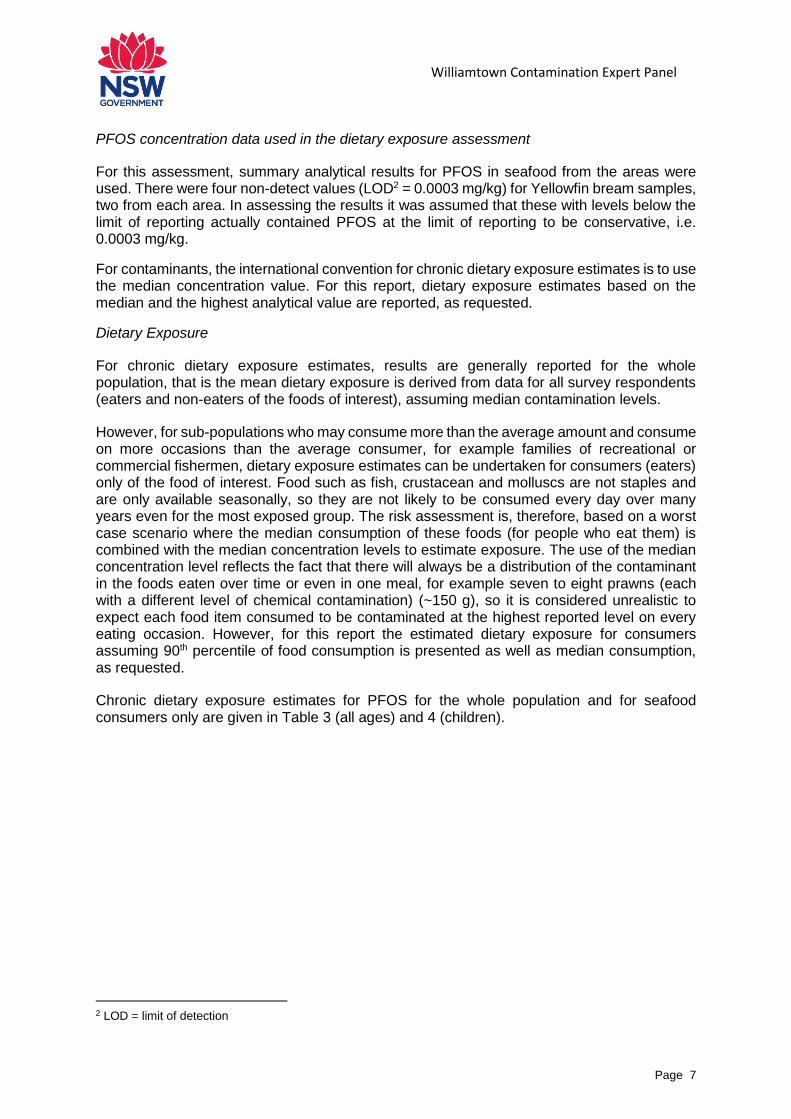
PFOS concentration data used in the dietary exposure assessment
For this assessment, summary analytical results for PFOS in seafood from the areas were used. There were four non-detect values (LOD2 = 0.0003 mg/kg) for Yellowfin bream samples, two from each area. In assessing the results it was assumed that these with levels below the limit of reporting actually contained PFOS at the limit of reporting to be conservative, i.e. 0.0003 mg/kg.
For contaminants, the international convention for chronic dietary exposure estimates is to use the median concentration value. For this report, dietary exposure estimates based on the median and the highest analytical value are reported, as requested.
Dietary Exposure
For chronic dietary exposure estimates, results are generally reported for the whole population, that is the mean dietary exposure is derived from data for all survey respondents (eaters and non-eaters of the foods of interest), assuming median contamination levels.
However, for sub-populations who may consume more than the average amount and consume on more occasions than the average consumer, for example families of recreational or commercial fishermen, dietary exposure estimates can be undertaken for consumers (eaters) only of the food of interest. Food such as fish, crustacean and molluscs are not staples and are only available seasonally, so they are not likely to be consumed every day over many years even for the most exposed group. The risk assessment is, therefore, based on a worst case scenario where the median consumption of these foods (for people who eat them) is combined with the median concentration levels to estimate exposure. The use of the median concentration level reflects the fact that there will always be a distribution of the contaminant in the foods eaten over time or even in one meal, for example seven to eight prawns (each with a different level of chemical contamination) (~150 g), so it is considered unrealistic to expect each food item consumed to be contaminated at the highest reported level on every eating occasion. However, for this report the estimated dietary exposure for consumers assuming 90th percentile of food consumption is presented as well as median consumption, as requested.
Chronic dietary exposure estimates for PFOS for the whole population and for seafood consumers only are given in Table 3 (all ages) and 4 (children).
2 LOD = limit of detection
Williamtown Contamination Expert Panel
Page 8
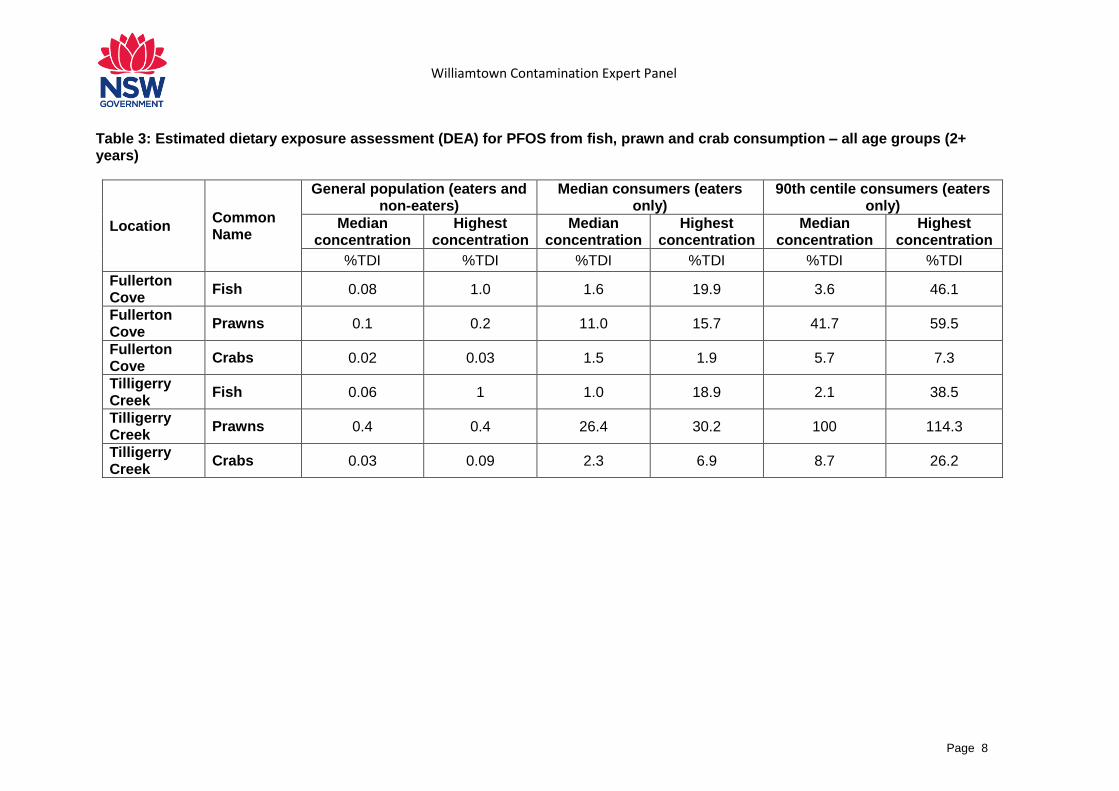
Table 3: Estimated dietary exposure assessment (DEA) for PFOS from fish, prawn and crab consumption – all age groups (2+ years)
Location Common Name
General population (eaters and non-eaters)
Median consumers (eaters only)
90th centile consumers (eaters only)
Median concentration
Highest concentration
Median concentration
Highest concentration
Median concentration
Highest concentration
%TDI %TDI %TDI %TDI %TDI %TDI
Fullerton Cove
Fish 0.08 1.0 1.6 19.9 3.6 46.1
Fullerton Cove
Prawns 0.1 0.2 11.0 15.7 41.7 59.5
Fullerton Cove
Crabs 0.02 0.03 1.5 1.9 5.7 7.3
Tilligerry Creek
Fish 0.06 1 1.0 18.9 2.1 38.5
Tilligerry Creek
Prawns 0.4 0.4 26.4 30.2 100 114.3
Tilligerry Creek
Crabs 0.03 0.09 2.3 6.9 8.7 26.2
Williamtown Contamination Expert Panel
Page 9
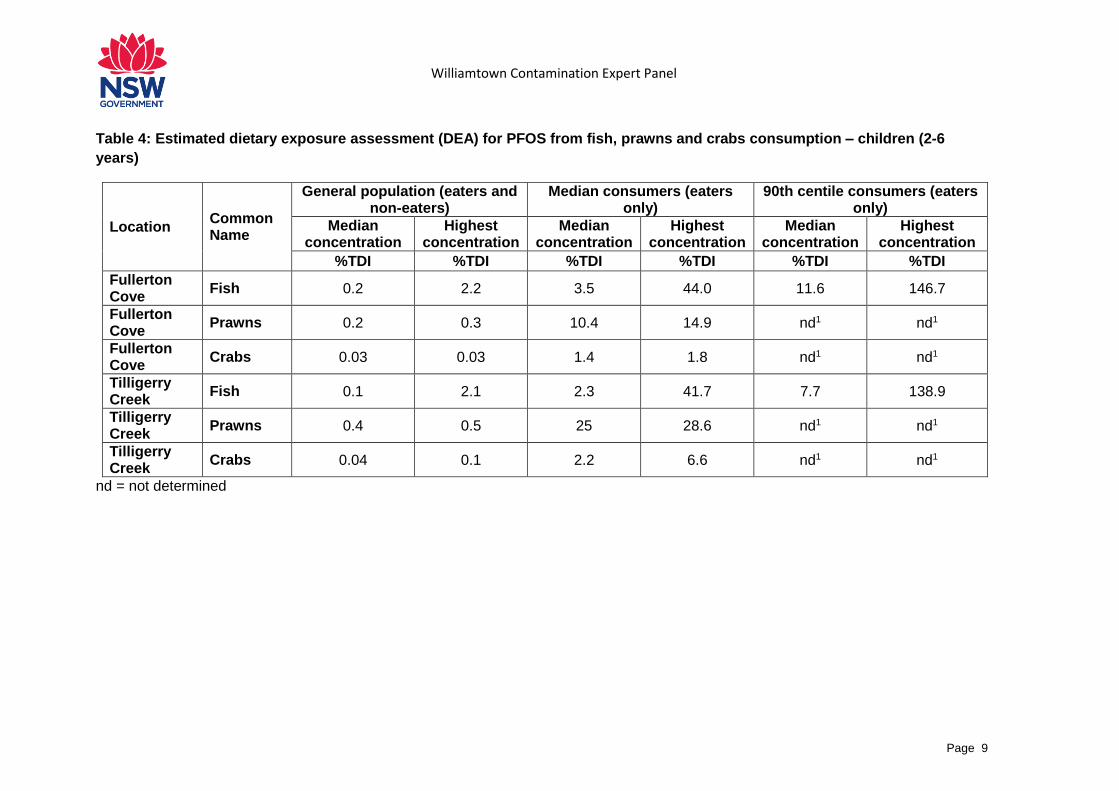
Table 4: Estimated dietary exposure assessment (DEA) for PFOS from fish, prawns and crabs consumption – children (2-6
years)
Location Common Name
General population (eaters and non-eaters)
Median consumers (eaters only)
90th centile consumers (eaters only)
Median concentration
Highest concentration
Median concentration
Highest concentration
Median concentration
Highest concentration
%TDI %TDI %TDI %TDI %TDI %TDI
Fullerton Cove
Fish 0.2 2.2 3.5 44.0 11.6 146.7
Fullerton Cove
Prawns 0.2 0.3 10.4 14.9 nd1 nd1
Fullerton Cove
Crabs 0.03 0.03 1.4 1.8 nd1 nd1
Tilligerry Creek
Fish 0.1 2.1 2.3 41.7 7.7 138.9
Tilligerry Creek
Prawns 0.4 0.5 25 28.6 nd1 nd1
Tilligerry Creek
Crabs 0.04 0.1 2.2 6.6 nd1 nd1
nd = not determined
Williamtown Contamination Expert Panel
Page 10
Risk characterisation
Fish
For the general population, all age groups, estimated dietary exposure from consumption of fish ranges from 0.02-0.27% of the TDI assuming the median PFOS concentration and 0.05-1.05% of the TDI assuming the high concentration, given the results to date. For fishing communities who may consume higher amounts of these foods more often, high level consumption of fish will not lead to an exceedance of the TDI for PFOS, although people in this higher exposure group may be exposed to up to 46% of the TDI.
For children in the general population, estimated dietary exposure from the consumption of fish ranges from 0.05-0.89% of the TDI at the median concentration. For children consuming higher amounts of fish, an exceedance of the TDI did occur for one species of fish (Dusty Flathead) from both areas, although it is noted that this would require a single child to exclusively eat at 220 gram of Dusty Flathead per day, which is not likely.
Prawns and crabs
For the general population, estimated dietary exposure from consumption of either prawns or mud crab ranges from 0.02-0.4% of the TDI assuming the median PFOS concentration and 0.03-0.4% of the TDI assuming the high concentration. For fishing communities who may consume higher amounts of these foods more often, high level consumption of prawns would result in an exceedance of the TDI at both the median and highest concentration (100% and 114.3% respectively). Consumption of mub crab by high consumer will not lead to an exceedance of the TDI (range 5.7-26.2%).
These calculations do not take background dietary exposure from other foods or drinking water into account, however, fish and other seafood are reported to be the major contributors to the diet elsewhere (EFSA 2008). For all populations it is desirable to eat a balanced diet overall.
It is noted that in the general population an odd meal or day when a high amount of fish and/or seafood containing PFOS is consumed would not pose a concern because PFOS has such a long plasma half-life in humans (~5 years). This means it is the total PFOS dietary exposure over a long period of time (circa 20 years) that is of interest in terms of determining the risk to public health and safety.
Maximum amount of fish and crustacea able to be consumed at reported PFOS levels
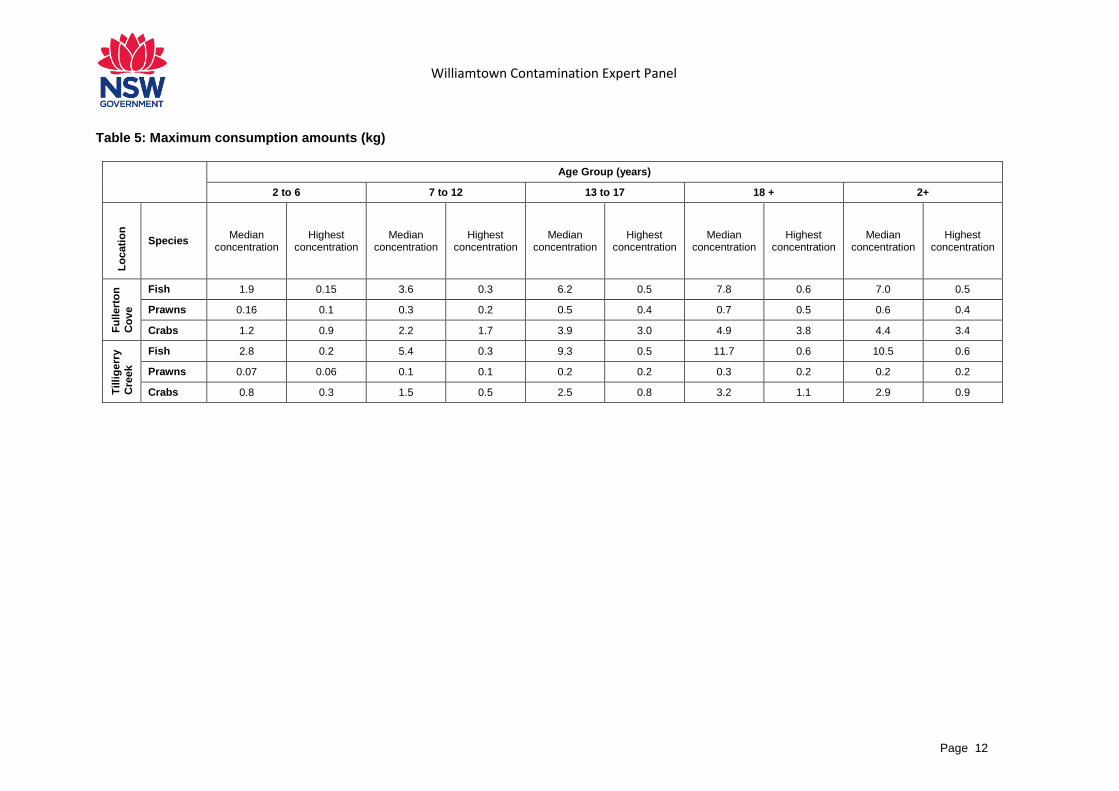
The results were further assessed by conducting a back calculation to determine the maximum amount of fish or crustacea that could be consumed when the PFOS concentration in the samples were at the median and highest level reported. This involved calculating the kilograms of seafood the different age groups (male and female) would be required to consume before the TDI for PFOS was exceeded. Table 5 shows the estimated maximum consumption amounts for fish and crustacea respectively.
For fish, consumption rates before exceeding the TDI ranged from 150 g (for children aged 2 to 6 at the highest concentration detected) to 11.7 kg (for adults 18 years old plus at the median concentration). Depending on the age group, 60 to 700 grams of prawns would need to be consumed before exceeding the TDI and for crabs, between 300 grams and 4.9 kg would need to be consumed.
Williamtown Contamination Expert Panel
Page 11
Some samples of fish and crabs were collected in close proximity to the current fishing closure. While PFOS was detected in these samples, dietary analysis demonstrates that the TDI was not exceeded by any age group even for high consumers in seafood. For example for the highest fish result, an adult would need to eat 1.9 kg of fish per day and a child (2-6 years old ) would need to eat 500g every day to exceed the TDI. These results will continue to be assessed as part of the ongoing investigation of the Williamtown incident.
Williamtown Contamination Expert Panel
Page 12
Table 5: Maximum consumption amounts (kg)
Age Group (years)
2 to 6 7 to 12 13 to 17 18 + 2+
Lo
cati
on
Species Median
concentration Highest
concentration Median
concentration Highest
concentration Median
concentration Highest
concentration Median
concentration Highest
concentration Median
concentration Highest
concentration
Fu
llert
on
Co
ve
Fish 1.9 0.15 3.6 0.3 6.2 0.5 7.8 0.6 7.0 0.5
Prawns 0.16 0.1 0.3 0.2 0.5 0.4 0.7 0.5 0.6 0.4
Crabs 1.2 0.9 2.2 1.7 3.9 3.0 4.9 3.8 4.4 3.4
Tilli
ge
rry
Cre
ek
Fish 2.8 0.2 5.4 0.3 9.3 0.5 11.7 0.6 10.5 0.6
Prawns 0.07 0.06 0.1 0.1 0.2 0.2 0.3 0.2 0.2 0.2
Crabs 0.8 0.3 1.5 0.5 2.5 0.8 3.2 1.1 2.9 0.9
Williamtown Contamination Expert Panel
Page 13
Discussion
This paper provides a preliminary analysis of the results from the limited sampling of fish and crustacea from both Tilligerry Creek and Fullerton Cove that has been undertaken in the last month. It was undertaken primarily to inform the design of a more comprehensive sampling program as part of the larger human health risk assessment. The results demonstrate that some species of fish and crustacea do contribute significantly to the exposure people may have to PFOS and warrant further investigation to ensure sufficient information is available for the comprehensive human health risk assessment.
Over interpretation of these preliminary results at this time should be avoided as:
The species collected do not represent all species that may be collected for human consumption
Only one or two samples were collected for some species
Fish samples relate to an individual fish and not a composited sample of 5 to 6 fish, which is the usual practice when analysing fish for substances such as PFOS to assess dietary exposure.
Conclusion
Based on these results it is concluded that further analysis of a wider selection of seafood is required to inform any further health risk assessment. Further, samples should be collected from a wider area.
Williamtown Contamination Expert Panel
Page 14
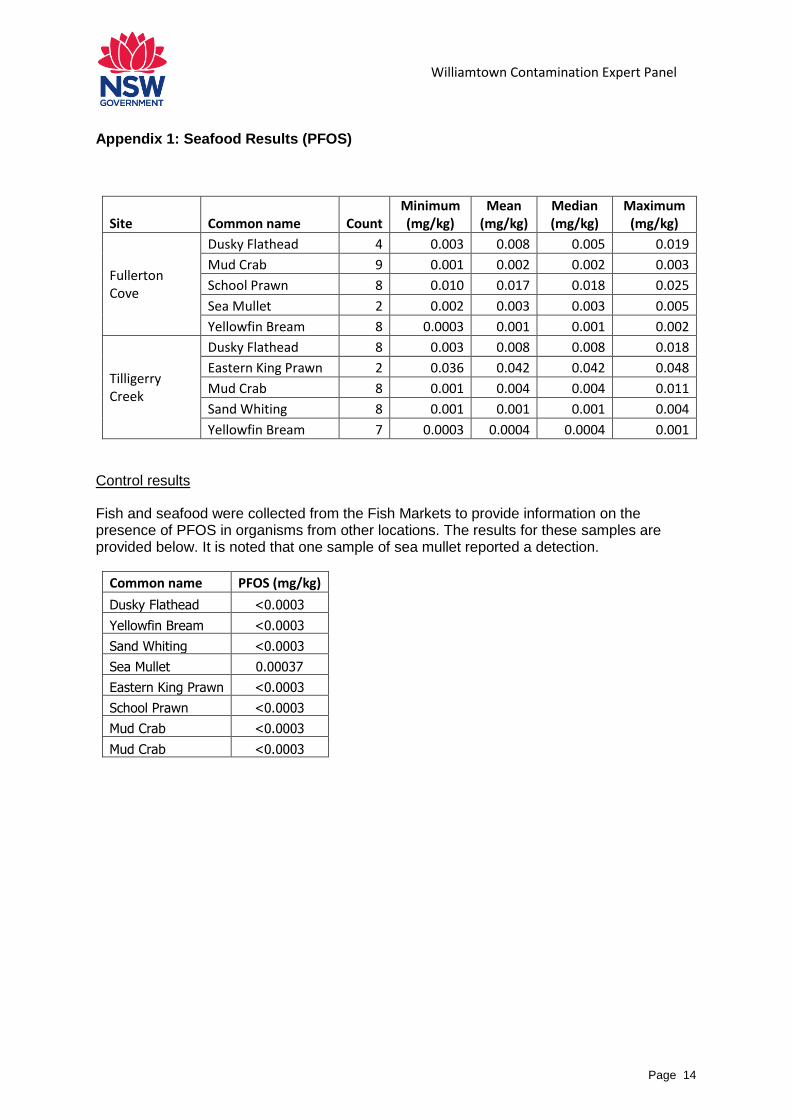
Appendix 1: Seafood Results (PFOS)
Site Common name Count Minimum (mg/kg)
Mean (mg/kg)
Median (mg/kg)
Maximum (mg/kg)
Fullerton Cove
Dusky Flathead 4 0.003 0.008 0.005 0.019
Mud Crab 9 0.001 0.002 0.002 0.003
School Prawn 8 0.010 0.017 0.018 0.025
Sea Mullet 2 0.002 0.003 0.003 0.005
Yellowfin Bream 8 0.0003 0.001 0.001 0.002
Tilligerry Creek
Dusky Flathead 8 0.003 0.008 0.008 0.018
Eastern King Prawn 2 0.036 0.042 0.042 0.048
Mud Crab 8 0.001 0.004 0.004 0.011
Sand Whiting 8 0.001 0.001 0.001 0.004
Yellowfin Bream 7 0.0003 0.0004 0.0004 0.001
Control results
Fish and seafood were collected from the Fish Markets to provide information on the presence of PFOS in organisms from other locations. The results for these samples are provided below. It is noted that one sample of sea mullet reported a detection.
Common name PFOS (mg/kg)
Dusky Flathead <0.0003
Yellowfin Bream <0.0003
Sand Whiting <0.0003
Sea Mullet 0.00037
Eastern King Prawn <0.0003
School Prawn <0.0003
Mud Crab <0.0003
Mud Crab <0.0003
Williamtown Contamination Expert Panel
Page 15
Attachment 1
Advice from FSANZ on a health based guidance value for PFOS
EFSA established a Tolerable Daily Intake (TDI) for PFOS based on the lowest no observed adverse effect level (NOAEL) identified in sub-chronic, chronic and reproduction/ developmental toxicity studies in laboratory animals (EFSA 2008). The lowest NOAEL, 0.03 mg/kg bw/day, was identified in a sub-chronic (6-month) oral gavage study in cynomolgus monkeys. Changes in serum lipids and thyroid hormones were observed at doses of 0.15 and 0.75 mg/kg bw/day and treatment-related deaths were observed at 0.75 mg/kg bw/day (Seacat et al 2002). Other NOAELs cited by EFSA were not substantially higher than the above NOAEL of 0.03 mg/kg bw/day. For example, in a chronic (2-year) dietary study in rats, NOAELs were 0.04 and 0.14 mg/kg bw/day for males and females respectively, based on liver histopathology observed at the next higher doses of 0.14 mg/kg bw/day (males) and 0.37 mg/kg bw/day (females). In males, a significant increase in the incidence of hepatocellular adenomas was noted in the high-dose group (7/60; 1.4 mg/kg bw/day) compared to the control (0/60). In the females, a significant increase in the incidences of hepatocellular adenomas (5/60) and combined hepatocellular adenomas and carcinomas (6/60) was observed in the high-dose group (1.5 mg/kg bw/day) compared to the control group (0/60) (Thomford 2002, unpublished; subsequently published as Butenhoff et al 2012). Based on the above study, EFSA concluded that PFOS is carcinogenic in rats, inducing tumours of the liver. Based on a lack of genotoxicity in a wide range of in vitro and in vivo assays, EFSA concluded that the weight of evidence indicates an indirect (non-genotoxic) mechanism for carcinogenicity. Adverse effects have also been observed at relatively low doses in reproduction/ developmental toxicity studies. For example, in a two-generation oral gavage study in rats, a NOAEL of 0.1 mg/kg bw/day was identified based on reduced birthweight at the next higher dose (0.4 mg/kg bw/day). Reduced survival was observed in offspring at doses of 1.6 and 3.2 mg/kg bw/day (the top dose). In the 1.6 mg/kg bw/day group, 26% of the offspring died within 4 days after birth. In the 3.2 mg/kg bw/day group, 45% of the pups died within one day after birth and 100% died thereafter (Christian et al 1999). EFSA established a TDI of 150 ng/kg bw/day (i.e. 0.00015 mg/kg bw/day) by applying an overall uncertainty factor (UF) of 200 to the NOAEL of 0.03 mg/kg bw/day observed in the cynomolgus monkey study. A UF of 100 was used for inter and intra-species differences and an additional UF of 2 to compensate for the relatively short duration of the study and for uncertainties in the internal dose kinetics. A search was conducted for toxicity studies on PFOS published after the EFSA search cut-off (February 2008). No reliable studies were located reporting adverse effects at doses lower than the lowest observed adverse effect levels (LOAELs) reported above. Effects on immune parameters were reported in a mouse study, with a LOAEL of 0.0017 mg/kg bw/day and a NOAEL of 0.00017 mg/kg bw/day (Peden-Adams et al 2008), however these findings are not supported by the results of other immunotoxicity studies on PFOS. FSANZ concludes that the TDI for PFOS of 150 ng/kg bw/day (0.00015 mg/kg bw/day) established by EFSA in 2008 was appropriately derived and that subsequent toxicity data do not indicate a need to amend the TDI. However, FSANZ notes that a TDI is probably not the
Williamtown Contamination Expert Panel
Page 16
appropriate Health Based Guidance Value for a compound which has a long half in several mammalian species (~5 years in humans; Olsen et al 2007). A Tolerable Weekly Intake would be more appropriate. References Butenhoff JL, Chang SC, Olsen GW, Thomford PJ (2012) Chronic dietary toxicity and carcinogenicity study with potassium perfluorooctanesulfonate in Sprague Dawley rats. Toxicology, 293(1-3):1-15.
Christian MS, Hoberman AM, York RG (1999) Combined oral (gavage) fertility, developmental and perinatal/postnatal reproduction toxicity study of PFOS in rats. Argus Research Laboratories, Inc., Horsham, PA U.S EPA. Docket 8EHQ-0200-00374.
EFSA (2008) Perfluorooctane sulfonate (PFOS), perfluorooctanoic acid (PFOA) and their salts. Scientific Opinion of the Panel on Contaminants in the Food Chain. The EFSA Journal (2008) 653, 1-131.
Olsen GW, Burris JM, Ehresman DJ, Froehlich JW, Seacat AM, Butenhoff JL, Zobel LR (2007) Half-life of serum elimination of perfluorooctanesulfonate, perfluorohexanesulfonate, and perfluorooctanoate in retired fluorochemical production workers. Environ Health Perspect. 115(9):1298-305.
Peden-Adams MM, Keller JM, Eudaly JG, Berger J, Gilkeson GS, Keil DE (2008) Suppression of humoral immunity in mice following exposure to perfluorooctane sulfonate. Toxicol Sci. 104(1):144-54.
Seacat AM, Thomford PJ, Hansen KJ, Olsen GW, Case MT, Butenhoff JL (2002) Subchronic toxicity studies on perfluorooctanesulfonate potassium salt in cynomolgus monkeys. Toxicol Sci. 68(1):249-64.
Williamtown Contamination Expert Panel
Page 17
Attachment 2
Relationship between EPA screening criteria and FSANZ exposure calculations
The EPA screening criteria for biota of 9.1 ug/kg is based on Dutch work undertaken by RIVM (National Institute for Public Health and the Environment) [1]. The methodology used to develop this value is similar to that used by FSANZ. The TDI used is the same but fish consumption and body weights are Dutch rather than Australian. RIVM use a further factor to limit the proportion of the TDI attributable to fish to 10%. This factor appears to be related to data from a Dutch Total Dietary Survey. No comparable dietary survey of PFOS or other PFCs is available for Australia.
The authors note the limit is a screening value and not a health value. We believe the limit has value as a screening criterion with appropriate conservatism to account for other possible sources of PFCs such as contaminated drinking water and locally grown produce/meat. We recommend Defence should consider adopting the 9.1 ug/kg screening value for their studies. However, food exposure assessments should be undertaken by FSANZ.
1. Moermond C, Verbruggen E, Smit C. Environmental risk limits for PFOS A proposal for water quality standards in accordance with the Water Framework Directive. RIVM National Institute for Public Health and the Environment; 2010.