Preliminary comparison of direct electric current ...
5
2017 International Symposium on Lightning Protection (XIV SIPDA), Natal, Brazil, 2 nd – 6 th October 2017. Preliminary comparison of direct electric current measurements in lightning rods and peak current estimates from lightning location systems Kleber P. Naccarato Amanda R. de Paiva, Marcelo M. F. Saba ELAT / CCST / INPE São José dos Campos, Brazil José Claudio O. Silva APTEMC - Analysis, advices and training on EMC São José dos Campos, Brazil Carina Schumann School of Electrical and Information Engineering University of Witwatersrand Johannesburg, South Africa Marco A. S. Ferro ACA / IAE / CTA São José dos Campos, Brazil Abstract— This work presents preliminary observations of the first lightning flash striking an instrumented lightning rod on the top of a common building in Brazil. The measurements include direct electric current in the lightning rod, high-speed recordings using different types of cameras and data from two lightning location systems (LLS) that operate in Brazil: RINDAT and BrasilDAT. The striking flash contained seven strokes. The current measurement of the first stroke had saturated and was not detected by both networks. We believe that the longer rise- time of the electric current prevented its detection by the LLS, since the lightning pulses are supposed to have a shorter rise time as shown in this work. The peak current of the detected strokes estimated by BrasilDAT and RINDAT networks were very close to the direct measurements. The average location error for BrasilDAT was 0.8 km (6 strokes detected, 86%) and for RINDAT was 0.4 km (2 strokes detected, 29%). Keywords— direct current, lightning, striking, building, lightning rod, detection, lightning location system, network I. INTRODUCTION Direct measurements of lightning channel currents on common buildings, under 60 m high, have been first made in the summer of 2014/2015 [1]. Until that summer, all lightning peak current observations were estimated only by lightning location systems (LLS). The LLS is a complex measuring system to detect cloud-to-ground (CG) and/or intra-cloud (IN) discharges. They are based on remote sensor networks, which can detect electromagnetic radiation emitted by the lightning events. The LLS determine the time with a precision of microseconds, the location of the strike point and the peak current estimate [2]. In order to measure the direct electric current of lightning flashes, PEARSON current sensors were installed in lightning rods on the top of two common buildings in São Paulo. The installation of these current sensors was done in partnership with ALDIS – Austria. These buildings were selected because they are the highest structures in the neighborhood. The flash density Ng for the region is about 11 flashes/km 2 .year [3]. On January 27, 2016, we performed the first direct electric current measurement of a 7-stroke lightning flash striking one of the buildings. The photo taken with a Nikon D800 camera is shown in Figure 1. These direct measurements were compared to the peak current estimates provided by BrasilDAT and RINDAT LLS. II. INSTRUMENTATION AND METHODOLOGY A. Video Cameras In addition to the electric current sensors installed in the lightning rods, there are also one standard video camera and two high-speed cameras pointing to the buildings at 200 m distance, as illustrated in Figure 2. The buildings are named P1 and P2 from left to right as seen by the cameras. This first lightning flash was filmed by a GoPro camera, which records at 120 fps and registered all 7 strokes, and by a Phantom v9.1 high-speed camera (3,200 fps) that did not record the whole flash (all its strokes). Figure 3 shows the 7 strokes of the striking lightning as recorded by the GoPro camera. Fig. 1. First observation of direct electric current of a lightning flash striking a building lightning rod.
Transcript of Preliminary comparison of direct electric current ...
2017 International Symposium on Lightning Protection (XIV SIPDA), Natal, Brazil, 2nd – 6th October 2017.
Preliminary comparison of direct electric current measurements in lightning rods and peak current
estimates from lightning location systems
Kleber P. Naccarato Amanda R. de Paiva, Marcelo M. F. Saba
ELAT / CCST / INPE São José dos Campos, Brazil
José Claudio O. Silva APTEMC - Analysis, advices and training on EMC
São José dos Campos, Brazil
Carina Schumann School of Electrical and Information Engineering
University of Witwatersrand Johannesburg, South Africa
Marco A. S. Ferro ACA / IAE / CTA
São José dos Campos, Brazil
Abstract— This work presents preliminary observations of
the first lightning flash striking an instrumented lightning rod on the top of a common building in Brazil. The measurements include direct electric current in the lightning rod, high-speed recordings using different types of cameras and data from two lightning location systems (LLS) that operate in Brazil: RINDAT and BrasilDAT. The striking flash contained seven strokes. The current measurement of the first stroke had saturated and was not detected by both networks. We believe that the longer rise-time of the electric current prevented its detection by the LLS, since the lightning pulses are supposed to have a shorter rise time as shown in this work. The peak current of the detected strokes estimated by BrasilDAT and RINDAT networks were very close to the direct measurements. The average location error for BrasilDAT was 0.8 km (6 strokes detected, 86%) and for RINDAT was 0.4 km (2 strokes detected, 29%).
Keywords— direct current, lightning, striking, building, lightning rod, detection, lightning location system, network
I. INTRODUCTION Direct measurements of lightning channel currents on
common buildings, under 60 m high, have been first made in the summer of 2014/2015 [1]. Until that summer, all lightning peak current observations were estimated only by lightning location systems (LLS). The LLS is a complex measuring system to detect cloud-to-ground (CG) and/or intra-cloud (IN) discharges. They are based on remote sensor networks, which can detect electromagnetic radiation emitted by the lightning events. The LLS determine the time with a precision of microseconds, the location of the strike point and the peak current estimate [2].
In order to measure the direct electric current of lightning flashes, PEARSON current sensors were installed in lightning rods on the top of two common buildings in São Paulo. The installation of these current sensors was done in partnership with ALDIS – Austria. These buildings were selected because they are the highest structures in the neighborhood. The flash density Ng for the region is about 11 flashes/km2.year [3].
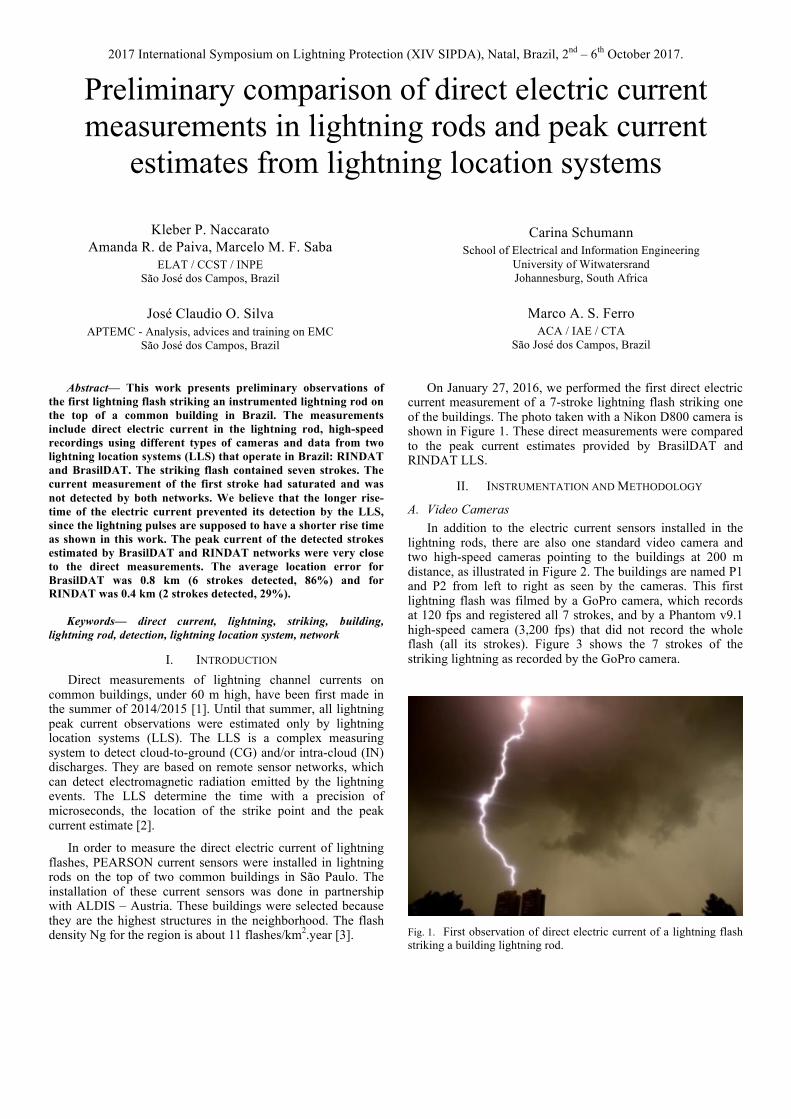
On January 27, 2016, we performed the first direct electric current measurement of a 7-stroke lightning flash striking one of the buildings. The photo taken with a Nikon D800 camera is shown in Figure 1. These direct measurements were compared to the peak current estimates provided by BrasilDAT and RINDAT LLS.
II. INSTRUMENTATION AND METHODOLOGY
A. Video Cameras In addition to the electric current sensors installed in the
lightning rods, there are also one standard video camera and two high-speed cameras pointing to the buildings at 200 m distance, as illustrated in Figure 2. The buildings are named P1 and P2 from left to right as seen by the cameras. This first lightning flash was filmed by a GoPro camera, which records at 120 fps and registered all 7 strokes, and by a Phantom v9.1 high-speed camera (3,200 fps) that did not record the whole flash (all its strokes). Figure 3 shows the 7 strokes of the striking lightning as recorded by the GoPro camera.
Fig. 1. First observation of direct electric current of a lightning flash striking a building lightning rod.
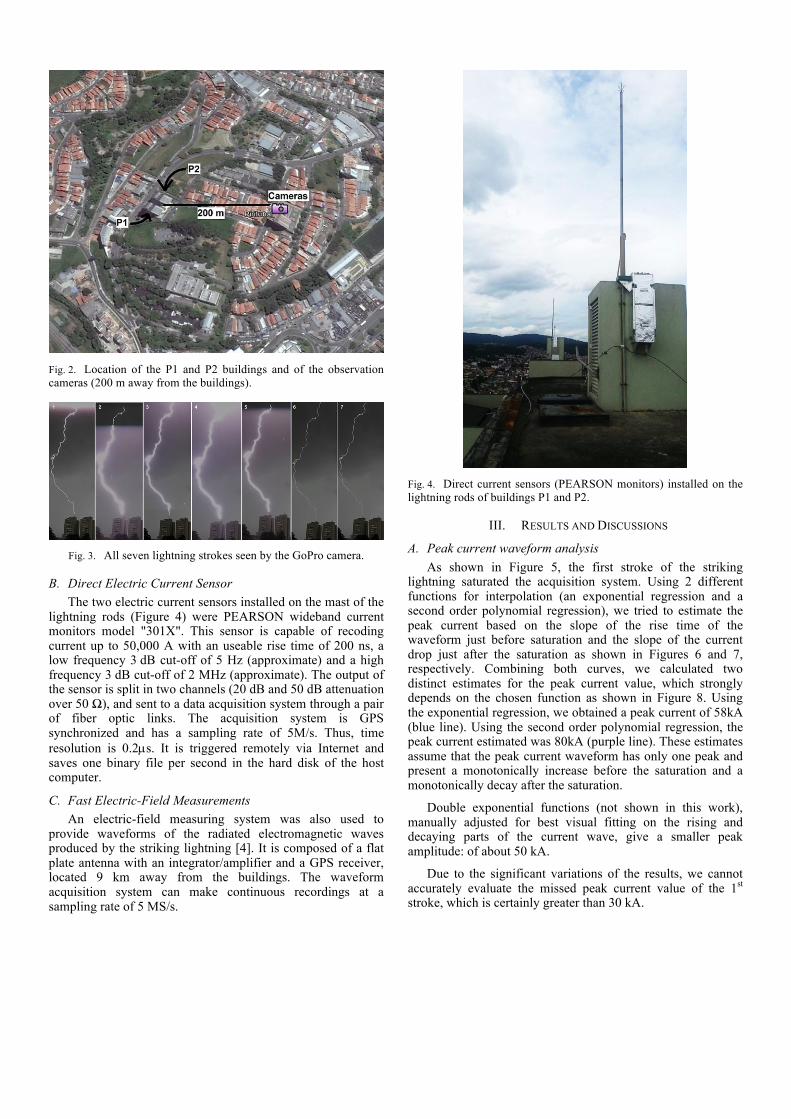
Fig. 2. Location of the P1 and P2 buildings and of the observation cameras (200 m away from the buildings).
Fig. 3. All seven lightning strokes seen by the GoPro camera.
B. Direct Electric Current Sensor The two electric current sensors installed on the mast of the
lightning rods (Figure 4) were PEARSON wideband current monitors model "301X". This sensor is capable of recoding current up to 50,000 A with an useable rise time of 200 ns, a low frequency 3 dB cut-off of 5 Hz (approximate) and a high frequency 3 dB cut-off of 2 MHz (approximate). The output of the sensor is split in two channels (20 dB and 50 dB attenuation over 50 Ω), and sent to a data acquisition system through a pair of fiber optic links. The acquisition system is GPS synchronized and has a sampling rate of 5M/s. Thus, time resolution is 0.2µs. It is triggered remotely via Internet and saves one binary file per second in the hard disk of the host computer.
C. Fast Electric-Field Measurements An electric-field measuring system was also used to
provide waveforms of the radiated electromagnetic waves produced by the striking lightning [4]. It is composed of a flat plate antenna with an integrator/amplifier and a GPS receiver, located 9 km away from the buildings. The waveform acquisition system can make continuous recordings at a sampling rate of 5 MS/s.
Fig. 4. Direct current sensors (PEARSON monitors) installed on the lightning rods of buildings P1 and P2.
III. RESULTS AND DISCUSSIONS
A. Peak current waveform analysis As shown in Figure 5, the first stroke of the striking
lightning saturated the acquisition system. Using 2 different functions for interpolation (an exponential regression and a second order polynomial regression), we tried to estimate the peak current based on the slope of the rise time of the waveform just before saturation and the slope of the current drop just after the saturation as shown in Figures 6 and 7, respectively. Combining both curves, we calculated two distinct estimates for the peak current value, which strongly depends on the chosen function as shown in Figure 8. Using the exponential regression, we obtained a peak current of 58kA (blue line). Using the second order polynomial regression, the peak current estimated was 80kA (purple line). These estimates assume that the peak current waveform has only one peak and present a monotonically increase before the saturation and a monotonically decay after the saturation.
Double exponential functions (not shown in this work), manually adjusted for best visual fitting on the rising and decaying parts of the current wave, give a smaller peak amplitude: of about 50 kA.
Due to the significant variations of the results, we cannot accurately evaluate the missed peak current value of the 1st stroke, which is certainly greater than 30 kA.
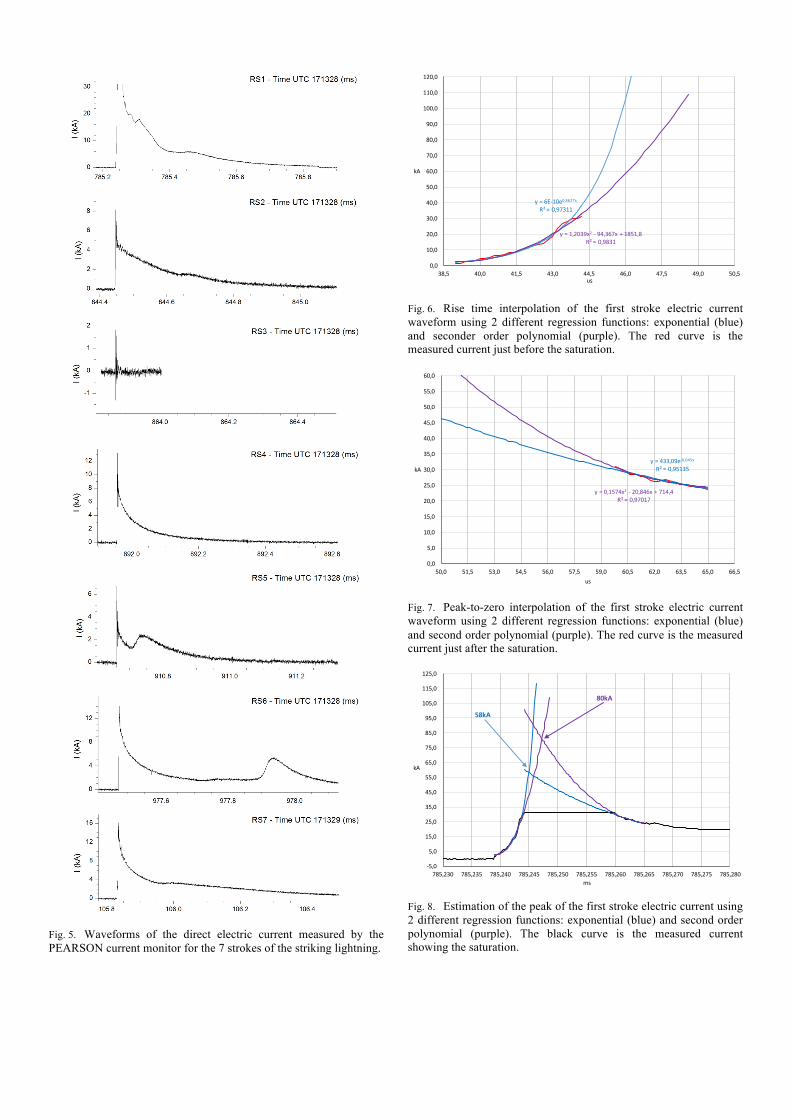
Fig. 5. Waveforms of the direct electric current measured by the PEARSON current monitor for the 7 strokes of the striking lightning.
Fig. 6. Rise time interpolation of the first stroke electric current waveform using 2 different regression functions: exponential (blue) and seconder order polynomial (purple). The red curve is the measured current just before the saturation.
Fig. 7. Peak-to-zero interpolation of the first stroke electric current waveform using 2 different regression functions: exponential (blue) and second order polynomial (purple). The red curve is the measured current just after the saturation.
Fig. 8. Estimation of the peak of the first stroke electric current using 2 different regression functions: exponential (blue) and second order polynomial (purple). The black curve is the measured current showing the saturation.
y=6E-10e0,5627xR²=0,97311
y=1,2039x2 - 94,367x+1851,8R²=0,9831
0,0
10,0
20,0
30,0
40,0
50,0
60,0
70,0
80,0
90,0
100,0
110,0
120,0
38,5 40,0 41,5 43,0 44,5 46,0 47,5 49,0 50,5
kA
us
y=0,1574x2 - 20,846x+714,4R²=0,97017
y=433,09e-0,045xR²=0,95135
0,0
5,0
10,0
15,0
20,0
25,0
30,0
35,0
40,0
45,0
50,0
55,0
60,0
50,0 51,5 53,0 54,5 56,0 57,5 59,0 60,5 62,0 63,5 65,0 66,5
kA
us
-5,0
5,0
15,0
25,0
35,0
45,0
55,0
65,0
75,0
85,0
95,0
105,0
115,0
125,0
785,230 785,235 785,240 785,245 785,250 785,255 785,260 785,265 785,270 785,275 785,280
kA
ms
80kA
58kA
B. Peak Current provided by the LLS We now compared the peak current values from the
waveforms of the 7 strokes to the peak current estimated by both LLS: RINDAT and BrasilDAT networks [2]. The results are summarized in Table I. The GPS time corresponds to the second and millisecond values used to match the peak of the waveforms and the LLS solutions.
TABLE I. COMPARISON OF THE PEAK CURRENT VALUES COMPUTED BY THE DIRECT MEASUREMENT AND ESTIMATED BY THE LLS
Stroke # Time Measured (kA)
BrasilDAT (kA)
RINDAT (kA)
1 28.785 > 30kA NDa ND
2 28.844 8.6 -7 ND
3 28.863 - -6 ND
4 28.891 13.3 -13 ND
5 28.910 6.8 -4b ND
6 28.977 14.2 -16 -14
7 29.105 16.4 -17 -15 a. ND = Not detected
b. Misclassified as IC discharge
For the first stroke, we estimate the direct peak current measurement based on 2 different regressions, as discussed previously. However, we were not able to assess an accurate value for the missed amplitude. For the 3rd stroke, as shown in Table I, we were not able to assess the peak current. Figure 9 shows the waveform of the electric current of the 3rd stroke, which shows a strong high frequency component which requires a more comprehensive investigation. For strokes 4th and 5th we can see clearly M-components superimposed to the channel current. As described in Chapter 4, topic 4.9 [5], these M-components are surges in the relatively steady continuing current that transports negative electric charge from the cloud to ground. The M-component mode differs from the dart-leader-return-stroke mode since the former requires the presence of a current-carrying channel to ground while the latter occurs along the previously formed channel when there is essentially no current flowing.
Fig. 9. Waveform of the direct electric current of the 3rd stroke
From Table I we can see that the peak current estimates from both LLS are very close to the direct measurement. This states that both BrasilDAT and RINDAT are well calibrated in terms of peak current computation. Furthermore, all detected strokes were estimated with negative polarity, in perfect agreement with the direct current waveforms.
C. LLS Detection Efficiency and Location Accuracy According to Table I, BrasilDAT network detected 6 of the
7 strokes, i.e., a detection efficiency of about 86%, although it had classified the 5th stroke as an IC discharge. Thus, the misclassification error is about 17%. On the other hand, the RINDAT network detected only 2 of the 7 strokes, i.e., a detection efficiency of about 29%. Based on the peak current values of Table I, RINDAT detected only the two more intense subsequent strokes. This is related to the RINDAT upgrade effort started in 2015 exactly to improve network performance. Since there are still new sensors not calibrated and sensors offline due to the upgrade process, the RINDAT performance is expectedly lower.
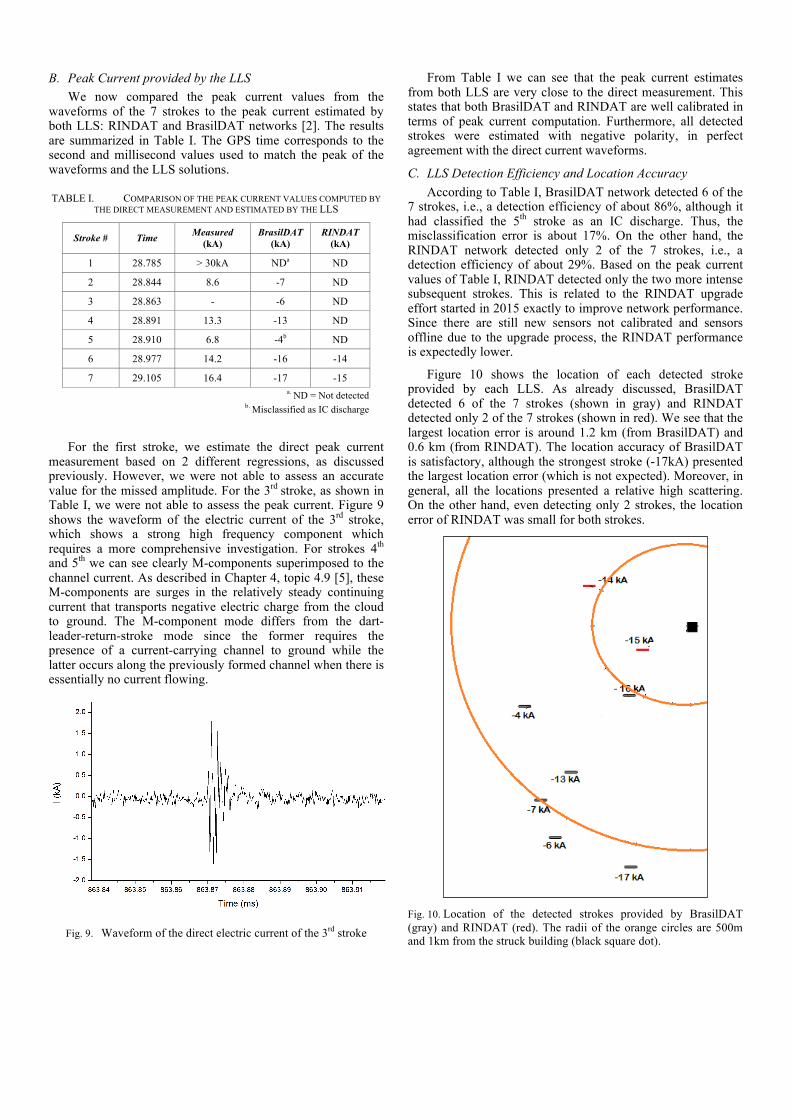
Figure 10 shows the location of each detected stroke provided by each LLS. As already discussed, BrasilDAT detected 6 of the 7 strokes (shown in gray) and RINDAT detected only 2 of the 7 strokes (shown in red). We see that the largest location error is around 1.2 km (from BrasilDAT) and 0.6 km (from RINDAT). The location accuracy of BrasilDAT is satisfactory, although the strongest stroke (-17kA) presented the largest location error (which is not expected). Moreover, in general, all the locations presented a relative high scattering. On the other hand, even detecting only 2 strokes, the location error of RINDAT was small for both strokes.
Fig. 10. Location of the detected strokes provided by BrasilDAT (gray) and RINDAT (red). The radii of the orange circles are 500m and 1km from the struck building (black square dot).
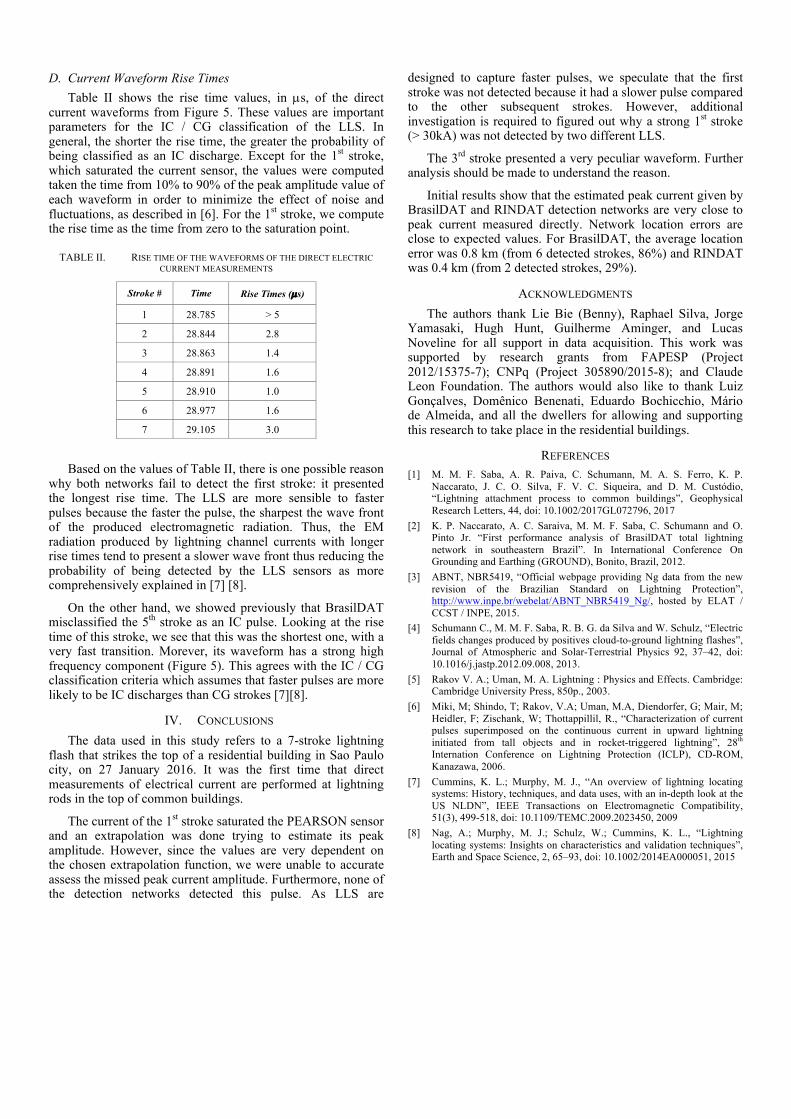
D. Current Waveform Rise Times Table II shows the rise time values, in µs, of the direct
current waveforms from Figure 5. These values are important parameters for the IC / CG classification of the LLS. In general, the shorter the rise time, the greater the probability of being classified as an IC discharge. Except for the 1st stroke, which saturated the current sensor, the values were computed taken the time from 10% to 90% of the peak amplitude value of each waveform in order to minimize the effect of noise and fluctuations, as described in [6]. For the 1st stroke, we compute the rise time as the time from zero to the saturation point.
TABLE II. RISE TIME OF THE WAVEFORMS OF THE DIRECT ELECTRIC CURRENT MEASUREMENTS
Stroke # Time Rise Times (µs)
1 28.785 > 5
2 28.844 2.8
3 28.863 1.4
4 28.891 1.6
5 28.910 1.0
6 28.977 1.6
7 29.105 3.0
Based on the values of Table II, there is one possible reason why both networks fail to detect the first stroke: it presented the longest rise time. The LLS are more sensible to faster pulses because the faster the pulse, the sharpest the wave front of the produced electromagnetic radiation. Thus, the EM radiation produced by lightning channel currents with longer rise times tend to present a slower wave front thus reducing the probability of being detected by the LLS sensors as more comprehensively explained in [7] [8].
On the other hand, we showed previously that BrasilDAT misclassified the 5th stroke as an IC pulse. Looking at the rise time of this stroke, we see that this was the shortest one, with a very fast transition. Morever, its waveform has a strong high frequency component (Figure 5). This agrees with the IC / CG classification criteria which assumes that faster pulses are more likely to be IC discharges than CG strokes [7][8].
IV. CONCLUSIONS The data used in this study refers to a 7-stroke lightning
flash that strikes the top of a residential building in Sao Paulo city, on 27 January 2016. It was the first time that direct measurements of electrical current are performed at lightning rods in the top of common buildings.
The current of the 1st stroke saturated the PEARSON sensor and an extrapolation was done trying to estimate its peak amplitude. However, since the values are very dependent on the chosen extrapolation function, we were unable to accurate assess the missed peak current amplitude. Furthermore, none of the detection networks detected this pulse. As LLS are
designed to capture faster pulses, we speculate that the first stroke was not detected because it had a slower pulse compared to the other subsequent strokes. However, additional investigation is required to figured out why a strong 1st stroke (> 30kA) was not detected by two different LLS.
The 3rd stroke presented a very peculiar waveform. Further analysis should be made to understand the reason.
Initial results show that the estimated peak current given by BrasilDAT and RINDAT detection networks are very close to peak current measured directly. Network location errors are close to expected values. For BrasilDAT, the average location error was 0.8 km (from 6 detected strokes, 86%) and RINDAT was 0.4 km (from 2 detected strokes, 29%).
ACKNOWLEDGMENTS The authors thank Lie Bie (Benny), Raphael Silva, Jorge
Yamasaki, Hugh Hunt, Guilherme Aminger, and Lucas Noveline for all support in data acquisition. This work was supported by research grants from FAPESP (Project 2012/15375-7); CNPq (Project 305890/2015-8); and Claude Leon Foundation. The authors would also like to thank Luiz Gonçalves, Domênico Benenati, Eduardo Bochicchio, Mário de Almeida, and all the dwellers for allowing and supporting this research to take place in the residential buildings.
REFERENCES [1] M. M. F. Saba, A. R. Paiva, C. Schumann, M. A. S. Ferro, K. P.
Naccarato, J. C. O. Silva, F. V. C. Siqueira, and D. M. Custódio, “Lightning attachment process to common buildings”, Geophysical Research Letters, 44, doi: 10.1002/2017GL072796, 2017
[2] K. P. Naccarato, A. C. Saraiva, M. M. F. Saba, C. Schumann and O. Pinto Jr. “First performance analysis of BrasilDAT total lightning network in southeastern Brazil”. In International Conference On Grounding and Earthing (GROUND), Bonito, Brazil, 2012.
[3] ABNT, NBR5419, “Official webpage providing Ng data from the new revision of the Brazilian Standard on Lightning Protection”, http://www.inpe.br/webelat/ABNT_NBR5419_Ng/, hosted by ELAT / CCST / INPE, 2015.
[4] Schumann C., M. M. F. Saba, R. B. G. da Silva and W. Schulz, “Electric fields changes produced by positives cloud-to-ground lightning flashes”, Journal of Atmospheric and Solar-Terrestrial Physics 92, 37–42, doi: 10.1016/j.jastp.2012.09.008, 2013.
[5] Rakov V. A.; Uman, M. A. Lightning : Physics and Effects. Cambridge: Cambridge University Press, 850p., 2003.
[6] Miki, M; Shindo, T; Rakov, V.A; Uman, M.A, Diendorfer, G; Mair, M; Heidler, F; Zischank, W; Thottappillil, R., “Characterization of current pulses superimposed on the continuous current in upward lightning initiated from tall objects and in rocket-triggered lightning”, 28th Internation Conference on Lightning Protection (ICLP), CD-ROM, Kanazawa, 2006.
[7] Cummins, K. L.; Murphy, M. J., “An overview of lightning locating systems: History, techniques, and data uses, with an in-depth look at the US NLDN”, IEEE Transactions on Electromagnetic Compatibility, 51(3), 499-518, doi: 10.1109/TEMC.2009.2023450, 2009
[8] Nag, A.; Murphy, M. J.; Schulz, W.; Cummins, K. L., “Lightning locating systems: Insights on characteristics and validation techniques”, Earth and Space Science, 2, 65–93, doi: 10.1002/2014EA000051, 2015