Preheating of silicic acid i n silica sol...
51
Department of Chemistry and Chemical Engineering CHALMERS UNIVERSITY OF TECHNOLOGY Gothenburg, Sweden 2018 Preheating of silicic acid in silica sol production Master’s Thesis in Innovative and Sustainable Chemical Engineering YLVA GRAMPP
Transcript of Preheating of silicic acid i n silica sol...

Department of Chemistry and Chemical Engineering CHALMERS UNIVERSITY OF TECHNOLOGY Gothenburg, Sweden 2018
Preheating of silicic acid in silica sol production Master’s Thesis in Innovative and Sustainable Chemical Engineering
YLVA GRAMPP

MASTER’S THESIS KBTX12
Preheating of silicic acid in silica sol production
ylva grampp
Department of Chemistry and Chemical Engineeringchalmers university of technology
Gothenburg, Sweden 2018

Preheating of silicic acid in silica sol productionylva grampp
© ylva grampp, 2018.
Master’s thesis KBTX12In colloboration with AkzoNobel Specialty ChemicalsSupervisor: Anders JosefssonExaminer: Derek Creaser
Department of Chemistry and Chemical EngineeringChalmers University of TechnologySE-412 96 GothenburgSwedenTelephone + 46 (0)31-772 1000
Cover:A reactor for silica sol production with preheating of the feed.
Department of Chemistry and Chemical EngineeringGothenburg, Sweden 2018

Preheating of silicic acid in silica sol productionylva gramppDepartment of Chemistry and Chemical EngineeringChalmers University of Technology
Abstract
Silica sols dispersed in water are produced by AkzoNobel Specialty Chemicals. A recipe forthe manufacturing of the specific sol studied in this thesis is provided by AkzoNobel. Theproduction of the studied sol includes ion exchange of sodium silicate to silicic acid. Silicic acidthen polymerizes and grows to spherical particles by a condensation reaction. To reach a specificsize of the sol particles, a sol of smaller particles - a heel - is further grown in a semi-batch reactorby addition of silicic acid, and sodium silicate to keep the pH at a desired level.
The reactor is kept at an elevated temperature to increase the rate of reaction. The heatingis currently done with steam in the reactor jacket. Both steam and cooling water consumptionwould decrease if the silicic acid were to be preheated before addition with an existing hot streamof the process. If the silicic acid can be preheated to 70°C for the studied sol, the savings ofsteam is calculated as 154 SEK/tonne product.
Due to the reactivity of silicic acid, preheating may cause nucleaction and polymerization of silicaparticles before the feed has reached the reactor and thus affect the particle size distribution.The particle size distribution of a silica sol can be measured with an electrospray differentialmobility analyser.
Experiments were performed in lab-scale with a reactor and a water bath as heat exchanger. Itwas shown that a high preheating temperature results in a new particle formation in additionto condensation on existing particles in the heel, causing a bimodal particle size distributionas opposed to the more often desired monodisperse particle size distribution. The preheatingtemperature had a greater effect on silicic acid that had been stored and close to no effect onsilicic acid fresh from the ion exchanger.
Keywords: colloidal silica, silica sol, preheating, silicic acid, buildup method, column method

Contents
1 Introduction 11.1 Background . . . . . . . . . . . . . . . . . . . . . . . . . . . . . . . . . . . . . . . 11.2 Objective . . . . . . . . . . . . . . . . . . . . . . . . . . . . . . . . . . . . . . . . 21.3 Delimitations . . . . . . . . . . . . . . . . . . . . . . . . . . . . . . . . . . . . . . 2
2 Theory 42.1 Production of silica sol . . . . . . . . . . . . . . . . . . . . . . . . . . . . . . . . . 5
2.1.1 Production of sodium silicate . . . . . . . . . . . . . . . . . . . . . . . . . 52.1.2 Ion exchange of sodium silicate . . . . . . . . . . . . . . . . . . . . . . . . 62.1.3 Reactor . . . . . . . . . . . . . . . . . . . . . . . . . . . . . . . . . . . . . 72.1.4 Dewatering . . . . . . . . . . . . . . . . . . . . . . . . . . . . . . . . . . . 11
2.2 Particle size measurement . . . . . . . . . . . . . . . . . . . . . . . . . . . . . . . 112.2.1 Principles of ES - DMA . . . . . . . . . . . . . . . . . . . . . . . . . . . . 12
2.3 Heat integration . . . . . . . . . . . . . . . . . . . . . . . . . . . . . . . . . . . . 14
3 Materials and method 163.1 Chemicals . . . . . . . . . . . . . . . . . . . . . . . . . . . . . . . . . . . . . . . . 163.2 Sol syntheses . . . . . . . . . . . . . . . . . . . . . . . . . . . . . . . . . . . . . . 163.3 Characterisation . . . . . . . . . . . . . . . . . . . . . . . . . . . . . . . . . . . . 17
3.3.1 Chemical and physical characterisation . . . . . . . . . . . . . . . . . . . . 183.3.2 Particle characterisation . . . . . . . . . . . . . . . . . . . . . . . . . . . . 193.3.3 Correlation and ANOVA . . . . . . . . . . . . . . . . . . . . . . . . . . . . 19
3.4 Economic and environmental evaluation . . . . . . . . . . . . . . . . . . . . . . . 20
4 Results 214.1 Analysis of silicic acid . . . . . . . . . . . . . . . . . . . . . . . . . . . . . . . . . 21
4.1.1 Effect of ageing on silicic acid . . . . . . . . . . . . . . . . . . . . . . . . . 214.1.2 Effect of heating on silicic acid . . . . . . . . . . . . . . . . . . . . . . . . 22
4.2 Sol synthesis product . . . . . . . . . . . . . . . . . . . . . . . . . . . . . . . . . . 234.2.1 Particle size measurements . . . . . . . . . . . . . . . . . . . . . . . . . . 23
4.3 Saving of steam . . . . . . . . . . . . . . . . . . . . . . . . . . . . . . . . . . . . . 30
5 Discussion 315.1 Silicic acid . . . . . . . . . . . . . . . . . . . . . . . . . . . . . . . . . . . . . . . . 31
5.1.1 Silicic acid prepared in lab . . . . . . . . . . . . . . . . . . . . . . . . . . 315.1.2 Heating of silicic acid . . . . . . . . . . . . . . . . . . . . . . . . . . . . . 32
5.2 Sol syntheses . . . . . . . . . . . . . . . . . . . . . . . . . . . . . . . . . . . . . . 325.2.1 Particle size distribution . . . . . . . . . . . . . . . . . . . . . . . . . . . . 33
5.3 Saving of steam . . . . . . . . . . . . . . . . . . . . . . . . . . . . . . . . . . . . . 345.4 Future studies . . . . . . . . . . . . . . . . . . . . . . . . . . . . . . . . . . . . . . 34
6 Conclusion 36

Bibliography 39
Acknowledgements 40
A Figures and tables iA.1 Sodium silicate and heel . . . . . . . . . . . . . . . . . . . . . . . . . . . . . . . . iA.2 Silicic acid . . . . . . . . . . . . . . . . . . . . . . . . . . . . . . . . . . . . . . . . iA.3 Synthesis product . . . . . . . . . . . . . . . . . . . . . . . . . . . . . . . . . . . . iii

1 Introduction
Made of essentially sand and water, aqueous silica sol is regarded as an environmentally friendlyproduct and has a wide range of applications [1–4]. Since it is stable and has a high specificsurface area it is commonly used as a base for catalysts and adsorbers. Silica sols can be usedin high-temperature insulating materials and for precision casting as a binding agent. Otherapplications include beverage clarification, water treatment, and surface polishing, especially forsilicon wafers in the electronics industry. They can be added to cement to increase the strengthand stability, and into coatings to improve hardness and achieve anti-soiling properties. Silicasols are also used in the pulp and paper industry as a retention aid in papermaking.
The process to produce silica sol has a history that stretches back to the early 1900s [5]. Thefirst patent for commercial production of silica sol was announced in 1915, where Schwering usedelectrodialysis to manufacture a pure and stable sol of 2.4% silica [6]. A stable silica sol to reacha concentration of 10% silica was first marketed in 1933. In 1941, Bird patented a novel way tomanufacture silica sol, starting from water glass and using an ion exchange process [7]. This isstill the foundation of the commercial processes used today. It was further improved by Bechtoldand Snyder in 1951 and since then it has been possible to manufacture highly concentratedcolloidal silica of a uniform and controlled size [5].
This thesis is performed in collaboration with AkzoNobel Specialty Chemicals, which producessilica sols dispersed in water. The production currently within AkzoNobel dates back to 1956when a colloidal silica plant was started in Leverkusen, Germany. The product range todayincludes silica sol with a particle diameter of 2-100 nm, a surface area of 30-1100 m2/g, aconcentration up to 50% SiO2 and both alkaline and acidic pH. The particles can be sodium-or ammounium-stabilized and products can have aluminum- or silane-modified surfaces. Theproducts can also be deionized and the structure is tuneable to achieve discrete particles or chains.Although the general process scheme has stayed the same for decades, smaller details of themanufacturing process can still be improved. Furthermore, new products for specific applicationsare continuously developed. In the last twenty years there has been a trend in colloidal silicabuyers where more specific products to be used for additional and complex applications aredemanded [5].
1.1 Background
The process to produce silica sol has continuously been improved since the first plant, currentlywithin AkzoNobel, was built in the 1950’s. This master thesis will study in further detail a wayto improve the energy efficiency of the manufacturing process of one type of sol.
The synthesis of the studied silica sol is performed in a semi-batch reactor where material is fed
1

to the reactor but not withdrawn until completion of the reaction. Most of the feed consists ofsilicic acid which is produced on the site in a separate ion exchange unit, and either fed to thereactor directly or via a storage tank.
The reactor is kept at an elevated temperature during the sol synthesis. The reaction is en-dothermic [8], but the heat of reaction is negligible in comparison to the heat required to raisethe temperature to the elevated temperature [3]. Preheating of the silicic acid inlet feed hadnot been performed at any of AkzoNobels plants until recently. When preheating in full scale itwas found that it affected the synthesis of the sol and in particular the particle size distribution.This result has also been confirmed in lab scale at the Process Development Colloidal SilicaRD&I department at AkzoNobel, Bohus. A change in particle size distribution is undesired forthe customers who expect a certain particle size distribution and the inherent properties of suchparticles.
The upside to preheating would be that the reactor is not cooled by the inlet feed. This couldpotentially make the reaction step faster since commercial semi-batch reactors in general are heattransfer rate limited [9]. In addition, by defining the silicic acid feed stream to the reactor as acold process stream (a stream with a heating demand), the stream can be used in an internalheat exchanger provided that there exists a hot stream that requires cooling. If internal processstreams can be used for heating and cooling rather than steam and cooling water, the processbecomes more energy efficient. This is especially good from a sustainability point of view sincethe available energy for many chemical process plants comes from combustion of fossil fuels, suchas natural gas or oil, which releases greenhouse gases. With increased integration of the processit also follows that less cold utility is required.
1.2 Objective
The objective of the thesis is to examine in lab scale at which process conditions it is possibleto preheat the silicic acid in the silica sol synthesis without experiencing adverse effects on theproduct. The temperature of the preheating step and the storage time of the silicic acid can bevaried. The residence time in the preheating step is also a parameter.
The potential energy saved increases as the preheating temperature increases. An economicand environmental evaluation of the value of the energy saved by applying the best preheatingcondition is also made.
1.3 Delimitations
AkzoNobel has several recipes for different silica sols out of which one has been chosen for thisstudy, referred to as the studied sol. It will have to be evaluated whether the result of thepreheating for the chosen sol is valid for other types of silica sols as well.
The storage time of silicic acid in a full scale plant is often assumed to be four hours. Theproject investigates storage times between 0 and ≥ 20 hours, where the higher storage times can
2

be considered as worst case scenarios. The variations of the temperature and residence time inthe preheating step are limited to approximately 90°C and five minutes, since this correspondsto existing equipment in the full scale plant.
3

2 Theory
The term silica is used for any crystalline, amorphous, hydrated, or hydroxylated form of silicondioxide, SiO2. Silica is an abundant material, with crystalline silica in the form of quartz asthe main component of the crust of the earth [10]. In most silica compounds the silicon atom issurrounded by four oxygen atoms, creating a SiO4 tetrahedron as in figure 2.1a. The tetrahedronbecomes a building block for sheets, chains and three-dimensional networks by sharing of theoxygen atoms, see figure 2.1b [10]. The SiO4 units are randomly packed in amorphous silica.Much of the fundamental knowledge about silica chemistry is reported in Ralph K. Iler’s ’TheChemistry of Silica’ from 1979 [3], called ”the definitive book on silica chemistry” [11].
(a) One single SiO4
tetrahedron(b) Sharing of oxy-gen atoms
Figure 2.1: The structure of silica and linking of tetrahedrons in an amorphous fashion.
Colloidal silica are particles of amorphous silica with a size in least one dimension between 1 nmand 1 µm [12]. Due to the small particle diameters, colloidal silica has an extremely large specificsurface area. Many different groups can be formed on the surface of the particles, among themhydroxyl groups (≡Si-OH), called silanol groups, and silanediol groups. Silanol groups on thesurface can be silanized, esterified, or stabilized by alkaline ions [10]. The surface can also bemodified to incorporate elements such as Na, K or Al.
Silica sol is the stable dispersion of solid colloidal silica particles in a liquid - stable in the sensethat the solid particles do not settle or agglomerate at a significant rate [13]. Commercial sols canoften be stored for years without settling or gelling [4]. A sol has discrete or separate particleswhereas a gel consists of coherent three-dimensonal aggregates with siloxane bonding (Si-O-Si)at the contact points [3]. When a sol gels the whole medium becomes viscous. A sol must alsobe stable against flocculation and coagulation, where the particles are lumped together to formclusters. These clusters may settle or float, depending on the density of the flocs. The differencebetween sol, gel and flocculation is depicted in figure 2.2.
4

Figure 2.2: From left to right: sol, gel and flocculation.
2.1 Production of silica sol
There are several different ways to produce silica sols. Otterstedt and Brandreth names themost important types of production processes as: the column method, the consol method, theautoclave method and the Stober method [4].
The autoclave method refers to the process of growing a small particle sol to larger particlesin an autoclave. Stober sols consists of porous particles, made with tetraethyl orthosilicates(Si(OEt)4) as starting material. The hydrolysis of tetraethyl orthosilicate to form SiO2 particlestakes place in an alcohol. The column method and consol method are methods for producingsilica sol dispersed in water. The raw material is sodium silicate, also called water glass [1].
The studied sol is prepared commercially by the column method. More detail regarding theprocess will follow in the next sections. The process can be divided into three major steps: ionexchange of sodium silicate to produce silicic acid, nucleation and growth of the silica particles ina reactor and finally concentration of the reactor product [14]. The process scheme of a typicalcolumn method process is shown in figure 2.3.
The consol process is also based on the ion exchange technique, but ion exchange and polymer-ization of silica takes place simultaneously as the ion exchange resin and sodium silicate is fedto the reactor. The consol process has simpler equipment and the pH will be kept higher wheremicrogel is less likely to form. However, more sodium will be incorporated in the sol [4].
Another variation to the ion exchange process is called the slurry process, patented in 1963 [15].Similarly to the consol process, sodium silicate is dosed directly to the reactor. Ion exchangeresin is placed in the reactor where ion exchange and growth of particles take place simultane-ously.
2.1.1 Production of sodium silicate
Sodium silicate is made in a process where sand and soda ash is melted in an oven. Carbon dioxideis released and sodium silicate is the product according to the following reaction [3]:
3SiO2 +Na2CO3 → CO2 + 3SiO2 ·Na2O (2.1)
5

2 3
5
4
6
8
1
H₂O
H₂O
Silicic acid
Sodium silicate
7
Figure 2.3: Dissolved sodium silicate is stored in (1). The solution is filtered (2) and diluted with waterin (3). The ion exchanger (4) converts the sodium silicate to silicic acid which can be stored in (5)before it enters the reactor (6). Sodium silicate is also dosed to the reactor. Concentration of the reactorproduct is done in a separation step (7) before storage in the quality assurance tank (8).
The solid sodium silicate is dissolved and diluted with water to reach 5-6% silica content. It is alsofiltrated to remove impurities and larger silica particles before it enters the ion exchanger.
2.1.2 Ion exchange of sodium silicate
The ion exchange process that is used to produce silicic acid is based on the 1941 patent by Bird[16], where a solution of sodium silicate is passed through a cation ion-exchange resin column.Sodium ions are removed and replaced by hydrogen ions. The hydrogen ions are eventuallyexhausted and a breakthrough of sodium ions will occur [17]. The ion exchange beds must beregenerated after exhaustion. A common arrangement is to have ion exchange columns orderedin parallel and working in cycles [18]. The regeneration is done with a strong acid and washing isperformed with water between regeneration and exhaustion. Dilution with water, breakthroughof sodium ions and current operating conditions will cause the quality of the silicic acid to varyboth from batch to batch and within a batch.
The resulting solution after sodium silicate is passed through the column is called silicic acidand contains oligomeric and monomeric silica in the form of Si(OH)4. It is a metastable solutionwhich will polymerize quickly when heated [3] and gel upon standing for a longer period [14].The step between the ion exchange and the reactor is thus time sensitive. A sign that the silicicacid is close to gelling is that the viscosity rapidly increases, from a viscosity of 1 cP to a viscosityof 20 cP or even above 100 cP [19].
The polymerization of silicic acid is a condensation reaction starting with the ionization of asilanol group, see reaction 2.2-2.3.
6

≡Si−OH +OH− −→≡Si−O− +H2O (2.2)
≡Si−O− +HO−Si≡ −→≡Si−O−Si≡ +OH− (2.3)
Due to the reactivity of monomeric silica, the silicic acid soon contains larger units of silica,around 2 nm in size [4]. Monomeric silica is acidic and is more likely to become ionized withan increasing pH. The point of zero charge is found between pH 2 and 3. As can be seen fromreaction 2.2 and 2.3, hydroxyl ions are catalyzing the condensation reaction. The metastablebehaviour of silicic acid around pH 2-3 is explained by some to be due to the scarcity of ionizedsurface groups. Others explain the metastability as the result of the hydration of the surfaceof particles, forming a layer of water molecules hydrogen-bonded to the silanol groups, andconsequently dehydration at a higher pH [3, 20].
The concentration also effects the stability of silicic acid. When comparing silicic acid of differentconcentration, prepared the same way, Bergna found that silicic acid of 5% silica took 24 hoursto gel at room temperature, while silicic acid of 4% took 48 hours [19]. The temperature andthe salt concentration are also important for the stability of silicic acid [3].
Depending on how the production line is built, the silicic acid can either go straight to the reactoror to a storage tank. In a storage tank the silicic acid from batches and within batches will mix,but the silicic acid is also aged during storage and will slowly continue polymerization. Theresidence time in the storage tank is important to prevent gel formation.
2.1.3 Reactor
Iler describes three stages for the polymerization of silica: polymerization of monomer to formparticles, growth of particles, and linking together of particles to form three-dimensional networksthroughout the liquid medium, thickening it to a gel [3]. The findings of Iler has been confirmed inlater studies [4]. Polymerization includes nucleation and growth of particles but also aggregationof particles. The types occur predominantly under different conditions as seen in figure 2.4. Bothforms of polymerizations will be described in the following sections.
Particle growth
Iler makes a distinction between polymerization at pH 2-7 and pH above 7 [3]. One way to createa silica sol is to allow the monomeric silica from the ion exchanger react with itself accordingto reaction 2.2-2.3. This would correspond to a reaction at pH 2 to 3. At pH 2 to 3, thereaction is significantly slower than at a higher pH and has therefore been studied in great detail.Between pH 2 and 7, the rate of reaction 2.2-2.3 is proportional to the OH− concentration. Thecondensation occurs so that the siloxane (Si-O-Si) bonds are maximised and the Si-OH groupsare minimised, thus leading to ring structures [3]. This is followed by addition of monomer andcondensing of internal hydroxyl groups, forming very small, compact, spherical units [3]. Thesesmall units are the precursors of colloidal particles. Particles of 1-2 nm that consists of 10-100
7

Figure 2.4: Polymerization behaviour of silica, starting from silicic acid, under different conditions.Figure reprinted from reference [3] with permission from John Wiley & Sons.
SiO2 units serves as nuclei where dissolved monomeric units condense on the surface of the largerspheres.
Continued growth of the spherical units takes place by Ostwald ripening, where more solubleparticles dissolve and deposit on less soluble particles [3]. The solubility depends on the size ofthe particles, the temperature and the pH. The growth stops when the difference in solubilitybetween the particles is only a few ppm, and thus the final size of the particles depend both onthe temperature and the pH. A high temperature, often close to 100°C, and a pH above 9 isoften used to promote particle growth.
Aggregation
Growth also occurs by aggregation of particles. Attachment between silica particles is thoughtto occur by the formation of siloxane bonds. With the presence of OH− as a catalyst, a Si-OH group on the surface of one particle and a Si-O− group on the surface of another particlecan condense and form a Si-O-Si bond [3]. The linking together of particles creates branchedchains and three-dimensional network regions much like a microgel. If the microgel region growsto occupy about half of the total volume, the viscosity become infinite and the sol has gelled[3].
8

With a higher pH, the particles are more negatively charged and will thus repel each other, whichreduces the risk of aggregation. The most stable point that resists aggregation occurs between pH8 and 10.5 for a Na-stabilized sol [3]. A high salt concentration may cause the sol to coagulate.The mechanisms of sol stability with regard to pH, salts and temperature are described in detailin Iler’s ’The Chemistry of Silica’ [3].
Commercial production
Whether discrete or aggregated particles are desired depends on the application for which the solwill be used. For example, when the sol is used as retention aid in papermaking, the retentioncapability increases with an increasing degree of microaggregation [21]. In coating applicationsa non-aggregated sol is often preferred [22]. As seen in figure 2.4, changing parameters such aspH and salt concentration is required to promote one mechanism over the other.
Most commercial silica sols consists of discrete, dense spherical particles [21]. The studied solin this project belongs to this group. For commercial production of silica sols with discreteparticles, the reaction takes place at a pH between 8-10 and at elevated temperatures to speedup the polymerization [4, 14]. A commercial reactor is equipped with a steam heated jacket.In the pH interval 8-10, the rate of growth is several orders of magnitudes faster than at pH 2[4]. The pH is often adjusted by the use of alkali silicate solutions with different SiO2:Na2Oratios.
Buildup process
The studied sol is produced by a variation to the reactor step called the buildup process. Theobjective is to control the silica polymerization to give the desired particle size distribution.
In a 1951 patent by Bechtold and Snyder, the process by Bird was further refined as to allowcontrol of particle size and other modifications [23]. Their process introduced the use of a heel. Aheel is a smaller sized silica sol. Bechtold and Snyder created the heel by the same ion-exchangeprocess as was patented by Bird and thereafter by heating a part of the silicic acid to at least60°C in which particles of less than 10 nm were formed. The heel is then used as a nuclei forfurther particle growth. The particle size of the original sol is increased by deposition of silica[4]. The process can be carried out in a semi-batch fashion as in figure 2.5, where a diluted heelis placed in the reactor and silica in the form of silicic acid and sodium silicate is added.
Figure 2.5: Semi-batch reactor for the buildup process of silica sol.
9

Iler defines the buildup ratio Br as
Br =Wa
Wn(2.4)
where Wa is the amount of silica added to the particles and Wn is the amount of silica alreadypresent as heel [3]. The final particle diameter df can be related to the initial particle diameterdi as follows [3]:
(dfdi
)3
=Wn +Wa
Wn= 1 +Br (2.5)
The formula is based on the assumption of ideal particle growth, i.e. all silicic acid will depositon the available silica particles, no new particles are formed and the particles do not agglom-erate. The particles are also assumed to be spherical and uniformly coated by the depositingsilica.
In a patent from 1972, Albrecht specifically treats the optimum rate of silicic acid addition tothe reactor [24]. A sol with particles of 48 nm was grown by addition of silicic acid to a heel withparticles of 21.3 nm. The flask was heated to boiling temperature and the pH was kept above 8with addition of sodium silicate.
The concentration of growing particles must not be too small compared to the rate of addition,or new nuclei will form [1]. The rate of silica addition to the reactor in g/h per ml of sol in thereactor at time t can be described as:
Ft = kS0C2/3t C
1/30 (2.6)
where S0 is the surface area of the heel in m2/g SiO2, Ct the concentration in the reactor at timet in g SiO2/ml and C0 the initial concentration. The constant k is a value relating the rate ofaddition of silica to the maximum available area in m2/ml to deposit on:
k =Ft
S0C2/3t C
1/30
(2.7)
Albrecht, Iler and Otterstedt et al. have all made observations of the maximum rate of silicaaddition compared to the available silica surface while still achieving ideal particle growth withoutany new particle formation [3, 4, 24]. Iler cites a k-value of 0.005 at 90°C [3], same as Albrechtat 100°C [24]. Otterstedt et al. observed new particle formation at a k-value higher than 0.007[4]. The method of addition and specifically the rate of addition, is important to the resultingparticle growth. New particle formation in addition to the buildup of the heel particles createsa bimodal particle distribution.
10

Modifications of the sol
When a sol has been made from ion-exchanging a sodium silicate solution, the surface groupsare stabilised with Na+ ions. Another alkali can be added to make the surface stabilised withanother cation, such as NH+
4 acting as counter ion instead [4]. Sodium aluminate can be addedto the sol to create a surface of aluminosilicate ions which will make the sol more stable towardsgelling at a low pH [4]. Silane modified sols have been shown to improve the stability, waterresistance and dirt pick-up resistance for silicate paint [22].
There are also modifications to reverse the charge of the silica particles to keep them stable in alower pH region. Some modifications are performed on a electrolyte free sol, i.e. a synthesisedsol which is passed through another ion exchange unit [14].
2.1.4 Dewatering
Dewatering of the reactor product is performed to ease the transportation of the sol [14]. A highconcentration is also desired in many applications.
According to Iler, the most common method to concentrate silica sols in the industry in 1979was by evaporation [3]. Evaporation is a practical approach since the high temperature not onlyevaporates the water and concentrates the solution, but also promotes further condensation onthe particles and hence is a part of the growth step. The evaporation must be carefully controlledas to not let the silica get too concentrated locally and build up on walls or form a gel. However,due to rising costs of heating, it was predicted that other methods would increase in use in thefuture. Other methods mentioned by Iler includes ultrafiltration and centrifugation.
2.2 Particle size measurement
Bechtold and Snyders buildup process results in quite monodisperse particles with a size distri-bution around an average value, similar to a normal distribution [23]. There are several waysto express the average diameter or size distribution of particles [4]. One common way is by themass weighted mean diameter:
dm =
∑i=1
midi
M(2.8)
where m is the mass of the particles of a specific diameter and M is the total mass of allparticles. Another way is to present the average size of the particles by the number weightedmean diameter:
dn =
∑i=1
nidi
N(2.9)
11

where n is the number of particles of a specific diameter and N is the total number of particles.The mean diameter takes a different value depending on the chosen method. Larger particles witha higher mass will contribute more to the mean diameter in equation 2.8 than small particles withlower mass, while all particles independent of size contributes equally for the number weightedmean diameter.
Owing to the nature of the reaction, the grown silica particles can be assumed to be spherical.The surface area of silica sols has historically been used to find an average size of silica particles[25], relating the specific surface area S to the average diameter as follows:
S =6
ρd(2.10)
where ρ is the density of the particles, often assumed to be 2.2 g/cm3 [4]. A common method tomeasure the specific surface area is by titration with NaOH as proposed by Sears in 1956 [26].The method is based on a empiric relationship between the amount of adsorbed hydroxyl ionsand the surface area of silica particles.
While undesired for some applications, it is probable that the particles are aggregated to someextent. The aggregated particles are either included in the average size or not, depending on themethod of analysis. Ways to study the particle size distribution includes electron microscopy,dynamic light scattering, centrifugal liquid sedimentation and electrospray differential mobilityanalysis (ES-DMA).
An example graph with the result of a ES-DMA analysis is pictured in figure 2.6. A desiredsize distribution of a monodisperse particle follows line 2 in figure 2.6. Non-ideal particle growthduring the buildup process may cause a bimodal particle size distribution instead. The firstpeak, line 1 in figure 2.6, can overlap more or less with the original peak, making the populationsharder to distinguish. In the case of bimodality, a quantification of the bimodality is proposed byestimating the number of particles with smaller size in the first peak and compare it to the totalnumber of particles in both peaks. Estimating the number of particles can be done by estimatingthe area of the first and second peak. The bimodality quantification is written as:
B =A1
A1 +A2(2.11)
where B is a percentage of the particles that exist due to new particle nucleation and growth,instead of secondary nucleation on the existing heel.
2.2.1 Principles of ES - DMA
The combination of electrospray, an ion mobility drift cell and a macroion detector has beenused previously to determine the particle size distribution of colloidal silica [27, 28].
The unit used to transfer the sol to gas phase, by creating fine droplets of the sol containing one
12

Mobility diameter
Res
pon
se
12
Figure 2.6: An example graph showing the particle size distribution as measured by ES-DMA of twopopulations in the same sample.
particle in each droplet, is called an electrospray [28]. It is also the name of the phenomenonbehind the formation of a jet. The colloidal liquid is transported to a tip of a capillary whichacts as an electrode. The liquid is surrounded by an insulating environment of CO2 and cleanair. A plate counter electrode is placed opposing the capillary and when a voltage in a specificrange is applied the liquid takes the form of a cone extended by a jet [27]. The breakup of thejet is the source of a fine aerosol. The solvent evaporates from the particles and particles with ahigh surface charge are created. The electrospray unit also includes a neutralizer that uses a softX-ray ionizer to remove excess charge on the particles and create singly-charged ions [29].
The resulting ions and carrier gas then enter an ion mobility drift cell called a differential mobilityanalyser [29, 30]. In the middle of the cell, parallel to the trajectory of the carrier gas, is anelectrode with a narrow gap at the bottom. An electric field causes the positively charged ions tomigrate through the cell, towards the electrode. The migration speed of the particles depend onthe charge and the drag force and only those ions of the same electrical mobility will go throughthe narrow gap on the electrode [31]. The drag force depends on the diameter and shape ofthe particles. The ions can be separated by varying the force of the electric field and thus theparticles are separated by their mobility diameter.
The separated particles are counted by a condensation particle counter [29]. To make the par-ticles distinguishable by a photodetector they must grow in size. This is done by saturatingthe environment around the particles with vapour and thereafter cooling, causing the vapourto condense on the particles until the size is sufficiently large. The number of particles thatcorrespond to a specific mobility diameter are counted. Since colloidal silica particles often arespherical, the mobility diameter is approximated to be the physical diameter [32]. The numberof particles of each size can be related to the mass by the density.
13

2.3 Heat integration
The current way to view the buildup process, with all the heating occurring in the reactor jacket,implicates a case of non-adiabatic mixing when cold silicic acid enters the hot reactor. Viewingthe feed stream as a separate stream with a heating demand allows for heat integration with therest of the process [33]. The silica sol of this study is made in a semi-batch fashion, but thereare several products in AkzoNobels portfolio that are made continuously. For these products,the outlet stream from the reactor or from subsequent concentration steps operated at a hightemperature can be used to preheat the feed. For this project it is assumed that there exists ahot stream, currently cooled by cold utility, to be used for internal heat exchange.
Preheating the feed of silicic acid to the reactor with an existing process stream would lead to alower steam demand. In Sweden 2016, 13% of the total energy consumed in the chemical industryoriginated from a fossil source [34]. Decreasing the hot utility demand thus leads to reductionin CO2 emissions. The cooling water consumption also decreases when the streams of a processplant are fully integrated. A common way to cool in a process plant is by water once-throughcooling systems, where the water comes from a river, lake, canal or the sea. If the released wateris much warmer than the original source it may have an impact on the ecosystem and there mightbe strict environmental regulations regarding the maximum allowed temperature on the releasedwater [18]. The temperature of the cooling water may also be classified as a hard energy targetdue to restrictions enforced by a wastewater treatment plant with biological treatment.
With the assumption that the silicic acid stream can be integrated, the saving of steam can becalculated as:
Q = mCp∆T (2.12)
where the mass of steam is calculated as:
msteam =Q
∆Hcond(2.13)
The economical savings due to decreasing the steam demand can be calculated per tonne ofproduct as:
Saving [SEK/tonne] =Steam saving [kg/tonne]
Steam price [SEK/kg](2.14)
When assuming full integration, the heat savings correspond to an equally large cold utilitysaving. The cost of cooling water is normally much lower than the cost of steam and cantherefore be neglected.
The usage of steam in the process industry is often associated with burning of fossil fuels. TheCO2 emissions from combustion of various fossil fuels can be estimated for a choice of steamgenerator, e.g. a oil boiler.
14

mCO2 [kg/tonne] =Q [GJ/tonne]
Oil boiler efficiency·Oil CO2 emissions [kg/GJ] (2.15)
15

3 Materials and method
The project consists of two parts with emphasis on the first: i) synthesis of a sol in lab scale to finda viable preheating condition and ii) an economic evaluation of preheating in full scale.
A synthesis recipe for the studied sol is given by AkzoNobel. The laboratory equipment andprocedure is described in section 3.2. The chemicals used as start material and the product foreach synthesis is analysed with the methods described in section 3.3.
3.1 Chemicals
Sodium silicate of 5.67% SiO2 and a SiO2:Na2O-ratio of 3.3 is provided by AkzoNobel. Analkaline sol of 40.12% SiO2 to be used as heel is also provided. More information on the sodiumsilicate and the heel sol can be found in appendix A.
All syntheses except two, were performed with silicic acid taken directly from the outlet of an ionexchanger in the full scale plant. Storage of silicic acid is done in a sealed plastic container.
One batch of silicic acid was obtained from a storage tank collecting silicic acid after the ionexchange in the full scale plant, much like tank number 6 in figure 2.3. The residence time inthe storage tank is not known precisely but four hours can usually be assumed. Silicic acidfor one synthesis was produced in lab scale using a 24% SiO2 sodium silicate solution providedby AkzoNobel. The sodium silicate was diluted to 4.9% SiO2 with deionized water and passedthrough a lab scale ion exchange column.
3.2 Sol syntheses
18 syntheses were performed in lab scale. The varied parameters are indicated in table 3.1. Thetemperature is referring to the temperature in the preheating step and the number of hoursrefers to the age of the silicic acid after the ion exchange. Synthesis 2 was performed withshorter duration between the preheating and the reactor, 3.5 min instead of approximately 5min for all other experiments. After the first six syntheses had been performed it was suspectedthat the storage time of the silicic acid was an important parameter. The subsequent syntheseswere therefore focused on varying the temperature of the preheating step and the storage timeof the silicic acid. The temperature interval was chosen based on the result from the previoussyntheses. The residence time of 5 min was chosen based on the existing equipment in the fullscale plant.
16
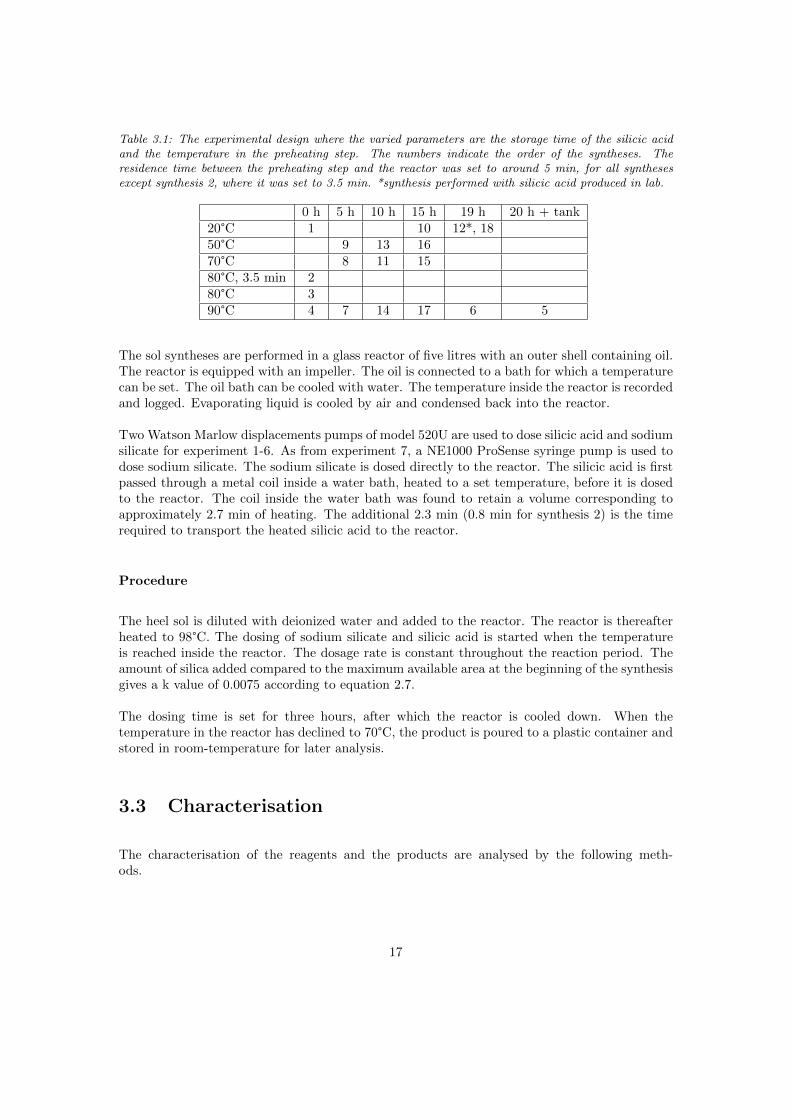
Table 3.1: The experimental design where the varied parameters are the storage time of the silicic acidand the temperature in the preheating step. The numbers indicate the order of the syntheses. Theresidence time between the preheating step and the reactor was set to around 5 min, for all synthesesexcept synthesis 2, where it was set to 3.5 min. *synthesis performed with silicic acid produced in lab.
0 h 5 h 10 h 15 h 19 h 20 h + tank20°C 1 10 12*, 1850°C 9 13 1670°C 8 11 1580°C, 3.5 min 280°C 390°C 4 7 14 17 6 5
The sol syntheses are performed in a glass reactor of five litres with an outer shell containing oil.The reactor is equipped with an impeller. The oil is connected to a bath for which a temperaturecan be set. The oil bath can be cooled with water. The temperature inside the reactor is recordedand logged. Evaporating liquid is cooled by air and condensed back into the reactor.
Two Watson Marlow displacements pumps of model 520U are used to dose silicic acid and sodiumsilicate for experiment 1-6. As from experiment 7, a NE1000 ProSense syringe pump is used todose sodium silicate. The sodium silicate is dosed directly to the reactor. The silicic acid is firstpassed through a metal coil inside a water bath, heated to a set temperature, before it is dosedto the reactor. The coil inside the water bath was found to retain a volume corresponding toapproximately 2.7 min of heating. The additional 2.3 min (0.8 min for synthesis 2) is the timerequired to transport the heated silicic acid to the reactor.
Procedure
The heel sol is diluted with deionized water and added to the reactor. The reactor is thereafterheated to 98°C. The dosing of sodium silicate and silicic acid is started when the temperatureis reached inside the reactor. The dosage rate is constant throughout the reaction period. Theamount of silica added compared to the maximum available area at the beginning of the synthesisgives a k value of 0.0075 according to equation 2.7.
The dosing time is set for three hours, after which the reactor is cooled down. When thetemperature in the reactor has declined to 70°C, the product is poured to a plastic container andstored in room-temperature for later analysis.
3.3 Characterisation
The characterisation of the reagents and the products are analysed by the following meth-ods.
17

3.3.1 Chemical and physical characterisation
Density
The density of the liquids used are measured with a Anton Paar DMA series density meter. Thetemperature is adjusted to 20°C by the instrument.
A relation between the SiO2 content of a certain sol and its density has been found empirically,and is reported by AkzoNobel in available tables.
Vaccum filtration
Filtration is done through a membrane filter. A negative pressure is maintained by a vacuumpump. The volume of the filtrate is measured after an appropriate time and can be comparedto other samples.
Turbidity
A Hach 2100P ISO turbidimeter is used to measure the turbidity in NTU of the samples.
The analysis of experiment 11 and onward was performed with a different turbidimeter of thesame brand.
Viscosity
The viscosity of the liquids are measured with a Brookfield model DV-II+ viscometer with a ULadapter. The temperature of the sample is adjusted to 20°C with the help of a water bath.
pH
A Metrohm 913 digital pH meter with a glass electrode is used to measure the pH of the solu-tions.
Conductivity
The conductivity of the sample is measured with a WTW Cond 330i/3110 portable conductivitymeter.
18

3.3.2 Particle characterisation
Specific surface area
The specific surface area (SSA) is measured by the Sears method as described in section 2.2 usingTiamo titration devices from Mehtrohm, including software. A sample size containing 1.5 g ofSiO2 is diluted with 100 g of deionized water. The pH is adjusted to 2-3. 30 g NaCl is added anddissolved while stirring. Titration is done with 0.1 M NaOH and the surface area is calculatedfrom the volume of NaOH added to the sample.
The Sears method is not an appropriate method to measure the specific surface area of particlesin silicic acid since silicic acid does not only contain small silica particles, but also monomericsilica [4].
ES-DMA
An electrospray differential mobility analyser with software, model 3982 MacroIMS System fromTSI, is used to measure the particle size distribution. For most samples a 20mM (pH 8) ammo-nium acetate buffer is mixed with 4 µl of the sample, resulting in a solution of approximately400 ppm SiO2. The dilution is important to avoid that two or more particles occur in the samedroplet [27].
The resulting number weighted particle size distributions are used to estimate the bimodalityaccording to equation 2.11. The mass weighted particle size distributions are calculated by usinga density of 2.21 g/cm3.
TEM
Three samples (synthesis 9,11 and 17) were selected to be analysed by transmission electronmicroscopy (TEM). The analysis was performed by and at Glantreo, Cork.
3.3.3 Correlation and ANOVA
The correlation coefficient of two parameters as measured by one of the above methods can becalculated as:
r =
∑ni=1(xi − x)(yi − y)√∑n
i=1(xi − x)2√∑n
i=1(yi − y)2(3.1)
The experiments in table 3.1 are mostly done by changing two parameters: the storage time andthe temperature of the preheating step. A smaller, complete design is found in table 3.2 and can
19

be used to determine if there exists interaction effects between the parameters. A test developedby Turkey for two factors and one degree of freedom can be used for this purpose, described in[35]. The hypothesis is that effect of interaction is not significant. This can be tested with thehelp of a analysis of variance (ANOVA) table and F-test.
Table 3.2: A smaller part of the experimental design in table 3.1 without missing experiments. Thenumbers indicate the order of the synthesis.
5 h 10 h 15 h50°C 9 13 1670°C 8 11 1590°C 7 14 17
3.4 Economic and environmental evaluation
The numbers needed for a economic and environmental evaluation can be found in table 3.3.The mass of silicic acid to produce 1 tonne of concentrated sol is calculated based on the labrecipe. The Cp value is assumed to be the same as water since the stream only contains around5% silicic acid. The heat of condensation of the steam is taken at atmospheric pressure. Thesteam price is based on a rough estimate from AkzoNobel.
The steam is assumed to be generated with an oil boiler. The efficiency of the oil boiler is anestimation. The CO2 emissions associated with the production, distribution and combustion ofheavy fuel oil is taken from the literature.
Table 3.3: Variables used in the steam saving calculations.
Cp 4 kJ/kg [36]∆Hcond 2257 kJ/kg [36]Mass of silicic acid 6700 kg/tonne productSteam price 0.26 SEK/kg steamOil boiler efficiency 0.85Oil CO2 emissions 76 kg/GJ [37]
20

4 Results
The result from the analysis of the silicic acid and the syntheses products are displayed in thefollowing sections. The result of the steam saving calculations is found in section 4.3.
4.1 Analysis of silicic acid
A new batch of silicic acid was used for each synthesis. The result from chemical and physicalcharacterisation can be found in table 4.1. The density, SiO2 content, pH and conductivity ofeach sample all fall in a relatively narrow window. The only exception is the lab made silicic acidof synthesis 12, aged 19 h, which has a different conductivity compared to the other batches.The filter value is varying but no clear trend has been found. The turbidity and viscosity arethe characteristics most closely related to the particle size in the silicic acid. The trend of theturbidity and viscosity related to the age of the silicic acid is shown in the next section.
Table 4.1: The result of the chemical and physical characterisation of the silicic acid. The maximumand minimum show the range of the value the parameters have taken, excluding synthesis 12, which wasperformed on lab made silicic acid. The result table for all batches can be found in appendix A.
Max. Min. Median Synth. 12Density (g/cm3) 1.0333 1.0262 1.0319 1.0261SiO2 content (%) 5.80 4.66 5.57 4.64pH 2.77 2.56 2.70 2.84Conductivity (µS/cm) 891 752 811 422Turbidity (NTU) 1.46 0.57 1.00 0.86Viscosity (cP) 1.80 1.35 1.45 1.45Filter value (ml) 615 204 433 600
4.1.1 Effect of ageing on silicic acid
The analysis of the silicic acid was always performed shortly before or after the synthesis wasstarted and thus the age of silicic acid during analysis can be approximated to the same age asthe synthesis.
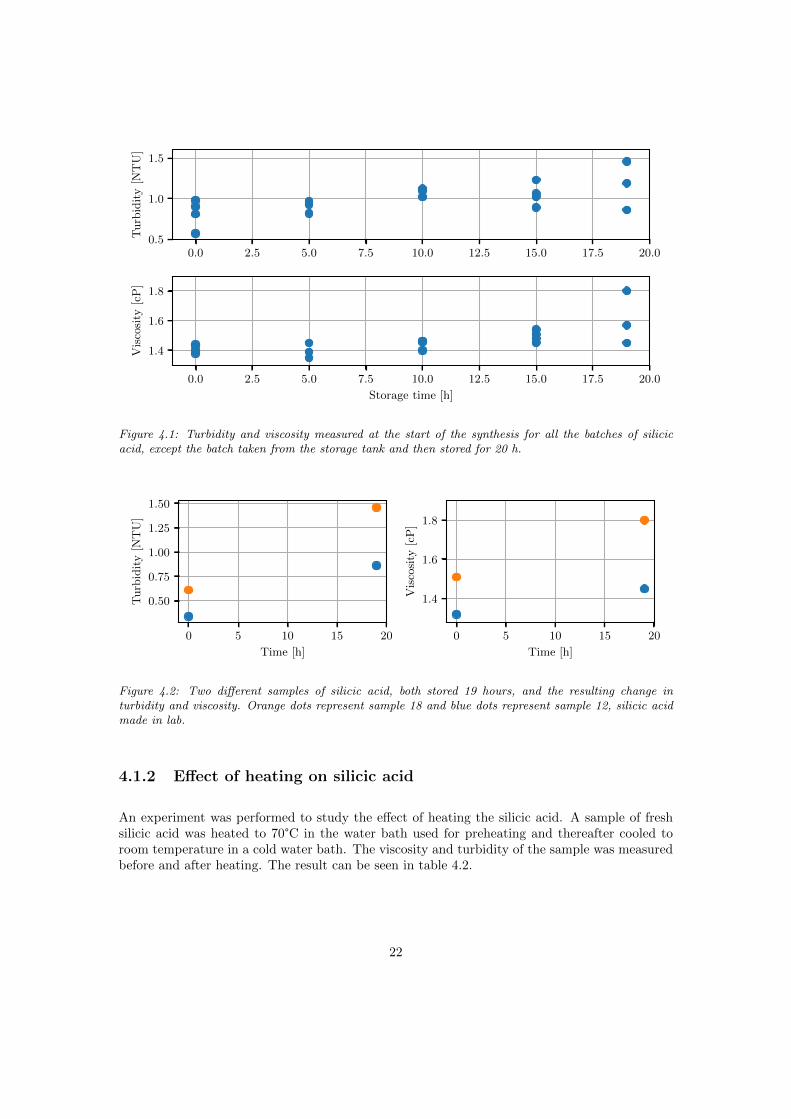
As can be seen in figure 4.1 there is a slight trend of higher turbidity and viscosity as the silicicacid is aged. The correlation coefficient is 0.69 and 0.63 for the aged time versus turbidity andviscosity respectively. Other properties of the silicic acid varying from batch to batch, such asthe SiO2 content and the conductivity, may cause variations in the ageing behaviour. Figure 4.2compares the silicic acid from the same batch, when fresh and after ageing.
21
0.0 2.5 5.0 7.5 10.0 12.5 15.0 17.5 20.00.5
1.0
1.5
Tu
rbid
ity
[NT
U]
0.0 2.5 5.0 7.5 10.0 12.5 15.0 17.5 20.0
Storage time [h]
1.4
1.6
1.8
Vis
cosi
ty[c
P]
Figure 4.1: Turbidity and viscosity measured at the start of the synthesis for all the batches of silicicacid, except the batch taken from the storage tank and then stored for 20 h.
0 5 10 15 20
Time [h]
0.50
0.75
1.00
1.25
1.50
Tu
rbid
ity
[NT
U]
0 5 10 15 20
Time [h]
1.4
1.6
1.8
Vis
cosi
ty[c
P]
Figure 4.2: Two different samples of silicic acid, both stored 19 hours, and the resulting change inturbidity and viscosity. Orange dots represent sample 18 and blue dots represent sample 12, silicic acidmade in lab.
4.1.2 Effect of heating on silicic acid
An experiment was performed to study the effect of heating the silicic acid. A sample of freshsilicic acid was heated to 70°C in the water bath used for preheating and thereafter cooled toroom temperature in a cold water bath. The viscosity and turbidity of the sample was measuredbefore and after heating. The result can be seen in table 4.2.
22

Table 4.2: Comparison of the turbidity and viscosity of silicic acid before and after being heated to 70°C.
Before AfterTurbidity (NTU) 0.61 0.64Viscosity (cP) 1.51 1.50
4.2 Sol synthesis product
Once cooled, the product was analysed by the methods described in section 3.3. The main resultis presented in table 4.3. The sol produced with lab made silicic acid does not seem to varysubstantially from the other sols, but the conductivity is at the minimum value.
The density of the synthesis product closely follows the density of the silicic acid. There areno other clear trends relating the properties of the silicic acid to the final properties of theproduct.
Table 4.3: The result of the characterisation of the synthesis product. The result table for all batches canbe found in appendix A.
Max. Min. MedianDensity (g/cm3) 1.0318 1.0258 1.0307SiO2 content (%) 5.83 4.82 5.65pH 9.96 9.45 9.77Conductivity (µS/cm) 546 365 507Turbidity (NTU) 107 63.5 71Viscosity (cP) 1.47 1.26 1.29Filter value (ml) 128 <15 69SSA (m2/g) 152.3 122.2 133.0
4.2.1 Particle size measurements
The particle size distribution without preheating or ageing (synthesis 1) and subsequent experi-ments with mild enough conditions result in a uniform particle size distribution as in figure 4.3.The scale of the x-axis is the same as for all following electrospray graphs. The largest amount ofnew particle formation is found when heating silicic acid, aged ≥19 hours, to 90°C. The particlesize distribution of such a sol can be seen in figure 4.4. To be noted is that the distributions infigure 4.3-4.4 are based on the number weighted diameter. The first peak in figure 4.4 is muchsmaller when looking at the mass weighted diameter in figure 4.5.
23

Mobility diameter [nm]
0.0
0.2
0.4
0.6
0.8
1.0
Res
pon
se
1: t=0, T=20
2: t=0, T=80
8: t=5, T=70
9: t=5, T=50
Figure 4.3: The number weighted particle size distribution as measured with ES-DMA. The samples ofsynthesised sol from experiment 1, 2, 8 and 9 do not show any sign of bimodality. The silicic acid forthe experiment had been stored 0 or 5 hours, and heated to temperatures between 20 and 80°C.
Mobility diameter [nm]
0.0
0.2
0.4
0.6
0.8
1.0
Res
pon
se
5: t=20+, T=90
6: t=19, T=90
Figure 4.4: The number weighted particle size distribution as measured with ES-DMA for synthesesproduct 5 and 6. The silicic acid for experiment 5 was taken from a storage tank and thereafter storedfor 20 hours. The silicic acid for experiment 6 was taken directly from an ion exchanger and stored for19 hours. Both samples were preheated to 90°C.
24
Mobility diameter [nm]
0.0
0.2
0.4
0.6
0.8
1.0
Res
pon
se
5: t=20+, T=90
6: t=19, T=90
Figure 4.5: The mass weighted particle size distribution as measured with ES-DMA for syntheses product5 and 6. The number weighted particle size distribution for the same samples is shown in figure 4.4.
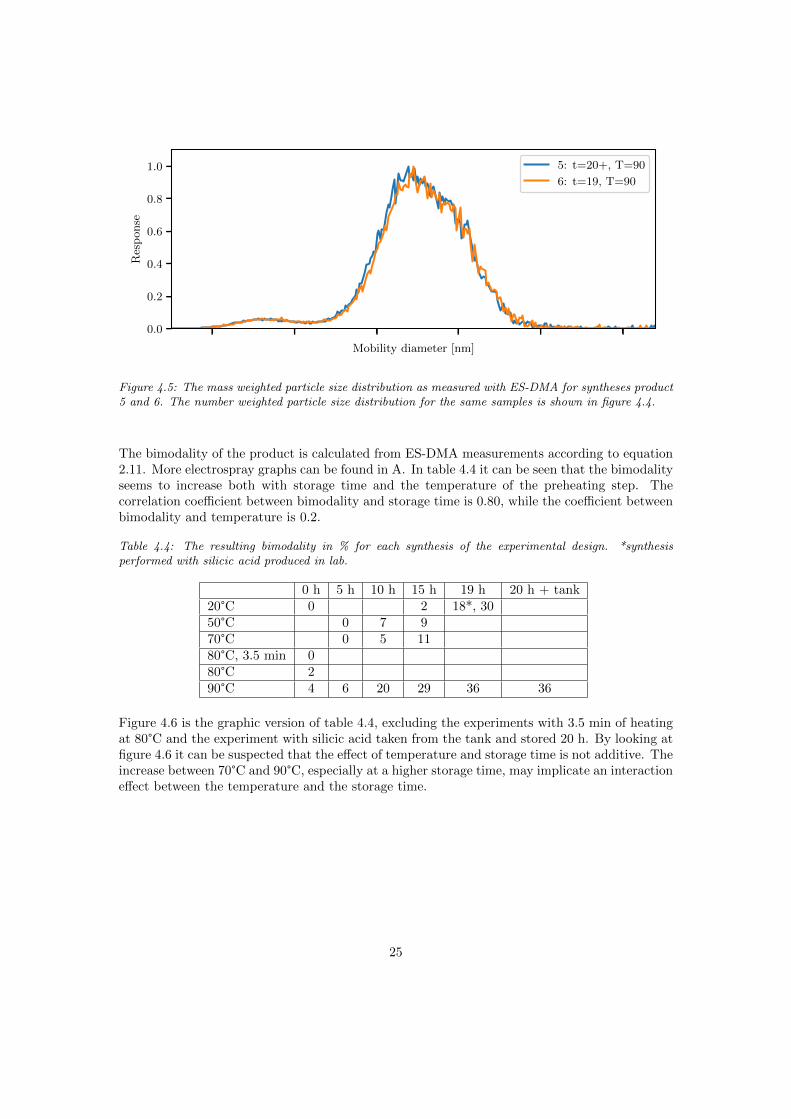
The bimodality of the product is calculated from ES-DMA measurements according to equation2.11. More electrospray graphs can be found in A. In table 4.4 it can be seen that the bimodalityseems to increase both with storage time and the temperature of the preheating step. Thecorrelation coefficient between bimodality and storage time is 0.80, while the coefficient betweenbimodality and temperature is 0.2.
Table 4.4: The resulting bimodality in % for each synthesis of the experimental design. *synthesisperformed with silicic acid produced in lab.
0 h 5 h 10 h 15 h 19 h 20 h + tank20°C 0 2 18*, 3050°C 0 7 970°C 0 5 1180°C, 3.5 min 080°C 290°C 4 6 20 29 36 36
Figure 4.6 is the graphic version of table 4.4, excluding the experiments with 3.5 min of heatingat 80°C and the experiment with silicic acid taken from the tank and stored 20 h. By looking atfigure 4.6 it can be suspected that the effect of temperature and storage time is not additive. Theincrease between 70°C and 90°C, especially at a higher storage time, may implicate an interactioneffect between the temperature and the storage time.
25

0 20 40 60 80
Temperature [◦C]
0
10
20
30
40
Bim
od
ali
ty[%
]
0 h
5 h
10 h
15 h
19 h
Figure 4.6: 16 of the experiments and the resulting bimodality in %. The experiment with a differentheating duration and the experiment with silicic acid taken from the tank are excluded.
The result in table 4.5 are used to follow the procedure of Turkeys test of interaction effectsbetween the factors. To investigate the hypothesis that the interaction effect is not significant,the test statistic for interaction F0=42.8 is compared with Fα,1,3. Using α=0.05, F0.05,1,3=10.13.42.8 >10.1 and thus the hypothesis must be rejected. The complete ANOVA table for thecalculation of the interaction effect can be found in appendix A.
Table 4.5: The resulting bimodality in % for nine samples with varying values of temperature and storagetime.
5 h 10 h 15 h50°C 0 7 970°C 0 5 1190°C 6 20 29
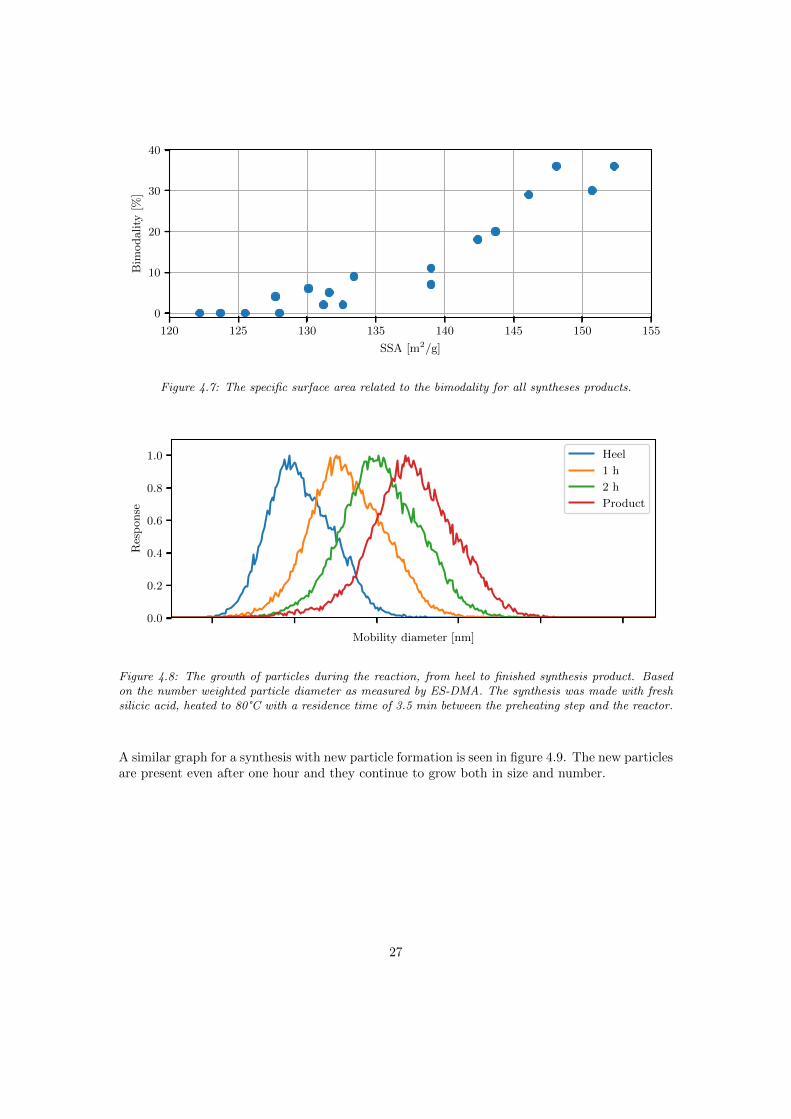
The specific surface area of the product seems to be correlated to the bimodality as can be seenin figure 4.7. The correlation coefficient between the parameters is 0.94. No other property ofthe product seems to follow the change in particle size distribution.
During synthesis 2, for which fresh silicic acid was heated to 80°C for 3.5 min, a sample was takenonce an hour to follow the particle growth of the particles. The result from the electrospray isshown in figure 4.8 together with the particle size distribution of the heel sol.
26
120 125 130 135 140 145 150 155
SSA [m2/g]
0
10
20
30
40
Bim
od
ali
ty[%
]
Figure 4.7: The specific surface area related to the bimodality for all syntheses products.
Mobility diameter [nm]
0.0
0.2
0.4
0.6
0.8
1.0
Res
pon
se
Heel
1 h
2 h
Product
Figure 4.8: The growth of particles during the reaction, from heel to finished synthesis product. Basedon the number weighted particle diameter as measured by ES-DMA. The synthesis was made with freshsilicic acid, heated to 80°C with a residence time of 3.5 min between the preheating step and the reactor.
A similar graph for a synthesis with new particle formation is seen in figure 4.9. The new particlesare present even after one hour and they continue to grow both in size and number.
27

Mobility diameter [nm]
0.0
0.2
0.4
0.6
0.8
1.0
Res
pon
se
1 h
2 h
3 h
Figure 4.9: The growth of particles during synthesis 5. The silicic acid had been taken from the storagetank and stored 20 hours. The preheating temperature was set at 90°C. Based on the number weightedparticle diameter.
TEM
Three samples of synthesis product of different bimodality were chosen for TEM analysis. Forsynthesis 9, in figure 4.10, the calculated bimodality is 0%. The silica sol particles seem to bespherical and non-aggregated.
Figure 4.10: TEM of sample 9: t=5 h, T=50°C.
For synthesis 11, in figure 4.11, the calculated bimodality is 5%. There seem to be some smallerparticles present.
28

Figure 4.11: TEM of sample 11: t=10 h, T=70°C.
For synthesis 17, in figure 4.12, the calculated bimodality is 29%. Again there seem to be somesmaller particles present both in the solution and between the larger particles in the aggre-gates.
Figure 4.12: TEM of sample 17: t=15 h, T=90°C.
29

4.3 Saving of steam
Using the values in table 3.3, the heat demand to preheat silicic acid from 20°C to three differ-ent temperatures for one tonne of product is calculated according to equation 2.12. The heatcorresponds to the saved steam demand according to equation 2.13. The result is shown intable 4.6.
Table 4.6: The economic benefit of preheating silicic acid and decreasing the steam demand for threedifferent preheating temperatures.
50°C 70°C 90°CQ [kJ/tonne] 804 000 1340 000 1876 000msteam [kg/tonne] 356 594 831Saving [SEK/tonne] 93 154 216
The steam is assumed to be produced in an oil boiler. The decrease in CO2 emissions associatedwith the decrease in steam demand for one tonne of product is presented in table 4.7.
Table 4.7: The reduction in CO2 emissions when preheating silicic acid and decreasing the steam demandfor three different preheating temperatures.
50°C 70°C 90°CQ [GJ/tonne] 0.80 1.34 1.88Qoil [GJ/tonne] 0.95 1.58 2.20mCO2
[kg/tonne] 72 120 168
30

5 Discussion
The effects of the variation within the silicic acid, the procedure and the syntheses products willbe discussed in the following sections.
5.1 Silicic acid
The silicic acid is from a new batch for each synthesis run and it is the main reactant by mass. Itis probable that some variations in the product can be explained by variations in the silicic acid.The factory-made silicic acid is taken both on different days and from different ion exchange unitswhich is causing the variations in density, SiO2 content, pH and conductivity. The variations inturbidity and viscosity can also be somewhat explained by variations in the batches, but as shownin figure 4.1, there seems to be a slight correlation between a higher viscosity/turbidity and thestorage time. It is known that the silicic acid will start to polymerize at room temperature whenstored. Larger and larger particles are formed as a result. The scattering of light by particles inthe solution depends greatly on the particle size, and as such it is expected that the turbidityincreases when the particle size increases. When the particles have begun to aggregate it is alsoexpected that the viscosity increases. However, the measured changes in viscosity and turbidityare still small compared to a batch of silicic acid close to gelling, as described in section 2.1.2. Theviscosity and turbidity measurement is probably not accurate enough to predict the behaviourof the silicic acid in the synthesis.
When the particle size increases, or when the particles in the silicic acid has had time to aggregate,the filter value should decrease due to clogging of the filter. This does not seem to be the case.Even aged silicic acid reaches filter values of 600 ml, and the minimum value of 204 ml in table4.1 is found for a fresh batch of silicic acid. One explanation for this could be that the particlesize still is very small in the silicic acid, so that the filter value measurement is not accurateenough in this regard. When the filter value is as low as around 200 ml, it is probably due tosome changes in the plant.
5.1.1 Silicic acid prepared in lab
The silicic acid made in lab scale has several differences with the one made in plant scale. Themost obvious one is the conductivity. Dilution of the sodium silicate in the lab was done withdeionized water. Deionized water was also used to flush the ion exchange column. In plant scale,process water is often used for both applications. The process water probably contains more ions.The silica content is also lower than usual. Water was used both before and after sodium silicatewas added to the column and the resulting silicic acid was diluted with said water due to lack ofexact measurement equipment. However, the sol produced with the silicic acid from the lab is
31

not significantly different from the other sols in table 4.3. This may indicate that the propertiesof the silicic acid are not completely related to the properties of the synthesis product. The labscale sample of silicic acid is one of the samples in figure 4.2. Both samples have increased inviscosity and turbidity, indicating the same behaviour regardless of preparation method.
5.1.2 Heating of silicic acid
It is expected that heating the silicic acid also promotes the polymerization. The test thatwas performed on fresh silicic acid at 70°C, with the result in table 4.2, does not show anymeasurable difference on the silicic acid after heating. This test does not however represent asynthesis performed at 70°C without storage time since the reaction time is set at three hour,thus making the silicic acid in the synthesis older at the end of the synthesis. Based on theanalysis of the synthesis product, 70°C is not enough heating to affect a fresh batch of silicicacid.
5.2 Sol syntheses
The sol syntheses were performed according to plan. The temperature of 98°C was held duringall syntheses. The recipe was built based on the addition of silica in grams and the rate hadto be adjusted to account for the different concentrations of the silicic acid. The different ratescorresponds to a different residence time in the preheating step, which was not accounted forsince the change was deemed too small.
One confirmation that the produced sol is the same as the desired is that the analysed parametersin table 4.3 are quite consistent throughout all syntheses. The SiO2 content is at the expectedlevel considering the amount of added silica as both heel and feed.
The filter value is varying significantly between the products, but there is no clear trend relatingthe filter value to the age of the silicic acid or the preheating temperature. The low filter valueis believed to correlate to a high amount of microgel in the sample. The gel could originatefrom regions in the reactor with poor mixing where the pH has been too low. Changing thedosage pump of the sodium silicate to a syringe pump before synthesis 7 was done to lessen theseeffects by forcing the dosing points further apart. The filter value was thereafter improved fromthe lowest values of <15. But the filter value of the synthesis product is still not comparableto the filter value of a commercial product (the heel filter value is 300 ml, see appendix A).Perhaps this is caused by the preheating equipment such as the coil or the hose. These wereused for all samples, even at 20°C. Apart from the preheating step, there are also several otherdifferences between the equipment in lab scale and in commercial scale that might be part of theexplanation.
32

5.2.1 Particle size distribution
As seen in figure 4.3 all the sols without noticeable bimodality has reached the same mobilitydiameter, which indicates that the process conditions have been similar enough to create the samesol. For the sols in 4.3 it can be assumed that they have grown the same way as the synthesisproduct 2, shown in figure 4.8. With no second peak it can be assumed that the particles havegrown ideally, without any new particle nucleation, even though the k-value is slightly higherthan proposed by the citations in section 2.1.3, meaning that the addition of silicic acid is toohigh compared to the available surface area. The cited maximum k-value is reported for differentconditions and it is probable that the value of 0.0075 is within the acceptable range for theconditions of the chosen synthesis.
When looking at the values in table 4.4 it is suspected that the temperature of the preheatingstep and the storage time is affecting the particle size distribution. The linear correlation is muchstronger between the storage time and the bimodality than between the temperature and thebimodality. However, these values are limited by the chosen experiments. In figure 4.6 it can beseen that the slope of the line increases as the temperature increases from 70°C to 90°C. Overall,the growth of new particles does not seem to be linear. This suspicion is strengthened by theinteraction test performed on the nine values in table 4.5. The preheating temperature seems tohave a greater effect to aged silicic acid. Since the factors are interacting and no repeats weremade of the experiments in table 4.5 it is difficult to test the effects of the preheating temperatureor storage temperature alone.
The same mechanism is thought to occur in the silicic acid both while preheating and storing:polymerization according to reaction 2.2-2.3. It is probable that when the condensation hascaused larger particles to form in the silicic acid it will affect the buildup process. The largerparticles are not as soluble as the monomer and they can also act as nuclei, competing with theheel particles for the addition of new silica. As shown in figure 4.9, during the synthesis the newparticles grow in size due to addition of silica.
The specific surface area and the bimodality are highly positively correlated, see figure 4.7. Thisis expected since smaller particles have a higher SSA, and a bimodality in this project is causedby a second population of smaller particles.
The interpretation of the electrospray measurement can be different depending on which diameteris compared: the number weighted mean diameter or the mass weighted mean diameter. Thedifference is depicted in figure 4.4 and 4.5. Larger particles will contribute more to the totalmass and thus the smaller peak becomes even smaller in figure 4.5. The graphs picturing thenumber weighted diameters are chosen for this project to study the peak of smaller particles inmore detail.
The bimodality estimation is based on an imprecise integration. Furthermore, the electrospraymeasurement is only performed on a small sample. The sample may not represent the totalvolume. The numbers should therefore be treated with caution. This can explain the seeminglystrange result in table 4.4, where the 10 h sample is more bimodal after preheating to 50°C thanafter 70°C.
A storage time of 15 h is much longer than the expected storage time in a full scale plant. A
33

maximum of 5 h storage time is more realistic. A high preheating temperature does not seem tohave great effect on the synthesis product after it has been stored 5 h.
Definition of adverse effects
When the change in particle size distribution should be considered a problem is not easily an-swered. It would depend on the application for the silica sol.
Two of the pictures from the TEM analysis, figures 4.11-4.12, reaffirms that there exists smallerparticles in the samples. The fact that some smaller particles are visible in the TEM analysiseven though the bimodality is only estimated to 5% for synthesis 11 could be used to claimthat the conditions of 10 h and 70°C has affected the particle size distribution enough to causeproblems for some customers.
5.3 Saving of steam
Based on the calculated steam saving, tables 4.6-4.7, it it difficult to say whether the preheatingof silicic acid is worth the investment cost required to install an internal heat exchanger. Fromthe relatively low savings in SEK/tonne it can be suspected that the savings of steam alone arenot a sufficiently large economical incentive to give grounds for a redesign of the process.
There might be other advantages to preheating that are not directly related to the cost of steam.A higher degree of heat integration decreases both the steam demand and the cooling demand.For older plants, especially on shared sites, the ability to expand the utility systems may begreatly limited. An extension on another process that increases the utility demand could becompensated by a setup that decreases the utility demand somewhere else, such as preheatingof silicic acid in the silica sol production.
The reactor is not the only unit operation with an energy requirement, but most of the energyconsumed can be assumed to be related to the reactor step or the concentration step. Thecalculated decrease in CO2 emissions is based on the assumption that the steam is generated inan oil boiler, which is probably not true on many sites.
The decrease in CO2 emissions related to the reactor step is probably substantial, but the effecton the process as a whole is unknown. As shown in reaction 2.1, CO2 is also released in theproduction of sodium silicate.
5.4 Future studies
The particle size distribution of the silica sol seems to be affected by the age and preheatingtemperature. Both the age and preheating temperature can be related to the degree of poly-merization in the silicic acid. Perhaps it would be interesting to investigate if the particle size
34

distribution in the silicic acid can be related to the particle size distribution of the sol synthesisproduct. With some preparations, including change of buffer, the particle size distribution insilicic acid of different ages and after preheating may be possible to study in the ES-DMA.
In some instances a bimodal particle size distribution may even be advantageous and preheatingthe silicic acid may be a way to create a silicic sol of controlled particle size distribution. Themeasurements in this study would have to be repeated to give a value of the reproducibility. Thereason behind the low filter values would also have to be explored.
There might be ways to lessen the effect of preheating by changing the recipe of production,perhaps by increasing the salt concentration. It should also be noted that the result may differin laboratory scale and pilot or plant scale.
35

6 Conclusion
Preheating of silicic acid at a sufficiently high temperature, or storing of the silicic acid beforereaction for an adequate number of hours, will result in a change in the particle size distributionof the synthesised silica sol. The polymerisation will not be ideal and new particles will forminstead of silica depositing on the heel particles. A high preheating temperature has a largereffect on the synthesis if the silicic acid has been stored for 10 hours or more.
What is a sufficiently high temperature and an adequate number of hours to induce a substantialeffect will have to be evaluated in each case since it depends on the application of the sol.
Out of the tested storage times, 5 hours is probably the most likely storage time in a commercialplant. With the assumption that the silicic acid is stored for 10 hours, a preheating temperatureof 70°C will only cause a small new particle formation. The new particles make up 5% of thetotal number of particles.
The experiments would have to be repeated to acquire knowledge of the sources of variation.The silicic acid is varying from batch to batch which might affect the synthesis product.
If an internal heat exchanger is installed in the full scale plant and the heat is exchanged withan existing hot stream, a preheating temperature of 70°C would result in a steam saving costof 154 SEK/tonne product. 120 kg less CO2 per tonne product would be released under theassumptions in the project.
36
Bibliography
[1] W. O. Roberts, in Colloidal silica: fundamentals and applications, H. E. Bergna and W. O.Roberts, Eds. CRC press, 2005, vol. 131, ch. Manufacturing and Applications of Water-Borne Colloidal Silica.
[2] AkzoNobel. (2018). Levasil colloidal silica, [Online]. Available: https://colloidalsilica.akzonobel.com/about/sustainability/. (accessed: 2018-03-06).
[3] R. K. Iler, The Chemistry of Silica - Solubility, Polymerization, Colloid and Surface Prop-erties and Biochemistry. John Wiley & Sons, 1979, isbn: 978-0-471-02404-0.
[4] J.-E. Otterstedt and D. A. Brandreth, Small particles technology. Springer Science & Busi-ness Media, 1998.
[5] C. C. Payne, in Colloidal silica: fundamentals and applications, H. E. Bergna and W. O.Roberts, Eds. CRC press, 2005, vol. 131, ch. Applications of Colloidal Silica: Past, Present,and Future.
[6] B. Schwerin, Manufacture of chemically-pure soluble silicic acid. US Patent 1,132,394, Mar.1915.
[7] O. W. Florke, H. A. Graetsch, F. Brunk, L. Benda, S. Paschen, H. E. Bergna, W. O.Roberts, W. A. Welsh, D. M. Chapman, M. Ettlinger, et al., “Silica,” in Ullmann’s En-cyclopedia of Industrial Chemistry, Wiley Online Library, 2008. doi: 10.1002/14356007.a23_583.pub3.
[8] M. Dubois and B. Cabane, “Polymerization of silicic acid in a collapsed lamellar phase,”Langmuir, vol. 10, no. 5, pp. 1615–1617, 1994.
[9] J. Worstell, Batch and Semi-batch Reactors: Practical Guides in Chemical Engineering.Butterworth-Heinemann, 2015, isbn: 978-0-12-801305-2.
[10] H. E. Bergna, in Colloidal silica: fundamentals and applications, H. E. Bergna and W. O.Roberts, Eds. CRC press, 2005, vol. 131, ch. Colloid Chemistry of Silica: An Overview.
[11] H. E. Bergna and W. O. Roberts, Colloidal silica: fundamentals and applications. CRCPress, 2005, vol. 131.
[12] D. Everett, “Manual of symbols and terminology for physicochemical quantities and units,appendix ii: Definitions, terminology and symbols in colloid and surface chemistry,” Pureand Applied Chemistry, vol. 31, no. 4, pp. 577–638, 1972.
[13] H. E. Bergna, in Colloidal silica: fundamentals and applications, H. E. Bergna and W. O.Roberts, Eds. CRC press, 2005, vol. 131, ch. The Language of Colloid Science and SilicaChemistry.
[14] A. Yoshida, in Colloidal silica: fundamentals and applications, H. E. Bergna and W. O.Roberts, Eds. CRC press, 2005, vol. 131, ch. Silica Nucleation, Polymerization, and GrowthPreparation of Monodispersed Sols.
[15] P. H. Mcnally and N. W. Rosenberg, Process for producing a stable silica sol, US Patent3,113,112, Dec. 1963.
37

[16] P. G. Bird, Colloidal solutions of inorganic oxides, US Patent 2,244,325, Jun. 1941.
[17] K. Dorfner, Ion exchangers. Walter de Gruyter, 1991.
[18] R. Smith, Chemical process: design and integration. John Wiley & Sons, 2005.
[19] H. E. Bergna, in Colloidal silica: fundamentals and applications, H. E. Bergna and W. O.Roberts, Eds. CRC press, 2005, vol. 131, ch. Silicic Acids and Colloidal Silica.
[20] J. Depasse and A. Watillon, “The stability of amorphous colloidal silica,” Journal of Colloidand Interface Science, vol. 33, no. 3, pp. 430–438, 1970.
[21] J.-E. Otterstedt and P. Greenwood, in Colloidal silica: fundamentals and applications, H. E.Bergna and W. O. Roberts, Eds. CRC press, 2005, vol. 131, ch. Some Important, FairlyNew Uses of Colloidal Silica/Silica Sol.
[22] P. Greenwood, “Surface modifications and applications of aqueous silica sols,” PhD thesis,Chalmers University of Technology, 2010.
[23] M. F. Bechtold and O. E. Snyder, Chemical processes and composition, US Patent 2,574,902,Nov. 1951.
[24] W. L. Albrecht, Method of preparing silica sols containing large particle size silica, USPatent 3,673,104, Jun. 1972.
[25] J. L. Bass, in Colloidal silica: fundamentals and applications, H. E. Bergna and W. O.Roberts, Eds. CRC press, 2005, vol. 131, ch. Particle Size and Characterization Techniques.
[26] G. W. Sears, “Determination of specific surface area of colloidal silica by titration withsodium hydroxide,” Analytical Chemistry, vol. 28, no. 12, pp. 1981–1983, 1956.
[27] A.-C. Johnsson, “On the electrolyte induced aggregation of concentrated silica dispersions-an experimental investigation using the electrospray technique,” PhD thesis, University ofGothenburg, 2011.
[28] I. W. Lenggoro, B. Xia, K. Okuyama, and J. F. de la Mora, “Sizing of colloidal nanoparticlesby electrospray and differential mobility analyzer methods,” Langmuir, vol. 18, no. 12,pp. 4584–4591, 2002.
[29] Macroims macroion mobility spectrometer model 3982 user guide, A, TSI Incorporated,Oct. 2014.
[30] P. Kulkarni, P. A. Baron, and K. Willeke, Aerosol measurement: principles, techniques,and applications. John Wiley & Sons, 2011.
[31] D. K. Song, I. W. Lenggoro, Y. Hayashi, K. Okuyama, and S. S. Kim, “Changes in theshape and mobility of colloidal gold nanorods with electrospray and differential mobilityanalyzer methods,” Langmuir, vol. 21, no. 23, pp. 10 375–10 382, 2005.
[32] P. F. DeCarlo, J. G. Slowik, D. R. Worsnop, P. Davidovits, and J. L. Jimenez, “Particlemorphology and density characterization by combined mobility and aerodynamic diametermeasurements. part 1: Theory,” Aerosol Science and Technology, vol. 38, no. 12, pp. 1185–1205, 2004.
[33] I. C. Kemp, Pinch analysis and process integration: a user guide on process integration forthe efficient use of energy. Elsevier, 2011.
[34] Energimyndiheten. (2018). Energilaget i siffror 2018 (excel), [Online]. Available: http:
//www.energimyndigheten.se/statistik/energilaget/?currentTab=1#mainheading.(accessed: 2018-05-08).
[35] D. C. Montgomery, Design and analysis of experiments. John Wiley & Sons, 2013.
38

[36] S.-E. Mortstedt and G. Hellsten, Data och diagram: Energi-och kemitekniska tabeller. LiberAB, 2012.
[37] S. Papadokonstantakis, KVM013 Industrial Energy Systems course compendium. Divisionof Energy Technology, Department of Space, Earth and Environment, Chalmers Universityof Technology, 2017.
39

Acknowledgements
I would like to thank all the people at the Colloidal Silica RD&I department of AkzoNobelSpecialty Chemicals in Bohus for being very welcoming and helpful in answering questions.In particular Magnus Hagstrom and Hanna Andersson for all the help with the particle sizemeasurements and Andreas Sundblom for taking the time to read through and give feedback tothe theory of my thesis.
I would like to thank the operating staff in the silica sol plant in Bohus, for all the help withcollecting samples of silicic acid, especially at the inconvenient hours of the day.
I would also like to thank my examiner for this thesis, Derek Creaser, for his comments andfeedback.
I would like to direct a special thanks to my supervisor at AkzoNobel, Anders Josefsson, for allhis support, feedback and great ideas!
40

A Figures and tables
A.1 Sodium silicate and heel
Characterisation of the starting material was performed to confirm the quality. The result of theanalysis for the sodium silicate and the alkaline sol used as heel can be found in table A.1. Thealkaline sol was diluted to 5% SiO2 before the filter value test to get a comparable value to theproduced sol.
Table A.1: The starting material for every sol synthesis: sodium silicate and an alkaline sol used as heel.
Sodium silicate Heel solDensity (g/cm3) 1.0605 1.2976SiO2 content (%) 5.67 40.12pH 11.57 9.90Conductivity (µS/cm) 22300 5370Turbidity (NTU) 0.72 20.3Viscosity (cP) 1.57 15.9SSA (m2/g) - 226.1Filter value, diluted to 5% (ml) - 300
A.2 Silicic acid
The result of the characterisation for each batch of silicic acid is found in tables A.2-A.3.
i

Table A.2: Result of the characterisation of the silicic acid.
Density (g/cm3) SiO2 conc. (%) pH Conductivity (µS/cm)1 1.0326 5.68 2.56 8122 1.0303 5.32 2.61 8823 1.0325 5.67 2.58 8634 1.0323 5.64 2.67 8915 1.0303 5.32 2.68 8026 1.0324 5.65 2.71 8147 1.0332 5.78 2.69 8588 1.0310 5.43 2.76 8119 1.0262 4.66 2.76 75210 1.0321 5.60 2.66 82611 1.0326 5.68 2.71 79612 1.0261 4.64 2.84 42213 1.0316 5.52 2.77 79214 1.0304 5.33 2.74 76315 1.0317 5.54 2.71 80916 1.0333 5.80 2.72 80817 1.0323 5.64 2.69 81118 1.0313 5.48 2.69 831
Table A.3: Characterisation of the silicic acid, continued.
Turbidity (NTU) Viscosity (cP) Filter value (ml) Age (h)1 0.81 1.44 545 02 0.57 1.40 615 03 0.90 1.43 204 04 0.98 1.38 575 05 1.32 1.53 515 20 + tank6 1.19 1.57 425 197 0.93 1.45 460 58 0.97 1.39 490 59 0.82 1.35 450 510 0.89 1.45 440 1511 1.10 1.46 380 1012 0.86 1.45 600 1913 1.12 1.46 305 1014 1.02 1.40 310 1015 1.23 1.48 340 1516 1.02 1.54 320 1517 1.06 1.51 280 1518 1.46 1.80 225 19
ii

A.3 Synthesis product
The result of the characterisation for each syntheses product is found in tables A.4-A.5.
Table A.4: Characterisation of the synthesis product.
Density (g/cm3) SiO2 conc. (%) pH Conductivity (µS/cm)1 1.0309 5.68 9.69 4432 1.0289 5.34 9.54 5183 1.0308 5.66 9.85 5084 1.0305 5.61 9.45 5145 1.0294 5.42 9.57 4656 1.0312 5.73 9.70 5467 1.0317 5.81 9.57 5078 1.0301 5.54 9.85 4679 1.0258 4.82 9.78 47610 1.0302 5.56 9.83 52411 1.0309 5.68 9.75 50512 1.0259 4.83 9.87 36513 1.0317 5.81 9.87 51614 1.0306 5.63 9.87 50415 1.0311 5.71 9.96 51216 1.0318 5.83 9.8 50617 1.0308 5.66 9.74 49718 1.0299 5.51 9.63 520
iii
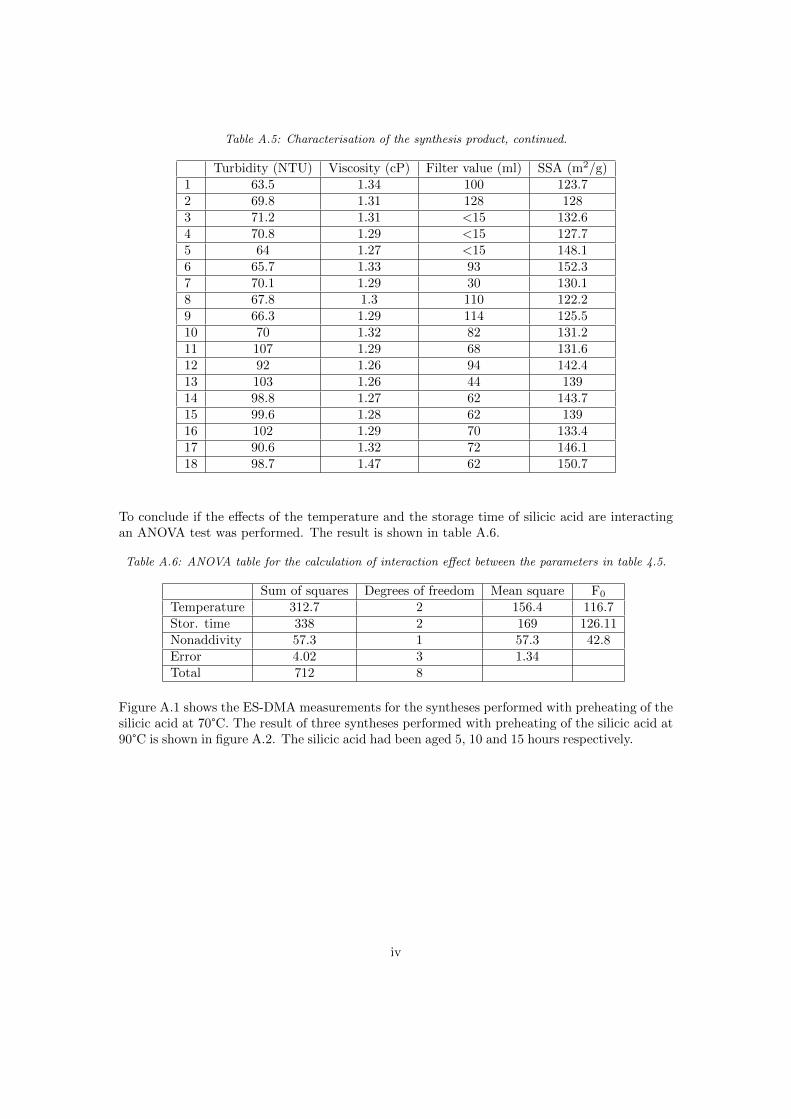
Table A.5: Characterisation of the synthesis product, continued.
Turbidity (NTU) Viscosity (cP) Filter value (ml) SSA (m2/g)1 63.5 1.34 100 123.72 69.8 1.31 128 1283 71.2 1.31 <15 132.64 70.8 1.29 <15 127.75 64 1.27 <15 148.16 65.7 1.33 93 152.37 70.1 1.29 30 130.18 67.8 1.3 110 122.29 66.3 1.29 114 125.510 70 1.32 82 131.211 107 1.29 68 131.612 92 1.26 94 142.413 103 1.26 44 13914 98.8 1.27 62 143.715 99.6 1.28 62 13916 102 1.29 70 133.417 90.6 1.32 72 146.118 98.7 1.47 62 150.7
To conclude if the effects of the temperature and the storage time of silicic acid are interactingan ANOVA test was performed. The result is shown in table A.6.
Table A.6: ANOVA table for the calculation of interaction effect between the parameters in table 4.5.
Sum of squares Degrees of freedom Mean square F0
Temperature 312.7 2 156.4 116.7Stor. time 338 2 169 126.11Nonaddivity 57.3 1 57.3 42.8Error 4.02 3 1.34Total 712 8
Figure A.1 shows the ES-DMA measurements for the syntheses performed with preheating of thesilicic acid at 70°C. The result of three syntheses performed with preheating of the silicic acid at90°C is shown in figure A.2. The silicic acid had been aged 5, 10 and 15 hours respectively.
iv

Mobility diameter [nm]
0.0
0.2
0.4
0.6
0.8
1.0
Res
pon
se
8: t=5, T=70
11: t=10, T=70
15: t=15, T=70
Figure A.1: The number weighted particle size distribution for synthesis product 8, 11 and 15 - all at thesame preheating temperature. The calculated bimodalities in % are: 0, 5, 11 respectively.
Mobility diameter [nm]
0.0
0.2
0.4
0.6
0.8
1.0
Res
pon
se
7: t=5, T=90
14: t=10, T=90
17: t=15, T=90
Figure A.2: The number weighted particle size distribution for synthesis product 7, 14 and 17 - all at thesame preheating temperature. The calculated bimodalities in % are: 6, 20, 29 respectively.
v